")
Back to Journals » Cancer Management and Research » Volume 11
HIF1α/miR-520a-3p/AKT1/mTOR Feedback Promotes The Proliferation And Glycolysis Of Gastric Cancer Cells
Received 16 July 2019
Accepted for publication 10 October 2019
Published 2 December 2019 Volume 2019:11 Pages 10145—10156
DOI https://doi.org/10.2147/CMAR.S223473
Checked for plagiarism Yes
Review by Single anonymous peer review
Peer reviewer comments 2
Editor who approved publication: Dr Eileen O'Reilly
Chen Pan,1,2 Qi Liu,2 Xiaoling Wu1
1Department of Gastroenterology, The Second Affiliated Hospital of Chongqing Medical University, Chongqing, People’s Republic of China; 2Department of Gastroenterology, The Affiliated Hospital of Guizhou Medical University, Guiyang, People’s Republic of China
Correspondence: Xiaoling Wu
Department of Gastroenterology, The Second Affiliated Hospital of Chongqing Medical University, Chongqing 400010, People’s Republic of China
Tel +86 189 8511 5661
Email [email protected]
Purpose: Various microRNAs are involved in the development of gastric cancer (GC). This study investigated the role and mechanism of miR-520a-3p in GC.
Method: Quantitative real-time fluorescence PCR (qRT-PCR) was applied to measure the expression level of miR-520a-3p in GC tissues and cell lines. The chi-squared test was employed to evaluate the relationship between the expression level of miR-520a-30p and clinical traits. The cell count kit-8 assay was used to detect the effect of miR-520a-3p on GC cell proliferation, while its effect on glycolysis was determined using the glucose assumption, lactate, and ATP production assay. The effect of miR-520a-3p on tumor growth in vivo was examined using a xenograft model. The relationship between miR-520a-30p and AKT1/mTOR/HIF1α pathway in normoxia and hypoxia was investigated using bioinformatics analysis, dual-luciferase reporter assay, qRT-PCR and Western blotting.
Results: The expression of miR-520a-3p was decreased in GC tissues and cell lines. The expression level of miR-520a-3p was negatively associated with various malignant biological properties in patients. Overexpression/inhibition of miR-520a-3p decreased/promoted cell proliferation and glycolysis in vitro. Overexpression of miR-520a-3p inhibited tumor growth in vivo. AKT1 is the functional target of MiR-520a-3p, which was decreased in miR-520a-3p-overexpressing cells. In addition, overexpression of miR-520a-3p decreased the protein level of AKT1, mTOR, HIF1α, and target genes of HIF1α such as Glut1 and VEGF. Restoration of the expression of AKT1 can decrease the inhibitory effect of miR-520a-3p on the AKT1/mTOR/HIF1α pathway, as well as cell proliferation and glycolysis. Furthermore, the level of miR-520a-3p was decreased, while that of AKT1 was increased under hypoxia. Notably, inhibition of HIF1α or overexpression of miR-520a-3p suppressed these effects.
Conclusion: Our study provided the first evidence for the existence of HIF1α/miR-520a-3p/AKT1/mTOR feedback, which promotes the proliferation and glycolysis of GC cells, highlighting a potential novel target for treatment.
Keywords: gastric cancer, miR-520a-3p, AKT/mTOR/HIF1α pathway, glycolysis
Introduction
Gastric cancer (GC) is the fifth most common malignancy and the third leading cause of cancer-related death worldwide.1 For most patients suffered from GC, tumor-associated distant metastases may occur while diagnosed not promptly.2 Therefore, the identification of novel biomarkers or effective therapeutic targets for the diagnosis and therapy of GC is urgently.
Unlike normal somatic cells, which utilize the mitochondrial oxidative phosphorylation to produce energy, cancer cells tend to use aerobic glycolysis to metabolize glucose even in environments containing sufficient levels of oxygen.3,4 This phenomenon, termed the Warburg effect, was first reported by Warburg Otto. AKT serine/threonine kinase 1/mechanistic target of rapamycin/hypoxia- inducible factor 1-alpha (AKT1/mTOR/HIF1α) is one of key pathways regulating cell glycolysis, as well as promoting cell proliferation and metastasis.5,6 This pathway enhances the expression of glucose transporter 1 (Glut1), a target gene of HIF1α, to increase the uptake of glucose and production of lactate.7
The microRNAs (miRNAs) are a class of non-coding RNAs (approximately 22 nucleotides long), which participate in various biological functions of cells, such as cell proliferation, migration, and differentiation.8 Moreover, according to previous research studies, miRNAs play an important role in the development of GC by inducing cell proliferation, metastasis, etc. For example, Yang et al found that miR-125a inhibits GC cell migration by suppressing the expression of signal transducer and activator of transcription 3.9 Li et al demonstrated that miR-503 was reduced in GC tissues and its expression level was positively associated with overall survival rate in patients suffering from GC.10 Meng et al found that miR-93-5p activated the Hippo signaling pathway and promoted the proliferation and migration of GC cells.11 Furthermore, Chen et al indicated that miR-421 was an effective biomarker for the diagnosis of GC.12 The biological function of miR-520a-3p has been investigated in various types of cancer (eg, non-small cell lung cancer13 and colorectal cancer14), and is regarded as tumor-suppressive miRNA. However, knowledge regarding the biological function of miR-520a-3p in GC, as well as its relationship with glycolysis, is currently limited.
The purpose of the present study was to determine the biological function of miR-520a-3p in regulating the proliferation and glycolysis of GC cells, as well as latent molecular mechanisms. The findings of this study may be useful for the diagnosis and treatment of GC.
Materials And Methods
Clinical Specimens
A total of 90 pairs of GC tissues and corresponding adjacent non-tumor tissues were obtained from patients who underwent surgery at The Affiliated Hospital of Guizhou Medical University, (Guiyang, China). The specimens were reviewed by a pathologist and histologically confirmed to be GC or non-tumor tissues. The study was approved by the Ethics Committee of Guizhou Medical University and performed in accordance with the tenets of the Declaration of Helsinki. All patients from whom samples were obtained provided written informed consent.
Cell Culture And Transfection
The gastric epithelial cell line GES-1 and five GC cell lines (ie, AGS, MKN-28, MKN-45, BGC-823, and SGC-7901) were purchased from the Type Culture Collection of the Chinese Academy of Sciences (Shanghai, China). The cells were cultured in RPMI-1640 medium (Gibco, Grand Island, New York, USA) contain 10% fetal bovine serum (Gibco) at 37°C, in a humidified environment with 5% CO2. Human miR-520a-3p overexpression lentiviruses (LV-miR-520a-3p) and its corresponding negative control (NC) lentiviruses were obtained from Genechem (Shanghai, China). MiR-520a-3p inhibitor (UUUCACGAAGGGAAACCUGACA) and corresponding NC inhibitor were obtained from Sangon Biotech (Shanghai, China). All transfection procedures were performed according to the protocols provided by the manufacturers.
Quantitative Real-Time Fluorescence PCR
Total RNA was extracted from GC tissues or cells using the TRIzol reagent (Yeasen Biotechnology, Shanghai, China) based on the instructions provided by the manufacturer. The RNA was reversely transcribed into cDNA using the 1st strand cDNA Synthesis Kit (Yeasen Biotechnology). For the reverse transcription of miRNAs, the cDNA was synthesized using the miRNA 1st strand cDNA Synthesis Kit (GeneCopoeia, Wuhan, China). The qRT-PCR was performed using SYBR Green Master Mix (Yeasen Biotechnology). β-actin was used as internal reference. The primers for the target genes were as follows: AKT1 forward: AGCGACGTGGCTATTGTGAAG, reverse: GCCATCATTCTTGAGGAGGAAGT; β-actin forward: CATGTACGTTGCTATCCAGGC; reverse: CTCCTTAATGTCACGCACGAT; miR-520a-3p forward: GCCACCACCATCAGCCATAC; reverse: GCACATTACTCTACTCAGAAGGG.
Cell Count Kit-8 (CCK-8) Assay
Cells were seeded in a 96-well plate at a density of 2×10³. After culture for 24, 48, 72, and 96 h, 10 μL of CCK-8 reagent (Boster, Wuhan, China) was injected, and the cells were further cultured for another 24 h. Finally, the optical density in each well was detected at a wavelength of 450 nm.
Detection Of Extracellular Acidification Rate (ECAR) And Cellular Oxygen Consumption Rate (OCR)
The XFe Extracellular Flux Analyzer (Seahorse Bioscience, Billericay, Massachusetts, USA) was employed to detect the ECAR and OCR. The ECAR was detected using the XF Glycolysis Stress Test Kit (Seahorse Bioscience), while OCR was detected using XF Cell Mito Stress Test Kit. Cells were seeded in a matched microplate at a density of 1×10⁴. In the detection of the ECAR, after performing a measurement at baseline, glucose, oligomycin (an inhibitor of oxidative phosphorylation; Selleck, Wuhan, China), and 2-deoxyglucose (an inhibitor of glycolysis; Selleck) were added to each well at specific time points. In the detection of the OCR, oligomycin, FCCP (a reversible inhibitor of oxidative phosphorylation; Selleck), and rotenone (an inhibitor of mitochondrial complex I; Selleck) plus antimycin A (an inhibitor of mitochondrial complex III; Selleck) were added in the proper order. The data were collected and analyzed using the XF-96 wave software(Seahorse Bioscience). All data were normalized based on the concentration of protein.
Measurement Of Glucose Uptake, Lactate Production And Adenosine Triphosphate (ATP) Synthesis
For the glucose uptake assay, the Glucose Uptake Colorimetric Assay kit was employed (Invitrogen, USA). A total of 2000 cells were seeded in a 96-well plate and treated with Krebs-Ringer-Phosphate-HEPES buffer containing 2% bovine serum albumin (Servicebio, Wuhan, China) for 40 min. Subsequently, 10 mL of 2-deoxyglucose (10 mM) was added to each well. After culture for 20 min, the rate of glucose uptake was measured. For the measurement of lactate production and ATP synthesis, the Lactate Assay Kit II (Invitrogen) and ATP Assay kit (Invitrogen) were used, respectively. A total of 2×10⁶ cells were lysed in 100 μl of the corresponding assay buffer and homogenized. Following centrifugation, the soluble fraction was assayed.
Tumor Xenograft
BALB/c nude mice (female; n=10) aged 4 weeks (weighing ~17 g) were purchased from the Beijing Huafukang Technology Co. Ltd. (Beijing, China). MiR-520a-3p-overexpressing AGS cells and normal control cells were injected into subcutaneous tissues of the right upper flank of mice. The volume of tumor tissue was measured once per week. After 5 weeks, all mice were sacrificed and the weights of their tumors were measured. All animal experiments were approved by the Ethics Committee of Guizhou Medical University and was performed in compliance with the National Institutes of Health Guide for the Care and Use of Laboratory Animals.
Immunohistochemistry
The tissues were fixed, dehydrated, embedded in paraffin (Servicebio), and cut into 4-µm specimens. Subsequently, the specimens were deparaffinized using xylene and rehydrated with graded alcohols. After restoration with sodium citrate and blocking using hydrogen peroxide and bovine serum albumin (Servicebio), the specimens were incubated with the primary antibodies, including KI67, proliferating cell nuclear antigen (PCNA), AKT1, mTOR, HIF1α, vascular endothelial growth factor (VEGF), and Glut1 (Proteintech, Wuhan, China) for 12 h at 4°C. Subsequently, the sections were immunohistochemically stained with horseradish peroxidase-conjugated secondary antibodies (Servicebio) for 2 h at room temperature. After incubation with the Cell and Tissue Staining HRP-DAB Kit (Servicebio), and orthophotomicroscope (Olympus, Japan) was used to capture the images.
Luciferase Reporter Assay
Firstly, online databases were used to predict AKT1 as a target of miR-520a-3p. Next, the luciferase reporter assay was performed with wild type (Wt) and a mutant (Mut) type 3ʹ-untranslated region of AKT1 plasmid, which contains potential binding sites of miR-520a-3p. The plasmid used in the assay was synthesized and sub-cloned into the psiCHECK-2 luciferase reporter vector (Promega Corporation, USA). After culture for 24 h, AGS and MKN-28 cells were co-transfected with the Wt/Mut type AKT1 luciferase reporter vector, miR-520a-3p mimic, and negative control. Finally, the Dual-Luciferase Reporter Assay System (Promega Corporation) was employed to measure the luciferase activity. Lipo2000 (Invitrogen) was used throughout the entire process of transient transfection.
Western Blotting
Cells were collected and lysed using the RIPA regent (Servicebio). The protein concentration in each sample was detected using the BCA kit (Servicebio). Protein samples were separated using 10% sodium dodecyl sulfate-polyacrylamide gel electrophoresis under 90 V voltage, and proteins were transferred onto a PVDF membrane (Millipore, USA). After blocking the membranes with tris-buffered saline and Tween 20 containing 5% skim milk at atmospheric temperature for 2 h, the membranes were incubated with primary antibodies (eg, AKT1, mTOR, HIF1α, Glut1, VEGF, and β-actin) (Proteintech, Wuhan, China) at 1:1,000 dilution for 16 h at 4°C. After washing with tris-buffered saline and Tween 20 to remove free antibodies, the membranes were incubated with the secondary antibodies at 1:3,000 dilution for 2 h at room temperature. Finally, the signals were detected using the Photoshop Image Analysis software CS3 (Adobe Systems, USA).
Statistical Analysis
All statistical analyses in the present study were performed using the SPSS version 21.0 software (IBM Corp., Armonk, NY, USA). Comparisons between two groups were conducted using the twin tailed Student’s t-test. Comparisons between multiple groups were performed using one-way analysis of variance. A P<0.05 denoted statistical significance.
Results
MiR-520a-3p Was Downregulated In Gastric Cancer Tissues And Cell Lines
We measured the expression level of miR-520a-3p in GC tissues and cell lines using qRT-PCR to determine whether miR-520a-3p participated in the development of GC. The results indicated that the expression level of miR-520a-3p was decreased in GC tissues (n=90) compared with adjacent non-tumor tissues (n=90) (P<0.01) (Figure 1A). Similarly, the expression level of miR-520a-3p was lower in the GC tissues provided by patients with stage III–IV disease (TNM staging) than in those provided by patients with stage I–II disease (P<0.01) (Figure 1B). Next, we detected the expression level of miR-520a-3p in the gastric epithelial cell line GES-1 and five GC cell lines, namely AGS, MKN-28, MKN-45, BGC-823, and SGC-7901. Our results indicated that miR-520a-3p was decreased in GC cell lines (P<0.01) (Figure 1C). We analyzed the relationship between expression and patient outcome. The results showed that the expression level of miR-520a-3p was positively associated with favorable patient prognosis (P=0.03) (Figure 1D). Furthermore, the chi-squared test was performed to detect the relationship between the expression level of miR-520a-30p and clinical traits. The expression level of miR-520a-3p was negatively associated with the TNM stage, lymph node metastasis, distant metastasis, and local invasion (List 1). Therefore, we speculated that miR-520a-3p may be a tumor-suppressive miRNA in the development of GC.
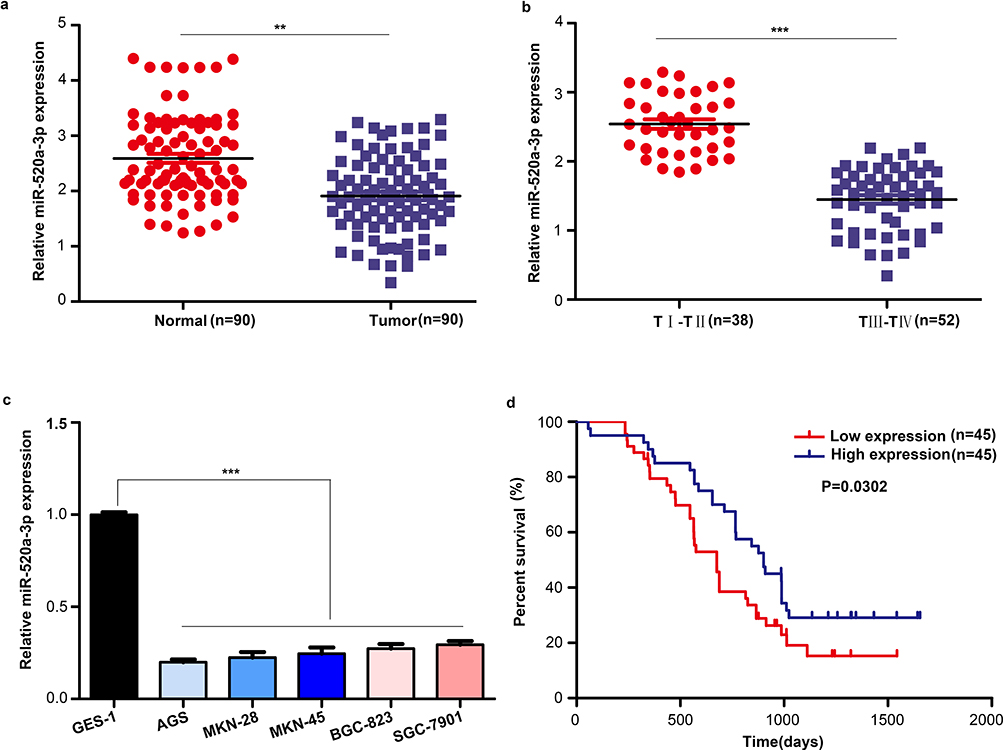 |
Figure 1 miR-520a-3p was significantly downregulated in GC. (A) The expression of miR-520a-3p was detected in GC tissues (n=90) compared with adjacent non-tumor tissues (n=90) using qRT–PCR. (B) The expression of miR-520a-3p was detected in GC tissues provided by patients with different stages of disease (TNM staging) using qRT-PCR. (C) The expression of miR-520a-3p in the gastric epithelial cell line GES-1 and five GC cell lines (ie, AGS, MKN-28, MKN-45, BGC-823, and SGC-7901) was detected using qRT–PCR. (D) Kaplan–Meier curve showing the survival in patients with GC divided according to the expression of miR-520a-3p. Patients were classified into low (red) and high expression (blue) group according to the median of miR-520a-3p expression. **P<0.01; ***P<0.001. Abbreviations: GC, gastric cancer; TNM, tumor-nodes-metastasis; qRT-PCR, Quantitative real-time fluorescence PCR. |
Overexpression Of MiR-520a-3p Inhibited Cell Proliferation And Glycolysis In Vitro
GC cell lines AGS and MKN-28 were stably transfected with miR-520a-3p overexpression (LV-miR-520a-3p) and NC lentiviruses to examine the biological function of miR-520a-3p in GC cells (Figure 2A). The results of the CCK-8 assay indicated that overexpression of miR-520a-3p inhibited the proliferation rate of GC cells (P<0.05) (Figure 2B). Since the Warburg effect is involved in the progression of GC, the effect of miR-520a-3p on cell glycolysis was detected. For the ECAR analysis, the maximal ECAR was decreased in the miR-520a-3p-overexpressing group (P<0.05) (Figure 2C). Similarly, the OCR analysis indicated that overexpression of miR-520a-3p increased the consumption of oxygen in GC cells (P<0.05) (Figure 2D). In addition, the rate of glucose uptake, lactate production, and ATP synthesis were significantly decreased in AGS and MKN-28 cells overexpressing miR-520a-3p (P<0.05) (Figure 2E–G). Collectively, miR-520a-3p can inhibit the proliferation and glycolysis of GC cells in vitro.
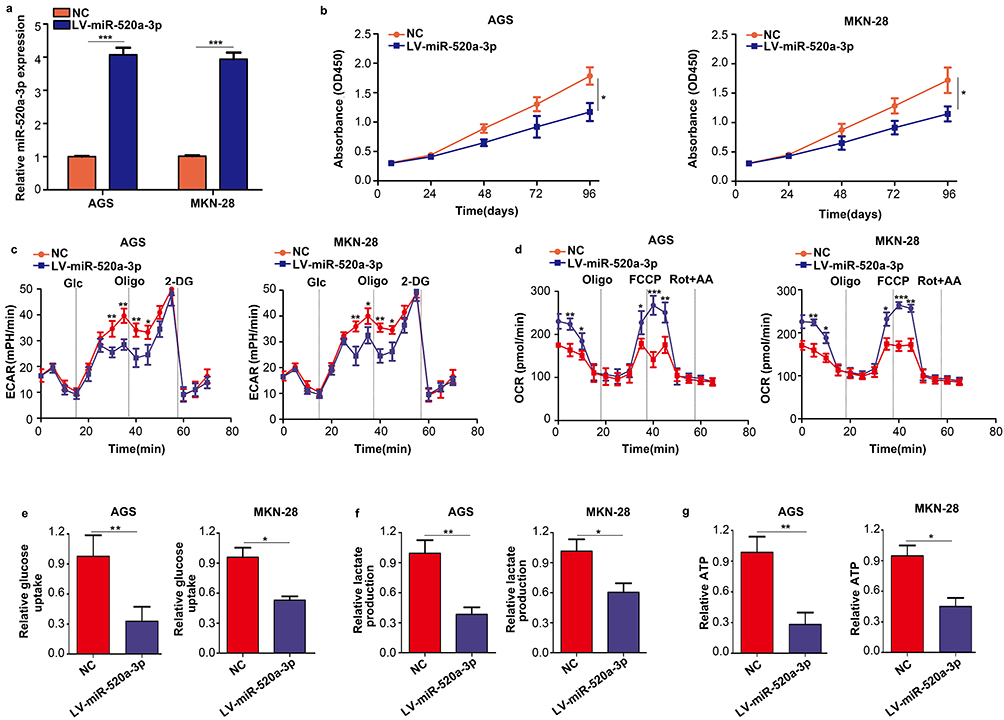 |
Figure 2 Overexpression of miR-520a-3p repressed the proliferation and glycolysis of GC cells in vitro. (A) qRT-PCR was used to detect the transfection efficiency of miR-520a-3p overexpression (LV-miR-520a-3p) and negative control lentiviruses (NC). (B) The effect of miR-520a-3p overexpression on the proliferation of GC cells was detected using the CCK-8 assay. (C, D) The ECAR and OCR of AGS and MKN-28 cells stably overexpressing miR-520a-3p or NC were measured using a Seahorse Bioscience XFp analyzer. (E–G) Glucose uptake, lactate production, and ATP synthesis were measured in AGS and MKN-28 cells stably overexpressing miR-520a-3p or NC. The data were normalized to protein concentrations. *P<0.05; **P<0.01; ***P<0.001. Abbreviations: GC, gastric cancer; qRT-PCR, Quantitative real-time fluorescence PCR; CCK8, cell count kit-8; ECAR, extracellular acidification rate; OCR, cellular oxygen consumption rate; ATP, adenosine triphosphate. |
Inhibition Of miR-520a-3p Promoted Cell Proliferation And Glycolysis In Vitro
We subsequently used a miR-520a-3p inhibitor to inhibit the expression of miR-520a-3p in GC cells (P<0.05) (Figure 3A). The results of the CCK-8 assays showed that inhibition of miR-520a-3p promoted the proliferation of GC cells (P<0.05) (Figure 3B). Moreover, suppression of miR-520a-3p increased the ECAR and decreased the OCR of GC cells (P<0.05) (Figure 3C and D). In addition, the decreased expression of miR-520a-3p significantly promoted the rate of glucose uptake, lactate production, and ATP synthesis in AGS and MKN-28 cells (P<0.05) (Figure 3E and F). In general, inhibition of miR-520a-3p promoted cell proliferation and glycolysis of GC cells in vitro.
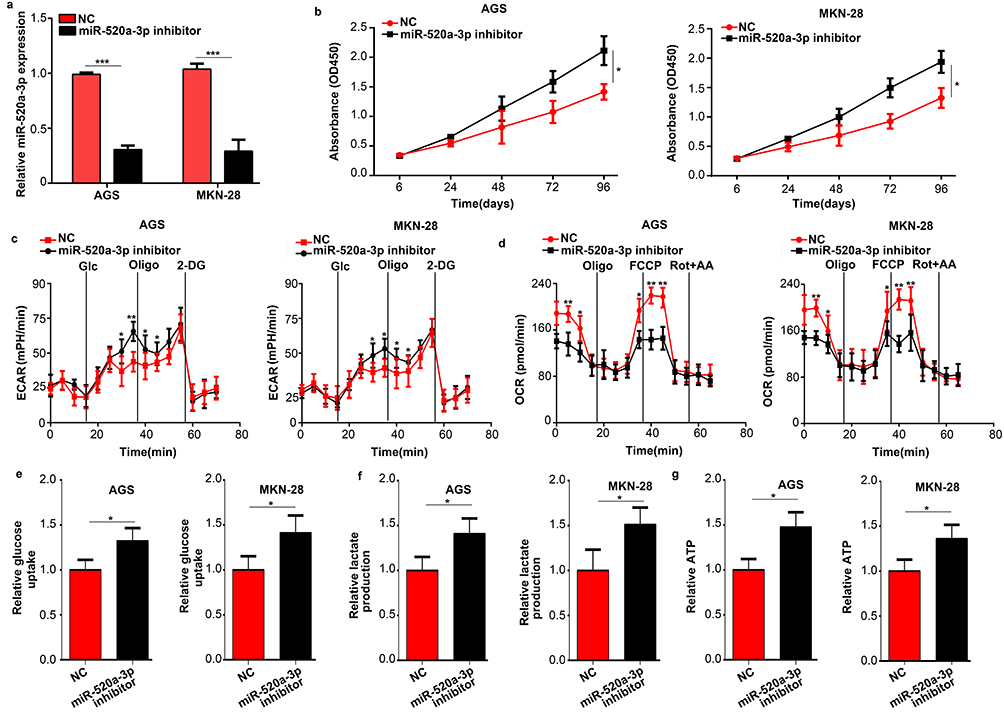 |
Figure 3 Inhibition of miR-520a-3p promoted the proliferation and glycolysis of GC cells in vitro. (A) qRT-PCR was used to detect the efficiency of the miR-520a-3p inhibitor and negative control. (B) The effect of miR-520a-3p inhibition on the proliferation of GC cells was detected using the CCK-8 assay. (C, D) The ECAR and OCR in AGS and MKN-28 cells treated with the miR-520a-3p inhibitor or NC were measured using a Seahorse Bioscience XFp analyzer. (E–G) Glucose uptake, lactate production, and ATP synthesis were measured in AGS and MKN-28 cells treated with the miR-520a-3p inhibitor or NC. The data were normalized to protein concentrations. *P<0.05; **P<0.01; ***P<0.001. Abbreviations: GC, gastric cancer; qRT-PCR, Quantitative real-time fluorescence PCR; ECAR, extracellular acidification rate; OCR, cellular oxygen consumption rate; ATP, adenosine triphosphate. |
Overexpression Of MiR-520a-3p Inhibited Tumor Growth In Vivo
The effect of miR-520a-3p on GC tumor growth in vivo was also determined in the present study. AGS cells stably expressing miR-520a-3p or miR-NC were injected into the subcutaneous tissues of nude mice, and tumor growth was monitored for 5 weeks. The results revealed that tumors derived from miR-520a-3p-overexpressing AGS cells grew significantly slower and were smaller compared with those derived from miR-NC-expressing cells (Figure 4A–C). In addition, the weight of mice slowly decreased in the miR-520a-3p overexpression group (Figure 4D). Furthermore, miR-520a-3p-overexpressing tumors excised after 5 weeks contained markedly lower levels of KI67 and PCNA proteins compared with the miR-NC-expressing tumors, as demonstrated through immunohistochemistry (Figure 4E and F). These results demonstrated that miR-520a-3p significantly inhibited GC tumor growth in vivo.
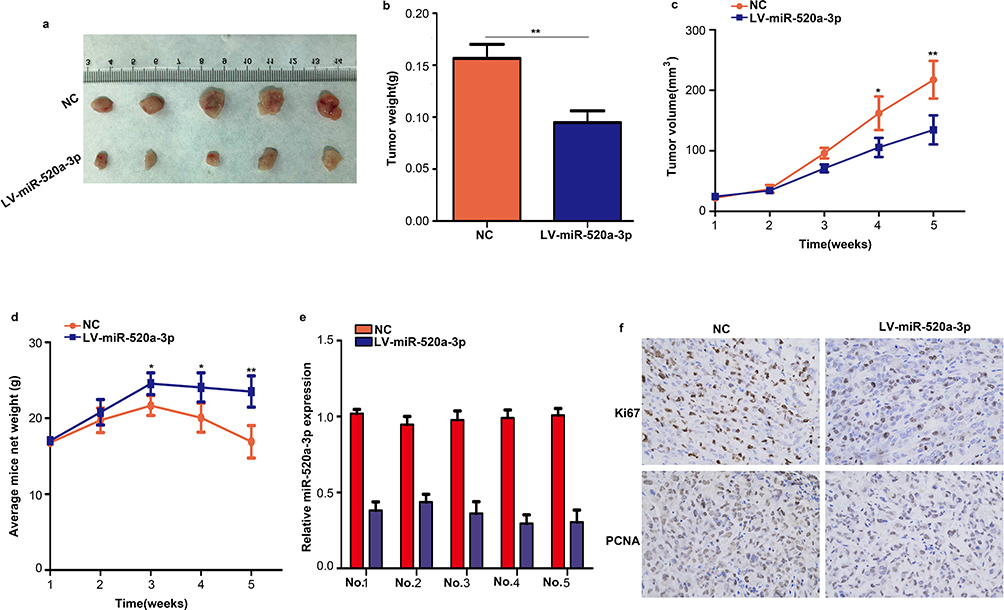 |
Figure 4 Overexpression of miR-520a-3p inhibited tumor growth in vivo. (A) Representative images of subcutaneous tumors of the miR-520a-3p overexpression group and control group. (B) The weight of tumor tissues in the miR-520a-3p overexpression group and control group. (C) AGS cells stably expressing miR-520a-3p or miR-NC were injected into the subcutaneous tissues of nude mice, and tumor growth was monitored for 5 weeks. (D) The weight of mice in the miR-520a-3p overexpression and miR-NC group was detected each week. (E) qRT-PCR assays showing the expression of miR-520a-3p in transplanted tumors in mice with specific number. (F) The expression of KI67 and PCNA in miR-520a-3p-overexpressing tumors and control tumors was detected through immunohistochemical staining (400×). *P<0.05; **P<0.01. Abbreviations: qRT-PCR, Quantitative real-time fluorescence PCR; KI67, marker of proliferation Ki-67; PCNA, proliferating cell nuclear antigen. |
MiR-520a-3p Regulated The AKT1/mTOR/HIF1α Pathway In GC
The online tool Targetscan was used to uncover the molecular mechanism of miR-520a-3p. This approach predicted AKT1 as the target of miR-520a-3p (Figure 5A). To determine whether miR-520a-3p can directly bind to AKT1, we cloned the 3ʹuntranslated region of AKT1, either Wt or Mut in the putative binding site of miR-520a-3p into a luciferase reporter vector. This was subsequently transfected into AGS and MKN-28 cells together with miR-520a-3p or miR-NC. The results indicated that co-transfection with miR-520a-3p decreased the luciferase activity driven by AKT1-Wt, but not by AKT1-Mut (Figure 5B). Furthermore, we demonstrated that the expression of AKT1 was negatively associated with miR-520a-3p (R=0.597; P<0.01) (Figure 5C). Having identified that AKT1 is an upstream protein of AKT1/mTOR/HIF1α, we measured the expression levels of AKT1, mTOR, HIF1α, and two target genes of HIF1α (ie, Glut1 and VEGF). The results of the Western blotting analysis showed that the levels of all these proteins were decreased in miR-520a-3p-overexpressing GC cells (Figure 5D). Furthermore, we found that the expression of AKT1, HIF1a, mTOR, Glut1, and VEGF was decreased in GC tissues, whereas that of miR-520a-3p was upregulated (Figure 5E). Therefore, we suggested that miR-520a-3p regulated the AKT1/mTOR/HIF1α pathway in GC.
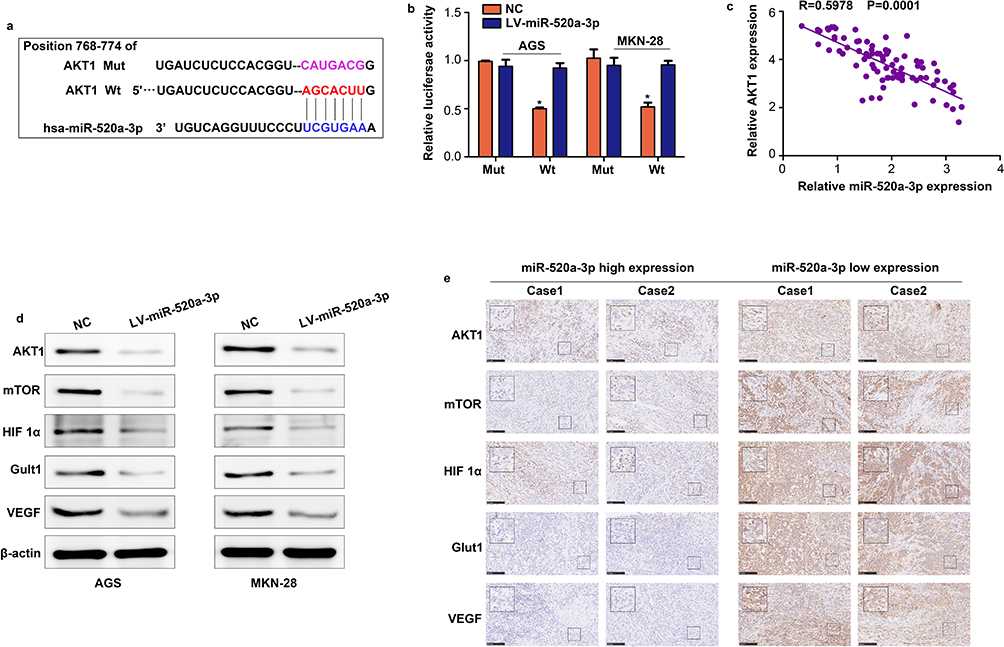 |
Figure 5 AKT1 is a vital target of miR-520a-3p in GC. (A) miR-520a-3p may bind to the 3ʹ-UTR of AKT1 mRNA. (B) miR-520a-3p mimics inhibited the luciferase activity in GC cells, while mutation of the associating element in 3′-UTR of AKT1 mRNA abolished the effect of the miR-520a-3p mimic on luciferase activity. (C) The expression of miR-520a-3p was inversely associated with that of AKT1 in GC tissues. (D) Western blotting was used to detect the expression of AKT1, mTOR, HIF1α, VEGF, and Glut1 in the miR-520a-3p-overexpressing group and control group. (E) The expression of AKT1, mTOR, HIF1α, VEGF, and Glut1 in miR-520a-3p high and low expression GC tissues (200× and 400×). *P<0.05. Abbreviations: AKT1, AKT serine/threonine kinase 1; GC, gastric cancer; 3ʹ-UTR, 3ʹuntranslated region; mTOR, mechanistic target of rapamycin kinase; HIF1α, hypoxia inducible factor 1 subunit alpha; VEGF, vascular endothelial growth factor; Glut1, Glucose transporter 1; ECAR, extracellular acidification rate; OCR, cellular oxygen consumption rate; ATP, adenosine triphosphate. |
Restoration Of AKT1 Decreased The Inhibitory Effect Of miR-520a-3p
To illustrate whether AKT1 was involved in the inhibitory effect of miR-520a-3p on proliferation and glycolysis, we restored AKT1 in miR-520a-3p-overexpressing cells. The results demonstrated that restoration of AKT1 decreased the inhibitory effect of miR-520a-3p on the AKT1/mTOR/HIF1α pathway (Figure 6A). In addition, the CCK-8 assays showed that restoration of AKT1 decreased the inhibitory effect of miR-520a-3p on cell proliferation (Figure 6B). Furthermore, the metabolic measurement assays showed that the inhibitory effect of miR-520a-3p on glycolysis was decreased, whereas the expression of AKT1 was increased (Figure 6C–G).
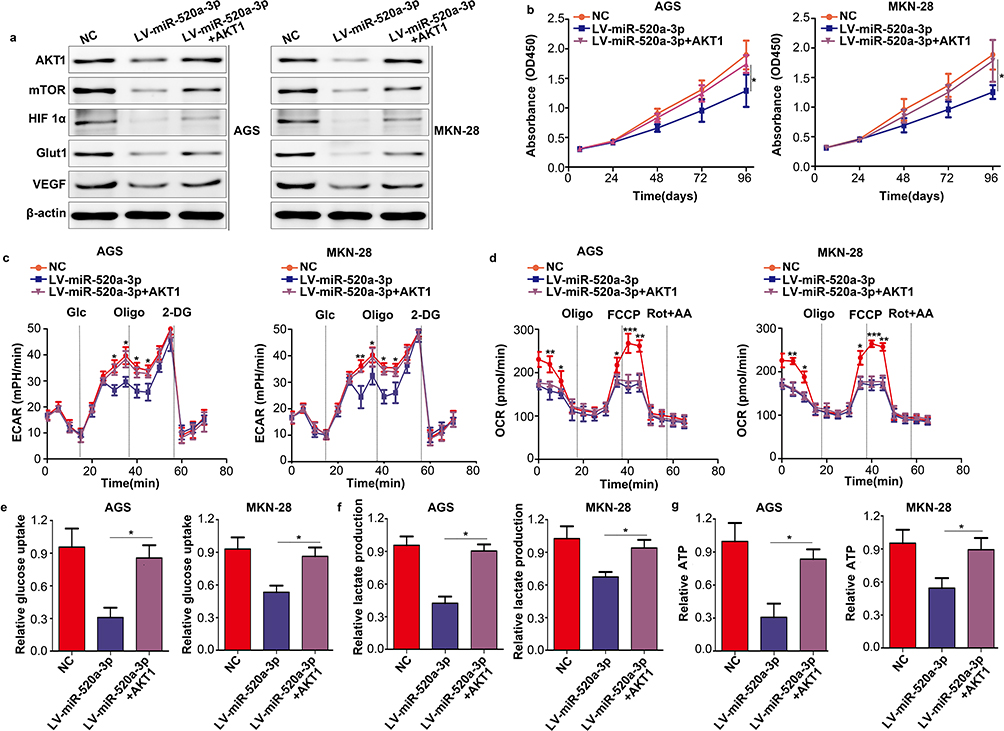 |
Figure 6 Restoration of AKT1 decreased the inhibitory effect of miR-520a-3p. According to the treatment factor, AGS and MKN-28 cells were divided into three groups: NC group, miR-520a-3p-overexpressing group, and miR-520a-3p plus AKT1-overexpressing group. (A) The expression of AKT1, mTOR, HIF1α, VEGF, and Glut1 was detected using Western blotting. (B) CCK8 assays were used to detect the proliferation ability of each group. (C, D) The ECAR and OCR of each group were measured using a Seahorse Bioscience XFp analyzer. (E–G) Glucose uptake, lactate production, and ATP synthesis were measured in each group. The data were normalized to protein concentrations. *P<0.05; **P<0.01; ***P<0.001. Abbreviations: AKT1, AKT serine/threonine kinase 1; mTOR, mechanistic target of rapamycin kinase; HIF1α, hypoxia inducible factor 1 subunit alpha; VEGF, vascular endothelial growth factor; Glut1, Glucose transporter 1; CCK8, cell count kit-8; ECAR, extracellular acidification rate; OCR, cellular oxygen consumption rate; ATP, adenosine triphosphate. |
MiR-520a-3p/AKT1 Was Regulated By HIF1α Under Hypoxia
Previous studies have shown that various miRNAs are regulated by the tumor microenvironment, including hypoxia. Therefore, we investigated the expression of miR-520a-3p under hypoxia. The results verified that the expression of miR-520a-3p was decreased under hypoxia in both MGS and MKN-28 cells (P<0.05) (Figure 7A). In addition, we showed that the expression of AKT1 was significantly increased under hypoxia (Figure 7B). Treatment of MGS and MKN-28 cells with LW6 (an inhibitor of HIF1a) under hypoxia can block the inhibitory effect of hypoxia on miR-520a-3p (P<0.05) (Figure 7C). Similarly, overexpression of miR-520a-3p can block the stimulative effect of hypoxia on the expression of AKT1 (P<0.05) (Figure 7D). These results demonstrate that the hypoxic environment regulated miR-520a-3p/AKT1 via HIF1a.
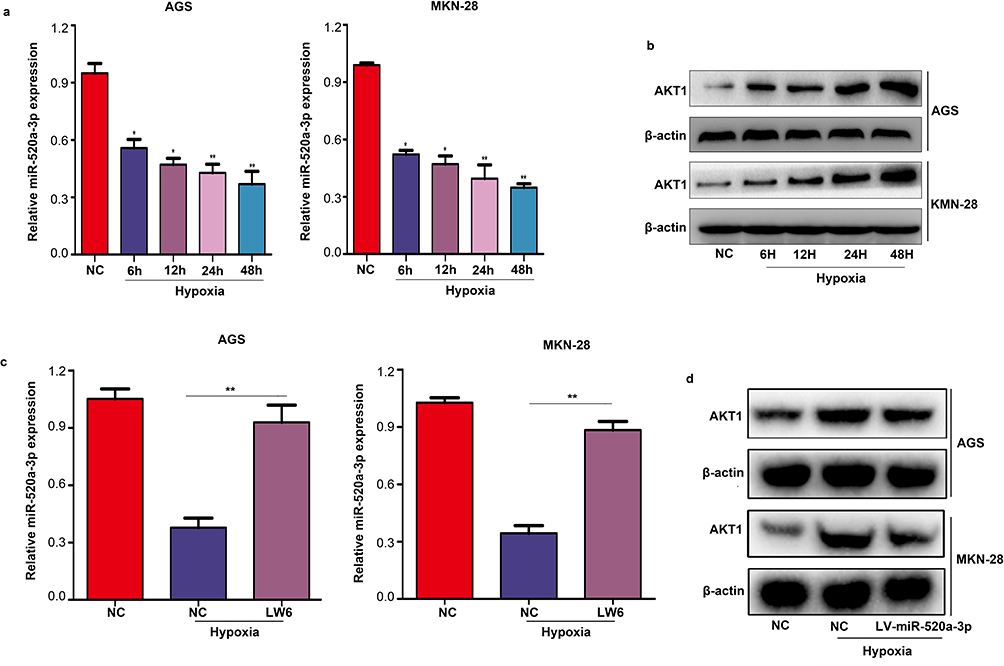 |
Figure 7 MiR-520a-3p/AKT1 was regulated by HIF1α under hypoxia. (A) qRT-PCR was used to detect the expression of miR-520-3p in AGS and MKN-28 cells under hypoxia. (B) Western blotting was used to detect the expression of AKT1 under hypoxia. (C) qRT-PCR were used to detect the expression of miR-520-3p in AGS and MKN-28 cells after treatment with LW6 (an inhibitor of HIF1α) under hypoxia. (D) Western blotting was used to detect the expression of AKT1 in the miR-520a-3p-overexpressing group under hypoxia. *P<0.05; **P<0.01. Abbreviations: AKT1, AKT serine/threonine kinase 1; HIF1α, hypoxia inducible factor 1 subunit alpha; qRT-PCR, Quantitative real-time fluorescence PCR. |
Discussion
Warburg effect plays a key role in the process of cell proliferation and metastasis of cancer cells. The latent mechanism of the Warburg effect in cancer cells was complicated due to the involvement of multiple genes and pathways.15–17 In addition, various studies showed that the changes of metabolism in tumor cells are usually driven by signaling from the tumor environment, such as hypoxia.18 Under hypoxia, cancer cells may adjust their gene expression and the metabolism `pattern to adapt to the environment, while HIFs are regarded as the most direct response elements of cells to hypoxia. HIF1, HIF2, and HIF3 are three members of the HIF gene family. HIF1α is an α subunit of HIF1, which can bind to the promoter or silencer of target genes, leading to change in gene expression.19 For example, by increasing the expression of several genes involved in glycolysis (eg, CA9 and Glut1), HIF1α promoted the Warburg effect in a series of cancer types.20,21 Furthermore, HIF1α has the capacity to regulate the expression of miRNAs, which also termed hypoxia-responsive miRNAs.22,23 However, miRNAs which cross-talked with hypoxia environment and Warburg effect was known limit. In the present study, we demonstrated that miR-520a-3p was a key regulator of Warburg effect in GC, as well as a hypoxia associated miRNA regulated by HIF1α.
In general, the role and molecular mechanism of miR-520a-3p have been investigated in various types of cancer. Lv et al demonstrated that miR-520a-3p was a tumor suppressor miRNA in non-small cell lung cancer and inhibited cell proliferation via the PI3K/AKT pathway.24 Li et al showed that miR-520a-3p was decreased in breast cancer tissues.25 Zhang et al demonstrated that inhibition of miR-520a-3p in osteosarcoma cells promoted cell proliferation and migration via the Janus kinase/signal transducer and activator of transcription pathway.26 Furthermore, Bi et al revealed that miR-520a-3p has the capacity to inhibit epithelial-mesenchymal transition and promotes apoptosis in papillary thyroid carcinoma cells.27 In addition, Qu et al showed that lidocaine inhibited the proliferation of colorectal cancer cells by upregulating the level of miR-520a-3p.28 Consistent with previous studies, we found that miR-520a-3p was decreased in GC tissues. The expression level of miR-520a-3p in patients with GC was positively associated with overall survival (months). Furthermore, the expression level of miR-520a-3p was negatively associated with TNM stage, lymph node metastasis, distant metastasis, and local invasion. Overexpression/inhibition of miR-520a-3p decreased/promoted the proliferation of GC cells and glycolysis. Therefore, we demonstrated that miR-520a-3p is a key regulator miRNA of Warburg effect and played as a tumor-suppressive role in GC.
Various studies showed that the AKT1/mTOR pathway is involved in glycolysis.29 In our study, we demonstrated that AKT1 is a key target of miR-520a-3p in GC; an increase in the expression of miR-520a-3p inhibited the AKT1/mTOR pathway. Based on the facts that HIF1α was a main regulator target gene of mTOR which was involved in cell glycolysis,30 we then detected the expression of HIF1α and its target genes, and found that the expression of HIF1α and its two target genes (ie, Glut1 and VEGF) were decreased, while that of miR-520a-3p was increased. Restoration of AKT1 can decrease the inhibitory effect of miR-520a-3p on cell proliferation and glycolysis, as well as the AKT1/mTOR//HIF1α pathway. This evidence demonstrated that miR-520a-3p inhibited the proliferation and glycolysis of GC cells by suppressing the AKT1/mTOR/HIF1α pathway.
Furthermore, we showed that miR-520a-3p was also a hypoxia-responsive miRNA regulated by HIF1α. Suppression of HIF1α can reverse the inhibitory effect of hypoxia on miR-520a-3p, while overexpression of miR-520a-3p blocks the stimulative effect of hypoxia on the expression of its target gene AKT1. Therefore, HIF1α/miR-520a-3p/AKT1/mTOR may form a positive feedback loop and contribute to the development of GC.
Conclusion
Collectively, the present results indicate that there is a HIF1α/miR-520a-3p/AKT1/mTOR positive feedback loop in GC. The HIF1α/miR-520a-3p/AKT1/mTOR feedback loop has the potential to improve the proliferation and glycolysis of GC cells. The present study demonstrated that target therapy for miR-520a-3p can block this feedback loop, and highlighted a potential strategy for the clinical treatment of GC.
Author Contributions
Chen Pan and Qi Liu contributed to acquisition of data, analysis and interpretation of data, while Xiaoling Wu contributed to conception and design. All authors took part in drafting manuscript, revising, giving final approval of the version to be published, and agreeing to be accountable for all aspects of the work.
Disclosure
The authors report no conflicts of interest in this work.
References
1. Takeda K, Kimura R, Nishigaki N, et al. Humoral hypercalcemia of malignancy with a parathyroid hormone-related peptide-secreting intrahepatic cholangiocarcinoma accompanied by a gastric cancer. Case Rep Endocrinol. 2017;2017:7012520. doi:10.1155/2017/7012520.
2. Li N, Zhang S, Luo Q, et al. The effect of dihydroartemisinin on the malignancy and epithelial-mesenchymal transition of gastric cancer cells. Curr Pharm Biotechnol. 2019;20:719–726. doi:10.2174/1389201020666190611124644
3. Zhou Q, Xu J, Liu M, et al. Warburg effect is involved in apelin-13-induced human aortic vascular smooth muscle cells proliferation. J Cell Physiol. 2019. doi:10.1002/jcp.28218
4. Mordhorst BR, Murphy SL, Ross RM, et al. Pharmacologic reprogramming designed to induce a warburg effect in porcine fetal fibroblasts alters gene expression and quantities of metabolites from conditioned media without increased cell proliferation. Cell Reprogram. 2018;20(1):38–48. doi:10.1089/cell.2017.0040
5. Wu H, Pan L, Gao C, et al. Quercetin inhibits the proliferation of glycolysis-addicted HCC cells by reducing hexokinase 2 and Akt-mTOR pathway. Molecules. 2019;24(10):1993. doi:10.3390/molecules24101993
6. Wei J, Wu J, Xu W, et al. Salvianolic acid B inhibits glycolysis in oral squamous cell carcinoma via targeting PI3K/AKT/HIF-1alpha signaling pathway. Cell Death Dis. 2018;9(6):599. doi:10.1038/s41419-018-0623-9
7. Xiao H, Wang J, Yan W, et al. GLUT1 regulates cell glycolysis and proliferation in prostate cancer. Prostate. 2018;78(2):86–94. doi:10.1002/pros.v78.2
8. Zhang Z, Dong Y, Hua J, et al. A five-miRNA signature predicts survival in gastric cancer using bioinformatics analysis. Gene. 2019;699:125–134. doi:10.1016/j.gene.2019.02.058
9. Yang L, Zhang S, Guo K, et al. miR-125a restrains cell migration and invasion by targeting STAT3 in gastric cancer cells. Onco Targets Ther. 2019;12:205–215. doi:10.2147/OTT.S168454
10. Li W, Li J, Mu H, Guo M, Deng H. MiR-503 suppresses cell proliferation and invasion of gastric cancer by targeting HMGA2 and inactivating WNT signaling pathway. Cancer Cell Int. 2019;19:164. doi:10.1186/s12935-019-0875-1
11. Meng H, Li YY, Han D, Zhang CY. MiRNA-93-5p promotes the biological progression of gastric cancer cells via Hippo signaling pathway. Eur Rev Med Pharmacol Sci. 2019;23(11):4763–4769. doi:10.26355/eurrev_201906_18058
12. Chen J, Wu L, Sun Y, et al. Mir-421 in plasma as a potential diagnostic biomarker for precancerous gastric lesions and early gastric cancer. PeerJ. 2019;7:e7002. doi:10.7717/peerj.7002
13. Liu Y, Lin X, Zhou S, Zhang P, Shao G, Yang Z. Long noncoding RNA HOXA-AS2 promotes non-small cell lung cancer progression by regulating miR-520a-3p. Biosci Rep. 2019;39(5):BSR20190283. doi:10.1042/BSR20190283
14. Zhang R, Liu R, Liu C, et al. A novel role for MiR-520a-3p in regulating EGFR expression in colorectal cancer. Cell Physiol Biochem. 2017;42(4):1559–1574. doi:10.1159/000479397
15. Luo P, Zhang C, Liao F, et al. Transcriptional positive cofactor 4 promotes breast cancer proliferation and metastasis through c-Myc mediated Warburg effect. Cell Commun Signal. 2019;17(1):36. doi:10.1186/s12964-019-0348-0
16. Dabral S, Muecke C, Valasarajan C, et al. A RASSF1A-HIF1alpha loop drives Warburg effect in cancer and pulmonary hypertension. Nat Commun. 2019;10(1):2130. doi:10.1038/s41467-019-10044-z
17. Nie ZY, Liu XJ, Zhan Y, et al. miR-140-5p induces cell apoptosis and decreases Warburg effect in chronic myeloid leukemia by targeting SIX1. Biosci Rep. 2019;39(4). doi:10.1042/BSR20190150.
18. Venter L, Loots DT, Mienie LJ, et al. Uncovering the metabolic response of abalone (Haliotis midae) to environmental hypoxia through metabolomics. Metabolomics. 2018;14(4):49. doi:10.1007/s11306-018-1346-8
19. Schito L, Semenza GL. Hypoxia-inducible factors: master regulators of cancer progression. Trends Cancer. 2016;2(12):758–770. doi:10.1016/j.trecan.2016.10.016
20. McDonald PC, Chafe SC, Brown WS, et al. Regulation of pH by carbonic anhydrase 9 mediates survival of pancreatic cancer cells with activated KRAS in response to hypoxia. Gastroenterology. 2019;157(3):823–837. doi:10.1053/j.gastro.2019.05.004
21. Sowa T, Menju T, Chen-Yoshikawa TF, et al. Hypoxia-inducible factor 1 promotes chemoresistance of lung cancer by inducing carbonic anhydrase IX expression. Cancer Med. 2017;6(1):288–297. doi:10.1002/cam4.991
22. Park JE, Dutta B, Tse SW, et al. Hypoxia-induced tumor exosomes promote M2-like macrophage polarization of infiltrating myeloid cells and microRNA-mediated metabolic shift. Oncogene. 2019;38(26):5158–5173. doi:10.1038/s41388-019-0782-x
23. Ullmann P, Nurmik M, Begaj R, Haan S, Letellier E. Hypoxia- and MicroRNA-induced metabolic reprogramming of tumor-initiating cells. Cells. 2019;8(6). doi:10.3390/cells8060528.
24. Lv X, Li CY, Han P, Xu XY. MicroRNA-520a-3p inhibits cell growth and metastasis of non-small cell lung cancer through PI3K/AKT/mTOR signaling pathway. Eur Rev Med Pharmacol Sci. 2018;22(8):2321–2327. doi:10.26355/eurrev_201804_14822
25. Li J, Wei J, Mei Z, et al. Suppressing role of miR-520a-3p in breast cancer through CCND1 and CD44. Am J Transl Res. 2017;9(1):146–154.
26. Zhang B, Yu L, Han N, et al. LINC01116 targets miR-520a-3p and affects IL6R to promote the proliferation and migration of osteosarcoma cells through the Jak-stat signaling pathway. Biomed Pharmacother. 2018;107:270–282. doi:10.1016/j.biopha.2018.07.119
27. Bi CL, Zhang YQ, Li B, Guo M, Fu YL. MicroRNA-520a-3p suppresses epithelial-mesenchymal transition, invasion, and migration of papillary thyroid carcinoma cells via the JAK1-mediated JAK/STAT signaling pathway. J Cell Physiol. 2019;234(4):4054–4067. doi:10.1002/jcp.27199
28. Qu X, Yang L, Shi Q, Wang X, Wang D, Wu G. Lidocaine inhibits proliferation and induces apoptosis in colorectal cancer cells by upregulating mir-520a-3p and targeting EGFR. Pathol Res Pract. 2018;214(12):1974–1979. doi:10.1016/j.prp.2018.09.012
29. Zhang X, Wang S, Wang H, et al. Circular RNA circNRIP1 acts as a microRNA-149-5p sponge to promote gastric cancer progression via the AKT1/mTOR pathway. Mol Cancer. 2019;18(1):20. doi:10.1186/s12943-018-0935-5
30. Xiao Y, Peng H, Hong C, et al. PDGF promotes the warburg effect in pulmonary arterial smooth muscle cells via activation of the PI3K/AKT/mTOR/HIF-1alpha signaling pathway. Cell Physiol Biochem. 2017;42(4):1603–1613. doi:10.1159/000479401
 © 2019 The Author(s). This work is published and licensed by Dove Medical Press Limited. The full terms of this license are available at https://www.dovepress.com/terms.php and incorporate the Creative Commons Attribution - Non Commercial (unported, v3.0) License.
By accessing the work you hereby accept the Terms. Non-commercial uses of the work are permitted without any further permission from Dove Medical Press Limited, provided the work is properly attributed. For permission for commercial use of this work, please see paragraphs 4.2 and 5 of our Terms.
© 2019 The Author(s). This work is published and licensed by Dove Medical Press Limited. The full terms of this license are available at https://www.dovepress.com/terms.php and incorporate the Creative Commons Attribution - Non Commercial (unported, v3.0) License.
By accessing the work you hereby accept the Terms. Non-commercial uses of the work are permitted without any further permission from Dove Medical Press Limited, provided the work is properly attributed. For permission for commercial use of this work, please see paragraphs 4.2 and 5 of our Terms.