")
Back to Journals » International Journal of Nanomedicine » Volume 15
Her2-Targeted Multifunctional Nano-Theranostic Platform Mediates Tumor Microenvironment Remodeling and Immune Activation for Breast Cancer Treatment
Authors Zheng D , Wan C, Yang H, Xu L, Dong Q, Du C, Du J , Li F
Received 10 July 2020
Accepted for publication 16 September 2020
Published 9 December 2020 Volume 2020:15 Pages 10007—10028
DOI https://doi.org/10.2147/IJN.S271213
Checked for plagiarism Yes
Review by Single anonymous peer review
Peer reviewer comments 2
Editor who approved publication: Professor Lei Yang
Dongdong Zheng,1,* Caifeng Wan,1,* Hong Yang,2 Li Xu,1 Qi Dong,1 Chengrun Du,3 Jing Du,1 Fenghua Li1
1Department of Ultrasound, Renji Hospital, School of Medicine, Shanghai Jiao Tong University, Shanghai, People’s Republic of China; 2College of Chemistry and Materials Science, Shanghai Normal University, Shanghai, People’s Republic of China; 3Department of Radiation Oncology, Fudan University Shanghai Cancer Center, Shanghai, People’s Republic of China
*These authors contributed equally to this work
Correspondence: Jing Du; Fenghua Li Email [email protected]; [email protected]
Purpose: The treatment of breast cancer is often ineffective due to the protection of the tumor microenvironment and the low immunogenicity of tumor cells, leading to a poor therapeutic effect. In this study, we designed a nano-theranostic platform for these obstacles: a photothermal effect mediated by a gold shell could remodel the tumor microenvironment by decreasing cancer-associated fibroblasts (CAFs) and promote the release of doxorubicin (DOX) from nanoparticles. In addition, it could realize photoacoustic (PA)/MRI dual-model imaging for diagnose breast cancer and targeted identification of Her2-positive breast cancer.
Methods: Her2-DOX-superparamagnetic iron oxide nanoparticles (SPIOs)@Poly (D, L-lactide-co-glycolide) acid (PLGA)@Au nanoparticles (Her2-DSG NPs) were prepared based on a single emulsion oil-in-water (O/W) solvent evaporation method, gold seed growing method, and carbon diimide method. The size distribution, morphology, PA/MRI imaging, drug loading capacity, and drug release were investigated. Cytotoxicity, antitumor effect, cellular uptake, immunogenic cell death (ICD) effect, and targeted performance on human Her2-positive BT474 cell line were investigated in vitro. BT474/Adr cells were constructed and the antitumor effect of NPs on it was evaluated in vitro. Moreover, chemical-photothermal therapy effect, PA/MRI dual-model imaging, ICD effect induced by NPs, and tumor microenvironment remodeling in human BT474 breast cancer nude mice model were also investigated.
Results: Nanoparticles were spherical, uniform in size and covered with a gold shell. NPs had a photothermal effect, and can realize photothermal-controlled drug release in vitro. Chemical-photothermal therapy had a good antitumor effect on BT474/Adr cells and on BT474 cells in vitro. The targeting evaluation in vitro showed that Her2-DSG NPs could actively target and identify Her2-positive tumor cells. The PA/MRI imaging was successfully validated in vitro/vivo. Similarly, NPs could enhance the ICD effect in vitro/vivo, which could activate an immune response. Immunofluorescence results also proved that photothermal effect could decrease CAFs to remodel the tumor microenvironment and enhance the accessibility of NPs to tumor cells. According to the toxicity results, targeted drug delivery combined with photothermal-responsive drug release proved that NPs had good biosafety in vivo. Chemical-photothermal therapy of Her2-targeted NPs has a good antitumor effect in the BT474 nude mice model.
Conclusion: Our study showed that chemical-photothermal therapy combined with tumor microenvironment remodeling and immune activation based on the Her2-DSG NPs we developed are very promising for Her2-positive breast cancer.
Keywords: tumor microenvironment remodeling, chemoimmunotherapy, photothermal effect, targeted nano-theranostic platform, dual-modal imaging
Introduction
The incidence of breast cancer is increasing, especially for Her2-positive breast cancer due to its poor prognosis and high mortality.1,2 Traditional treatments for breast cancer include surgery, chemotherapy and radiation. However, during the process of traditional treatment, patients experience harmful side effects, which limit their long-term application in clinical practice. These side effects often result in damage to normal tissues, a suppressing effect on the immune system3 and cancer cells’ resistance. In addition, the protection of tumor cells by the tumor microenvironment and the low immunogenicity of tumor cells are also obstacles to treatment. Numerous tumor cells, with low expression of immunogenic proteins,4,5 will rapidly multiply and grow into a solid tumor, not having been recognized by the immune system. Furthermore, the tumor microenvironment contains cancer-associated fibroblasts (CAFs),6 which play an important role in tumor progression and metastasis,7,8 in the formation of a tumor microenvironment, in tumor immunosuppression, and in the development of tumor cell resistance.9,10 Immunosuppression caused by the tumor microenvironment11–13 and low immunogenicity of cancer cells make immunotherapy less effective. Due to the abundance of CAFs in a tumor, meanwhile, nanoparticles passively accumulate in the tumor through blood vessels in a small fraction, usually less than 5%.14,15 This brings new obstacles to traditional treatments, nano-drug delivery therapy or immunotherapy.
Near-infrared photothermal therapy has been widely used in tumor treatment in recent years,16–18 since it has a precise eradicating effect on tumors18 and can reduce the occurrence of tumor resistance. Photothermal therapy also can remodel the tumor microenvironment by decreasing CAFs in the tumor.19,20 Therefore, photothermal therapy mediated tumor microenvironment remodeling can decrease immunosuppression caused by the tumor microenvironment and improve the accessibility of tumor cells to therapeutic agents. There is no doubt that this provides a good basis for cancer treatment. Compared with normal tissues, the tumor microenvironment, which can enhance the release of drugs wrapped in nanoparticles, shows weak acidity.21 However, the differences between the tumor microenvironment and normal tissues frequently show relatively weak signals that cannot trigger rapid responses of nanocarriers efficiently. The strategy of specific upregulation of tumor tissue signals to amplify the signal differences between normal tissues and tumor tissue via multifunctional nanomedicine is very promising.22–25 Photothermal therapy can enhance drug release of nanoparticles, which may be due to a characteristic property of PLGA (glass transition temperature).26 Conventional wisdom holds that a high dose of chemotherapeutic drugs suppresses the immune system and reduces the number of monocytes, macrophages, etc. However, recent studies have shown that a low dose of chemotherapeutic drugs not only has some antitumor effects, but also can increase the immunogenicity of tumor cells27–29 and activate an immune response based on an ICD effect.30,31 Heat shock protein 70 (HSP70) and calreticulin (CRT) are important proteins that enhance the immunogenicity of tumor cells. The existence of topographic similarities between MHC I and HSP70 may suggest that HSP70 could be a target by itself for NK cells and T lymphocytes directly or MHC I presents a pathway by the APC in priming of CD8+ CTL indirectly.32–35 In addition to promoting the expression of HSP70, DOX can also stimulate the expression of CRT,27 which further enhances the ability of NK cells or T cells to recognize tumor cells, and thereby actives an immune response.36 Based on the above, the photothermal-responsive and pH-responsive drug release from nanoparticles are very promising in tumor therapy, because a nano-drug delivery system can effectively reduce the side effects of a chemotherapy drug on untargeted tissues and enhance the ICD effect at tumor sites specifically.31 Therefore, the combination of photothermal therapy and low-dose chemotherapy, together with the activation of the body’s immunity through chemotherapeutic drugs, provides a new protocol for improving the effect of tumor treatment while avoiding tumor cells’ resistance to drugs.
Hence, we proposed a treatment strategy: photothermal therapy can mediate tumor microenvironmental remodeling and promote the release of DOX from nanoparticles. The accessibility of the cancer cells lacking the protection of CAFs will be enhanced. The effect of photothermal therapy and chemotherapy will increase as accessibility of a tumor is enhanced. In addition, the high immunogenicity of tumor cells stimulated by DOX will also activate the immune response, thus enhancing the therapeutic effect. The targeted nanoparticles can decrease the side effects of DOX to non-targeted tissues due to their high selectivity. In this study, we constructed a nano-platform to achieve these functions and elucidate the key mechanisms of the synergistic effect of chemical-photothermal therapy, which is based on this strategy (Figure 1).
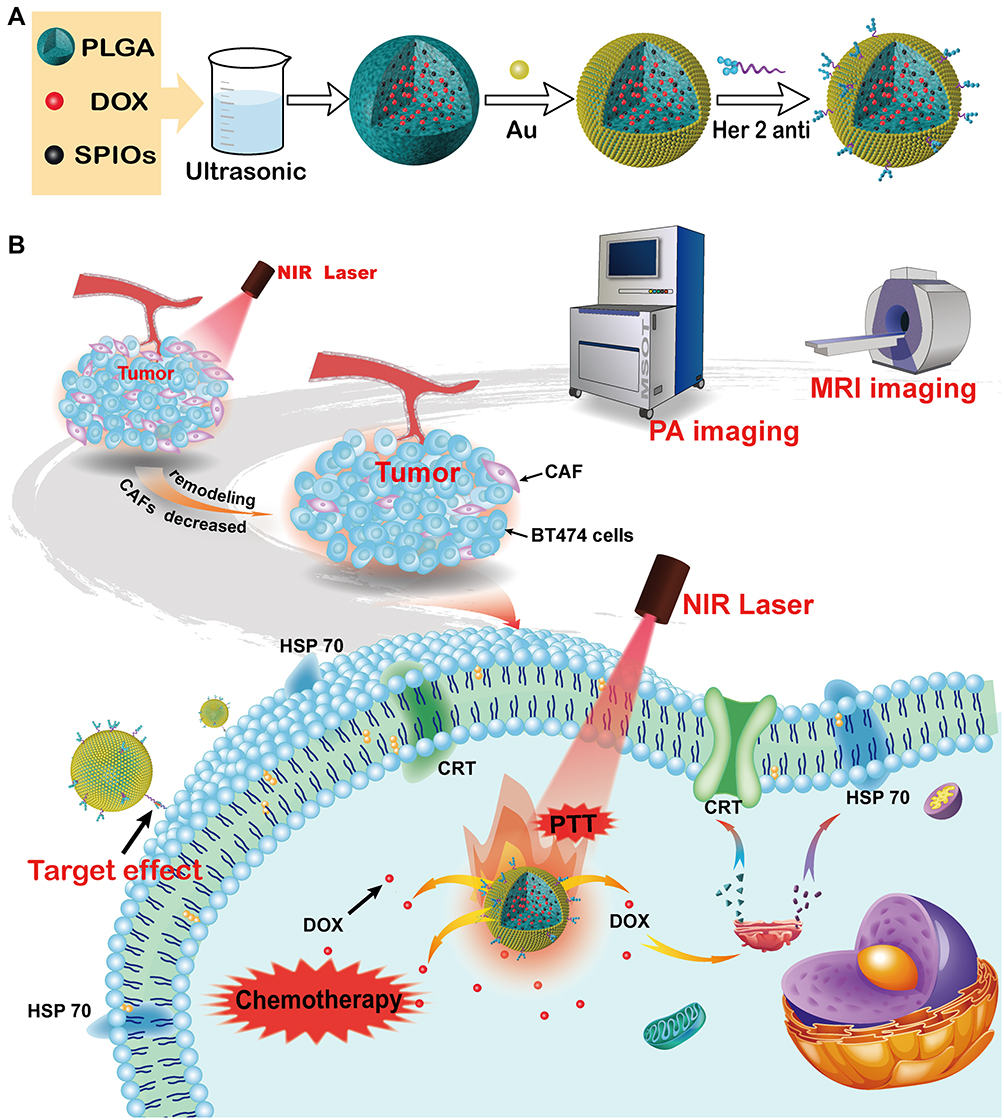 |
Figure 1 Schematic illustration of the structure of Her2-DOX-SPIOs@PLGA@Au NPs and the application of it. (A) The composition and fabrication procedure of Her2-DOX-SPIOs@PLGA@Au NPs. (B) The nanoscale theranostic agent is used for PA/MRI dual-modal imaging and tumor eradication through chemical-photothermal therapy and immune activation. |
Materials and Methods
Materials
Oleic-acid-coated Fe3O4 nanoparticles (SPIOs, So-Fe Biomedicine Ltd, China), Tetrachloroauric (ш) acid trihydrate, ACS reagent (HAuCl4•3H2O, ACROS, Belgium), Doxorubicin hydrochloride (DOX, Meilun Biotechnology Ltd, China), Poly(allylamine hydrochloride) (PAH, Mw17500), Poly(D, L-lactide-co-glycolide) acid terminated, lactide:glycolide=50:50, Mw24000-38000 (PLGA), 1-(3-Dimethylaminopropyl)-3-ethylcarbodiimide hydrochloride (EDC) and N-Hydroxysuccinimide (NHS) were obtained from Sigma-Aldrich, USA. Sodium chloride and sodium citrate were purchased from Sino Reagent, China.
Preparation of Her2-DOX-SPIOs@PLGA@Au NPs
Her2-DOX-SPIOs@PLGA@Au (Her2-DSG NPs) were prepared according to the previous report from our research group.37,38 DOX-SPIOs@PLGA nanoparticles (DS NPs) were prepared using the single emulsion oil-in-water (O/W) solvent evaporation method. Hydrochloric acid doxorubicin (10 mg) reacted with triethylamine (20 μL) was transformed to oil phase from water phase. The mixture of PLGA (100 mg), DOX, SPIOs (7.5 mg) and dichloromethane (5 mL) was added into PVA aqueous solution (2% w/v) drop by drop. Then, the mixture was emulsified by probe sonication. Finally, DS NPs were collected after evaporation, centrifugation and abstersion. The synthetic strategies of citrate-stabilized Au nanoparticles and gold shell formation were described in detail in the paper published previously.37 In brief, the Au NPs would stick to the surface of DS NPs after the surface charge of nanoparticles transformed from negative to positive by treating with PAH (1 mg/mL in 0.5 mol/L NaCl aqueous solution). Gold seeds on the surface of nanoparticles would grow into gold shells due to the reduction of NH2OH•HCl solution (0.33 mL, 0.5 mol/L). The Herceptin conjugation was based on the carbon diimide method. Finally, Her2-DOX-SPIOs@PLGA@Au nanoparticles (Her2-DSG NPs) were dispersed in PBS, sealed and stored at 4°C.
Characterization of Nanoparticles
The morphology, size distribution and optical absorption of nanoparticles were measured by field emission scanning electron microscope (FESEM, Hitachi S-4800, Japan), particle size distribution analyzer (Malvern Instruments, Malvern, UK) and UV-vis spectrophotometer (Beckman Coulter DU 730, USA) respectively. The load of the DOX and SPIOs in Her2-DSG NPs was measured by UV-vis spectrophotometer and inductively coupled plasma optical emission spectrometry (ICP-OES) respectively. Confocal laser scanning microscopy (CLSM, Leica TCSSP5 II, Germany) was used to prove the good attachment of the antibody labeled FITC to NPs.
In vitro Photothermal Effect
Five different concentrations (200 μg/mL, 100 μg/mL, 50 μg/mL, 20 μg/mL, and 0 μg/mL) of DSG NPs aqueous solution (1 mL) were put into separate quartz cells. The quartz cells containing NPs solution were irradiated by NIR laser (808 nm, 1 W/cm2) for 10 min, and then cooled for 10 min. Digital thermal imaging system (FLIR A300, USA) was employed to measure real time temperature during the whole process.
In vitro PA/MRI Imaging Assessment of NPs
The photoacoustic imaging system (MSOT inVision 128, Germany) with an excitation wavelength of 808 nm was used for the photoacoustic imaging of different concentrations of DSG NPs (20 μg/mL, 40 μg/mL, 50 μg/mL, 66.67 μg/mL, 100 μg/mL, and 200 μg/mL) and SPIOs@PLGA@Au NPs (SG NPs) (40 μg/mL, 80 μg/mL, 100 μg/mL, 133.33 μg/mL, 200 μg/mL, and 400 μg/mL).
The transverse relaxation time and T2 imaging effect of different concentrations of NPs aqueous solution (corresponding iron concentrations were 0 mM, 0.005 mM, 0.01 mM, 0.02 mM and 0.04 mM, respectively) were measured via magnetic resonance imaging (0.5T, NM120-Analyst, Shanghai). Imaging parameters: TR value is 8000 ms, TE value is 400 ms.
Nanoparticle Drug Release
DSG NPs (7 mg) were dissolved in 1 mL PBS (pH=5.6, 7.4). Next, the suspension and magneton were sealed into a dialysis membrane (MFPI, US) which could filter molecules larger than 5000 Da. PBS at same pH was used as a drug-releasing medium on the other side. This was then mixed on a magnetic mixer at room temperature. 2mL of PBS solution was acquired at different time points (0.5 h, 1 h, 2 h, 4 h, 8 h, 12 h, 24 h, 48 h), and supplemented by 2 mL PBS. The OD value of PBS at 490 nm was measured by UV-vis spectrophotometer. In addition, the promoting effect of NIR irradiation on drug release was also performed. The nanoparticles were redispersed in PBS (pH= 7.4) after being washed twice. The suspension was oscillated in a centrifuge tube at room temperature for 50 min, and then exposed to NIR laser (1 W/cm2) for 10 min. After centrifugation, the supernatant (2 mL) was taken and measured. Six cycles were evaluated.
Cell Experiment
Human breast cancer cell lines BT474, MCF-7, HUVEC and MCF-7/Adr were provided by the central laboratory of Renji Hospital, School of Medicine, Shanghai Jiaotong University. The use of cell lines in our experiments received the approval of the ethical review board of Renji Hospital, School of Medicine, Shanghai Jiaotong University. These cells were cultured in RPMI-1640 medium, supplemented with 10% fetal bovine serum (FBS) and 1% penicillin-streptomycin at 37°C in an atmosphere of 5% CO2 with saturated humidity. Cells were subcultured by trypsin-EDTA.
Cytotoxicity of SPIOs@PLGA@Au NPs in vitro
BT474 and HUVEC cells were incubated in 96-well plates for 12 h. Then, the old medium was discarded and the medium with different doses of SG NPs (0 μg/mL, 10 μg/mL, 20 μg/mL, 50 μg/mL, 100 μg/mL, 200 μg/mL) was added and incubated for 12 h or 24 h. Finally, the cell viability was evaluated by CCK-8 assay. The group with 0 μg/mL of SG NPs was used as control.
Assessment of the Photothermal Therapeutic Effects of Nanoparticles
BT474 cells were stained with calcein acetoxymethyl ester (calcein AM) to visualize the therapeutic effects of nanoparticles. BT474 cells incubated with nanoparticles in different ways (control, control + laser, DSG NPs, DSG NPs + laser) for 2 h were exposed to NIR laser (1 W/cm2) for 10 min, and were then washed with PBS and stained with calcein AM after incubation for 2 h.
Construction of Cell Line with mdrl Gene Overexpression in BT474 Cells
A lentiviral expression vector (pRLenti-CMV-ABCB1-3FLAG-PGK-Puro) of mdrl gene (NM 000927) and a lentiviral expression vector (pRLenti-EF1α-EGFP-P2A-Puro-CMV-MCS-3Flag) of EGFP gene were purchased from OBiO Technology Corp., Ltd, Shanghai. BT474 cells were seeded into 24-well plates, into which different volumes of virus primer (pRLenti-EF1α-EGFP-P2A-Puro-CMV-MCS-3Flag) and polybrene were added. After 12 h, the old medium was replaced by a fresh medium. The infection efficiency was observed under a fluorescence microscope. Finally, BT474 cells were infected by the lentiviral expression vector of mdrl gene according to the multiplicity of infection (MOI) obtained above and were screened by purinomycin for 1 week to obtain the BT474 cells with mdrl gene overexpressed.
Evaluation of the Expression of mdrl in BT474/Adr and MCF-7/Adr Cells
Mdrl upstream sequence: CCCATCATTGCAATAGCAGG, mdrl downstream sequence: GTTCAAACTTCTGCTCCTGA; β-actin upstream sequence: GTCATCACCATTGGCAATGAG, β-actin downstream sequence: CGTCACACTTCATGATGGAGTT. The direction of the primer sequence is 5ʹ→3ʹ. The primers were synthesized by Sangon Biotech, Shanghai. PCR reaction parameters: 93°C, predegeneration for 4 min; 93°C, 40 s; 54°C, 45 s. Furthermore, lentivirus-infected cells and control cells were collected, the total protein was extracted, and the protein concentration was tested with BCA protein quantitative kit. Each group was subjected to SDS-PAGE electrophoresis with 15 μg of protein, and transferred. Then 5% skim milk powder was sealed at 37°C for 2 h. Anti-FLAG®M2 (F1804, 1:5000, Sigma) was incubated with protein overnight at 4°C. After washing the membrane using TBST three times, the second antibody (A0216, 1:3000, Beyotime) was incubated with protein at room temperature for 2 h, and developed. Na-K-ATP was taken as internal parameter.
Evaluation of Photothermal Effect on Cellular Drug Uptake
In order to prove that photothermal effect could increase the cellular uptake of DOX, we grew BT474 and MCF-7 cells in 6-well plates. The experimental groups include: control, control+ laser, DOX, DOX+ laser, DSG NPs, and DSG NPs+ laser (the dose of DOX group was equal to the total amount of DOX encapsulated in DSG NPs). Cells were incubated together with nanoparticles for 30 min, and then laser treated groups were exposed to laser (1 W/cm2) for 10 min. After another 4 h incubation, all groups are collected for flow-cytometry analysis of DOX.
Combined Therapy of Nanoparticles in vitro
BT474, BT474/Adr and MCF-7, MCF-7/Adr cells were seeded into 96-well plates and incubated for 12h. Then, nanoparticle solution with the different concentrations (100 μg/mL, 200 μg/mL) were added. Each concentration was further divided into the following groups: control, DOX, control with laser, DOX with laser, SG NPs, SG NPs with laser, DSG NPs, and DSG NPs with laser. After the above suspensions were added in and incubated with cells for 2 h, the cells were irradiated with NIR laser (808 nm, 1 W/cm2) for 10 min, and then the plates were put back in the incubator for 12 h. Finally, the cell viabilities were investigated by CCK-8 assay. The OD value is equal to the OD value of the experimental well minus the OD value of the correction well, and the correction well contains the mixture of nanoparticles and medium without cells. The grouping of correction wells was consistent with that of experimental wells. Results are expressed as mean ± standard deviation (n=4).
Effect of Nanoparticles on Cellular Expression of HSP70 and CRT
BT474 and BT474/Adr cells were separately seeded into different 6-well plates. When cells grew to 70–80%, DOX solution and DSG NPs (the concentration of DOX solution is equal to the per unit concentration of DOX contained in DSG NPs) was added into different wells for incubation for 2 h or 24 h. After removal from the wells with 0.25% Trypsin-EDTA and being washed twice with PBS, the cells were stained with Anti-Hsp70-APC (130–105-550, 1:10, Miltenyi) and Anti-calprotectin (Alexa Fluo® 647) (ab196159, 1:50, Abcam) for 20–30 min in the dark. Then, the expression of HSP70 and CRT in cells in different ways was tested by flow cytometer (FCM, BD Accuri C6, US).
To verify that photothermal effect could also induce an ICD effect in cancer cells, we prepared PLGA@Au NPs. The groups included control, control+laser, PLGA@Au, PLGA@Au+laser groups. BT474 cells and BT474/Adr cells were seeded into 6-well plates. After 24 h of incubation, the nanoparticles were added into nanoparticle groups (final concentration: 200 μg/mL) and incubated for 30 min. The laser treated groups were irradiated by NIR laser and incubated for another 2 h. Finally, the cells were collected for staining, washing, and flow cytometry tests.
In vitro Assessment of NPs Targeting Recognition of Her2-Positive Cells
BT474 and MCF-7 cells were separately seeded into Petri dishes, which were divided into five groups (Her2 labeled FITC-DSG NPs with BT474, DSG NPs with BT474, Her2 labeled FITC-DSG NPs with BT474 and Herceptin, Her2 labeled FITC-DSG NPs with MCF-7, DSG NPs with MCF-7). After incubation for 24 h, different nanoparticle suspensions (5 mg/mL, 100 μL) were put into corresponding Petri dishes, which were then cultured for another 0.5 h. Next, the medium was discarded and cells were washed three times with PBS. After that, cells were fixed with paraformaldehyde for 15 min and washed with PBS three times again. DAPI was then added to dye the cells for 5 min, and the remaining DAPI was washed off with PBS. Finally, the Petri dish with 1 mL medium was observed under a microscope. Image J was used to quantify the nanoparticles that were endocytosed by each cell. In brief, we randomly delineated three free nanoparticles and recorded their average integrated optical intensity (ION). Next, we collected the ION data of three random cells in a microscopic field, and the average ION value of a cell was divided by the average ION value of a free nanoparticle. That is, “Number of nanoparticles endocytosed by a cell = average ION value of cell/average ION value of nanoparticle.”
Animal Experiments
All of the animal experiments were performed according to the protocols approved by the Institutional Animal Care and Use Committee (IACUC) of Medical School of Shanghai Jiao Tong University. Female nude mice (3–4 weeks, 18–22 g) were purchased from Shanghai Slac Laboratory Animal Co., Ltd. BT474 cells was suspended in PBS and matrix gel (1:1) solution, and then the cell suspension was injected subcutaneously into the armpit of nude mice (1 × 10⁶ cells/100 μL/mouse).
In vivo Toxicity Study
With healthy female nude mice injected with saline used as control group, healthy female nude mice intravenously injected with Her2-DSG NPs (200 μL, 7 mg/mL) were taken as the experimental group. Acute toxicity and chronic toxicity of Her2-DSG NPs in mice were observed at two time points of 24 h and 15 d after injection, respectively. Blood samples collected from the ophthalmic vein under anesthesia was used to test blood biochemistry indexes. Major organs including heart, liver, spleen, lung, and kidney were stained with hematoxylin and eosin (H&E), and the toxicity of nanoparticles was evaluated through observing the structure of major organs.
In vivo MRI Imaging
Her2-DSG NPs, DSG NPs (200 μL, 7 mg/mL) and saline (200 μL) were intravenously injected into different groups of mice via tail vein respectively. The targeting and T2 imaging effects of NPs in tumor were evaluated at different time points (0 h, 0.5 h, 1 h, 2 h, 6 h, 24 h). The test instrument is Bruker 7.0T MRI scanner (BIOSPEC70/20USR, Germany). T2-weighted imaging parameters were TR= 3000, TE= 30, flip 90°, FOV= 4 cm, slice thickness= 1.0 mm. Saline group was set as control.
In vivo PA Imaging
Her2-DSG NPs, DSG NPs (200 μL, 7 mg/mL) and saline were intravenously injected into different groups of mice via the tail vein. The targeting and PA imaging effects of NPs in tumor were evaluated at different time points (0 h, 0.5 h, 1 h, 2 h, 6 h, 24 h). The in vitro PA imaging instrument was also used to observe PA imaging in vivo. Saline group was set as control.
In vivo Combined Therapy Experiment
The nude mice bearing BT474 xenograft (n=30) were divided into 10 groups (saline, saline + laser, DOX, SG NPs, DSG NPs, SG NPs + laser, DSG NPs + laser, Her2-DSG NPs, Her2-SG NPs + laser, Her2-DSG NPs + laser). Based on the results of NPs targeting imaging in vivo, 2 h after tail intravenous injection was selected as the best time of therapy. We used NIR laser (808 nm, 1 W/cm2) to irradiate the tumor for 10 min and the temperature of the tumor was recorded with an IR thermal imager. After the initial treatment, the weight and tumor volume of mice were monitored for 20 days. The time points of the two treatments were day 1 and day 10. Finally, the mice of Her2-DSG NPs + laser group were tested for blood biomedical indicators, and the major organs were excised for pathological analysis including H&E staining. Tumors in all groups were excised for pathological analysis including H&E staining and TdT-mediated dUTP nick end labeling (TUNEL). Saline group was set as control.
HSP70 and CRT Expression in Tumor Tissues Promoted by Nanoparticles
Antibodies used included rabbit anti-human CRT (ab92516, Abcam), anti GAPDH (ab181602, Abcam), rabbit anti-human HSP70 (AF1156, Beyotime), and goat anti-rabbit IgG (ab205718, Abcam). Two hours after irradiation, the expression of HSP70 and CRT in tumor were detected by immunohistochemistry and Western blot analysis. Mice were divided into 5 groups (saline, saline + laser, Her2-DSG NPs, DOX, and Her2-SG NPs) to assess the expression of HSP70, and mice were divided into four groups (saline, DOX, Her2-SG NPs, and Her2-DSG NPs) to assess the expression of CRT. Tumors were obtained from mice at 2 h after treatment. Total protein was extracted from tumor tissues after the tumors were obtained from mice at 2 h after treatment, and the protein concentration of the tumor was measured using BCA kit (BCA, Beyotime). 20 μg protein was taken for SDS-PAGE electrophoresis, and transferred, and 5% skim milk was sealed at 37°C for 2 h. The primary antibodies were incubated at 4°C overnight. Then, the proteins were washed using TBST three times, 10 min per wash. The above mixture was incubated with secondary antibody at room temperature for 2 h. Finally, we used enhanced chemiluminescence method (Bio-Rad Laboratories, Inc., Hercules, USA) to develop the samples. GAPDH was taken as internal parameter. Image J analyzed the gray value. Saline group was set as control.
Performers of the immunohistological staining did not take part in the animal experiments and did not know the details of animal grouping.
Photothermal Mediated Tumor Microenvironment Remodeling
Twelve hours after irradiation, tumors were collected and sectioned for observation. The intensity of CAFs was used to evaluate the photothermal effect. Sections were stained with specific antibodies of α-SMA (ab32575, Abcam) and CD31 (ab28364, Abcam), and then incubated with FITC-labeled and Cy3-labeled secondary antibodies (ab6785, ab6939, Abcam). The nuclei were stained with DAPI. In addition, the targeted nanoparticles were injected intravenously 12 h after the first irradiation. Then tumors were sectioned after 2 h of injection. The nuclei and vessels were respectively stained with DAPI and CD31, and nanoparticles were observed through the spontaneous fluorescence of DOX. Finally, tumor sections were observed under a fluorescence microscope.
Assessment of the Activation of NK Cells
Mice were randomly divided into two groups (saline, Her2-DSG NPs). Tumor tissues were taken from mice 4 h after intravenous injection of nanoparticles or saline. The tumor tissue was put into a mixture of collagenase 4 (C5138, Sigma) and DNA enzyme I (D106200, Aladdin), and incubated at 37°C for 30 min, and then the cell suspension was treated with cell filter. The blood samples in tumor were treated with 3 mL pre-heated RBC lysis buffer (11,814,389,001, Sigma) for 3 min, then diluted with PBS and washed. The cells were filtered with cell filter, washed with PBS, stained with PE labeled anti-mouse CD49b (558,759, BD Phamingen) and APC labeled anti-mouse CD3e (553,066, BD Phamingen), fixed, washed, and tested by flow cytometry successively. NK cells were labeled PE positive and APC negative.
Statistical Analyses
The data were represented as mean ± SD. The comparisons of the mean value were performed by two-tailed Student’s t-test. P<0.005, P<0.01, and P<0.05 were considered significant. CLSM images and Western Blot images were obtained and signal intensities were calculated using ImageJ software.
Results
Nanoparticle Characterization
The nanoparticles were synthesized by a water-in-oil single emulsion solvent volatilization method. The morphology of nanoparticles was characterized by FESEM (Figure 2A and Figure S1). The nanoparticles have typical characteristics of spherical shape, smooth surface, and uniform size (Figure S1). The average diameter of DS NPs was 247±27.27 nm (Figure S2). After coating DS NPs with gold shell through the seeding method, the average diameter of DSG NPs increased to 285.7±81.4 nm (Figure S3). Following Li’s research,21 we adopted a weight ratio of DOX/PLGA of 1/10 when synthesizing DOX-loaded nanoparticles. The absorption peak of DOX-loaded nanoparticles at 484 nm was significantly higher than that of drug-free nanoparticles, which indicated that the DOX was successfully loaded into nanoparticles. The DOX load content of DSG NPs was 3.1±0.66 wt.% through the concentration-absorption standard curve at different pH conditions (Figure S4 & S5). The nanoparticles encapsulated by the gold shell showed a distinct and wide distribution absorption peak in the NIR region (Figure 2B). The temperature of the nanoparticles in water (1 mL) was elevated when irradiated by a NIR laser (808 nm, 1 W/cm2), with the highest temperature ranging from 32.4°C (20 μg/mL) to 52.5°C (200 μg/mL), as shown in Figure 2C. Based on the pH responsiveness and photothermal responsiveness of PLGA, the cumulative DOX release of DSG NPs at pH 5.7 was up to 50.14%, while at pH 7.4, it was only 24.94% (Figure 2F). In addition, it could be seen from Figure 2G that NIR laser irradiation could promote the release of DOX from nanoparticles. Under confocal laser scanning microscopy, the green fluorescence of the NPs could be seen, which proved that the FITC-labeled Her2 antibody was successfully attached to the surface of the nanoparticles. At the same time, the fluorescence of the DOX showed the successful encapsulation of it (Figure 5). The weight of encapsulated SPIO nanoparticles accounted for 2.88±0.11% of the total weight of NPs. The load of SPIO nanoparticles were measured via ICP-OES. With the rise of the iron concentration, the nanoparticles exhibited excellent contrast enhancement in T2-weighted MR imaging with a T2 relaxivity of 345.31±23.06 mM−1s−1(Figure 2E). A significantly negative enhancement in T2-weighted imaging shown in Figure 2E demonstrated that nanoparticles produced the T2-weighted imaging effect. PA imaging is due to the absorption peak of the gold shell on the surface of the nanoparticles in NIR region. Both the DOX-loaded and DOX-free nanoparticles were tested to decide whether DOX affects the effect of imaging. PA signal intensity increased linearly with the increase of the concentration of nanoparticles (Figure 2D), but there is no obvious difference between DOX-loaded and DOX-free nanoparticles was observed (Figure S6). In other words, the fluorescence of DOX has little impact on the PA imaging.
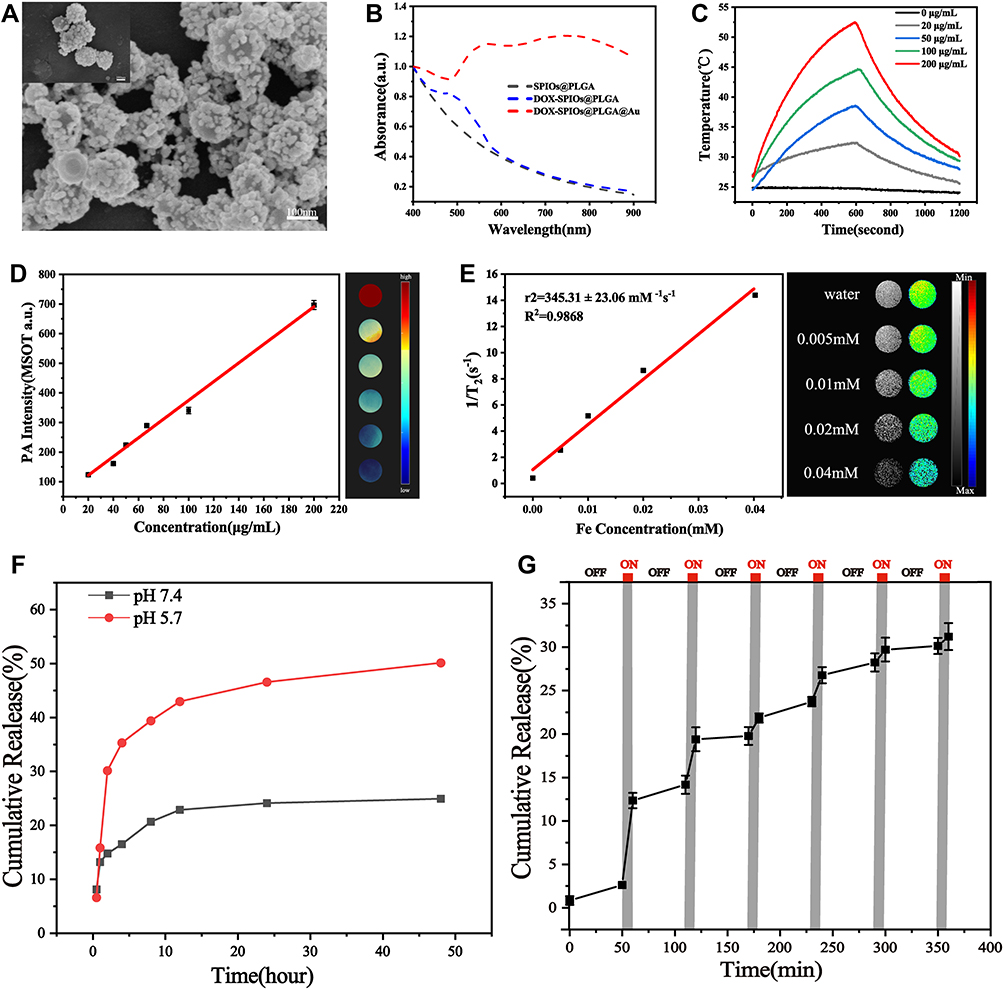 |
Figure 2 (A) FESEM images of DSG NPs. (B) UV-vis spectra of the nanoparticle aqueous solution at different stages of preparation process was drawn by the normalization method. (C) The temperature curves of different concentrations of DSG NPs under NIR laser irradiation (808 nm, 1 W/cm2) for 10 min and cooling for 10 min. (D) Measured photoacoustic signal intensity of DSG NPs at various concentrations (data expressed as mean ± SD, n = 4). (E) The relaxation rate and the T2-weighted MRI imaging of DSG NPs was measured by 0.5T analyzer. (F) DOX release profiles from DSG NPs at different pH. (G) DOX release profile from DSG NPs with six cycles of laser on/off (data expressed as mean ± SD, n = 3). |
Cell Experiment
In vitro Cytotoxicity Assay
In vitro cytotoxicity of the nanoparticles was tested by CCK-8 viability assay. BT474 cells were incubated with SPIOs@PLGA@Au nanoparticles (SG NPs) of different concentrations ranging from 0 μg/mL to 200 μg/mL for 24 h and 12 h. As Figure 3A shows, there was a negligible cytotoxicity of nanoparticles. Then, we evaluated the cytotoxicity of nanoparticles to normal human cell line of HUVEC with the same method, and the result showed that SG NPs had a similar cytotoxicity to the HUVEC line as it did to the BT474 cell line (Figure 3B).
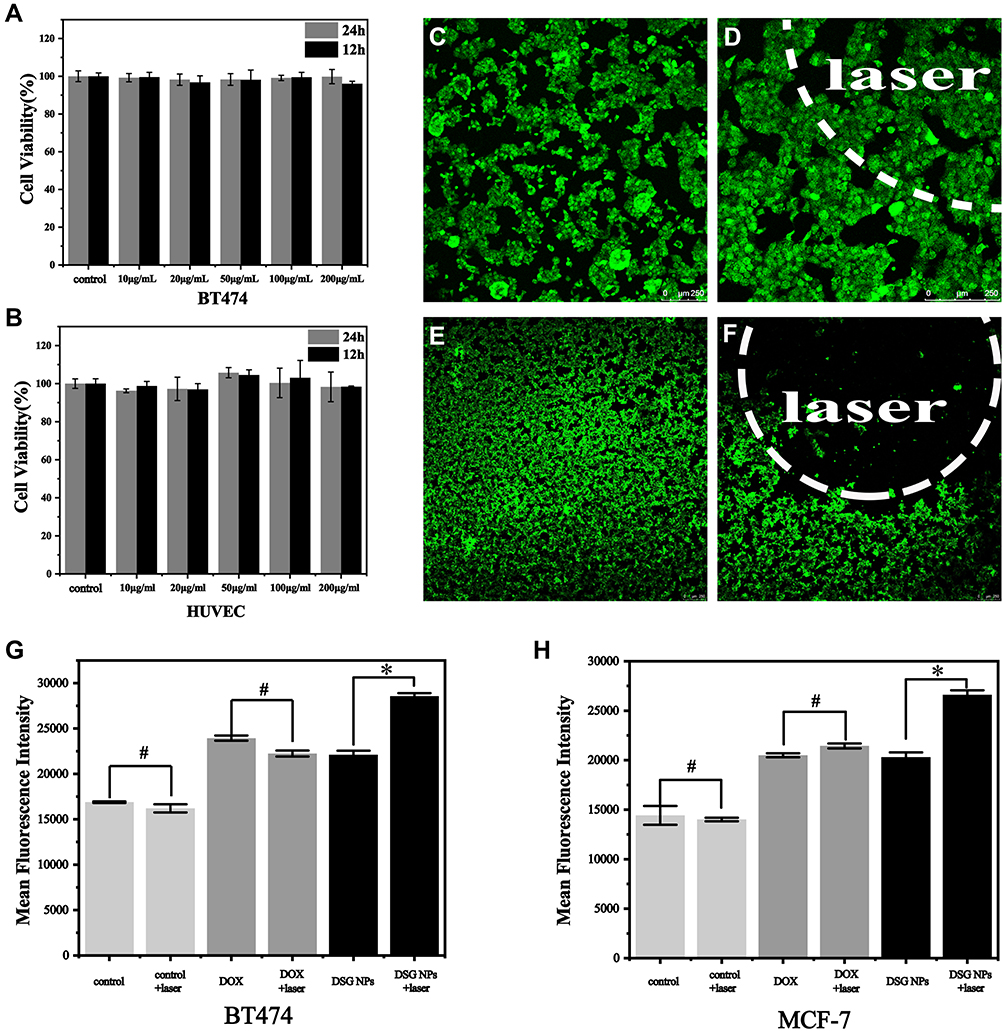 |
Figure 3 (A and B) Cell viabilities of BT474 cells and HUVECs at various dosages of the SG NPs and different incubation time (data expressed as mean ± SD, n = 5, p > 0.05). (C–F) Fluorescence microscopy images of BT474 cells treated in various ways stained with calcein AM ((C) control, (D) control + laser, (E) DSG NPs, (F) DSG NPs + laser, scale bar: 250 μm). (G and H) The mean fluorescence intensity of DOX uptake by different groups of different cells measured by flow cytometry. Data expressed as mean ± SD, n = 3, #p > 0.05, *p < 0.05. |
Therapy Effect of Nanoparticles in vitro
Both the control group and control+laser group showed dense green fluorescence after staining as shown in Figure 3C and D. The region with laser irradiation of NPs was dark without fluorescence, and the region without laser irradiation showed dense green fluorescence (Figure 3E and F). Those were the basis for targeted nanoparticles to eradicate tumor tissues precisely and reduce damage to normal tissue. As mentioned above, the photothermal effect could promote the release of DOX from nanoparticles. From the evaluation of photothermal effect on cellular uptake of DOX, it could be seen that the mean DOX fluorescence intensity in DSG NPs + laser group was significantly higher than that of other groups (Figure 3G and H). BT474, BT474/Adr, MCF-7 and MCF-7/Adr cell lines treated in different ways showed different results. BT474/Adr cells incubated with DOX solution showed an unsatisfactory therapeutic effect, as did those co-incubated with DOX-loaded nanoparticles. However, the combination of photothermal therapy and chemotherapy achieved significant therapeutic effects on both BT474 cells and BT474/Adr cells (Figure 4). Given these results, the effect of the combined therapy was better than that of single treatment, which might be due to the photothermal effect that promotes the uptake of more DOX by cells. A similar therapeutic effect was seen in BT474/Adr cells, MCF-7 cells, and MCF-7/Adr cell lines.
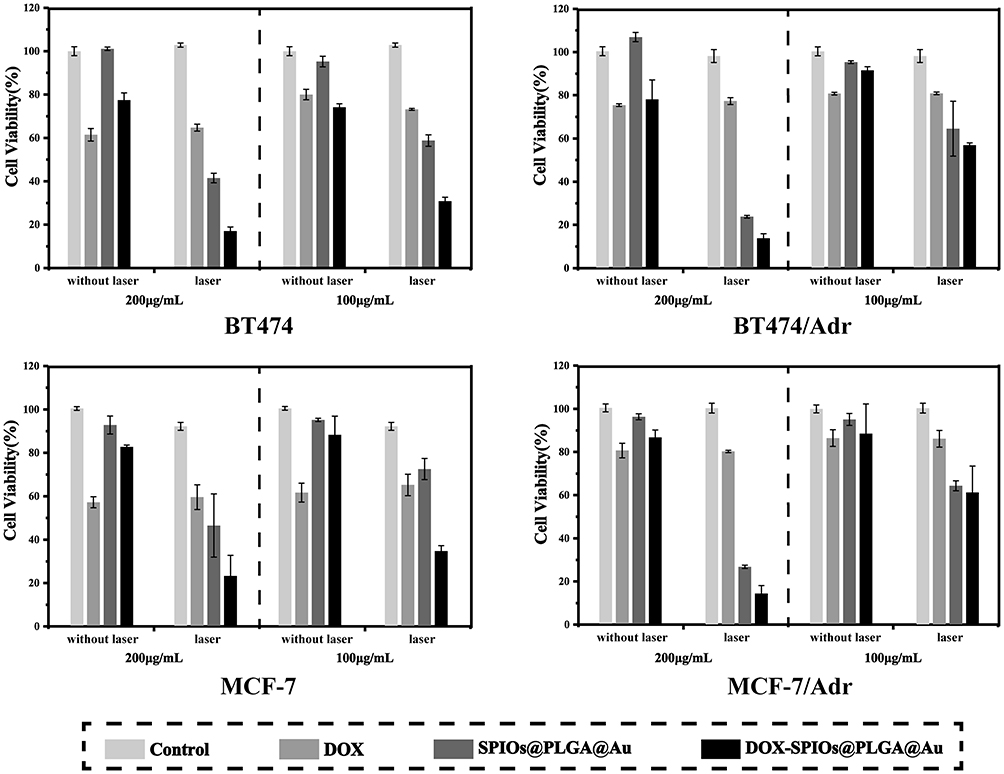 |
Figure 4 Cell viability of BT474, BT474/Adr, MCF-7 and MCF-7/Adr cells tested by CCK-8 after being treated in different ways (control, control with laser, SG NPs, SG NPs with laser, DSG NPs, DSG NPs with laser, DOX, DOX with laser; the above groups all had two levels of concentrations: 100 μg/mL, 200 μg/mL), data expressed as mean ± SD, n = 4. |
Targeting Performance in vitro
The targeting performance in vitro was tested using Her2-expressed BT474 cells and MCF-7 cells without Her2 expression. The Her2-targeted nanoparticles were separately incubated with BT474 cells, MCF-7 cells and BT474 cells with Her2 receptor blocked for 30 min, and DSG NPs were incubated with MCF-7 cells or BT474 cells for the same time. From Figure 5, we see that BT474 cells (blue fluorescence) were surrounded by a large amount of FITC-labeled (green fluorescence) Her2-targeted nanoparticles, while the others showed poor uptake ability. This demonstrated the targeting ability of the Her2-targeted nanoparticles towards Her2-positive cells (Figure 5). As could be seen from the quantified result of the count of nanoparticles uptake by one cell in Figure 5, the Her2-positive BT474 cells had the highest uptake of nanoparticles (Figure S7).
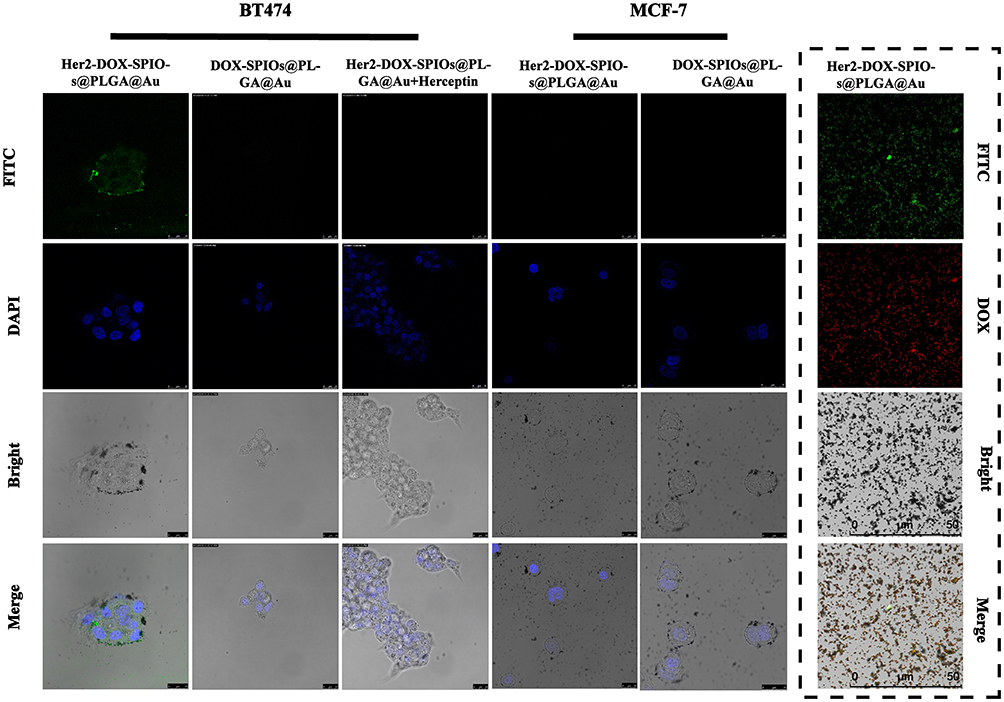 |
Figure 5 Confocal laser scanning microscopy images of BT474 cells incubated with Her2-DSG NPs (1st column), DSG NPs (2nd column), and Her2-DSG NPs with herceptin (3rd column), MCF-7 cells incubated with Her2-DSG NPs (4th column) and DSG NPs (5th column), scale bar: 25 μm. Confocal laser scanning microscopy images of antibody connection and drug loading of Her2-DSG NPs (dashed box), scale bar: 50 μm. |
Construction of BT474/Adr Cell and Validation of mdrl Gene Expression
The optimal range of MOI was determined by observing the efficiency of BT474 cell infection by EGFP gene-containing lentivirus. It can be seen from Figure 6A that the infection efficiency of MOI 20 reached 80%. According to the values of viral titer and MOI, BT474 cells were infected by mdrl gene-containing lentivirus and then screened with purinomycin for 1 week to construct BT474/Adr cells. Western blot was used to verify that lentivirus successfully infected cells (Figure 6B); qPCR was used to verify the expression of mdrl gene in BT474/Adr cells and MCF-7/Adr cells (Figure 6B and C).
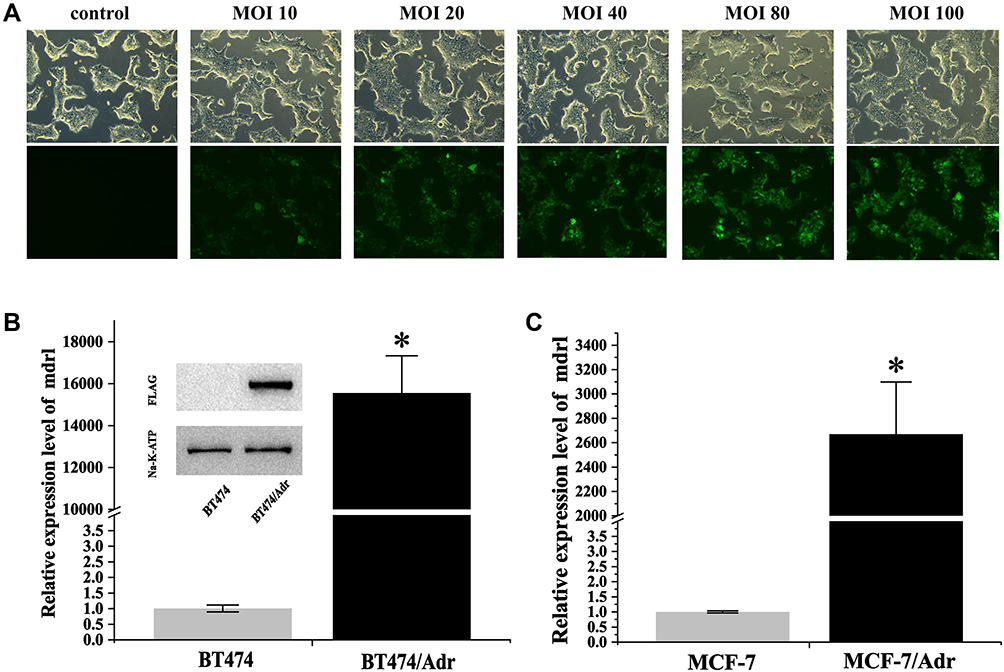 |
Figure 6 (A) The infection efficiency of lentivirus on BT474 cells was observed by fluorescence microscopy (×100 magnification). (B and C) Relative expression level of mdrl gene in BT474/Adr cells and MCF-7/Adr cells measured by qPCR method, Western blot was used to detect the expression of FLAG to evaluate the constructed BT474/Adr cells by lentivirus infected BT474 cells (data expressed as mean ± SD, n = 3, *p < 0.05). |
Expression of HSP70 and CRT Promoted by Nanoparticles
In this experiment, there was a significant temporal correlation between the expression of HSP70 or CRT on BT474 cells in the DOX group and that in the DOX-loaded nanoparticles group. A longer incubation time between agent and cells was associated with the higher expression of HSP70 and CRT on cells. In the same period, the DOX-loaded nanoparticle group had a higher expression level of HSP70 than that in the DOX group, but the expression of CRT in DOX group was higher than that in the DOX-loaded nanoparticle group (Figure 7). The reason might be that metal could stimulate the expression of HSP70.39,40 In addition, we prepared PLGA@Au NPs (excluding the influence of DOX and SPIOs) and found that photothermal effect could also enhance the expression of HSP70 (Figure S8). Photothermal effect could also induce an ICD effect on BT474/Adr cells (Figure S9), which showed a promising therapeutic potential in drug-resistant cells. There is no doubt that the photothermal effect amplified the ICD effect, which enhanced the immune activation of chemical-photothermal therapy. The expression of CRT was mainly affected by DOX. The experimental results indicated that there was little difference in CRT expression between the DOX group and the nanoparticle group at 2 h, but the expression level of CRT in DOX group was higher than that in the nanoparticle group after 24 h of incubation, and the expression of CRT was elevated as the incubation time increased. This result was partially validated by the previous reported research18 on drug release behavior of nanoparticles, which is characterized by a rapid release at initial phase, and slowing down gradually at terminal phase. BT474/Adr cells arrived at similar results.
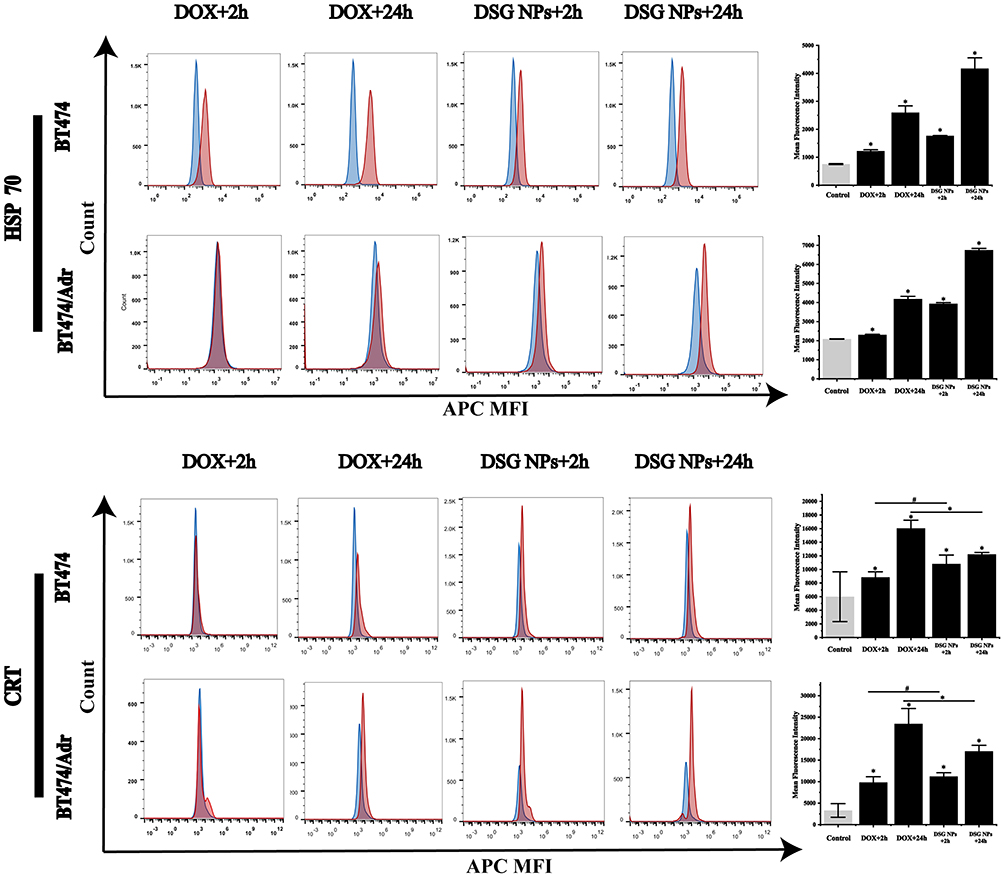 |
Figure 7 Flow cytometry results of the expression of HSP70 and CRT on the surface of BT474 cells and BT474/Adr cells in different groups (treated with DOX for 2 h, treated with DSG NPs for 2 h, treated with DOX for 24 h, treated with DSG NPs for 24 h). The mean fluorescence intensity of HSP70 (or CRT) expression was analyzed by software FlowJo V10 (all the blue histogram as control, the red histogram as experiment groups). Data expressed as mean ± SD, n=3, #p> 0.05, *p < 0.05. |
Animal Experiment
Toxicity of NPs in vivo
Blood samples were taken from the eyes of mice injected with Her2-DSG NPs (200 μL, 7 mg/mL) intravenously at the time points of 24 h and 15 days after injection, respectively. The blood biochemical indicators, including myocardial enzyme spectrum, liver function, renal function and inflammatory indices, were tested. In addition, blood biochemical indices of the mice (Her2-DSG NPs with laser) after 20 days of treatment were also examined. As shown in Figure 8A, after 24 h of the intravenous injection of NPs, there was slight acute inflammation in mice, which might be due to the exclusive reaction or incomplete sterilization of nanoparticle solution. The results of myocardial enzyme spectrum showed that nanoparticles were biologically safe to all groups of mice. Although there was a slight elevation in several indicators, generally the effect of nanoparticles was within the safe range. Based on the above data, we further assessed the biosafety of nanoparticles by analyzing the histopathology of the heart, lung, liver, spleen, and kidney. No substantial damage to the major organs was found in H&E section (Figure 8B).
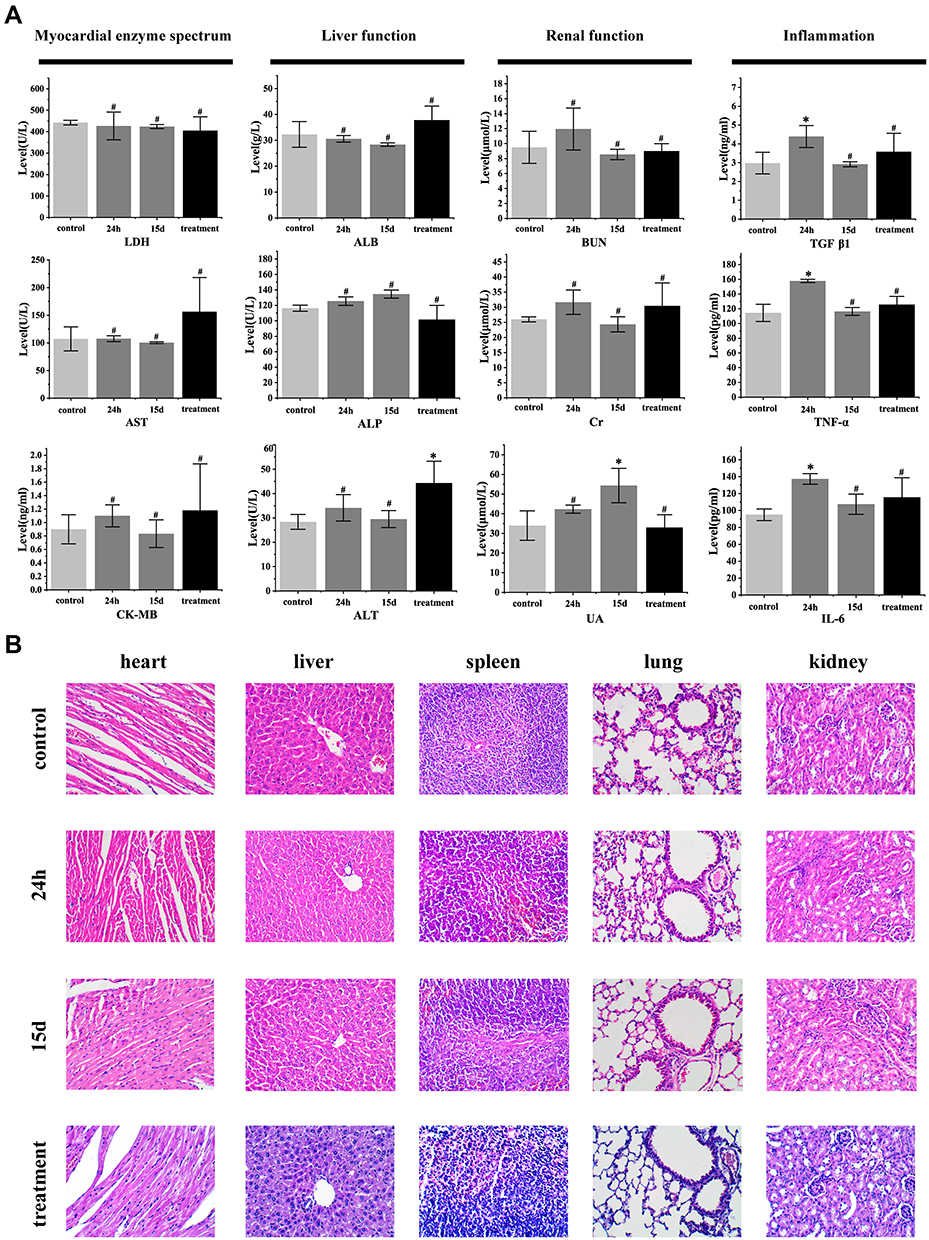 |
Figure 8 (A) The blood biochemistry of mice were measured at different times after Her2-DSG NPs (200 μL, 7 mg/mL) intravenous injected, and the blood biochemistry of untreated mice was used as control (data expressed as mean ± SD, n = 3, #P > 0.05, *P < 0.05). (B) Microscope images of H&E stained tissues in various organs (×400 magnification). Treatment group: the mouse samples came from the Her2-DSG NPs with laser group in tumor therapy experiment. |
MRI/PA Imaging in vivo
When the tumor volume reached ~200 mm3, nine mice were classified into three groups. The first group was injected with Her2-DSG NPs, the second group with DSG NPs, and the control group with saline only. In order to evaluate the tumor-targeted accumulation of nanoparticles in vivo, MRI and PA imaging were used to monitor the changes in tumor at 0.5 h, 1 h, 2 h, 6 h, 24 h after the intravenous injection of nanoparticles (200 μL, 7 mg/mL). MRI measurements were made using a Bruker BIOSPEC70/20USR 7.0T MRI scanner. It was found that the Her2-targeted nanoparticles showed a trend of gradual enrichment and then regression in the tumor site, and the content of nanoparticles was the highest in tumor after 2 h of intravenous injection (Figure 9A). The 1/T2 signal trend in tumor was similar to T2-weighted images (Figure 9B), which peaked at 2 h post injection using Her2-targeted nanoparticles. There were no significant differences in the signal intensity changes in the non-targeted nanoparticles group and saline group. A MOST inVision 128 scanner was employed for PA imaging, which indicated that the targeted nanoparticles group also reached the peak of signal intensity at 2 h after intravenous injection (Figure 9C and D). This result was consistent with that of MRI imaging in vivo.
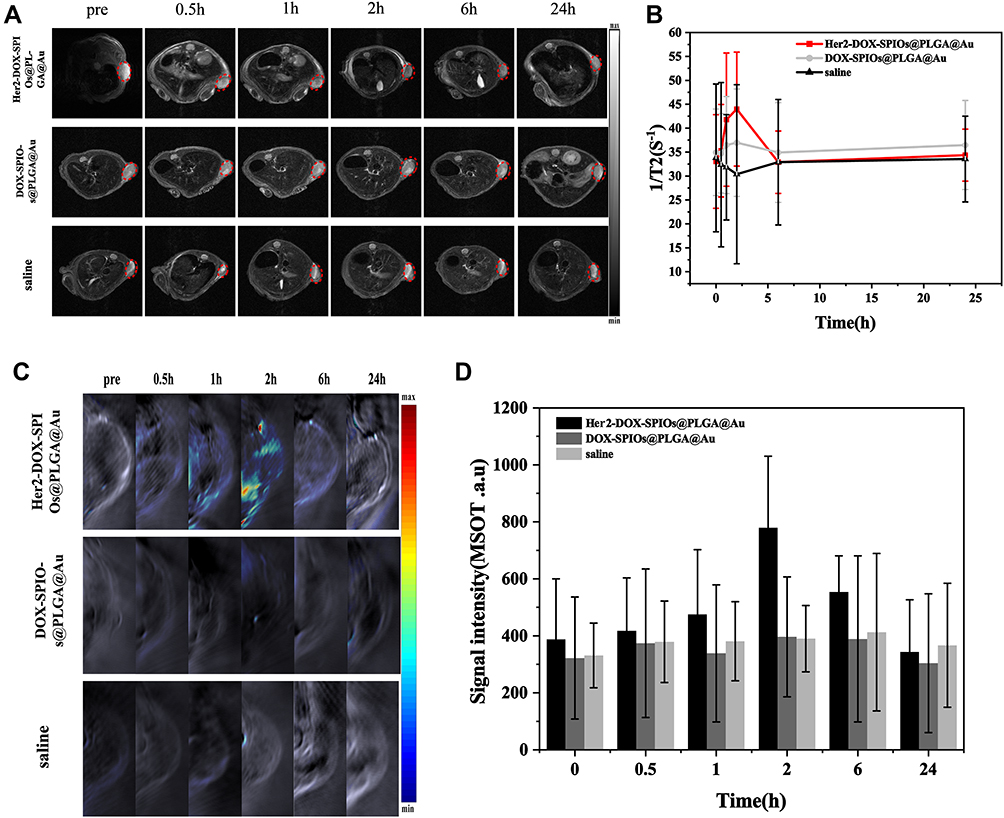 |
Figure 9 (A) T2-weighted MR imaging of a BT474 mice xenograft tumor (red dashed circles) at different times (0 h, 0.5 h, 1 h, 2 h, 6 h, 24 h). (B) T2 relaxation rate (1/T2(s−1)) of region of interest (ROI) of tumor at different times. (C) Photoacoustic imaging of a BT474 mice xenograft tumor at different times (0 h, 0.5 h, 1 h, 2 h, 6 h, and 24 h). (D) Signal intensity of ROI of tumor at different times. Data expressed as mean ± SD, n=3. |
Therapy Effect of Nanoparticles in vivo
Following the results of the in vivo imaging, we selected the time point of 2 h after intravenous injection for irradiation. Before irradiation, sodium pentobarbital (0.7%) was injected intraperitoneally (dose: 200 μL/20 g). The temperature of the tumor in the targeted group was significantly higher than that in the non-targeted group and the control group, and met the requirement of killing tumor. By tracking variations in tumor volume, we were surprised to find that the tumors in the Her2-DSG NPs + laser group were inhibited significantly after treatment within 10 days compared with those in the Her2-SG NPs + laser group (Figure 10A). Compared with the control group, the laser irradiation groups (Her2-DSG NPs + laser, Her2-SG NPs + laser, DSG NPs + laser and SG NPs + laser), the targeted drug delivery groups (Her2-DSG NPs and DSG NPs) and DOX group all showed slight inhibition of tumor growth (Figure 10B). In other words, among all the groups, Her2-DSG NPs + laser group had the best therapeutic effect (the mean tumor volume decreased to 8.19 ± 5.05% of the initial volume). H&E stained and TUNEL results suggested that tumor tissues were significantly destroyed and the number of apoptotic tumor cells increased after the therapy (Figure 11). In order to achieve a better therapeutic effect, a second treatment was given on day 10. Since the first photothermal treatment reduced the CAFs in tumor, the nanoparticles in tumor had accumulated more than before,19 and the photothermal effect was further enhanced in the second treatment. During the irradiation, the temperature first rose to a short plateau period, and then rose again (Figure 10C and D). It can be seen from the IR thermal images (Figure 10E) that the temperature of targeted groups in the second treatment was higher than that in the first treatment. This phenomenon could be explained by the EPR effect. The body weight of mice from various groups did not change significantly during the 20-day period (Figure S10 & S11).
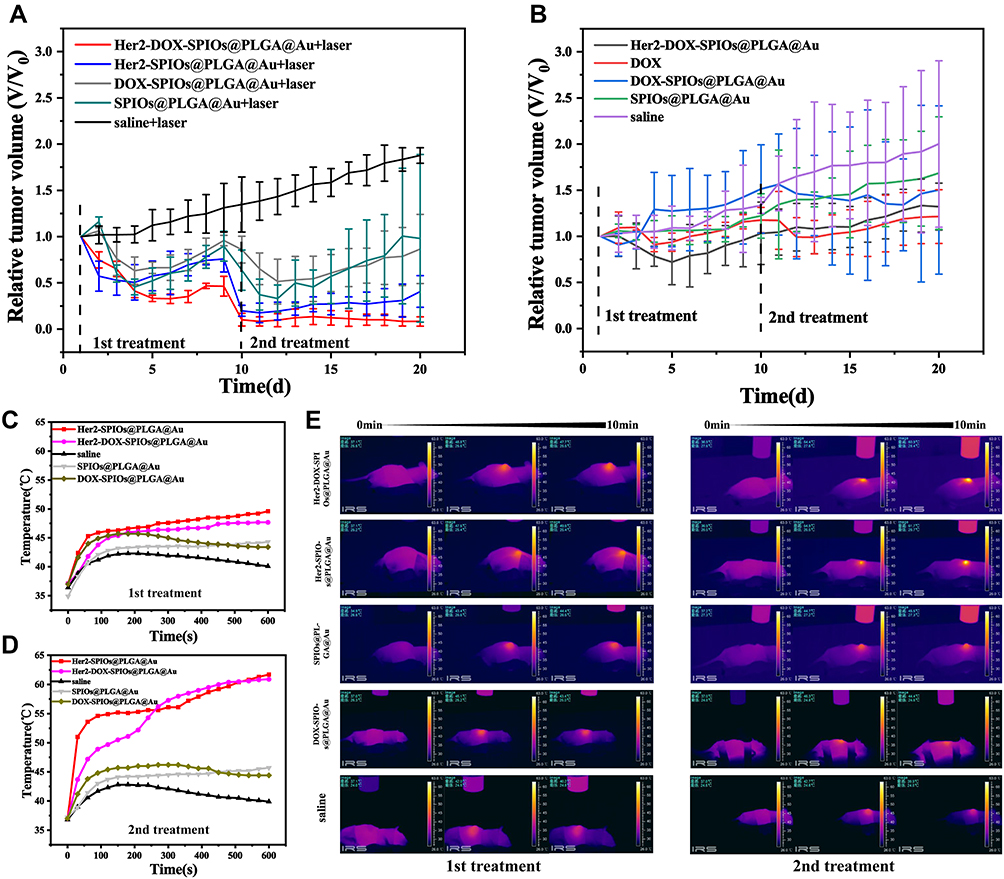 |
Figure 10 (A and B) The curve of relative tumor volume variations with different treatments during the 20 day monitoring period, the 1st treatment and 2nd treatment were performed on day 1 and day 10 respectively, data expressed as mean ± SD, n = 3. (C and D) The temperature variations of tumor under laser irradiation (10 min, 808 nm, 1 W/cm2) during 1st treatment and 2nd treatment. (E) IR thermal images of various treatment groups. |
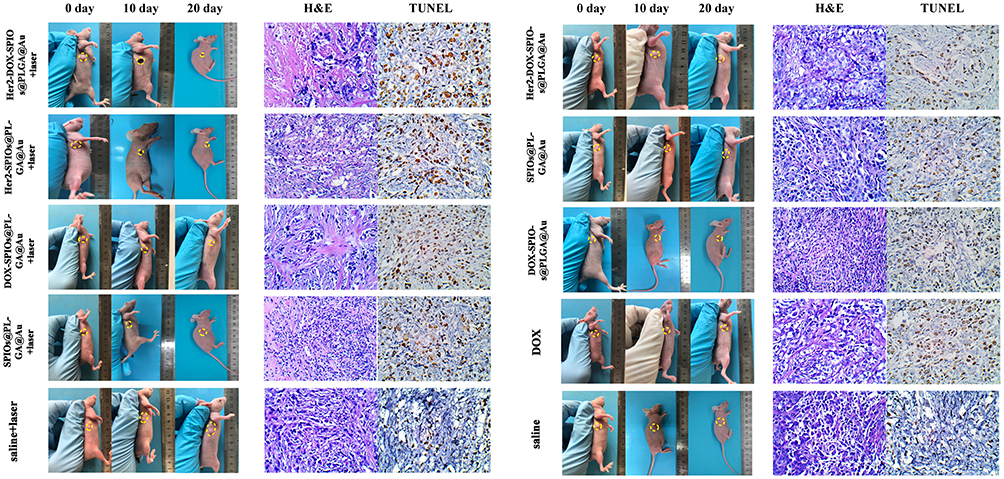 |
Figure 11 Representative photos of BT474 xenograft tumor mice modal with various treatments at 0 day, 10 day and 20 day during the period of treatment, H&E and TUNEL images of tumor tissues at the end of the 20 days (H&E, TUNEL: ×400 magnification). |
Effect of Nanoparticles on Expression of HSP70 and CRT in Tumor
At the cellular level, we found that low doses of DOX and DOX-loaded nanoparticles could promote the expression of HSP70 and CRT. Therefore, we decided to detect the expression of HSP70 and CRT in tumor in the second hour after the intravenous injection of nanoparticle solution (7 mg/mL). The experimental group of HSP70 expression was divided into five groups (control, control + laser, DOX, Her2-SG NPs, Her2-DSG NPs). As Figure 12A shows, when intravenously injected targeted nanoparticles reached the tumor, the secretion of HSP70 increased significantly. The results of quantitative analysis revealed that there were statistically significant differences between treated and untreated groups (Figure 12B). Besides, the elevation of temperature was also proved to be able to improve the expression of HSP70. Both DOX-loaded nanoparticles and DOX solution could improve the expression of HSP70 in the tumor, but HSP70 expression in the Her2-DSG NPs group was higher than that in the DOX group. It was consistent with the results of the in vitro experiment, which indicated that the expression of HSP70 on cells was promoted more by the DOX-loaded nanoparticles than by the DOX group. The immunohistochemical results of the tumor were consistent with those of Western blotting method (Figure 12C). Mice were divided into four groups (saline, DOX, Her2-SG NPs and Her2-DSG NPs) to observe the effect of nanoparticles on expression of CRT in tumor. The expression of CRT in the Her2-DSG NPs group and DOX group was higher than that in the saline group and Her2-SG NPs group (Figure 12D–12F).
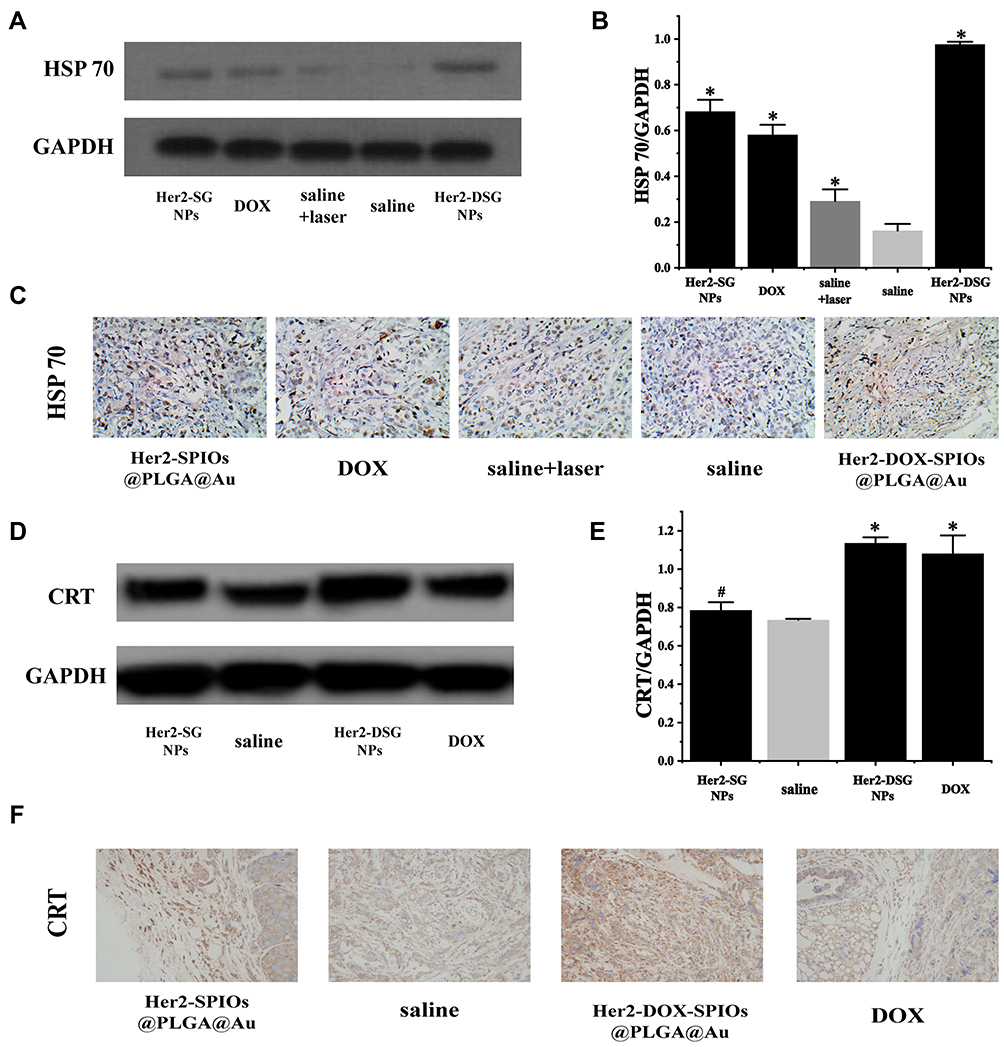 |
Figure 12 (A) Expression of HSP 70 in BT474 tumor tissue after various treatments (saline, DOX, saline with laser, Her2-SG NPs, Her2-DSG NPs) through Western blot. (B) The quantitative analysis of Western blot; (C) The immunohistological analysis images of the expression of HSP 70 on tumor tissues (×400 magnification). (D) Expression of CRT in BT474 tumor tissue after various treatments (saline, DOX, Her2-SG NPs, Her2-DSG NPs) through Western blot. (E) The quantitative analysis of Western blot. (F) The immunohistological analysis images of the expression of CRT on tumor tissues (×400 magnification). Data expressed as mean ± SD, n = 3, #p>0.05, *p<0.05. Saline group as control. |
Photothermal Mediated Tumor Remodeling and Promotion of Nanoparticles Accumulation in Tumor
The CAFs (red fluorescence +/ green fluorescence -) in tumor was significantly reduced in the photothermal group, while tumor injected with nanoparticles without laser irradiation and those injected with saline showed significant CAFs presence (Figure 13A). The quantified results of CAFs and CD31 showed that there were statistically significant differences between the tumor with and without laser irradiation (Figure 13B). These results provided a good environmental basis for subsequent chemotherapy and the eradication of tumor cells by immune cells. Twelve hours after the tumor was irradiated by laser, the mice were injected with Her2-DSG NPs again. The immunofluorescence results of the tumor tissue showed that more nanoparticles (green fluorescence) appeared in tumor irradiated with laser than in tumor without irradiation (Figure 13C). The quantified results of the fluorescence of DOX wrapped in nanoparticles showed that there were statistically significant differences between the tumor with and without laser irradiation (Figure 13D). In addition, since CD49b was a specific marker of NK cells in mice, its expression was detected by FCM to assess the number of NK cells accumulated in tumor. Mice injected with Her2-DSG NPs intravenously had more NK cells accumulated in tumor than untreated mice did (Figure 13E and 13F).
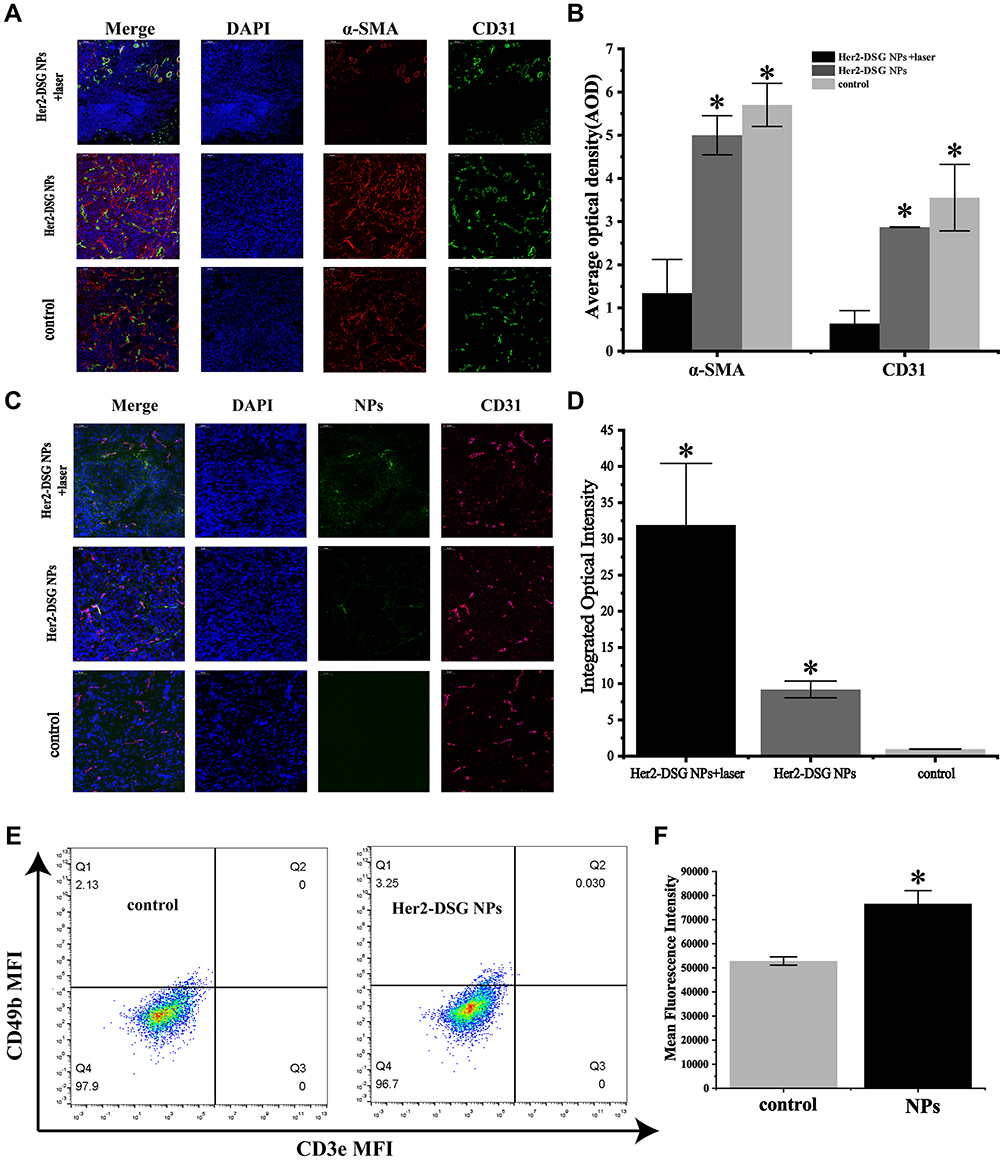 |
Figure 13 (A) The CLSM images of the number of CAFs in tumor tissues treated in different ways (Her2-DSG NPs with laser, Her2-DSG NPs, saline; scale bar: 250 μm). (B) The quantitative analysis of average optical density of CD31 and α-SMA was measured by software Image J. (C) The CLSM images of the distribution of nanoparticles in tumor. (D) The quantitative analysis of average optical density of DOX wrapped in nanoparticles was measured by software Image J. (E) Flow cytometry analysis of NK cells in tumor tissues treated in different ways (Her2-DSG NPs, saline). (F) The mean fluorescence intensity of PE. Data expressed as mean ± SD, n = 3, *p<0.05. |
Discussion and Conclusion
Traditional treatment methods for breast cancer are ineffective due to the protection effect of the tumor microenvironment to tumor cells, and it is hard to make a diagnosis at an early stage.41,42 In addition, based on the low immunogenicity of tumor cells, tumor cells often do not result in an immune response. Study have shown that CAFs around the tumor cells could effectively block the intake of drugs into tumor cells.19 Traditional nanomedicine cannot accumulate actively around the tumor through blood vessels, and only a small fraction of nanoparticles accumulate in the tumor.14,15 Above all, low treatment efficiency is bound to drug resistance of tumor cells,43,44 thus leading to poorer prognosis of cancer patients.
In this study, we developed Her2-DOX-SPIOs@PLGA@Au nanoparticles for breast cancer treatment. PLGA is one of the most widely used and successful nanocarriers in nanomedicine studies.16,45,46 Moreover, the drug-loading PLGA has the characteristics of pH-responsiveness and photothermal-responsiveness.18,21 This provides the basis for controllability of drug release. Similarly, gold has been widely used in cancer treatment.38,47,48 Compared with chemotherapy, photothermal effect mediated by gold has the advantage of repeatable treatment in a short time period with low toxicity and does not lead to drug resistance. In addition, studies19,20 show that photothermal therapy can remodel the tumor microenvironment by decreasing the number of CAFs in the tumor, and enhance the accumulation of nanomedicine after the stroma decreased. This property of gold in the NIR region also makes it useful for PA imaging.47,48 As a new imaging method, PA imaging has been popular among researchers in recent years. It has the same characteristics as ultrasound imaging, such as non-radiation and real-time imaging. Hengte Ke et al.16 combine the real-time performance of US imaging with the high spatial resolution of MRI imaging to improve the diagnostic capability. In our study, we also realized PA/MRI dual-modal imaging through MRI imaging based on SPOIs, and guide the nanomedicine treatment of breast cancer.
Her2-positive breast cancer is sensitive to chemotherapeutic drugs,49,50 which results in better chemotherapeutic effect. The Her2-targeted nanoparticles we developed are promising in the treatment of Her2-positive breast cancer. This nano-delivery system can reduce the concentration of chemotherapeutic drugs in normal tissue and increase the concentration of drugs in the tumor site, which can compensate well for the disadvantages of traditional chemotherapy for breast cancer. In addition, the pH and photothermal responsiveness of PLGA combined with the targeting function of NPs make the delivery of chemotherapy drugs more controllable, which effectively reduces the toxicity to normal tissues caused by these drugs. Moreover, the raw materials for the synthesis of nanoparticles have superior biosafety and biocompatibility.16,45 All the above efforts have maximized the biosafety, specificity, and controllability of the Her2-DSG NPs we developed.
Recently, chemical-photothermal induced ICD effect of tumor cells has become a novel strategy for tumor immunotherapy.30 Tumor cells that undergo ICD effect can release immunostimulatory molecules, such as HSP70, CRT, and high mobility group box 1 (HMGB 1).36,51 These immunogenic proteins enhance the ability of immune cells to recognize tumor cells. More importantly, DOX has been reported to enhance antitumor immunogenicity by inducing an ICD effect.27 Therefore, the DOX-loaded nanoparticles we developed can enhance the ICD effect at a tumor site specifically. Moreover, tumor microenvironment remodeling mediated by photothermal therapy increases the accessibility of nanoparticles to tumor cells,19 which undoubtedly amplifies the antitumor and ICD effect brought by DOX.
However, we only developed a BT474 breast cancer cell nude mice model, and lacked a BT474/Adr breast cancer model. We will conduct a systematic study on the treatment of BT474/Adr breast cancer models in future studies. Moreover, T-cell immune activation could not be evaluated in the nude mice model, which has no thymus. Therefore, only NK cells and other non-specific immune activation were evaluated in our study.
In conclusion, we successfully prepared Her2-DOX-SPIOs@PLGA@Au nanoparticles. In our study, nanoparticles showed their Her2-targeting function and better antitumor effect. Chemical-photothermal therapy of nanoparticles can enhance the expression of HSP70 and CRT in tumor cell or tissue, which realizes immune activation based on an ICD effect. In addition, the tumor microenvironment remodeling mediated by photothermal therapy amplifies the antitumor effect of chemical-photothermal therapy and the ICD effect. These results indicate that the design of this treatment strategy is very promising.
Acknowledgments
The authors are grateful to Ph.D. Fangfei Yin and Professor Zhiguo Zhou for assistance. This work was supported by the National Natural Science Foundation of China (Grant No. 81571678, 81102014, 81801697, 82071954).
These authors contributed equally: Dongdong Zheng and Caifeng Wan.
Disclosure
The authors report no conflicts of interest for this work.
References
1. Chen C-Y, Yang C-Y, Chen Y-C, Shih C-W, Lo -S-S, Lin C-H. Decreased expression of stomatin predicts poor prognosis in HER2-positive breast cancer. BMC Cancer. 2016;16(1):697. doi:10.1186/s12885-016-2681-7
2. Gianni L, Pienkowski T, Im Y-H, et al. Efficacy and safety of neoadjuvant pertuzumab and trastuzumab in women with locally advanced, inflammatory, or early HER2-positive breast cancer (NeoSphere): a randomised multicentre, open-label, Phase 2 trial. Lancet Oncol. 2012;13(1):25–32. doi:10.1016/S1470-2045(11)70336-9
3. Anna BWSR, Nowak K, Richard A. Lak, Synergy between Chemotherapy and Immunotherapy in the Treatment of Established Murine Solid Tumors. Cancer Res. 2003;63(15):4490.
4. Teng MW, Galon J, Fridman WH, Smyth MJ. From mice to humans: developments in cancer immunoediting. J Clin Invest. 2015;125(9):3338–3346. doi:10.1172/JCI80004
5. Robert D. Schreiber, Cancer Immunoediting: integrating Immunity’s Roles in Cancer Suppression and Promot. Science. 2011;331(6024):1565–1570.
6. Kalluri R. The biology and function of fibroblasts in cancer. Nat Rev Cancer. 2016;16(9):582–598.
7. Dumont N, Liu B, Defilippis RA, et al. Breast fibroblasts modulate early dissemination, tumorigenesis, and metastasis through alteration of extracellular matrix characteristics. Neoplasia. 2013;15(3):249–262. doi:10.1593/neo.121950
8. De Wever O, Van Bockstal M, Mareel M, Hendrix A, Bracke M. Carcinoma-associated fibroblasts provide operational flexibility in metastasis. Semin Cancer Biol. 2014;25:33–46. doi:10.1016/j.semcancer.2013.12.009
9. Mark B, Gatenby RA, Dalton WS. Meads, Environment-mediated drug resistance: a major contributor to minimal residual disease. Nat Rev Cancer. 2009;9(9):665–674. doi:10.1038/nrc2714
10. Paraiso KHT, Smalley KSM. Fibroblast-mediated drug resistance in cancer. Biochem Pharmacol. 2013;85(8):1033–1041.
11. Nduom EK, Weller M, Heimberger AB. Immunosuppressive mechanisms in glioblastoma. Neuro Oncol. 2015;17(Suppl 7):vii9–vii14. doi:10.1093/neuonc/nov151
12. Raffaghello L, Dazzi F. Classification and biology of tumour associated stromal cells. Immunol Lett. 2015;168(2):175–182. doi:10.1016/j.imlet.2015.06.016
13. Harper J, Sainson RC. Regulation of the anti-tumour immune response by cancer-associated fibroblasts. Semin Cancer Biol. 2014;25:69–77. doi:10.1016/j.semcancer.2013.12.005
14. Analysis of nanoparticle delivery to tumours. Nat Rev Mater. 1;2016.
15. Dai Q, Wilhelm S, Ding D, et al. Quantifying the Ligand-Coated Nanoparticle Delivery to Cancer Cells in Solid Tumors. ACS Nano. 2018;12(8):8423–8435.
16. Ke H, Wang J, Tong S, et al. Gold nanoshelled liquid perfluorocarbon magnetic nanocapsules: a nanotheranostic platform for bimodal ultrasound/magnetic resonance imaging guided photothermal tumor ablation. Theranostics. 2013;4(1):12–23. doi:10.7150/thno.7275
17. El-Sayed QA. Cancer Cell Imaging and Photothermal Therapy in the Near-Infrared Region by Using Gold Nanorods. JACS. 2005;128(6):2115–2120.
18. Jing L, Liang X, Li X, et al. Mn-porphyrin conjugated Au nanoshells encapsulating doxorubicin for potential magnetic resonance imaging and light triggered synergistic therapy of cancer. Theranostics. 2014;4(9):858–871. doi:10.7150/thno.8818
19. Tan T, Hu H, Wang H, et al. Bioinspired lipoproteins-mediated photothermia remodels tumor stroma to improve cancer cell accessibility of second nanoparticles. Nat Commun. 2019;10(1):3322.
20. Chen Q, Liu G, Liu S, et al. Remodeling the Tumor Microenvironment with Emerging Nanotherapeutics. Trends Pharmacol Sci. 2018;39(1):59–74. doi:10.1016/j.tips.2017.10.009
21. Jing L, Liang X, Li X, Yang Y, Dai Z. Covalent attachment of Mn-porphyrin onto doxorubicin-loaded poly(lactic acid) nanoparticles for potential magnetic resonance imaging and pH-sensitive drug delivery. Acta Biomater. 2013;9(12):9434–9441. doi:10.1016/j.actbio.2013.08.018
22. Li J, Ke W, Wang L, et al. Self-sufficing H2O2-responsive nanocarriers through tumor-specific H2O2 production for synergistic oxidation-chemotherapy. J Control Release. 2016;225:64–74. doi:10.1016/j.jconrel.2016.01.029
23. Li WH, Ding K, Tian HR, et al. Supercapacitors: conductive Metal–Organic Framework Nanowire Array Electrodes for High‐Performance Solid‐State Supercapacitors. Adv Funct Mater. 2017;27(27);12.
24. Li J, Dirisala A, Ge Z, et al. Therapeutic Vesicular Nanoreactors with Tumor-Specific Activation and Self-Destruction for Synergistic Tumor Ablation. Angew Chem Int Ed Engl. 2017;56(45):14025–14030. doi:10.1002/anie.201706964
25. Li J, Li Y, Wang Y, et al. Polymer Prodrug-Based Nanoreactors Activated by Tumor Acidity for Orchestrated Oxidation/Chemotherapy. Nano Lett. 2017;17(11):6983–6990. doi:10.1021/acs.nanolett.7b03531
26. Aso Y, Yoshioka S, Terao T. Effect of temperature on mechanisms of drug release and matrix degradation of poly(d, l-lactide) microspheres. J Controlled Release. 1994;31(1):33–39. doi:10.1016/0168-3659(94)90248-8
27. Li TF, Li K, Zhang Q, et al. Dendritic cell-mediated delivery of doxorubicin-polyglycerol-nanodiamond composites elicits enhanced anti-cancer immune response in glioblastoma. Biomaterials. 2018;181:35–52.
28. Kodumudi KN, Woan K, Gilvary DL, Sahakian E, Wei S, Djeu JY. A novel chemoimmunomodulating property of docetaxel: suppression of myeloid-derived suppressor cells in tumor bearers. Clin Cancer Res. 2010;16(18):4583–4594. doi:10.1158/1078-0432.CCR-10-0733
29. Haggerty TJ, Dunn IS, Rose LB, et al. Topoisomerase inhibitors modulate expression of melanocytic antigens and enhance T cell recognition of tumor cells. Cancer Immunol Immunother. 2011;60(1):133–144. doi:10.1007/s00262-010-0926-x
30. Duan X, Chan C, Lin W. Nanoparticle-Mediated Immunogenic Cell Death Enables and Potentiates Cancer Immunotherapy. Angew Chem Int Ed Engl. 2019;58(3):670–680. doi:10.1002/anie.201804882
31. Li J, Anraku Y, Kataoka K. Self-Boosting Catalytic Nanoreactors Integrated with Triggerable Crosslinking Membrane Networks for Initiation of Immunogenic Cell Death by Pyroptosis. Angew Chem Int Ed Engl. 2020;59(32):13526–13530. doi:10.1002/anie.202004180
32. Antoine Mhoret YP, Burg C, and Jacques Le Pendu. Co-Segregation of Tumor Immunogenicity with Expression of Inducible but Not Constitutive hsp7O in Rat Colon Carcinomas. J Immunol. 1995;155:740–747.
33. Schmitt E, Gehrmann M, Brunet M, Multhoff G, Garrido C. Intracellular and extracellular functions of heat shock proteins: repercussions in cancer therapy. J Leukoc Biol. 2007;81(1):15–27. doi:10.1189/jlb.0306167
34. Multhoff G, Pockley AG, Schmid TE, Schilling D. The role of heat shock protein 70 (Hsp70) in radiation-induced immunomodulation. Cancer Lett. 2015;368(2):179–184.
35. Wan C. Heat shock proteins transfer peptides during antigen processing and CTL priming. Immunogenetics. 1994;39:93–98.
36. Galluzzi L, Vitale I, Aaronson SA. Molecular mechanisms of cell death: recommendations of the Nomenclature Committee on Cell Death 2018. Cell Death Differ. 2018;25(3):486–541.
37. Xu L, Wan C, Du J, et al. Synthesis, characterization, and in vitro evaluation of targeted gold nanoshelled poly(d, l-lactide-co-glycolide) nanoparticles carrying anti p53 antibody as a theranostic agent for ultrasound contrast imaging and photothermal therapy. J Biomater Sci Polym. 2017;28(4):415–430. doi:10.1080/09205063.2016.1277828
38. Dong YH, Wan C, Wan C, et al. Her2-Functionalized Gold-Nanoshelled Magnetic Hybrid Nanoparticles: a Theranostic Agent for Dual-Modal Imaging and Photothermal Therapy of Breast Cancer. Nanoscale Res Lett. 2019;14(1):235. doi:10.1186/s11671-019-3053-4
39. Park CJ, Seo YS. Heat Shock Proteins: A Review of the Molecular Chaperones for Plant Immunity. Plant Pathol J. 2015;31(4):323–333. doi:10.5423/PPJ.RW.08.2015.0150
40. Thinh DD, Rasid MH, Deris ZM, Shazili NA, De Boeck G, Wong LL. Putative Roles for Metallothionein and HSP70 Genes in Relation with Heavy Metal Accumulation and Parasitic Cymothoid in the Fish Nemipterus furcosus. Arch Environ Contam Toxicol. 2016;71(4):530–540. doi:10.1007/s00244-016-0310-8
41. Domper Arnal MJ, Ferrandez Arenas A, Lanas Arbeloa A. Esophageal cancer: risk factors, screening and endoscopic treatment in Western and Eastern countries. World J Gastroenterol. 2015;21(26):7933–7943.
42. Wang L. Early Diagnosis of Breast Cancer. Sensors. 2017;17(7).
43. Ledzewicz U, Wang S, Schattler H, Andre N, Heng MA, Pasquier E. On drug resistance and metronomic chemotherapy: A mathematical modeling and optimal control approach. Math Biosci Eng. 2017;14(1):217–235. doi:10.3934/mbe.2017014
44. Feng X, Wei Z, Zhang S, Du Y, Zhao H. A Review on the Pathogenesis and Clinical Management of Placental Site Trophoblastic Tumors. Front Oncol. 2019;9:937. doi:10.3389/fonc.2019.00937
45. Ye F, Barrefelt A, Asem H, et al. Biodegradable polymeric vesicles containing magnetic nanoparticles, quantum dots and anticancer drugs for drug delivery and imaging. Biomaterials. 2014;35(12):3885–3894. doi:10.1016/j.biomaterials.2014.01.041
46. Gao W, Zheng Y, Wang R, et al. A smart, phase transitional and injectable DOX/PLGA-Fe implant for magnetic-hyperthermia-induced synergistic tumor eradication. Acta Biomater. 2016;29:298–306. doi:10.1016/j.actbio.2015.09.037
47. Kim T, Zhang Q, Li J, Zhang L, Jokerst JV. A Gold/Silver Hybrid Nanoparticle for Treatment and Photoacoustic Imaging of Bacterial Infection. ACS Nano. 2018;12(6):5615–5625. doi:10.1021/acsnano.8b01362
48. Zhou G, Xiao H, Li X, et al. Gold nanocage decorated pH-sensitive micelle for highly effective photothermo-chemotherapy and photoacoustic imaging. Acta Biomater. 2017;64:223–236. doi:10.1016/j.actbio.2017.10.018
49. Loibl S, Gianni L. HER2-positive breast cancer. Lancet. 2017;389(10087):2415–2429. doi:10.1016/S0140-6736(16)32417-5
50. Maughan LM, Ham PS. Treatment of Breast Cancer. Am Fam Physician. 2010;81(11):1339–1346.
51. Kepp O, Senovilla L, Vitale I. Consensus guidelines for the detection of immunogenic cell death. OncoImmunology. 2014;3(9):e955691. doi:10.4161/21624011.2014.955691
 © 2020 The Author(s). This work is published and licensed by Dove Medical Press Limited. The full terms of this license are available at https://www.dovepress.com/terms.php and incorporate the Creative Commons Attribution - Non Commercial (unported, v3.0) License.
By accessing the work you hereby accept the Terms. Non-commercial uses of the work are permitted without any further permission from Dove Medical Press Limited, provided the work is properly attributed. For permission for commercial use of this work, please see paragraphs 4.2 and 5 of our Terms.
© 2020 The Author(s). This work is published and licensed by Dove Medical Press Limited. The full terms of this license are available at https://www.dovepress.com/terms.php and incorporate the Creative Commons Attribution - Non Commercial (unported, v3.0) License.
By accessing the work you hereby accept the Terms. Non-commercial uses of the work are permitted without any further permission from Dove Medical Press Limited, provided the work is properly attributed. For permission for commercial use of this work, please see paragraphs 4.2 and 5 of our Terms.