")
Back to Journals » Cancer Management and Research » Volume 8
Hemoglobin levels and quality of life in patients with symptomatic chemotherapy-induced anemia: the eAQUA study
Authors Mouysset J, Freier B, van den Bosch J, Briac Levaché C, Bols A, Werner Tessen H, Belton L, Bohac C, Terwey J, Tonini G
Received 7 May 2015
Accepted for publication 17 August 2015
Published 21 January 2016 Volume 2016:8 Pages 1—10
DOI https://doi.org/10.2147/CMAR.S88110
Checked for plagiarism Yes
Review by Single anonymous peer review
Peer reviewer comments 2
Editor who approved publication: Dr Kenan Onel
Jean-Loup Mouysset,1 Beata Freier,2 Joan van den Bosch,3 Charles Briac Levaché,4 Alain Bols,5 Hans Werner Tessen,6 Laura Belton,7 G Chet Bohac,8 Jan-Henrik Terwey,9 Giuseppe Tonini10
1Department of Medical Oncology, Clinique Rambot Provencale, Aix en Provence, France; 2Clinical Oncology, Wojewodzki Szpital Specjalistyczny, Wroclaw, Poland; 3Department of Internal Medicine/Oncology, Albert Schweitzer Ziekenhuis locatie Dordwijk, Dordrecht, the Netherlands; 4Radiotherapy Service, Medical Oncology, Polyclinique Francheville, Périgueux, France; 5Central Pharmacy, AZ Sint-Jan Brugge-Oostende AV, Brugge, Belgium; 6Private Oncology Practice. Goslar, Germany; 7LB Biostatistics, London, UK; 8Clinical Research, Amgen Inc., Thousand Oaks, CA, USA; 9Medical Development – Oncology, Amgen (Europe) GmbH, Zug, Switzerland; 10Department of Medical Oncology, Università Campus Bio-Medico, Roma, Italy
Purpose: To assess hemoglobin (Hb) outcomes and fatigue-related quality-of-life (QoL) (electronic assessment) in patients with solid tumors and symptomatic chemotherapy-induced anemia receiving cytotoxic chemotherapy and darbepoetin alfa (DA) or another erythropoiesis-stimulating agent according to European indication.
Methods: eAQUA was a Phase IV prospective observational study. The primary outcome (assessed in the primary analysis set [PAS]: patients receiving one or more DA dose who had baseline and week 9 assessments for Hb and QoL) was the proportion of patients receiving DA having both Hb increases ≥1 g/dL and improved QoL between baseline and week 9. Functional Assessment of Cancer Therapy-Fatigue (FACT-F) subscale scores were anchored to fatigue visual analog scale scores to determine the minimally important difference for improved QoL. Overall data/data over time are reported for the full analysis set (patients receiving one or more erythropoiesis-stimulating agent dose, n=1,158); week 9 data (ie, data relating to the primary and secondary outcomes) are reported for the PAS (n=510). Baseline and safety data are included for both the full analysis set and PAS.
Results: In the PAS, 69% of patients had stage IV disease and 96% were fatigued. The minimally important difference in FACT-F change score for QoL improvement was 3.5. From baseline to week 9, 32% (95% confidence interval: 28%–36%) of patients had both improved QoL and an Hb increase ≥1 g/dL; proportions were similar across the most common tumor types. At week 9, 49% and 58% of patients had improved QoL or Hb increases ≥1 g/dL, respectively; 70% and 76% had QoL or Hb improvements between baseline and study end, respectively. In the PAS, 16% of patients required transfusions and 32% required iron supplementation. Few patients (<1%) reported adverse drug reactions.
Conclusion: In this study, patients with solid tumors receiving DA per European indication for symptomatic chemotherapy-induced anemia had clinically meaningful improvements in Hb and QoL.
Keyword: darbepoetin alfa, erythropoiesis-stimulating agent, fatigue visual analog scale, Functional Assessment of Cancer Therapy-Fatigue subscale, transfusion
Introduction
Fatigue is a common symptom in patients with cancer1–3 that can adversely impact quality of life (QoL).4 Many studies report that for cancer patients receiving chemotherapy, fatigue incidence is ~60%;5 however, reported prevalence rates vary widely depending on how fatigue is defined and measured, as well as the patient population studied.
Although it is difficult to manage fatigue directly caused by disease, effective therapies exist for chemotherapy-induced anemia (CIA), and correcting anemia in patients receiving chemotherapy is, therefore, recommended as a method for managing fatigue.6–10 The effectiveness of erythropoiesis-stimulating agents (ESAs) and/or red blood cell (RBC) transfusions in managing CIA by raising hemoglobin (Hb) levels is well documented.11,12 However, data on the impact of such treatments on fatigue are more limited.
A major difficulty in studying fatigue in cancer is that its etiology is often multifactorial, with both disease- and treatment-related effects likely to contribute. Consequently, many tools aimed at assessing fatigue in patients with cancer have been developed. Multi-item measures, such as the Functional Assessment of Cancer Therapy-Fatigue (FACT-F) subscale, are generally preferred in research settings as they aim to capture the complex nature of cancer-related fatigue. Single-item measures (eg, the fatigue visual analog scale [VAS]13) capture a patient’s perception of their fatigue and are often preferred in clinical practice as they are quick and simple to apply. However, as the level and impact of fatigue for a given patient is subjective, the clinical relevance of a change in score can sometimes be difficult to interpret.
In the eAQUA (electronic assessment of QoL in patients with symptomatic anemia) clinical practice study, we used an anchor-based approach14–17 to calculate the minimally important difference (MID) for a fatigue-related QoL improvement in patients with CIA receiving darbepoetin alfa (DA) or another ESA according to current European indication. The MID was defined as the smallest change in QoL score perceived to be beneficial by this population of patients. eAQUA also aimed to assess the effectiveness of ESAs at improving Hb levels, which was an important assessment because although DA has been available for several years, there are few data on its use in line with the recently updated European indication for symptomatic CIA.18 This mandates that DA should now only be used in patients with a baseline Hb level of ≤10 g/dL. eAQUA also adds to the limited data relating to improvements in Hb levels and QoL in clinical practice.
Methods
Study design
eAQUA (NCT01444456) was a large, Phase IV, multicenter, international, prospective, observational study of patients who were receiving systemic chemotherapy for solid tumors and who were receiving DA or another ESA to treat symptomatic CIA. Although DA is the focus of this study, local regulations in some countries do not permit observational study participation by only patients receiving a specific agent in a drug class. Therefore, enrollment of patients who were receiving an ESA other than DA was permitted in these countries. Target recruitment was ~1,300 patients across approximately ten countries and the enrollment period was ~12 months. Data collection was from enrollment up to 4 weeks after the last recorded dose of ESA or current chemotherapy regimen, the date of withdrawal, or a maximum of 13 weeks after enrollment (whichever occurred first).
The study protocol was approved by the relevant Independent Ethics Committee and the study was conducted in compliance with International Conference on Harmonization Good Clinical Practice guidelines and with the ethical standards laid down in the 1964 Declaration of Helsinki. All patients provided informed consent before data collection commenced.
Study outcomes
The primary outcome was the proportion of patients receiving DA who had both an Hb increase ≥1 g/dL and a QoL improvement, between baseline and week 9. Secondary outcomes included: the proportion of patients with improved QoL and an Hb increase ≥1 g/dL at any time up to end of study (EOS); the proportion of patients with QoL improvement and an Hb increase ≥1 g/dL at week 9, by most common tumor type (tumor types occurring in ~40+ patients); the proportion of patients with Hb increase ≥1 g/dL by EOS; and time to first Hb increase ≥1 g/dL and characterization of the QoL improvement. As the primary endpoint of this study is a composite one including both Hb and QoL components, the Hb, QoL and MID determination data are reported ahead of the primary endpoint data, which were derived from the former.
The use of RBC transfusions and iron supplementation during the study were recorded, as were data on DA exposure. Treatment-emergent adverse drug reactions (ADRs) reported up to and including the last dose of study drug plus 28 days were also recorded.
Patients
Key inclusion criteria
Eligible patients were ≥18 years of age, had an Eastern Cooperative Oncology Group performance status of 0–2, and had been diagnosed with a solid tumor and symptomatic CIA. They were required to be undergoing chemotherapy and were expected to receive ≥8 additional weeks of chemotherapy after enrollment and to have started treatment with an ESA in line with the relevant European Summaries of Product Characteristics for symptomatic CIA. Symptomatic CIA was defined as an Hb level ≤10.0 g/dL (from most recent sample) and physician confirmation of one or more anemia symptom/sequelae. Patients also needed to have the ability and awareness to complete electronic fatigue assessments and to provide informed consent.
Patients in receipt of ESA treatment or RBC transfusion within 28 days prior to enrollment and/or with a known primary benign/malignant hematologic disorder that can cause anemia were excluded.
Treatments and assessments
The decision to prescribe treatment must have been freely undertaken by the clinician prior to considering enrolling a patient in the study. Treatment administration was, therefore, independent and dissociated from participation in the study. No study-specific clinical tests were required; all medical data collected on electronic case report forms (eCRFs) were expected to be part of standard patient records. Common chemotherapy regimens for each cancer type were prespecified in the eCRF. For simplicity, these were referred to as “standard” regimens. Regimens not listed in the eCRF could be added manually by the treating clinician and were referred to as “non-standard” regimens.
FACT-F subscale scores and fatigue VAS scores were used to assess QoL. FACT-F scores range from 0 to 52, with higher scores indicating better QoL. VAS scores range from 0 to 100, with 0 being least fatigued. Patients completed electronic fatigue assessments during visits (no more frequently than every 7 days) for receipt of chemotherapy and/or ESA treatment.
Statistical analyses
The main analysis set for the primary and secondary outcomes (the primary analysis set [PAS]) included patients who had received one or more DA dose and had baseline and week 9 assessments for Hb, FACT-F, and VAS. The PAS is a subset of the full analysis set (FAS) which consisted of all patients who received one or more dose of an ESA. Overall data and data over time are reported for the FAS; week 9 data are reported for the PAS (ie, data that relate to the primary and secondary outcomes). Baseline data and safety information are included for both the FAS and PAS for completeness.
Baseline was defined as the day of (day 1), or the 14 days prior to, the initiation of an ESA. If more than one result was available, data for the day closest to day 1 was included. Due to the observational nature of the study and potential variation in ESA dosing schedules, Hb, FACT-F, and VAS data closest to day 57 and within days 43–70 (inclusive) were used to calculate the week 9 assessments. Note that for data presented over time (ie, by study week), week 9 constitutes study days 57–63 only (week 1: days 1–7, week 2: days 8–14, … week 13: days 85–91).
The MID was determined using a modified anchor-based approach16 based on FACT-F and VAS change scores between baseline and week 9. The MID was derived for PAS patients as the mean FACT-F change score for patients who had a prespecified small improvement in VAS score. A patient was deemed to have improved QoL if their FACT-F change score was greater than or equal to the calculated MID. In the literature, a seven-point improvement is considered a small but clinically relevant change in VAS score.19 However, to ensure that only those patients with a minimal improvement in VAS were used to determine the MID for our study, we prespecified that a VAS change score of 7±3, 5±3, 5±2, or 5±1 would be used depending on the number of patients in each of these categories compared with 20% of the number of patients who had a VAS improvement of ≥1 point. The first category to have fewer patients than 20% of the number of patients with a VAS improvement of ≥1 point was used to determine the MID.
For the time-to-event analyses, time was measured in days from day 1 (day of ESA initiation) based on Kaplan–Meier methodology. Data for patients who did not experience the event of interest were censored at their EOS visit.
As an exploratory analysis, univariate logistic regression was used to estimate the odds of having improved QoL at week 9 for patients who had an Hb increase ≥1 g/dL compared with an Hb increase <1 g/dL at week 9. Further covariates were investigated individually for inclusion in this model at a significance level of 10%. These were baseline covariates (age [years], sex, tumor type, disease stage, chemotherapy type [platinum, non-platinum], baseline Hb, line of chemotherapy) and post-baseline covariates (iron use [by week 9], concomitant medication use [by week 9]).
Results
Patients
Overall, 1,262 patients were enrolled from nine European countries between 10 October, 2011 and 28 May, 2013; the last patient visit was on 27 August 2013. In total, 1,158 patients received one or more ESA dose and so comprised the FAS. Of these, 24 patients received an ESA other than DA (epoetin alfa n=20, epoetin beta n=1, epoetin zeta n=3) and, of these, nine patients (epoetin alfa n=6, epoetin beta n=1, epoetin zeta n=2) received another ESA and had baseline and week 9 Hb and QoL assessments. Overall, 1,134 patients received DA and 510 of these had both baseline and week 9 Hb and QoL data, and so comprised the PAS.
Baseline demographics and disease characteristics were similar for the FAS and the PAS (Table 1). Mean age was 64 years and breast cancer was the most common tumor type. Most patients had an Eastern Cooperative Oncology Group performance status of 0/1 and had stage III/IV disease. Fatigue was the most common anemia symptom, being reported in nearly all of the patients. Overall, just over one-quarter of patients were receiving curative-intent treatment and approximately three-quarters were in their first chemotherapy cycle or had completed between one and three cycles. Most patients were receiving concomitant therapy, with antiemetics and corticosteroids being the most common.
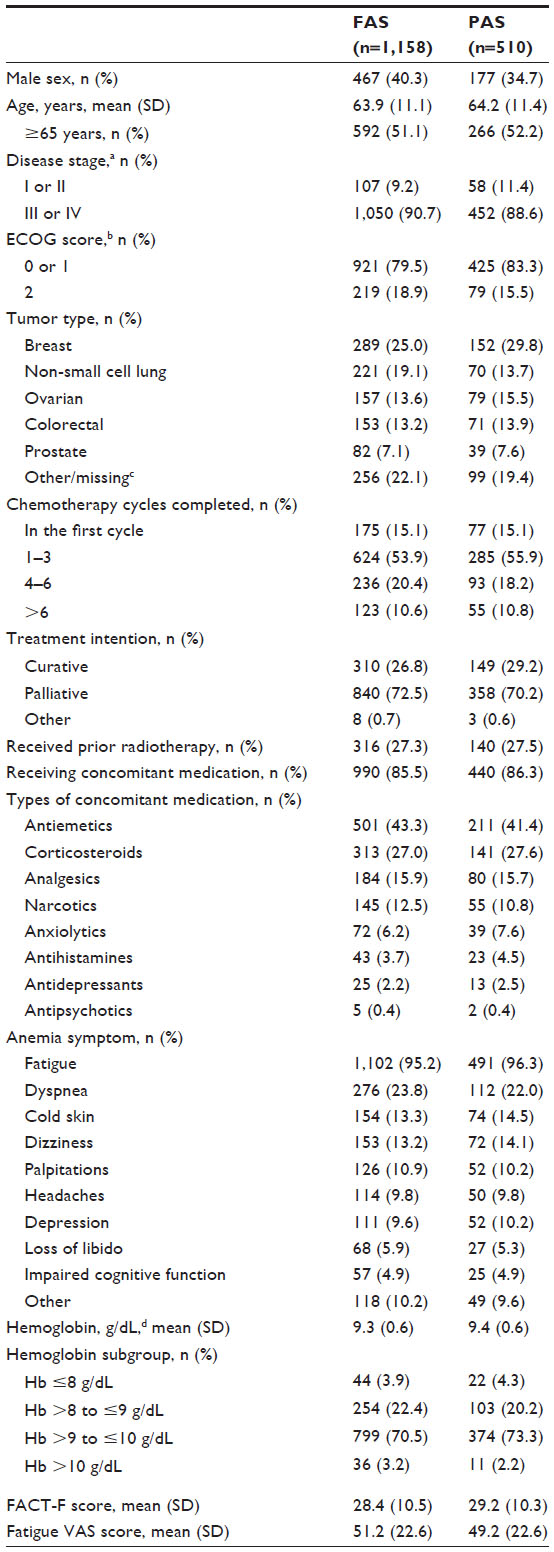 | Table 1 Baseline characteristics of the FAS and PAS |
The types of chemotherapy received differed by tumor type. No “standard” (as prespecified in the eCRF) regimen was received by ≥10% of breast cancer patients in the FAS or PAS (n=289 and n=152, respectively). In both the FAS and PAS (respectively), paclitaxel (26% and 25%), docetaxel (17% and 18%), trastuzumab (14% and 11%), vinorelbine (12% and 11%), and capecitabine (9% and 11%) were the most commonly used agents in “non-standard” regimens. Among patients with ovarian cancer, the most common “standard” regimens in the FAS and PAS (n=157 and n=79, respectively) were carboplatin plus paclitaxel (29% in both populations) and carboplatin plus gemcitabine (9% and 11%, respectively). Carboplatin (17% and 20%), paclitaxel (16% and 14%), topotecan (12% and 9%), gemcitabine (10% and 15%), and bevacizumab (10% and 11%) were the most commonly used agents in “non-standard” regimens (for FAS and PAS, respectively). In patients with colorectal cancer in the FAS and PAS (n=153 and n=71, respectively), 5-fluorouracil (5-FU) plus oxaliplatin (14% in both populations), 5-FU plus irinotecan (13% and 20%), capecitabine plus oxaliplatin (12% and 10%), and 5-FU plus irinotecan plus bevacizumab (9% and 11%) were the most common “standard” regimens. Of the “non-standard” regimens used, 5-FU (18% in both populations), irinotecan (12% and 13%), and oxaliplatin (11% and 10%) were the most commonly used agents (for FAS and PAS, respectively). Among patients with non-small cell lung cancer, the most common “standard” regimens in the FAS and PAS (n=221 and n=70, respectively) were carboplatin plus gemcitabine (16% in both populations), carboplatin plus pemetrexed (11% and 6%), and cisplatin plus vinorelbine (6% and 13%). All the patients with prostate cancer in the FAS and the PAS (n=82 and n=39, respectively) received “non-standard” regimens; in these, docetaxel (67% and 59%) and cabazitaxel (16% and 26%) were the most commonly used agents.
Change in Hb levels
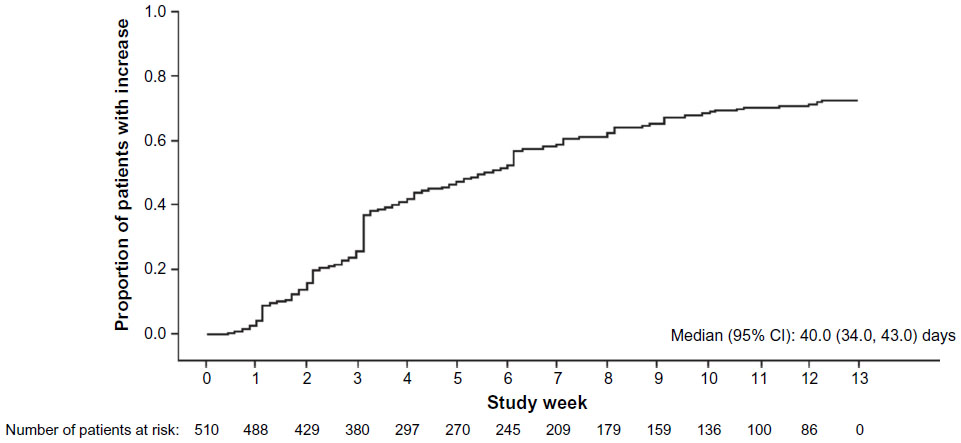
Mean Hb levels over time for the FAS are shown in Figure 1. For the PAS, the mean Hb change at week 9 was 1.2 (standard deviation [SD]: 1.4) g/dL; the median (quartile 1, quartile 3) Hb change was 1.2 (0.3, 2.0) g/dL. At week 9, 295 patients (58% [95% confidence intervals {CI}: 54–62]) had an Hb increase ≥1 g/dL. Up to EOS, 386 patients (76% [95% CI: 72–79]) had an Hb increase ≥1 g/dL (at any point). The median time to first Hb increase ≥1 g/dL was 36.5 (95% CI: 30–43) days (Figure 2); the Kaplan–Meier estimate for the proportion of patients with an Hb increase ≥1 g/dL by EOS was 79% (95% CI: 75–83).
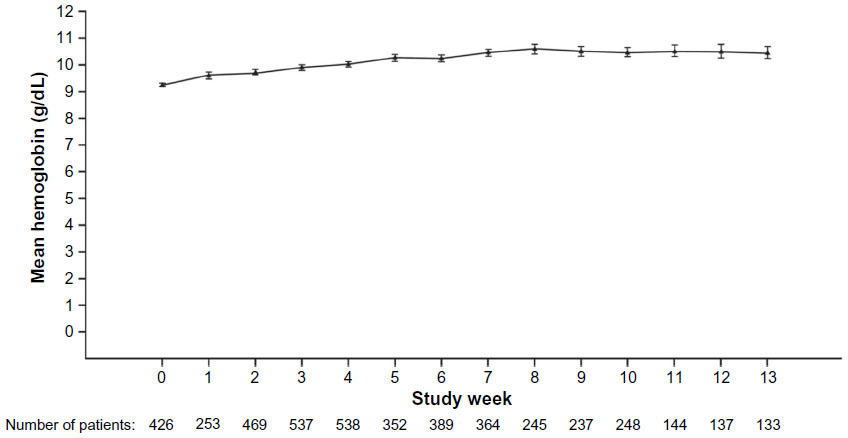 | Figure 1 Mean (95% confidence intervals) change in hemoglobin levels over time in the full analysis set. |
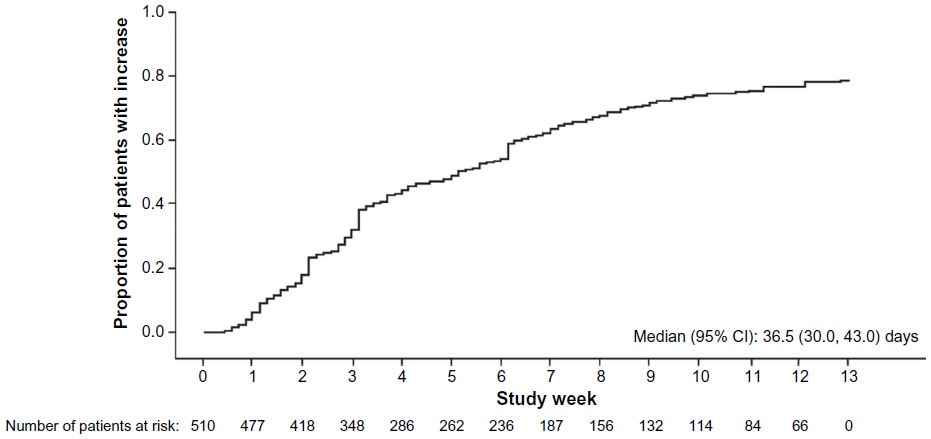 | Figure 2 Time to first hemoglobin increase ≥1 g/dL in the primary analysis set. |
Change in QoL scores
Mean FACT-F and VAS scores for the FAS over time are shown in Figure 3. In the PAS, mean change in FACT-F and VAS scores between baseline and week 9 were 3.5 (SD: 10.5) and 4.3 (SD: 24.7), with 64% and 54% of patients showing an improvement (of ≥1 point) in score, respectively (Table 2).
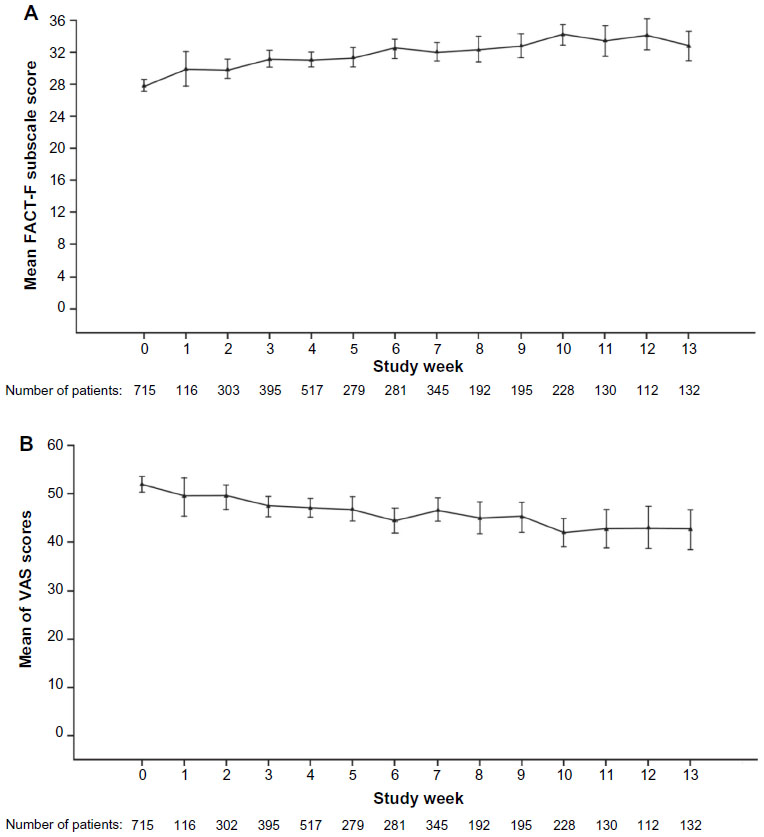 | Figure 3 FACT-F subscale and fatigue VAS scores over time in the full analysis set. |
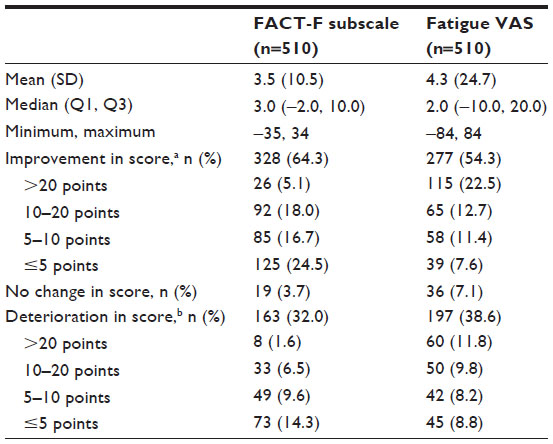 | Table 2 Change in quality of life scores at week 9 (primary analysis set), as assessed by VAS and FACT-F |
MID in QoL
As the number of patients in the PAS with an improvement in VAS of 7±3 points (n=69) was more than 20% of the number of patients with a VAS improvement ≥1 point (n=55), and the number of patients with a VAS improvement of 5±3 points (n=44) was less than 20% of the number of patients with a VAS improvement ≥1 point (n=55), a VAS improvement of 5±3 points was used to determine the MID for this study.
The mean FACT-F change score for patients in the PAS with a VAS improvement of 5±3 points was 3.5 (SD: 5.5) and so this was defined as the MID for a QoL improvement. Based on achieving/exceeding this score at week 9, 249 patients (49% [95% CI: 45–53]) had a QoL improvement. At any time up to EOS, 357 patients (70% [95% CI: 26–34]) had improved QoL. The median time to first QoL improvement was 40 (95% CI: 34–43) days (Figure 4); the Kaplan–Meier estimate for the proportion of patients with a QoL improvement by EOS was 72% (95% CI: 68–76).
 | Figure 4 Time to first quality of life improvement (primary analysis set). |
Primary endpoint
Overall, 162 patients in the PAS (32% [95% CI: 28–36]) achieved both improved QoL and an Hb increase ≥1 g/dL at week 9, and thereby achieved the study primary endpoint. In an analysis according to the most common tumor types in the PAS, the proportions of patients having both a QoL improvement and an Hb increase ≥1 g/dL at week 9 were 39% (95% CI: 31–47), 38% (95% CI: 27–49), 31% (95% CI: 20–42), 29% (95% CI: 18–39), and 28% (95% CI: 14–42) for patients with breast, ovarian, colorectal, non-small cell lung, and prostate cancers, respectively.
Factors impacting on QoL improvement
In a univariate exploratory analysis, the odds ratio of having improved QoL at week 9 for patients in the PAS who had an Hb increase ≥1 g/dL compared with <1 g/dL at week 9 was 1.79 (95% CI: 1.26–2.56; P=0.001). No further covariates were found to be significant when added to this model.
RBC transfusions and iron use
In the FAS, 261 patients (23%) required one or more RBC transfusion during the study and there were a total of 392 transfusion events. The mean units transfused per event were 1.8 (SD: 0.6); mean Hb levels within the 7 and 14 days prior to transfusion were 8.3 (SD: 1.0) g/dL and 8.4 (SD: 1.0) g/dL, respectively. The reasons for transfusion were symptomatic anemia (47%), rapid decline in Hb levels (35%), asymptomatic anemia (13%), presurgical transfusion (<1%), and significant hemorrhage (<1%), and were listed as “other” for 3% of patients. In the PAS, 82 patients (16%) required one or more RBC transfusions and there were a total of 117 transfusion events. The mean units transfused per event were 1.8 (SD: 0.6); mean Hb levels within both the 7 and 14 days prior to transfusion were 8.4 (SD: 1.0) g/dL. The reasons for transfusion were symptomatic anemia (51%), rapid decline in Hb levels (28%), and asymptomatic anemia (21%). In an analysis according to the most common tumor types in the FAS, the proportions of patients requiring an RBC transfusion were 19%, 29%, 26%, 11%, and 26% for patients with breast, non-small cell lung, ovarian, colorectal, and prostate cancers, respectively.
Overall for the FAS, 370 patients (32%) received iron supplementation during the study, with intravenous (IV) iron being used in 235 patients (20%) and oral iron in 166 patients (14%). In the PAS, 163 patients (32%) received iron supplementation, with IV iron being used in 96 patients (19%) and oral iron in 86 patients (17%).
DA exposure
In the FAS, 1,134 patients received DA and the median daily DA dose during the study was 33.3 (range: 9–500) μg; the median weekly dose was 208.3 (range: 62–1,000) μg. The median duration of DA exposure was 43.0 (range: 1–91) days and the median total dose was 1,350.0 (range: 150–5,500) μg. The median number of visits in which DA was administered was 3.0 (range: 1–13).
For the PAS, the median daily DA dose during the study was 29.9 (range: 12–71) μg and the median weekly dose was 200.0 (range: 80–500) μg. The median duration of DA exposure was 64.0 (range: 21–91) days and the median total dose was 1,800.0 (range: 600–5,000) μg. The median number of visits in which DA was administered was 4.0 (range: two to 13).
Safety
In the FAS (n=1,158), ten patients (<1%) reported eleven ADRs (thrombocytosis, arrhythmia, cardiac arrest, cystoid macular edema, abdominal pain, injection-site pain, drug hypersensitivity, hyperglycemia, cerebrovascular accident, pruritus, rash). Two serious ADRs (cardiac arrest, cerebrovascular accident) and three ADRs leading to study discontinuation (cystoid macular edema, abdominal pain, drug hypersensitivity) were reported. There was one reported fatal ADR (cardiac arrest).
Four patients (<1%) in the PAS (n=510) reported a total of five ADRs during the study (cystoid macular edema, injection-site pain, hyperglycemia, pruritus, rash). In this population, there were no serious or fatal ADRs reported and only one ADR was reported to lead to study discontinuation (cystoid macular edema).
Discussion
The primary outcome used in this study was a stringent measure necessitating both a QoL improvement and an Hb increase ≥1 g/dL at week 9 during DA treatment; 32% of patients achieved the primary outcome. The proportion of patients achieving both improved QoL and an Hb increase ≥1 g/dL was generally consistent across the most common tumor types. Week 9 was selected for the primary outcome as one would expect a patient to have responded by this time. The flexibility of timing around this time point was to allow for the observational nature of the study and the potential differences in ESA dosing regimens. The true proportion of patients achieving both a QoL improvement and an Hb increase ≥1 g/dL at any time between baseline and EOS was not assessed in this study, although this is likely to be higher than that observed for the primary outcome. In line with this, more patients were found to have a QoL improvement (70% vs 49%) or an Hb increase ≥1 g/dL (76% vs 58%) at any time during the study vs week 9 and so the concordance between these two measures is likely to be higher.
To determine which patients had improved QoL in the present study, we used an anchor-based approach; however, there are no gold standard anchor-based methodologies or accepted methods of analyzing the resultant data. In our study, patients were deemed to have improved QoL if they had an improvement in FACT-F score of ≥3.5 points – the calculated MID. This is similar to the FACT-F MID utilized in two previous ESA studies (MID: ≥3).20,21 We could have used alternative methodology, for example, looking at the difference between mean FACT-F change scores for patients with an improvement in VAS scores compared to no improvement in VAS. This would have been more in line with reported methodology for an anchor-based approach to calculating the MID; however, such methodology was deemed to be too conservative. By prespecifying that VAS change scores of 7±3, 5±3, 5±2, or 5±1 would be used depending on the number of patients in each of these categories compared with 20% of the number of patients who had a VAS improvement of ≥1 point, we attempted to limit data to only those patients who had a small but beneficial QoL improvement.
An Hb increase ≥1 g/dL was used as one of the other components of the primary outcome measure in the present study. Such an increase has been consistently used in studies assessing the efficacy of ESAs.22–25 According to current guidelines, an Hb increase of 1 g/dL and Hb maintenance in the target range of 10–12 g/dL offers a clinically meaningful benefit to patients. In eAQUA, DA was initiated at Hb levels of 9–10 g/dL in most patients and Hb was generally maintained within the target range of 10–12 g/dL; therefore, patients appeared to be treated in accordance with the labeled indication and went on to experience clinically meaningful improvements in Hb levels and fatigue-related QoL. Although we cannot conclude that an Hb increase leads to improved QoL from these data, an Hb increase ≥1 g/dL at week 9 was significantly predictive of improved QoL. This supports the observations of Vansteenkiste et al, who reported significant improvements in FACT-F scores (56% vs 44% any improvement [chi-square test; P=0.052] and 32% vs 19% with a ≥25% improvement [P=0.019], respectively) for DA vs placebo in a study including patients with lung cancer undergoing chemotherapy.26
In eAQUA, only an Hb increase ≥1 g/dL at week 9 significantly predicted a QoL improvement in the multivariate model. Other baseline (age, sex, tumor type, disease stage, chemotherapy type, Hb levels, line of chemotherapy) and post-baseline (iron use, concomitant medication use) covariates did not significantly impact on the occurrence of a QoL improvement, suggesting that DA had similar efficacy across the spectrum of patients likely to be seen in clinical practice. Few patients (n=24) received an ESA other than DA during this study and even fewer of these had both baseline and week 9 assessments for each of Hb, FACT-F, and VAS (n=9). Therefore, although results for the FAS and PAS appear similar, we cannot generalize the results for DA to all other ESAs.
As this was an observational study, attendance/data collection at specific study visits was not required and data were collected as per normal clinical practice or when the patient was visiting the clinic in relation to chemotherapy and/or ESA administration. Therefore, the number of visits/data points for each patient may have varied. It is expected that patients with more frequently dosed ESA and/or chemotherapy regimens will have more hospital visits and thus more data than those who are dosed less frequently.
From a patient perspective, agents that may prevent/reduce the need for transfusions are important as they can help decrease feelings of helplessness and help patients feel involved with the treatment process. Relatively few patients (FAS: 23%; PAS: 16%) required RBC transfusions during eAQUA. This is consistent with previous studies in which DA was shown to reduce the risk of transfusion in patients with solid tumors.26–28 In these studies, 17%–27% of DA-treated patients required transfusions compared with 39%–52% of placebo-treated patients.26–28 Concomitant IV iron use can increase hematopoietic response and reduce the need for transfusions in patients receiving an ESA.29–31 In the present study, ~80%–81% of patients received no IV iron supplementation, suggesting that DA alone effectively managed Hb levels in most patients. Approximately 14%–17% of patients in this study received oral iron supplementation. However, oral iron has not been shown to significantly improve hematopoietic response or reduce the need for transfusions in patients undergoing ESA treatment31 and so is unlikely to impact on the apparent efficacy of DA in the present study.
DA treatment appeared to be well tolerated, with few patients (<1%) reporting ADRs during this study and few serious or fatal ADRs or discontinuations due to ADRs reported. However, ADRs may be under-reported in observational studies and so the overall incidence of ADRs may not reflect the true tolerability profile of DA in this population.
Conclusion
In this clinical practice study, patients undergoing chemotherapy and treated with DA, in line with the current European indication for symptomatic CIA, had clinically meaningful improvements in both Hb levels and QoL. There was also a low incidence of transfusions. Clinicians appeared to be using DA appropriately to keep Hb levels within the licensed target Hb range of 10–12 g/dL. Consistent with previous studies, DA appeared effective at improving Hb levels, reducing fatigue and transfusion requirements, and thereby improving QoL in patients with CIA.
Acknowledgments
Medical writing support (funded by Amgen [Europe] GmbH) was provided by Dawn Batty PhD of Bioscript Medical Ltd.
Disclosure
JLM, BF, JvdB, CBL, AB, HWT, and GT received research funding from Amgen for participation in the eAQUA study; AB and GT have also acted in consultant/advisory roles for Amgen. LB is a contractor for Amgen. GCB and JHT are Amgen employees and stock owners. The authors report no other conflicts of interest in this work.
References
Ahlberg K, Ekman T, Gaston-Johansson F, Mock V. Assessment and management of cancer-related fatigue in adults. Lancet. 2003; 362(9384):640–650. | |
Harper P, Littlewood T. Anaemia of cancer: impact on patient fatigue and long-term outcome. Oncology. 2005;69 Suppl 2:2–7. | |
Weis J. Cancer-related fatigue: prevalence, assessment and treatment strategies. Expert Rev Pharmacoecon Outcomes Res. 2011;11(4):441–446. | |
Campos MP, Hassan BJ, Riechelmann R, Del Giglio A. Cancer-related fatigue: a review. Rev Assoc Med Bras. 2011;57(2):211–219. English, Portuguese. | |
Iop A, Manfredi AM, Bonura S. Fatigue in cancer patients receiving chemotherapy: an analysis of published studies. Ann Oncol. 2004;15(5):712–720. | |
Minton O, Richardson A, Sharpe M, Hotopf M, Stone P. A systematic review and meta-analysis of the pharmacological treatment of cancer-related fatigue. J Natl Cancer Inst. 2008;100(16):1155–1166. | |
Minton O, Richardson A, Sharpe M, Hotopf M, Stone P. Drug therapy for the management of cancer-related fatigue. Cochrane Database Syst Rev. 2010;(7):CD006704. | |
Tonelli M, Hemmelgarn B, Reiman T, et al. Benefits and harms of erythropoiesis-stimulating agents for anemia related to cancer: a meta-analysis. CMAJ. 2009;180(11):E62–E71. | |
Bokemeyer C, Aapro MS, Courdi A, et al. EORTC guidelines for the use of erythropoietic proteins in anaemic patients with cancer: 2006 update. Eur J Cancer. 2007;43(2):258–270. | |
Aapro MS, Link H. September 2007 update on EORTC guidelines and anemia management with erythropoiesis-stimulating agents. Oncologist. 2008;13 Suppl 3:33–36. | |
Vansteenkiste J, Wauters I, Elliott S, Glaspy J, Hedenus M. Chemotherapy-induced anemia: the story of darbepoetin alfa. Curr Med Res Opin. 2013;29(4):325–337. | |
Schrijvers D. Management of anemia in cancer patients: transfusions. Oncologist. 2011;16 Suppl 3:12–18. | |
Hauser K, Walsh D. Visual analogue scales and assessment of quality of life in cancer. J Support Oncol. 2008;6(6):277–282. | |
Stone P, Richardson A, Ream E, Smith AG, Kerr DJ, Kearney N. Cancer-related fatigue: inevitable, unimportant and untreatable? Results of a multi-centre patient survey. Cancer Fatigue Forum. Ann Oncol. 2000;11(8):971–975. | |
Cella D, Eton DT, Lai JS, Peterman AH, Merkel DE. Combining anchor and distribution-based methods to derive minimal clinically important differences on the Functional Assessment of Cancer Therapy (FACT) anemia and fatigue scales. J Pain Symptom Manage. 2002;24(6):547–561. | |
Revicki DA, Cella D, Hays RD, Sloan JA, Lenderking WR, Aaronson NK. Responsiveness and minimal important differences for patient reported outcomes. Health Qual Life Outcomes. 2006;4:70. | |
Cella D. Quality of life and clinical decisions in chemotherapy-induced anemia. Oncology (Williston Park). 2006;20(8 Suppl 6):25–28. | |
Amgen Inc.. Aranesp® (darbepoetin alfa) Summary of Product Characteristics. Thousand Oaks: Amgen Inc.; 2012. Available from: http://www.ema.europa.eu/docs/en_GB/document_library/EPAR_-_Product_Information/human/000332/WC500026149.pdf. Accessed May 6, 2015. | |
Pickard AS, Neary MP, Cella D. Estimation of minimally important differences in EQ-5D utility and VAS scores in cancer. Health Qual Life Outcomes. 2007;5:70. | |
Revicki DA, Stull D, Vernon M, Rader M, Tomita D, Viswanathan HN. Assessing the effect of darbepoetin alfa on patient-reported fatigue in chemotherapy-induced anemia in four randomized, placebo-controlled clinical trials. Qual Life Res. 2012;21(2):311–321. | |
Bohlius J, Tonia T, Nuesch E, et al. Effects of erythropoiesis-stimulating agents on fatigue- and anaemia-related symptoms in cancer patients: systematic review and meta-analyses of published and unpublished data. Br J Cancer. 2014;111(1):33–45. | |
Martelli O, Garassino M, Sacchetta S, et al. Darbepoetin alfa administered every three weeks (Q3W) in anemic cancer patients receiving chemotherapy (CT). Anticancer Res. 2008;28(3B):1767–1771. | |
Ludwig H, Crawford J, Osterborg A, et al. Pooled analysis of individual patient-level data from all randomized, double-blind, placebo-controlled trials of darbepoetin alfa in the treatment of patients with chemotherapy-induced anemia. J Clin Oncol. 2009;27(17):2838–2847. | |
Kerkhofs L, Boschetti G, Lugini A, Stanculeanu DL, Palomo AG. Use of biosimilar epoetin to increase hemoglobin levels in patients with chemotherapy-induced anemia: real-life clinical experience. Future Oncol. 2012;8(6):751–756. | |
Gómez A, Salgado M, Valladares-Ayerbes M, et al. Efficacy of epoetin-beta 30,000 IU/week in correcting anaemia in patients with gastrointestinal tumours subjected to concomitant chemoradiotherapy. Clin Transl Oncol. 2010;12(12):843–848. | |
Vansteenkiste J, Pirker R, Massuti B, et al. Double-blind, placebo-controlled, randomized phase III trial of darbepoetin alfa in lung cancer patients receiving chemotherapy. J Natl Cancer Inst. 2002;94(16):1211–1220. | |
Pirker R, Ramlau RA, Schuette W, et al. Safety and efficacy of darbepoetin alpha in previously untreated extensive-stage small-cell lung cancer treated with platinum plus etoposide. J Clin Oncol. 2008;26(14):2342–2349. | |
Hernandez E, Ganly P, Charu V, et al. Randomized, double-blind, placebo-controlled trial of every-3-week darbepoetin alfa 300 micrograms for treatment of chemotherapy-induced anemia. Curr Med Res Opin. 2009;25(9):2109–2120. | |
Karlsson T. Effects of iron supplementation on erythropoietic response in patients with cancer-associated anemia treated by means of erythropoietic stimulating agents. ISRN Hematol. 2011;2011:108397. | |
Gafter-Gvili A, Rozen-Zvi B, Vidal L, et al. Intravenous iron supplementation for the treatment of chemotherapy-induced anaemia – systematic review and meta-analysis of randomised controlled trials. Acta Oncol. 2013;52(1):18–29. | |
Petrelli F, Borgonovo K, Cabiddu M, Lonati V, Barni S. Addition of iron to erythropoiesis-stimulating agents in cancer patients: a meta-analysis of randomized trials. J Cancer Res Clin Oncol. 2012;138(2):179–187. |
 © 2016 The Author(s). This work is published and licensed by Dove Medical Press Limited. The full terms of this license are available at https://www.dovepress.com/terms.php and incorporate the Creative Commons Attribution - Non Commercial (unported, v3.0) License.
By accessing the work you hereby accept the Terms. Non-commercial uses of the work are permitted without any further permission from Dove Medical Press Limited, provided the work is properly attributed. For permission for commercial use of this work, please see paragraphs 4.2 and 5 of our Terms.
© 2016 The Author(s). This work is published and licensed by Dove Medical Press Limited. The full terms of this license are available at https://www.dovepress.com/terms.php and incorporate the Creative Commons Attribution - Non Commercial (unported, v3.0) License.
By accessing the work you hereby accept the Terms. Non-commercial uses of the work are permitted without any further permission from Dove Medical Press Limited, provided the work is properly attributed. For permission for commercial use of this work, please see paragraphs 4.2 and 5 of our Terms.