")
Back to Journals » ClinicoEconomics and Outcomes Research » Volume 12
Healthcare Resource Use and Cost: The Impact of Adopting an Abuse-Deterrent Formulation of Extended Release Morphine
Authors Rossiter LF, Kwong WJ, Marrett E
Received 9 August 2019
Accepted for publication 8 November 2019
Published 15 January 2020 Volume 2020:12 Pages 35—44
DOI https://doi.org/10.2147/CEOR.S226607
Checked for plagiarism Yes
Review by Single anonymous peer review
Peer reviewer comments 2
Editor who approved publication: Prof. Dr. Dean Smith
Louis F Rossiter, 1 Winghan Jacqueline Kwong, 2 Elizabeth Marrett 2
1The College of William and Mary, Williamsburg, VA 23187, USA; 2US Medical Affairs, Daiichi Sankyo, Inc., Basking Ridge, NJ 07920, USA
Correspondence: Elizabeth Marrett
US Medical Affairs Daiichi Sankyo, Inc., 211 Mt. Airy Road, Basking Ridge, NJ 07920, USA
Tel +908 992 7050
Email [email protected]
Background: Development of abuse-deterrent formulations (ADFs) of prescription opioids (RxO) is an important step toward reducing misuse and abuse. Morphine-ARER (MorphaBond™ ER) is an extended-release (ER) morphine sulfate tablet formulated to deter misuse/abuse via intravenous (IV) and intranasal (IN) routes of administration.
Objective: A model was developed to estimate the budget impact to a hypothetical commercial health plan of 10 million members 2 years after adding morphine-ARER to drug formulary.
Methods: We analyzed incremental health care resource use (HCRU) associated with RxO misuse/abuse based on a health plan’s RxO formulary coverage and patterns of misuse/abuse. Misuse/abuse rates, incremental HCRU and associated costs were based on the 2015 National Survey on Drug Use and Health, an analysis of claims from OptumHealth Care Solutions, Inc. (2013– 2015) and published literature. RxO formulary shares were based on 2016– 2017 Symphony Retail Prescription data. Morphine-ARER was assumed to capture 20 and 30 percent from branded and 0.3 and 0.6 percent from generic non-ADF ER morphine, in the first and second years, respectively. Proportions of misuse/abuse deterred by physical/chemical properties of morphine-ARER were assumed to be 90 percent via IV and 60 percent via IN administration, with further IN deterrence based on results from morphine-ARER’s human abuse liability study.
Results: Adding morphine-ARER to formulary resulted in a potential decrease in abuserelated healthcare costs by $557,321 (−$0.00232 per-member per-month [PMPM]), offsetting a pharmacy cost increase of $217,045 (+$0.00090 PMPM), resulting in net cost-savings of $0.00142 PMPM over 2 years, based on certain model assumptions.
Conclusion: Placing morphine-ARER on a health plan’s drug formulary may result in reduced misuse/abuse and overall cost savings.
Keywords: prescription opioids, abuse-deterrent formulations, drug formulary change, budget impact
Background
The opioid crisis has witnessed a large number of Americans misusing/abusing prescription opioids (RxO). The number of overdoses and deaths arising from misuse/abuse of RxO has become a serious public health crisis. According to data from the National Survey on Drug Use and Health (NSDUH), 11.1 million Americans aged 12 or older misused RxOs in 2017, with 2 million having initiated misuse over the past year.1 NSDUH results suggest that a significant majority (63.9 percent) of those who misuse/abuse opioids do so without a prescription, with diversion of RxOs from patients with legitimate prescriptions to friends and family members being the largest contributor to the problem.1,2 Birnbaum et al (2011) estimated the societal costs of RxO misuse/abuse to be $56 billion annually in 2007. More recently, Florence et al (2016) estimated $78.5 billion in economic burden annually in 2013.3,4 These results were largely driven by two primary factors: increased health care and substance abuse treatment utilization associated with RxO misuse/abuse which has significant resource and cost consequences on managed care; and, indirect costs associated with disability and medically related absenteeism which impose a significant burden on employers.
Several abuse-deterrent formulations (ADFs) of opioids have been introduced to the market along with other initiatives such as appropriate opioid prescribing and patient selection, and prescription drug monitoring programs, to help combat RxO misuse/abuse. Indeed, the recent passing of the Comprehensive Addiction and Recovery Act (CARA) in the wake of other legislative actions continues to focus on program development and treatment options for addiction and abuse of RxOs.
Published evidence suggests that ADF opioids offer the potential to reduce RxO misuse/abuse and the financial burden of opioid misuse/abuse to the health care system and society. In 2016, Coplan et al published a 10-study review finding that the introduction of reformulated OxyContin led to abuse event reductions of 48 percent in a national poison center surveillance system, 32 percent in a national drug treatment system, and 27 percent in a privately insured patient population.5 In a 2014 study by Rossiter et al, it was estimated that the introduction of reformulated OxyContin was associated with annual cost savings of $430 million in 2011 USD.6 A recent review by the International Center of Economic Research (ICER) estimated that ADF adoption could lead to the prevention of 2300 new cases of misuse/abuse and 6600 fewer abuse-years over non-ADF opioids per 100,000 chronic non-cancer pain patients over five years, although the reductions in abuse-related costs were estimated to be outweighed by higher ADF drug acquisition costs.7
Currently, the FDA has approved several extended-release (ER) and a single immediate-release (IR) RxOs with ADF labeling, each of which has distinct properties designed to deter RxO misuse/abuse.8 Morphine-ARER (MorphaBond™ ER) is an extended-release morphine sulfate tablet formulated to deter misuse/abuse via the intravenous (IV) and intranasal (IN) routes of administration. The objective of this analysis is to estimate the potential financial impact of including morphine-ARER on a commercial US health care plan’s drug formulary, replacing existing non-ADF ER morphine, as a treatment for the management of severe pain. This is done by developing a tool with flexible inputs that payers can use as they consider the potential financial implications of formulary change and the drivers of financial outcomes with respect to the opioid class, based on a variety of user-chosen inputs/assumptions. The claims data underlying the study are not freely available and were obtained through a licensing agreement with Optum Health. This research is exempt from IRB review as the underlying claims data are de-identified and the underlying analysis is not conducted at the patient level – rather, averages across the cohorts are present in the paper, as described below. The authors do not intend to share any more data than are presented in this paper.
Data and Analysis
Model Overview
A formulary budget impact model was developed utilizing a previously published framework.9 The framework was updated to account for the abuse deterrence properties of morphine-ARER, the current landscape of ER and IR opioids (prescribing volumes and costs), as well as updated prevalence rates and costs of RxO misuse/abuse.
The model estimates and compares incremental healthcare resource use (HCRU) and costs associated with RxO misuse/abuse in a health plan under two formulary scenarios: with and without morphine-ARER. HCRU and costs are calculated based on the estimated rates of RxO misuse/abuse in the plan reflecting the formulary mix of ADF and non-ADF opioids, and the extent of excess misuse/abuse-related events between plan members with and without medical claims associated with a diagnosis of opioid misuse/abuse.
To estimate the potential reductions in rates of opioid misuse/abuse if morphine-ARER is included on formulary, the model incorporates information on the physical and chemical properties of morphine-ARER and published results from an in vivo human abuse liability (HAL) study of morphine-ARER. Any reduction in misuse/abuse of RxOs is expected to result in an associated decrease in health care resource utilization and ultimately costs borne by the health plan in managing misuse/abuse-related events. The model also incorporates prices of various ER morphine drugs to evaluate the implications on pharmacy budget from the health plan perspective. Figure 1 presents the conceptual framework of the model.
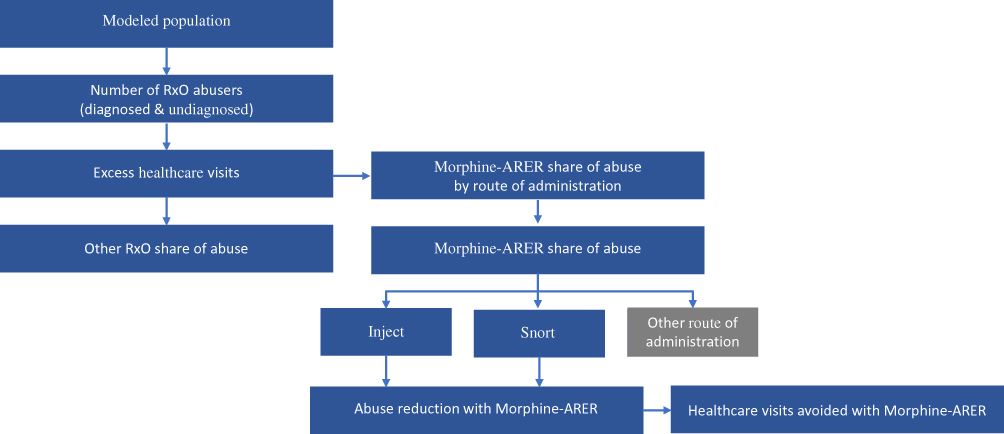 |
Figure 1 Model structure. |
Model Methodology
Patient Population
The number of plan members misusing/abusing RxOs was estimated using the age distribution of the 2016 US Census and age-specific prevalence estimates of misuse reported by the 2015 National Survey on Drug Use and Health (NSDUH).10,11 The survey represents individuals from the general population who used prescription pain relievers (primarily opioids) “in any way that a doctor did not direct you to use them.”
Rates of Misuse/Abuse
Because not all RxO misuse/abuse cases are formally diagnosed with ICD-9-CM codes, RxO misusers/abusers were further classified into “diagnosed” and “undiagnosed” cases. Diagnosed misusers/abusers were health plan members with at least one medical claim associated with an ICD-9-CM diagnosis code for RxO abuse (304.0, 304.7, 305.5, 965.00, 965.02, 965.09), excluding codes for heroin abuse (965.01). The age-specific prevalence rates of diagnosed misusers/abusers were based on an analysis of the OptumHealth Care Solutions, Inc. employer database (January 2013 to September 2015). The database includes de-identified medical and pharmacy claims for continuously eligible privately insured-patients from ages 12–64. The number of undiagnosed misusers/abusers was calculated as the difference between the 2015 NSDUH RxO misuse rates and the diagnosed misuse/abuse rates. The calculated numbers of diagnosed and undiagnosed abusers were converted into age-specific prevalence rates of RxO misuse/abuse across the plan population. The average prevalence rates (weighted by population in each age group using US Census data) were 0.26 percent for diagnosed abusers and 3.40 percent for undiagnosed abusers.
Excess Health Care Resource Utilization
Incremental HCRU/events (e.g., emergency room visits, outpatient visits, hospitalizations and substance abuse treatment center stays, diagnoses of HIV and hepatitis C) associated with RxO misuse/abuse was calculated by comparing the difference in clinical events over a 12-month period covering the six months pre- and post-index dates (ie, the date of first abuse diagnosis, and index dates were randomly assigned to controls) (Table 1) across two samples, one for abusers, and the second for a propensity-matched control sample of non-abusers using the OptumHealth claims database (8561 diagnosed abusers and 93,191 potential control patients generated 7493 matched pairs). The cohorts were matched based on select baseline patient characteristics, including age, gender, index year, healthcare utilization, costs, and Charlson Comorbidity Index. The excess HCRU events per abuser were 0.9 for emergency department visits, 3.0 for outpatient visits, 0.5 for hospitalizations and 1.0 for substance abuse treatment center stays. The analysis also accounted for excess prevalence of HIV and hepatitis C (0.2 and 2.3 per diagnosed abuser, respectively), both of which are associated with injection-related RxO abuse. For undiagnosed abusers, levels of excess events were scaled down by 70 percent to account for the assumed lesser severity of misuse/abuse within this population (see below). Given data limitations, the model uses a single mortality rate for the US population overall reported by the CDC (10.4 deaths per 100,000 lives).12
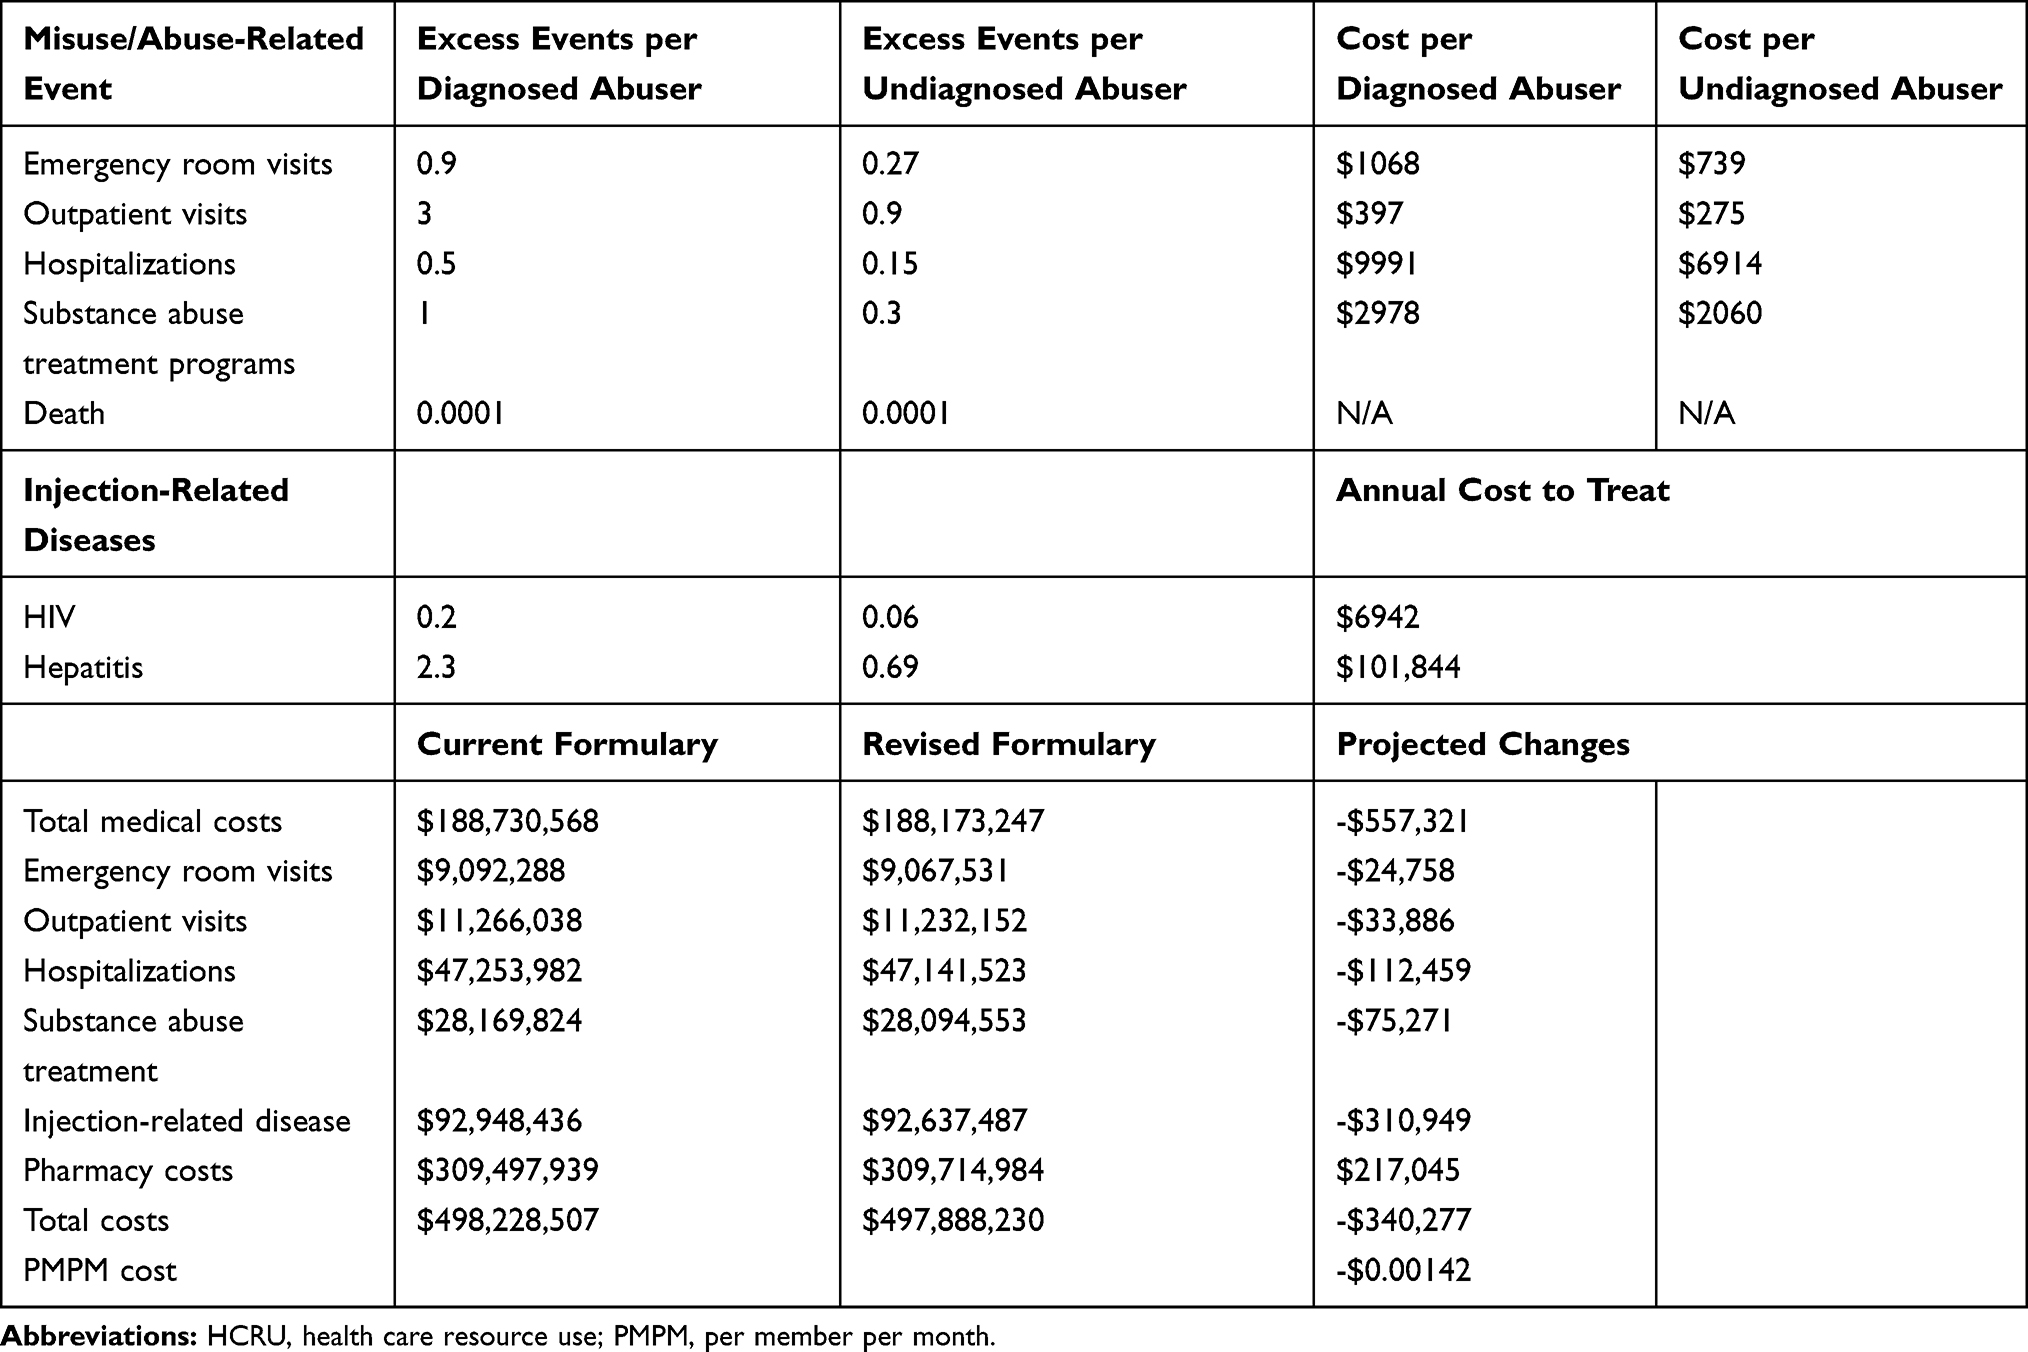 |
Table 1 Excess Events/HCRU and Associated Costs for Abusers and Two-Year Estimated Budget Impact with Morphine-ARER on Formulary |
ER Morphine Share of Misuse/Abuse
The model assigns a proportion of the incremental HCRU and mortality associated with RxO misuse/abuse to ER morphine, based on the distribution of reported drug-specific abuse data from ASI-MV, a data source within the National Addictions Vigilance Intervention and Prevention Program (NAVIPPRO) (January 1 to December 31, 2016). ASI-MV data are collected from adults within a network of substance abuse treatment centers and other assessment settings (460 facilities within 39 states across the U.S.) using a self-administered and structured computerized interview. The data provide a summary of the relative proportions of RxO subject to abuse in the past 30 days. This information enabled us to estimate that 4.8 percent of RxO misuse/abuse events were attributable to ER morphine.
Because data reported to ASI-MV are not drug-specific, national RxO sales data (Symphony Health Solutions Pharmaceutical Audit Suite 2.0 (SHS PHAST 2.0), 5/1/2016 – 4/30/2017) were used to estimate the proportion of ER morphine misuse/abuse that is attributable to each ER morphine product listed on the formulary. The proportion of misuse/abuse events via various routes of administration was assigned based on routes of misuse/abuse data for ER morphine reported in the ASI-MV dataset. Based on these data, 41.5 percent and 19.0 percent of total ER morphine abuse cases were via IV and IN routes of administration, respectively.
Estimating Potential Benefits of Abuse-Deterrent Properties
The model incorporates information on the abuse-deterrent properties of morphine-ARER to estimate the potential reduction in ER morphine misuse/abuse. Morphine-ARER is formulated with physical and chemical properties that are expected to reduce misuse/abuse via the IN and IV routes of administration. These properties include increased resistance to cutting, crushing, and/or breaking, and forming a viscous material if physically compromised and placed in liquid to deter syringeability and injectability. Given these physical and chemical properties, the analysis assumes rates of misuse/abuse via IV and IN routes of administration will be reduced by 90 percent and 60 percent, respectively, compared to non-ADF ER morphine products.
In addition, an IN human abuse liability study of crushed morphine-ARER showed a 13.6 mm absolute risk reduction in mean maximum “drug liking” compared to crushed non-ADF ER morphine (Emax VAS scores 71.7mm vs 85.3mm; P<0.0001).13 A previously published algorithm by White et al (2015) was used to convert the difference in drug liking scores between morphine-ARER and non-ADF ER morphine into a difference in the rate of ER morphine misuse/abuse. Using this algorithm, we estimated that an additional 19.43 percent reduction in misuse/abuse rate via IN route of administration for morphine-ARER relative to non-ADF ER morphine can be expected based on the observed difference in drug liking scores (Figure 2).14
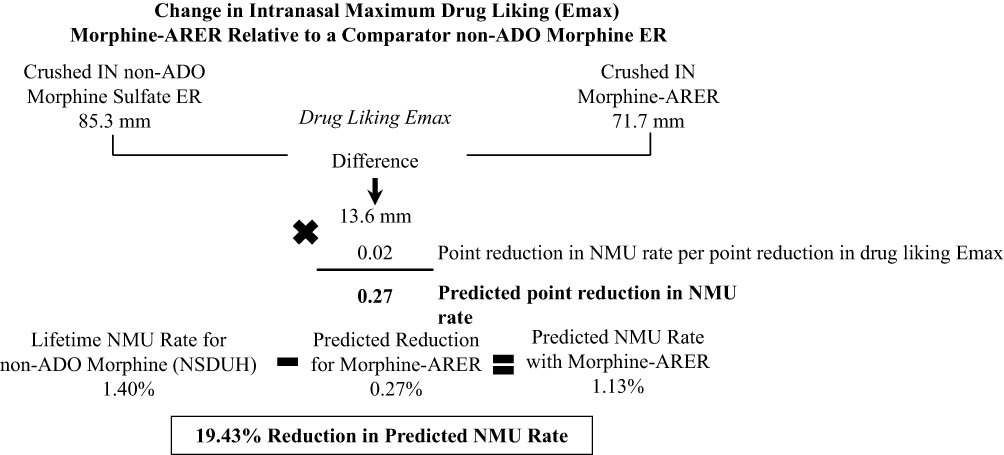 |
Figure 2 Methodology to calculate reduction in predicted NMU rate. Abbreviations: NMU, non-medical use; ADO, abuse-deterrent opioid. |
Model Costs
Cost estimates for each component of HCRU were derived from the OptumHealth claims analysis (Table 1). The model assumes that each event for an undiagnosed misuser/abuser would cost 69.2 percent of that for a diagnosed misuser/abuser, based on a study that estimated the healthcare costs of undiagnosed opioid misusers.15 Annual pharmacy costs for outpatient treatment of HIV and hepatitis C were obtained from published literature and were assumed to be identical for both diagnosed and undiagnosed abusers, as it is not expected that the severity of misuse/abuse would impact the cost to treat these diseases.16,17 All HCRU costs were inflated to USD2018 using the Consumer Price Index (CPI) for nonseasonally adjusted medical care (all urban consumers), and pharmacy costs were calculated based on contemporaneous weighted average wholesale acquisition costs.18
All pharmacy costs were based on wholesale acquisition costs (WAC) as of February 13, 2019, and were calculated as the weighted average across product dose strengths based on utilization rates observed in the Symphony database (May 1, 2016–April 30, 2017). Cost per 30-day supply was based on the weighted average number of units per prescription. For morphine-ARER, utilization was assumed to be 52 percent for 15 mg, 38 percent for 30 mg, 8 percent for 60 mg, and 2 percent for 100 mg tablets for a weighted average WAC of $9.41/unit, with a 30-day supply of 60 units. Discounts and rebates were not applied; however, patient out-of-pocket copayments were subtracted from drug costs and were assumed to be $40 for branded and $10 for generic products.
Base Case Scenario
In the base case analysis, the plan population was assumed to be a US commercial health care plan comprising 10 million members. Two formulary scenarios were compared. In the first scenario, morphine-ARER was not part of the formulary, with the formulary share for other ER opioid products consistent with national market share data in the US (Symphony Health Solutions Pharmaceutical Audit Suite 2.0, 5/1/2016–4/30/2017). In the second scenario, morphine-ARER was assumed to replace 20 percent of the prescriptions from the two branded non-ADF ER morphine drugs (Kadian and MS Contin), and 0.3 percent of the prescriptions from generic non-ADF ER morphine drugs in the first year and 30 percent of prescriptions from branded non-ADF ER morphine products, and 0.6 percent of prescriptions from generic non-ADF ER morphine drugs in the second year. These market share capture assumptions reflect a substitution from a branded morphine opioid to another (branded) ADF opioid, morphine-ARER; the much lower substitution from the generic morphine opioids reflects the lower price of generic drugs relative to their branded counterparts. This uptake translates to 0.14 percent and 0.26 percent total ER opioid market share in years one and two, respectively. The size of the RxO market was assumed to be stable during the first two years. Morphine-ARER was not expected to affect formulary share of other ADF ER morphine products (ie, Embeda) or non-morphine opioid products.
Sensitivity analyses were conducted on two sets of parameters in order to evaluate the impact of certain model inputs: i) the uptake of morphine-ARER from generic ER morphine, and ii) the proportions of misuse/abuse deterred by morphine-ARER, based on its physical and chemical properties. In the sensitivity analysis evaluating market share, morphine-ARER was assumed to replace 0.4 percent and 0.8 percent of the generic non-ADF ER morphine products in the first and second year, respectively. Three additional analyses were performed further increasing these percentages (0.5 percent and 1.0 percent; 1.2 percent and 2.4 percent; and 1.5 percent and 3.0 percent in the first and second years). In evaluating the impact of the proportions of misuse/abuse deterred by morphine-ARER, several sensitivity analyses were performed holding either IN or IV misuse/abuse constant. In the first set of these analyses, IN reduction was held at 60 percent while IV was reduced to 80, 70, 65, and 60 percent. The second set of analyses held IV reduction at 90 percent while IN was reduced to 55, 50, 45, and 40 percent.
Results – Estimated Events Avoided and Budget Impact
In the base case analysis, prior to the addition of morphine-ARER to the formulary, it was estimated that 22,119 members were diagnosed with RxO misuse/abuse and 340,334 members misused/abused RxOs but were undiagnosed in a 10 million-member plan. Total healthcare costs associated with RxO misuse/abuse over a 2-year period were estimated to be $498,228,507. Medical costs for misuse/abuse-related events and pharmacy cost for ER RxOs accounted for 38 percent ($188,730,568) and 62 percent ($309,497,939) of total cost, respectively. Medical costs were primarily driven by injection-related disease (49 percent) with hospitalizations (25 percent) also a significant cost driver. After adding morphine-ARER to the formulary, pharmacy cost for ER RxOs increased by $217,045, and medical costs decreased by $557,321, resulting in net savings of $340,277 ($0.00142 per member per month (PMPM)) (Table 1). Medical cost savings were the result of 201 abuse-related events avoided; 32 emergency department visits, 115 outpatient visits, 16 hospitalizations, 35 substance abuse treatment center stays and 3 cases of hepatitis C. There was no incremental reduction in death by opioid overdose.
In the sensitivity analysis, when the market shares of generic non-ADF ER morphine prescriptions replaced by morphine-ARER were increased to 1.5 percent in year 1 and 3.0 percent in year 2, the incremental healthcare (medical + pharmacy) savings to the plan was $148,217 ($0.00062 PMPM) (Figure 3). The results were also sensitive to the amount of ER morphine RxO misuse/abuse deterred by the physicochemical properties of morphine-ARER. Results were more sensitive to the amount of misuse/abuse reduced via the IV route than the IN route. Compared to the base case scenario where relative reductions of IN and IV misuse/abuse were set to 60 percent and 90 percent, respectively, reducing the amount of reduction of IV misuse/abuse to 65 percent while keeping IN misuse/abuse reduction at 60 percent provided lower net cost savings (ie, relative to the base case) of $87,682 ($0.00037 PMPM). It was not until IV abuse reduction was set to 41 percent that there was an overall net cost to plan of $75,967 ($0.00032 PMPM). When the amount of misuse/abuse reduction for IV was held constant at 90 percent and IN misuse/abuse reduction was lowered to 40 percent, the net cost savings were lower (ie, relative to the base case) at $325,023 ($0.00135 PMPM). Lowering IN abuse reduction to 0 percent still resulted in overall plan savings of $301,838 ($0.00126 PMPM) (Figure 4). The lower cost savings/higher costs associated with reducing the amount of IV misuse/abuse can be attributed to the high cost of treating injection-related diseases such as hepatitis C and HIV.
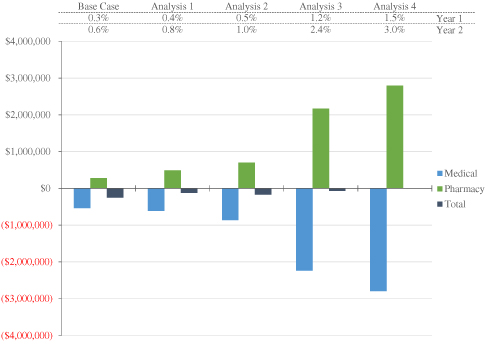 |
Figure 3 Sensitivity analyses of 2-year total estimated savings/costs based on changes in generic market share for morphine-ARER. Base Case: Branded non-ADF ER morphine: 20% year 1 and 30% year 2; generic non-ADF ER morphine: 0.3% year 1 and 0.6% year 2. Analysis 1: Branded non-ADF ER morphine: 20% year 1 and 30% year 2; generic non-ADF ER morphine: 0.4% year 1 and 0.8% year 2. Analysis 2: Branded non-ADF ER morphine: 20% year 1 and 30% year 2; generic non-ADF ER morphine: 0.5% year 1 and 1.0% year 2. Analysis 3: Branded non-ADF ER morphine: 20% year 1 and 30% year 2; generic non-ADF ER morphine: 1.2% year 1 and 2.4% year 2. Analysis 4: Branded non-ADF ER morphine: 20% year 1 and 30% year 2; generic non-ADF ER morphine: 1.5% year 1 and 3.0% year 2. |
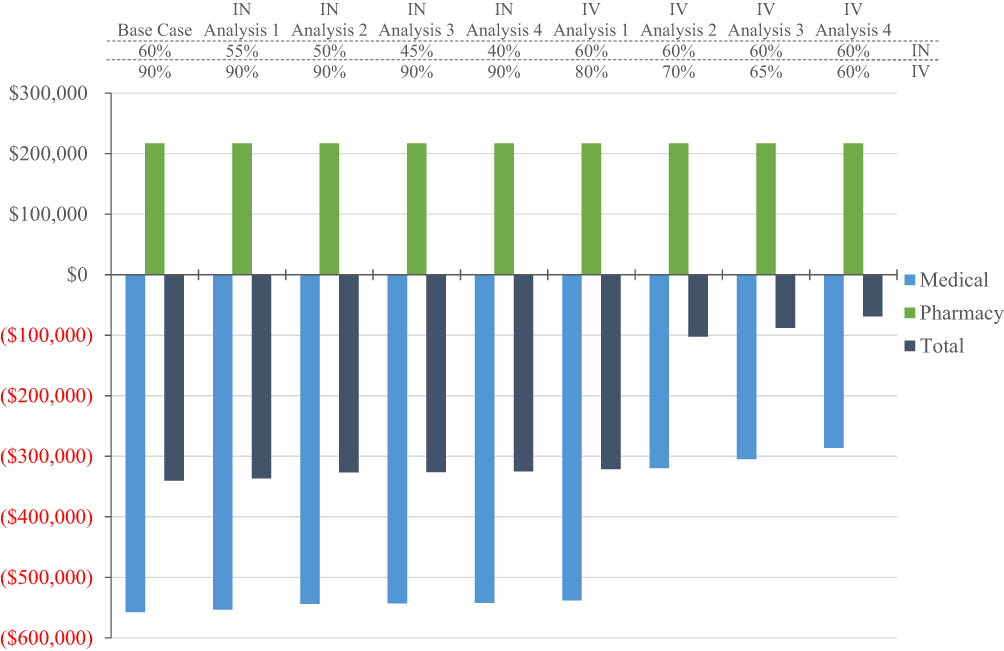 |
Figure 4 Sensitivity analyses of 2-year total estimated savings/costs based on changes in IV and IN potential abuse deterrence for morphine-ARER. |
Note that results depend on the assumptions made with respect to the market share capture of morphine-ARER as well as its effectiveness in deterring abuse. This allows the user (e.g., a commercial health plan) to test how different assumptions impact the potential impact of formulary adoption of morphine-ARER.
Discussion
Results of this analysis are consistent with the growing body of evidence that ADFs have the potential to substantially reduce misuse/abuse of RxOs, and the associated cost burden to managed care. A recent review conducted by ICER concluded that ADFs other than OxyContin demonstrate potential comparable or better results than non-ADF on “likability” in human abuse potential studies, but there is a lack of published evidence assessing reductions in the risk of abuse. However, the economic benefits of ADF opioids can be assessed by modeling based on data from various data sources and assumptions. ICER modeled the budget impact of converting all non-ADF prescriptions to ADF prescriptions in Massachusetts and estimated that such a policy would prevent 850 new cases of opioid abuse in one year in a 100,000-member plan at a cost of $599,000 per new case of abuse prevented.7 Net cost-savings were not possible because the lower abuse-related costs of ADF opioids compared to non-ADF opioids were outweighed by the higher prescription costs of ADF opioids. In contrast, the current analysis takes an approach that is more reflective of current market conditions where drug formularies support a mix of ADF and non-ADF drug availability such that an ADF displaces branded and generic non-ADF ER opioid drugs on a more limited basis. While universal ADF adoption in the ICER analysis resulted in an increase in health care costs, our results showed that converting a proportion of ER morphine prescriptions from non-ADF to ADF may lead to medical cost-savings that can offset the higher drug acquisition cost of morphine ARER relative to non-ADF ER morphine.
The FDA continues to support the development of new ADF technologies.19 The FDA’s Opioids Action Plan describes expanding access to ADFs as a critical step towards fighting the opioid crisis, and the National Institute on Drug Abuse (NIDA) has stressed the important role of pharmaceutical companies in developing these new drugs.20,21
The generalizability of current model results depends on how well the data sources and assumptions represent actual patterns of RxO misuse/abuse and associated HCRU in a real-world setting. While the model utilized data available from widely cited published literature on RxO misuse/abuse rates and cost estimates based on retrospective analysis of medical claims, the validity of several model assumptions will need to be confirmed by future studies. The model assumed that the ER RxO market will remain stable during the course of the model duration. The 2016 CDC guidelines on opioid prescribing now recommend non-pharmacologic and non-opioid therapy as the preferred treatments for patients with chronic pain. In the case where opioids are needed, the CDC recommends starting patients on immediate-release opioids rather than extended-release.22 Although difficult to predict, it is possible that these recommendations may have a stabilizing effect on the ER opioid market, and so the assumption of no growth in the volume of opioid prescriptions dispensed seems warranted. The introduction of morphine-ARER on a drug formulary may replace a proportion of ER non-ADF prescriptions; however, the actual market uptake for the morphine-ARER cannot be known in advance. The results of this analysis therefore need to be confirmed with future real-world data.
The abuse-deterrent properties of morphine-ARER are described in the FDA-approved label. However, the degree to which these abuse-deterrent properties will reduce RxO misuse/abuse in the real world remains unknown. To address this uncertainty, we ran a series of sensitivity analyses to simulate study outcomes based on a variety of scenarios and presented the break-even points. We found the model results to be highly sensitive to the deterrence of abuse via the IV route of administration. Previous data suggested that injection is the most common form of abuse of ER morphine (Butler 2011). Therefore, deterrence of IV abuse in the real-world setting will be important data to confirm the value of morphine-ARER from both clinical and financial perspectives. As successful deterrence of one route of administration may lead to shifting of abuse to other routes, future studies should review the effect of an ADF on all routes of abuse in a comprehensive manner.
The model allows for commercial health plans to consider the HCRU and cost implications of formulary adoption of morphine-ARER, and data inputs can be modified to reflect assumptions that are plan-specific. ADFs may have the potential to reduce costs associated with RxO abuse. Recent legislation such as CARA includes provision for grants for treatment options for RxO abuse – such programs may have potential to hold down costs.23 Kuhn (2017) notes that employers can play a role in curbing the epidemic through awareness campaigns and messaging around the implications of sharing medications and the availability of resources about RxO abuse.
Many individuals who misuse/abuse RxO are not patients receiving RxO from a prescriber. The strength of our analysis is that it considered the potential benefit of ADF on RxO diversion. By directly applying RxO misuse/abuse rates of the US population to the hypothetical health plan in the model, we were able to quantify the number of misuse/abuse cases and associated costs without requiring individuals to have an RxO prescription fill. However, our analysis did not account for all possible costs that may be associated with RxO misuse/abuse, such as costs associated with lost productivity and disability due to RxO misuse/abuse and may underestimate the overall potential value of ADFs from a societal perspective.
Conclusion
This analysis provides a framework for estimating the budget impact of adding an ADF to an existing prescription drug formulary, and provides payers with a tool to assist with an evaluation of the financial impact of formulary changes and the drivers of the financial outcomes. Results suggest that the addition of morphine-ARER may result in a reduction in misuse/abuse-related events translating to a net cost savings to the health plan. As the body of work that examines the impact of replacing ER non-ADFs with ER ADFs continues to grow, we will improve our understanding of how new ADF products can help to mitigate the opioid crisis and create societal cost savings.
Disclosure
Professor Louis Rossiter reports personal fees from Daiichi Sankyo, Inc., during the conduct of the study. Ms Elizabeth Marrett is an employee of Daiichi Sankyo, Inc. Dr Winghan Jacqueline Kwong is an employee of Daiichi Sankyo, Inc. The authors report no other conflicts of interest in this work.
References
1. Substance Abuse and Mental Health Services Administration, Center for Behavioral Health Statistics and Quality. Results from the 2017 national survey on drug use and health: detailed tables: figure 24 source where pain relievers were obtained for most recent misuse among people aged 12 or older who misused prescription pain relievers in the past year: percentages. October 2018. Available from: https://www.samhsa.gov/data/sites/default/files/cbhsq-reports/NSDUHDetailedTabs2017/NSDUHDetailedTabs2017.pdf.
2. Volkow ND, McLellan AT. Opioid abuse in chronic pain – misconceptions and mitigation strategies. N Engl J Med. 2016;374:1253–1275. doi:10.1056/NEJMra1507771
3. Birnbaum HG, White AG, Schiller M, Waldman BA, Cleveland JM, Rolan CL. Societal costs of prescription opioid abuse, dependence, and misuse in the United States. Pain Med. 2011;12(4):657–667. doi:10.1111/j.1526-4637.2011.01075.x
4. Florence CS, Zhou C, Luo F, Xu L. The economic burden of prescription opioid overdose, abuse, and dependence in the United States, 2013. Med Care. 2016;54(10):901–906. doi:10.1097/MLR.0000000000000625
5. Coplan PM, Chilcoat HD, Butler SF, et al. The effect of an abuse-deterrent opioid formulation (OxyContin) on opioid abuse-related outcomes in the postmarketing setting. Clin Pharmacol Therap. 2016;100(3):275–286.
6. Rossiter L, Kirson NY, Shei A, et al. Medical cost savings associated with an extended-release opioid with abuse deterrent technology in the US. J Med Econ. 2014;17(4):279–287. doi:10.3111/13696998.2014.897628
7. Abuse Deterrent Formulations of Opioids: Effectiveness and Value. Final Evidence Report. Institute for Clinical and Economic Review. August 8, 2017. Available from: https://icer-review.org/wp-content/uploads/2016/08/NECEPAC_ADF_Final_Report_08_08_17.pdf.
8. Pergolizzi JV, Raffa RB, Taylor R, Vacalis S. Abuse-deterrent opioids: an update on current approaches and considerations. Curr Med Res Opin. 2018;34(4):711–723. doi:10.1080/03007995.2017.1419171
9. White A, Birnbaum HG, Rothman DB, Katz N. Development of a budget-impact model to quantify potential cost savings from prescription opioids designed to deter abuse or ease of extraction. Appl Health Econ Health Policy. 2009;7(1):61–70. doi:10.1007/BF03256142
10. Mid-year Population by Single Year Age Groups - Custom Region - United States. Census Bureau. 2016. Available from: https://www.census.gov/data/datasets/2017/demo/popest/nation-detail.html.
11. Results from the 2015 National Survey on Drug Use and Health: Detailed Tables Table 1. 23A - any use of pain relievers in past year and misuse of pain relievers in past year and past month, by detailed age category: numbers in thousands, 2014 and 2015. SAMHSA. Available from: https://www.samhsa.gov/data/sites/default/files/NSDUH-DetTabs-2015/NSDUH-DetTabs-2015/NSDUH-DetTabs-2015.htm.
12. Rudd RA, Seth P, David F, Scholl L. Increases in drug and opioid-involved overdose deaths — United States, 2010–2015. MMWR. 2016;65(50–51):1445–1452. doi:10.15585/mmwr.mm655051e1
13. MorphaBond™ ER [prescribing information]. Parsippany, NJ: Daiichi Sankyo, Inc.; February 2017. Available from: https://www.accessdata.fda.gov/drugsatfda_docs/label/2015/206544lbl.pdf.
14. White AG, LeCates J, Birnbaum HG, Cheng W, Roland CL, Mardekian J. Positive subjective measures in abuse liability studies and real-world non-medical use: potential impact of abuse deterrent opioids on rates of non-medical use and associated health care costs. J Opioid Manag. 2015;11(3):199–210. doi:10.5055/jom.2015.0269
15. Shei A, Rice B, Kirson N, et al. Methods to estimate the prevalence and healthcare costs of undiagnosed opioid abuse among commercially-insured individuals.
16. Rein DB, Wittenborn JS, Smith BD, Liffman DK, Ward JW. The cost-effectiveness, health benefits, and financial costs of new antiviral treatments for hepatitis C virus. Clin Infect Dis. 2015;61(2):157–168. doi:10.1093/cid/civ220
17. Schackman BR, Fleishman JA, Su AE, et al. The lifetime medical cost savings from preventing HIV in the United States. Med Care. 2015;53(4):293–301. doi:10.1097/MLR.0000000000000308
18. U.S. Bureau of Labor Statistics, Consumer Price Index for All Urban Consumers: Medical Care [CPIMEDNS], retrieved from FRED, Federal Reserve Bank of St. Louis; https://fred.stlouisfed.org/series/CPIMEDNS; Symphony Health Solutions Pharmaceutical Audit Suite 2.0 (SHS PHAST 2.0), May 1, 2016 - April 30, 2017; WACs from Analy$ource (from FDB MedKnowledge (formerly known as NDDF Plus) data included with permission and copyrighted by First Databank, Inc.), February 2019.
19. Opioid Medications. U.S. food & drug administration. Available from: https://www.fda.gov/NewsEvents/Newsroom/FactSheets/ucm514939.htm. Accessed on March 26, 2018.
20. FDA Opioid Action Plan. U.S. food & drug administration. Available from: https://www.fda.gov/drugs/drugsafety/informationbydrugclass/ucm484714.htm.
21. What is the federal government doing to combat the opioid abuse epidemic?
22. Dowell D, Haegerich TM, Chou R. CDC guideline for prescribing opioids for chronic pain — United States, 2016. MMWR. 2016;65(1):1–49. doi:10.15585/mmwr.mm6501a1
23. Kuhn S. Opioid addiction and implications for employers. Benefits Q. 2017;33:33–36.
 © 2020 The Author(s). This work is published and licensed by Dove Medical Press Limited. The full terms of this license are available at https://www.dovepress.com/terms.php and incorporate the Creative Commons Attribution - Non Commercial (unported, v3.0) License.
By accessing the work you hereby accept the Terms. Non-commercial uses of the work are permitted without any further permission from Dove Medical Press Limited, provided the work is properly attributed. For permission for commercial use of this work, please see paragraphs 4.2 and 5 of our Terms.
© 2020 The Author(s). This work is published and licensed by Dove Medical Press Limited. The full terms of this license are available at https://www.dovepress.com/terms.php and incorporate the Creative Commons Attribution - Non Commercial (unported, v3.0) License.
By accessing the work you hereby accept the Terms. Non-commercial uses of the work are permitted without any further permission from Dove Medical Press Limited, provided the work is properly attributed. For permission for commercial use of this work, please see paragraphs 4.2 and 5 of our Terms.