")
Back to Journals » ClinicoEconomics and Outcomes Research » Volume 11
Healthcare Costs of Potential Glucocorticoid-Associated Adverse Events in Patients with Giant Cell Arteritis
Authors Best JH, Kong AM , Smith DM, Abbass I , Michalska M
Received 24 August 2019
Accepted for publication 21 November 2019
Published 23 December 2019 Volume 2019:11 Pages 799—807
DOI https://doi.org/10.2147/CEOR.S228400
Checked for plagiarism Yes
Review by Single anonymous peer review
Peer reviewer comments 4
Editor who approved publication: Dr Samer Hamidi
Jennie H Best,1 Amanda M Kong,2 David M Smith,2 Ibrahim Abbass,1 Margaret Michalska1
1Genentech, Inc., South San Francisco, CA, USA; 2IBM Watson Health, Cambridge, MA, USA
Correspondence: Jennie H Best
Genentech, Inc., 1 DNA Way, South San Francisco, CA 94080, USA
Tel +1 858 361-4937
Email [email protected]
Objective: To quantify the healthcare expenditures associated with potential oral glucocorticoid (OGC)-related adverse events (AEs) in patients with giant cell arteritis (GCA).
Methods: Patients with GCA and ≥ 1 OGC prescription fill between 2009 and 2014 were identified from the MarketScan Commercial and Medicare Supplemental claims databases. Patients were stratified into four groups based on cumulative OGC dose (> 0 to ≤ 2607 mg, > 2607 to ≤ 4800 mg, > 4800 to ≤ 7200 mg, and > 7200 mg) during the 1-year follow-up period; incidence of potential AEs and AE-related direct healthcare costs in USD were assessed. Association between the log of cumulative OGC dose and AE-related direct healthcare costs was evaluated, adjusting for baseline characteristics.
Results: Of 1602 patients with GCA included, 69% were women; the mean age was 73 years. The mean cumulative OGC dose was 5806 mg during the 1-year follow-up; most exposure occurred in the first 6 months. The proportion of patients with potential OGC-related AEs was 36.5% overall and increased as cumulative dose increased (30.7%–45.3% across dose groups). Unadjusted mean AE-related costs for patients with an AE was USD $12,818. In the multivariable model including all patients, increasing OGC dose was associated with increasing AE-related healthcare costs (cost ratio, 1.38 [95% CI, 1.16–1.64] per 1-unit increase in log of cumulative OGC dose [P < 0.001]). Mean (median)-predicted AE costs for the dose groups were USD $4389 ($2749) for > 0 to ≤ 2607 mg, USD $5176 ($3009) for > 2607 to ≤ 4800 mg, USD $5576 ($3633) for > 4800 to ≤ 7200 mg, and USD $6609 ($4447) for > 7200 mg.
Conclusion: In patients with GCA, OGC-related AEs increased with increasing cumulative OGC dose, resulting in increased healthcare costs. These results highlight the need for efficacious therapies that reduce the exposure to and potential risks associated with OGCs.
Keywords: giant cell arteritis, glucocorticoid, adverse events, healthcare expenditures
Plain Language Summary
Why Was This Study Done?
- Patients with giant cell arteritis (GCA) experience a narrowing or blockage of the blood vessels in their scalp, neck, and arms; when left untreated, GCA can lead to vision loss.
- Patients with GCA receive high doses of glucocorticoids, often for long periods of time, which is associated with side effects such as infections, osteoporosis, fractures and diabetes.
- These glucocorticoid-related side effects may lead to increased healthcare costs for patients with GCA.
- The purpose of this study was to quantify the healthcare costs that are associated with potential glucocorticoid-related side effects in patients with GCA.
What Did This Study Find?
- 36.5% of patients with GCA experienced potential glucocorticoid-related side effects.
- Patients who were treated with higher overall amounts of glucocorticoids experienced more potential glucocorticoid-related side effects, resulting in increased healthcare costs.
What Do the Results Mean?
- This study suggests that glucocorticoids can have a substantial effect on risk of side effects and healthcare costs for patients with GCA.
- The findings also demonstrate that patients with GCA need effective treatments that can reduce their exposure to glucocorticoids and the risks associated with potential glucocorticoid-related side effects.
Introduction
Giant cell arteritis (GCA), which affects medium- to large-sized blood vessels, is the most common form of systemic vasculitis.1 Clinical symptoms include headache, scalp tenderness, jaw claudication, and transient or permanent vision loss;2 permanent vision loss occurs in an estimated 10% to 20% of patients with GCA.3,4 Markers of inflammation, including erythrocyte sedimentation rate and C-reactive protein levels, are elevated in patients with GCA. GCA is most common among women, particularly in those > 50 years of age.5 The annual incidence and prevalence of GCA in the United States are estimated to be 18.9 per 100,000 and 228 per 100,000, respectively.6,7
The mainstay of treatment for GCA is immediate initiation of high-dose glucocorticoids (GCs), typically prednisolone, followed by tapering over many months after symptoms have resolved and erythrocyte sedimentation rate and C-reactive protein levels have normalized.8 Tapering or discontinuation of GCs often leads to disease relapses requiring reinitiation of GCs, necessitating prolonged use and resulting in high cumulative doses over time.9–11 Chronic GC exposure is associated with increased risk of adverse effects and comorbidities in patients with GCA, including infections, osteoporosis, fractures, cataract, glaucoma, and diabetes.9,11–14 Increased cumulative GC dose in patients with GCA has been shown to be associated with an increased risk of GC-related adverse events (AEs).12 A similar association between cumulative GC exposure and burden of GC-related AEs and comorbidities also exists in patients with rheumatoid arthritis.15
Prior studies have demonstrated the significant economic burden of GCA in the United States. A prior healthcare cost analysis reported that patients with GCA experience substantially higher healthcare costs (> USD $16,000 more) in the first year following diagnosis than patients without GCA.16 GCA was identified as a major contributor to the USD $150 million in annual hospitalization costs associated with vasculitis in the United States.17 A model-based study projected that from 2015 to 2050, the estimated costs associated with GCA-related visual impairments and steroid-induced fractures will reach USD $76 billion and USD $6 billion, respectively.18 However, limited data exist specifically on GC-related healthcare costs in patients with GCA. The objective of this analysis was to quantify the healthcare expenditures associated with potential oral GC (OGC)-related AEs in patients with GCA across levels of cumulative OGC dose.
Methods
Data Source
This study used administrative healthcare claims from the US-based IBM MarketScan Commercial and Medicare Supplemental databases from January 1, 2008, to June 30, 2016. These databases include detailed costs, including both insurer-paid and patient out-of-pocket costs for medical services and prescriptions, use, and outcomes data for healthcare services performed in both inpatient and outpatient settings. All study data were de-identified and fully compliant with the Health Insurance Portability and Accountability Act of 1996; therefore, approval from an institutional review board was not required. Variables were measured using International Classification of Diseases, Clinical Modification (ICD-9-CM and/or ICD-10-CM) diagnosis and procedure codes, Healthcare Common Procedure Coding System codes, and National Drug Codes (NDC), as appropriate.
Patient Selection and Study Design
Patients who met the following criteria were identified: ≥ 1 inpatient or 2 outpatient nondiagnostic medical claims (≥ 7 days apart) with an ICD-9-CM diagnosis code for GCA in any diagnosis position between January 1, 2009, and June 30, 2014; ≥ 1 OGC drug prescription within 6 months after the GCA diagnosis date (index date = date of first OGC prescription on or after GCA diagnosis date) and a second OGC claim within 6 months after the first OGC claim; aged ≥ 50 years at the index date; ≥ 1 diagnostic workup claim (≤ 1 year pre- or postindex) for temporal artery biopsy, magnetic resonance angiography, computed tomography angiography, or positron emission tomography-computed tomography; ≥ 1 claim with a GCA diagnosis after the diagnostic workup claim; ≥ 12 months of continuous enrollment with medical and pharmacy benefits before the index date and before the GCA diagnosis date; no prior claims with a GCA diagnosis (≤ 1 year preindex); no tocilizumab or anti-tumor necrosis factor agent exposure during the 1 year before the index date; 2 years of continuous enrollment with medical and pharmacy benefits after the index date; and no nondiagnostic claims with a diagnosis of any other autoimmune disease (ie, ankylosing spondylitis, Crohn disease, juvenile idiopathic arthritis, polyarteritis nodosa, psoriatic arthritis, ulcerative colitis, granulomatosis with polyangiitis, systemic lupus erythematosus, and rheumatoid arthritis) 1 year before or 2 years after the index date.
The exposure period for OGC use was defined as the first year after the index date, and the evaluation period for assessment of AEs and healthcare costs was defined as the first and second years after the index date; however, 2-year results are not presented here as the majority of OGC exposure occurred early in follow-up (Figure 1). Cumulative dose of OGCs was measured during the 1-year postindex period based on the service date, days’ supply, and strength of the NDC for OGC outpatient pharmacy claims and converted to prednisone-equivalent milligrams. Patients were stratified into 4 groups based on quartiles of the distribution of cumulative OGC exposure.
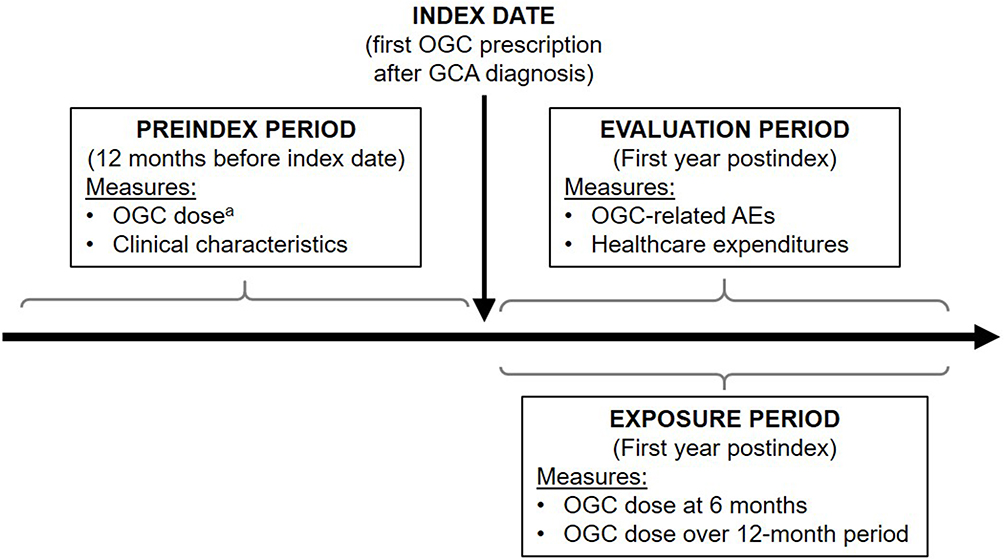 |
Figure 1 Study design. Note: aFor conditions existing prior to GCA diagnosis. Abbreviations: AE, adverse event; GCA, giant cell arteritis; OGC, oral glucocorticoid. |
Outcomes
The incidence of potential OGC-related AEs was evaluated during the 1-year postindex period based on diagnosis codes for the following conditions in inpatient and outpatient medical claims: osteoporosis, nonvertebral or vertebral fracture, aseptic necrosis of bone, hospitalization for pneumonia or opportunistic or serious infection, hospitalization for myocardial infarction or stroke, type 2 diabetes, ulcer or gastrointestinal bleed, and gastrointestinal perforation. Patients who had evidence of chronic AEs in the preindex period were not eligible to contribute to the analyses of those AEs in the exposure period (osteoporosis, type 2 diabetes, ulcer/gastrointestinal bleed).
Payments on medical claims with a relevant diagnosis code for a potential AE (conditions described in the previous paragraph) in any position and pharmacy claims for AE-related medications during the evaluation period were considered as potential OGC-related AE costs; patients who had evidence of chronic AEs in the preindex period were not eligible to contribute to the analyses of the costs for those AEs in the exposure period. Preindex costs were also estimated using payments on all medical claims and pharmacy costs. Costs were captured in 2016 US dollars.
Statistical Analysis
Descriptive and bivariate statistics (eg, χ2 tests and two-sided, two sample Student's t-tests of means) were used to compare preindex characteristics and the proportion of patients with AEs between each of the 3 higher cumulative dose groups and the lowest cumulative dose group (> 0 to ≤ 2607 mg).
Generalized linear models with log-link and gamma distribution were fit to evaluate the association between OGC exposure (included as the log of continuous cumulative dose) and potential AE-related healthcare costs for all patients, controlling for patient characteristics. Covariates in the multivariable model were age group, sex, region, index year, AE in the preindex period, AE-related medication in the preindex period, hypothyroidism, ischemic heart disease, cancer, asthma/chronic obstructive pulmonary disease, Deyo-Charlson Comorbidity Index, number of unique diagnosis codes and unique NDCs, log of preindex costs, preindex OGC use, and an interaction between preindex OGC use and preindex OGC dose.
Mean and median predicted potential AE-related costs were displayed by dosing groups. P values of < 0.05 were considered statistically significant. SAS version 9.4 was used for all statistical analyses.
Results
Study Population and Patient Characteristics
Between January 1, 2009, and June 30, 2014, there were 16,868 patients with ≥ 1 inpatient or 2 outpatient claims with a GCA diagnosis. After applying the inclusion criteria, 1602 patients were included (Figure 2). The mean cumulative OGC dose in the 1-year follow-up period was 5806 mg, with the most exposure (4438 mg) occurring in the first 6 months. Patients were categorized into groups based on OGC exposure, representing the following distributions: > 0 to ≤ 2607 mg, > 2607 to ≤ 4800 mg, > 4800 to ≤ 7200 mg, and > 7200 mg.
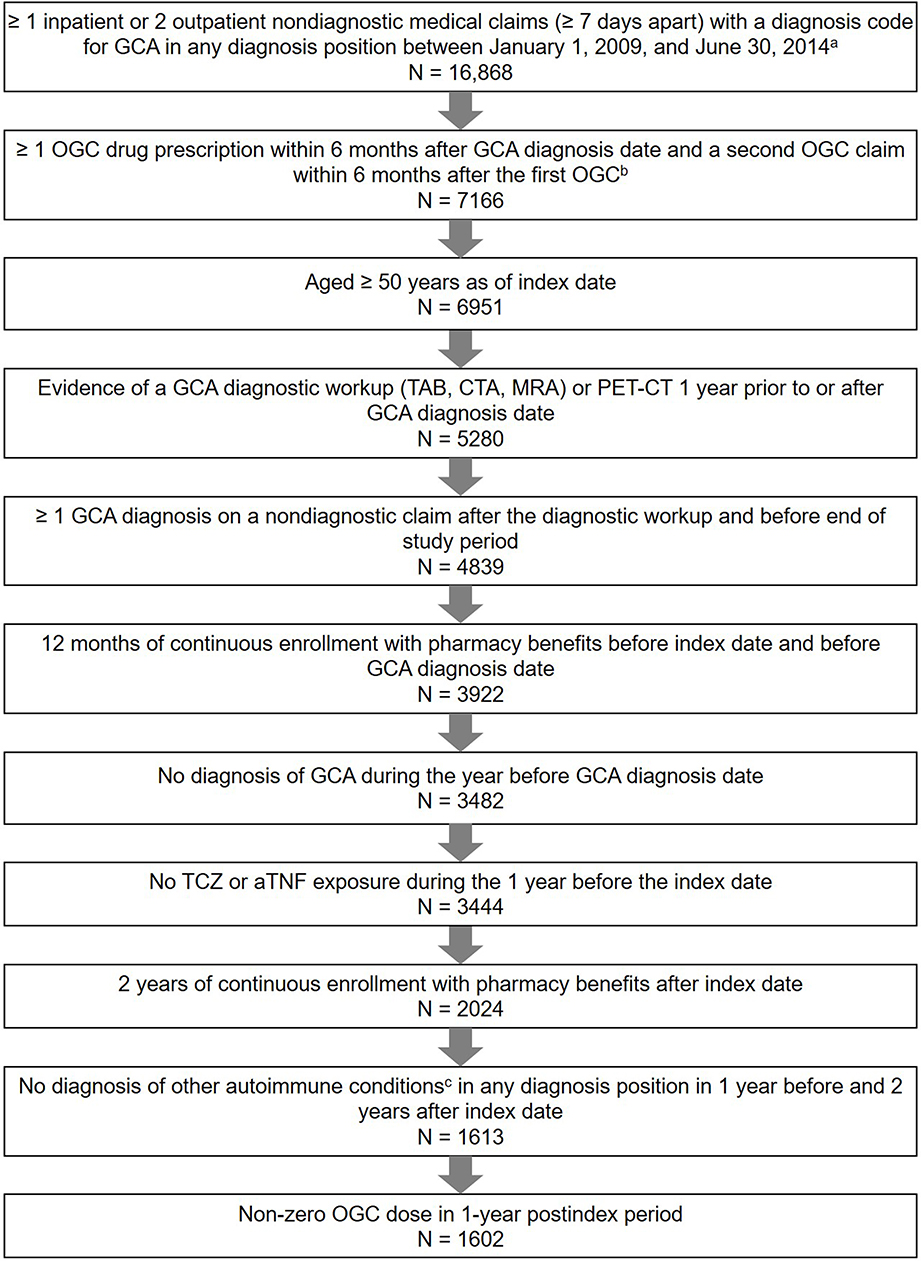 |
Figure 2 Sample attrition. Notes: aGCA diagnosis date was defined as the first date of a GCA diagnosis during the index period. bThe index date was defined as the first date of OGC prescription after GCA diagnosis during the index period. cAnkylosing spondylitis, Crohn disease, juvenile idiopathic arthritis, polyarteritis nodosa, psoriatic arthritis, ulcerative colitis, granulomatosis with polyangiitis, systemic lupus erythematosus, and rheumatoid arthritis. Abbreviations: aTNF, anti-tumor necrosis factor inhibitor; CTA, computed tomography angiography; GCA, giant cell arteritis; MRA, magnetic resonance angiography; OGC, oral glucocorticoid; PET-CT, positron emission topography-computed tomography; TAB, temporal artery biopsy; TCZ, tocilizumab. |
The mean age was 73.2 years (SD, 10.0 years), with no significant differences between the OGC dose groups (Table 1). Most patients (68.9%) were female; the proportion of female patients was highest in the lowest cumulative OGC dose group compared with each of the other dose groups, but these differences were not statistically significant (P values = 0.06–0.07). Patients in the lowest cumulative OGC dose group had significantly higher preindex Deyo-Charlson Comorbidity Index scores compared with each of the 3 higher dose groups (Table 1). Although preindex GCA-related blindness was rare (6.9% overall), it was significantly higher in the highest cumulative OGC dose group than in the lowest dose group (11.5% vs 4.7%; P < 0.001).
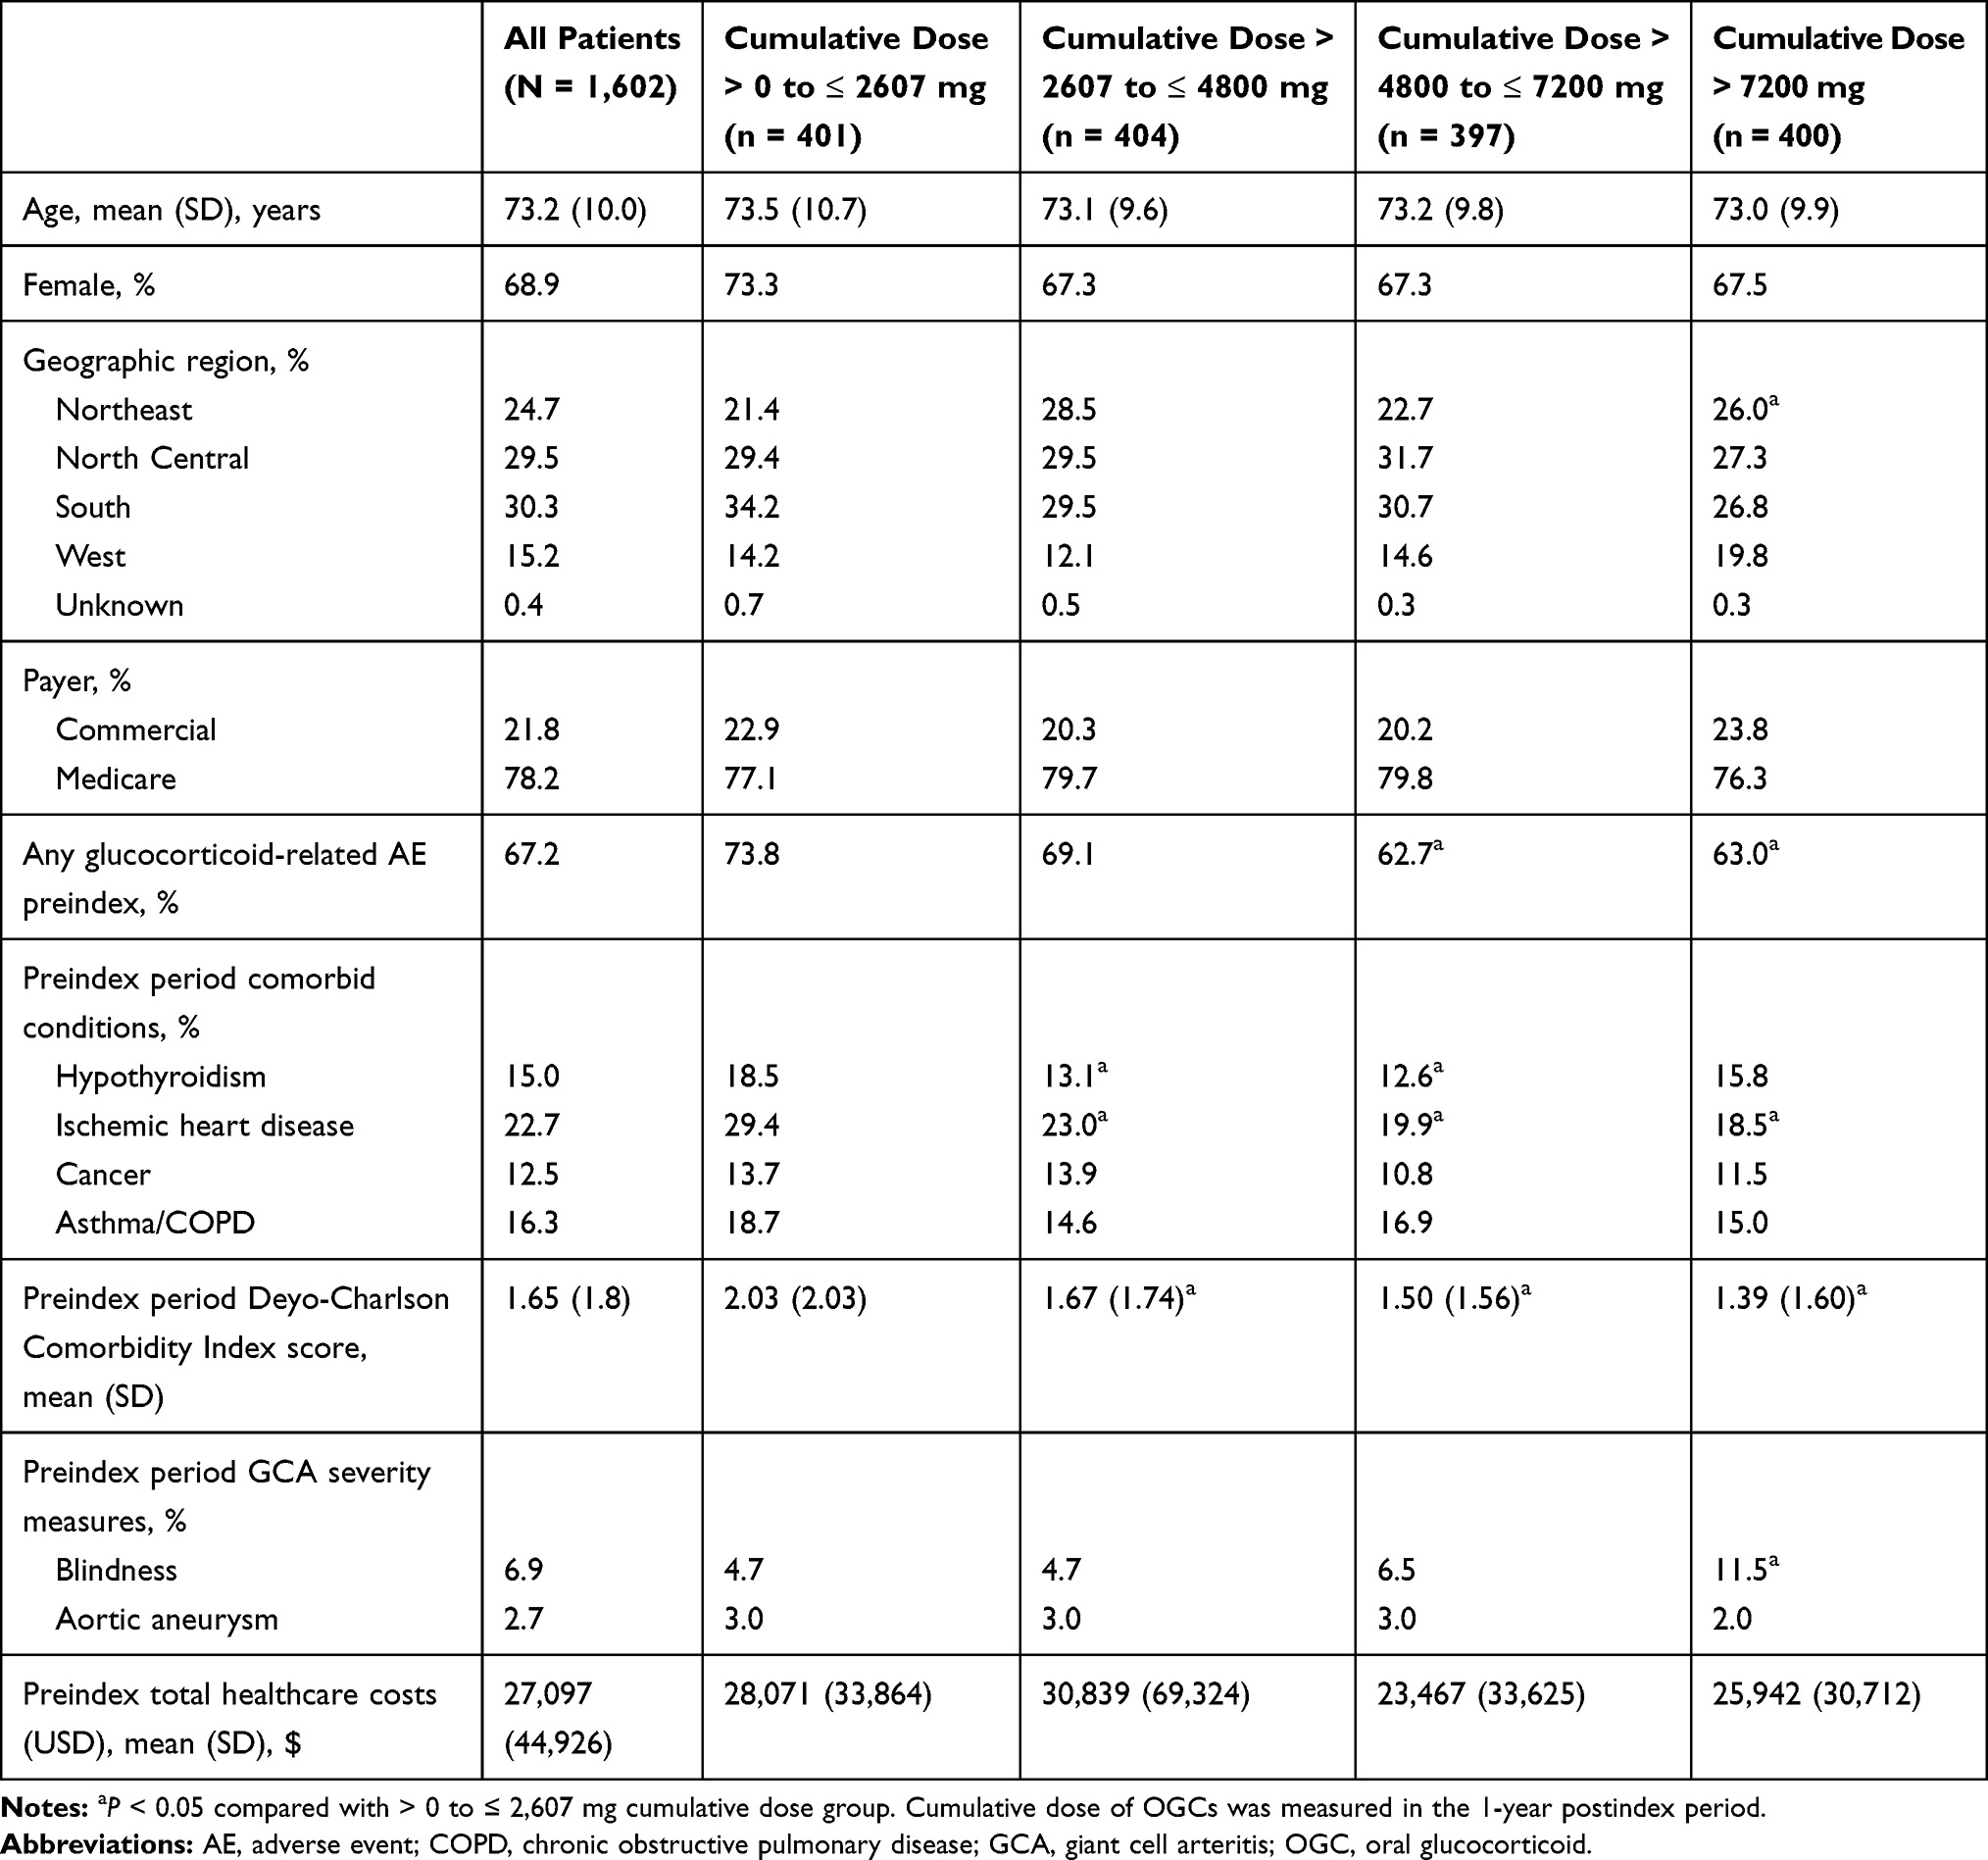 |
Table 1 Preindex Demographics and Clinical Characteristics |
The mean all-cause preindex healthcare costs tended to be higher for lower dose groups, but there were no significant differences when comparing the lowest dose group with the 3 higher dose groups.
Potential OGC-Related AEs and Healthcare Costs
During the 1-year postindex period, a significantly higher proportion of patients in the highest cumulative OGC dose group had a potential OGC-related AE than those in the lowest dose group (45.3% vs 30.7%; P < 0.001; Figure 3). Unadjusted mean 1-year potential AE-related costs were higher for the highest cumulative dose group than for the lowest dose group (USD $5410 [SD, $20,908] vs USD $4972 [SD, $20,400]); however, the difference was not statistically significant. In the multivariable model, increasing cumulative OGC dose was associated with increasing potential AE-related healthcare costs (Figure 4; Table 2), with a cost ratio of 1.38 (95% CI, 1.16–1.64) per 1-unit increase in log of cumulative OGC dose (P < 0.001). The mean predicted costs for AEs increased gradually with the increase in cumulative dose from USD $4389 (SD, $5184) to USD $6609 (SD, $7281); median predicted costs increased from USD $2749 to USD $4447 from the lowest to highest OGC dose group. Among only patients with an AE (n = 584), the unadjusted mean and median 1-year potential AE-related costs were USD $12,818 (SD, $29,718) and USD $1844, respectively.
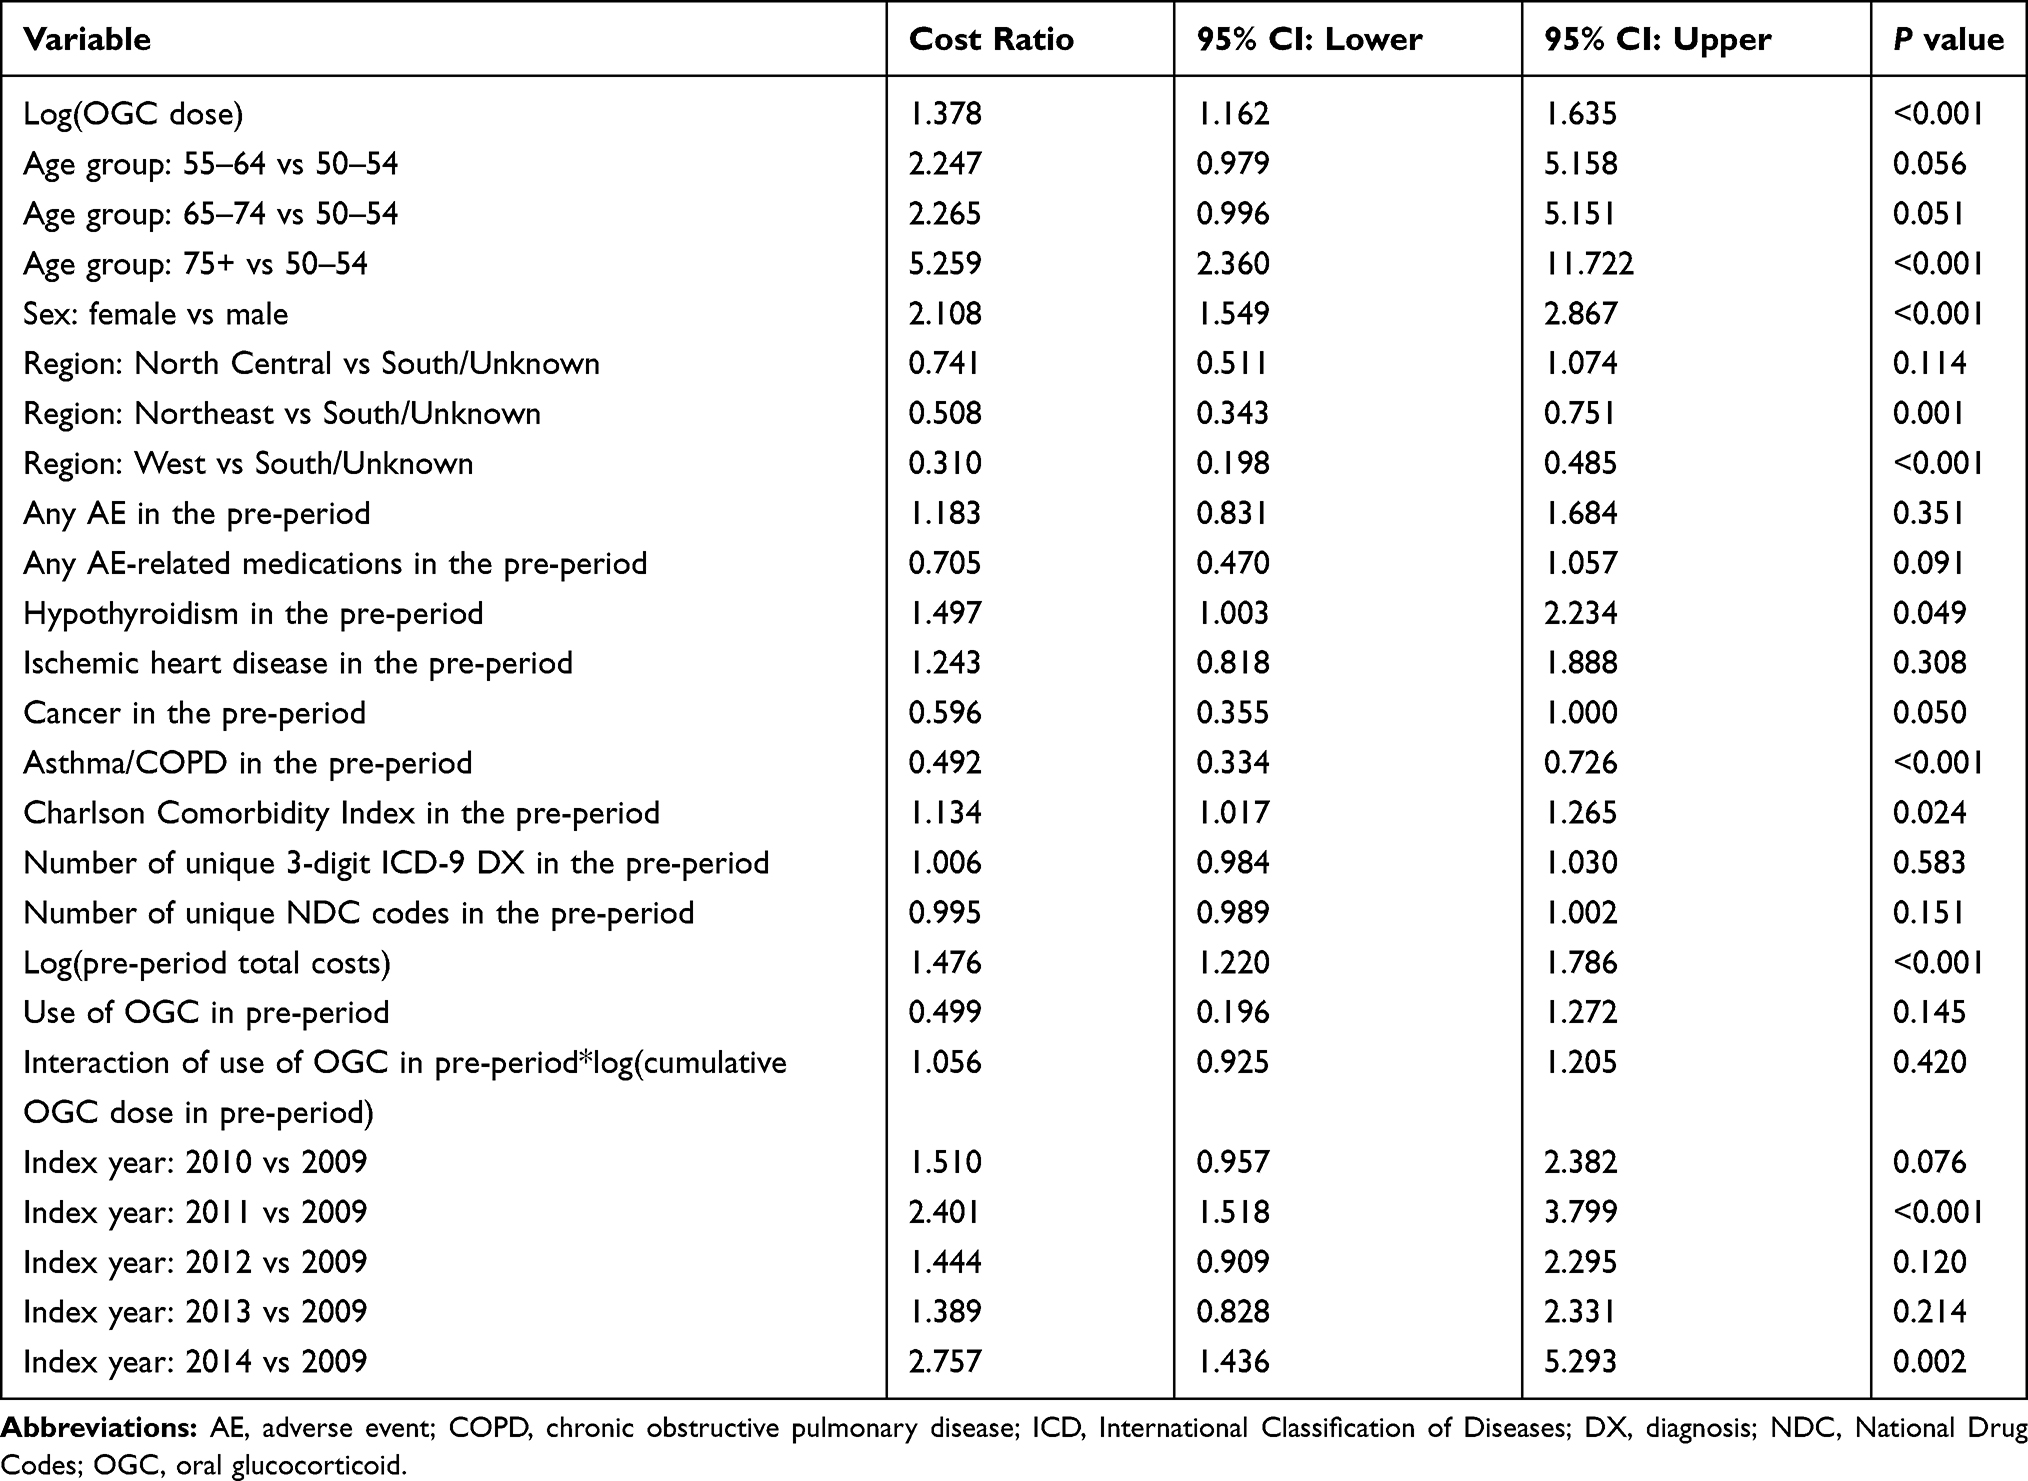 |
Table 2 Model Output from Gamma Cost Models |
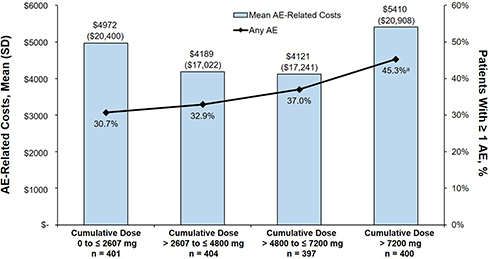 |
Figure 3 Proportion of patients with AEs and mean (unadjusted) AE-related costs (USD) in the 1-year postindex period. Notes: aP < 0.001 compared with > 0 to ≤ 2607 mg cumulative dose group. Cumulative dose of OGCs was measured in the 1-year postindex period. Abbreviations: AE, adverse event; OGC, oral glucocorticoid. |
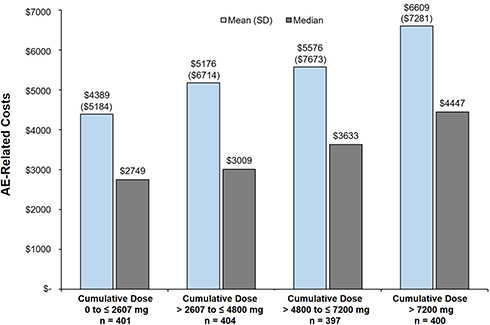 |
Figure 4 Predicted mean and predicted median AE-related costs (USD) in the 1-year postindex period. Notes: Cumulative dose of OGCs was measured in the 1-year postindex period. Patients with USD $0 were assigned USD $1 to be included in models. Covariates were age group, sex, region, index year, AE in the preindex period, AE-related medication in the preindex period, hypothyroidism, ischemic heart disease, cancer, asthma/COPD, Deyo-Charlson Comorbidity Index, number of unique diagnosis codes and unique National Drug Codes, log of preindex costs, preindex OGC use, and an interaction between preindex OGC use and preindex OGC dose. Abbreviations: AE, adverse event; OGC, oral glucocorticoid. |
Discussion
In this large US claims-based real-world study of patients with GCA, the proportion of patients experiencing a potential OGC-related AE in the 1 year following initiation of OGCs increased with increasing cumulative OGC exposure. Higher cumulative OGC dose was significantly associated with increased AE-related healthcare costs. For patients exposed to a cumulative OGC dose of > 7200 mg over 1 year, the adjusted mean AE-related costs were estimated to be USD $2220 higher than for patients exposed to ≤ 2607 mg OGC.
Patients with lower cumulative OGC dose had significantly higher baseline comorbidities than those with higher cumulative OGC doses. This may reflect a cautionary approach by the treating physician of prescribing OGCs at a lower dose to avoid further complications in patients with significant comorbidities. In contrast, patients with blindness in the preindex period had the highest cumulative OGC doses. This may be due to a more aggressive approach by the treating physician to treat more severe GCA disease activity.
The trend in increased rates of potential OGC-related AEs with increasing cumulative OGC exposure in patients with GCA is consistent with previous findings from US healthcare claims databases and the UK Clinical Practice Research Datalink.9,12,14 Prior studies have reported the association between the initial dose of prednisone and rates of AEs in patients with GCA.19,20 Our study adds to the evidence of the association between cumulative steroid dose and increased steroid-related AEs in patients with GCA.
To our knowledge, this is the first study to evaluate costs of potential OGC-related AEs in patients with GCA using real-world data. A 2017 study also using US healthcare claims data demonstrated that in the year following diagnosis, estimated total healthcare costs were USD $16,431 more in patients with GCA than in patients without GCA.16 Notably, the estimated increase in pharmacy costs in patients with GCA compared with controls during the first year after diagnosis was only USD $663; this was likely because steroids, the mainstay of treatment for GCA, are relatively inexpensive. However, our current study suggests that steroids can have a substantial effect on costs for patients with GCA, as higher cumulative OGC dose was associated with increased AEs and AE-related healthcare costs. The impact of cumulative OGC dose on AEs and AE-related costs is particularly important in GCA, given the chronic nature of the disease and the older age and increased frequency of comorbidities in the GCA patient population.
A strength of this study lies in the large real-world population of patients with GCA. Furthermore, this study adds to the literature on the association between cumulative OGC dose and potential OGC-related AEs and costs. This study also had limitations. The results of this analysis may not be generalizable to patients with GCA who have other insurance or no health insurance coverage. This study included new initiators as well as continuing users of OGCs. Mixing prevalent and incident user groups may lead to biases such as under-ascertainment of early events or “healthy user bias” due to prevalent users being adherent medication users. Due to the requirement for 2 years enrollment after the index date, those who died or became uninsured during those 2 years were excluded; this could have led to a healthy survivor effect. Medication dose was calculated based on the information on claims and may not accurately reflect actual use. Patients were assumed to have taken the medication as prescribed, but how the medication was consumed or whether it was taken as prescribed could not be confirmed. Although patients who had evidence of chronic AEs in the preindex period were not eligible to contribute to the analyses of the risks and/or costs of those AEs during the index period, it is possible that some of the risks and/or costs that were captured are attributable to other chronic or concurrent diseases.
As patients with GCA tend to be older and have significant comorbidities at the time of diagnosis, a quantitative understanding of GC exposure and GC-related AEs in patients with GCA is important for evaluating the benefit-risk of steroid-sparing agents in the treatment of GCA. Understanding the impact of cumulative GC exposure on healthcare costs associated with potential GC-related AEs is important for evaluating the role and position of steroid-sparing agents, such as tocilizumab, in treating GCA.21
Conclusions
Rates of potential OGC-related AEs in patients with GCA tended to increase with an increase in cumulative OGC dose, which resulted in increased healthcare costs. These results highlight the need for efficacious therapies to treat GCA that reduce the exposure to and potential risks associated with OGCs.
Abbreviations
AE, adverse event; GC, glucocorticoid; GCA, giant cell arteritis; ICD-CM, International Classification of Diseases, Clinical Modification; NDC, National Drug Code; OGC, oral glucocorticoid.
Ethics Approval and Informed Consent
This study used administrative healthcare claims from the US-based IBM MarketScan Commercial and Medicare Supplemental databases. All study data were de-identified and fully compliant with the Health Insurance Portability and Accountability Act of 1996; therefore, approval from an institutional review board was not required.
Data Availability
Qualified researchers may request access to data through the clinical study data request platform, www.clinicalstudydatarequest.com. Further details on Roche’s criteria for eligible studies are available here (https://clinicalstudydatarequest.com/Study-Sponsors/Study-Sponsors-Roche.aspx). For further details on Roche’s Global Policy on the Sharing of Clinical Information and how to request access to related clinical study documents, see here (https://www.roche.com/research_and_development/who_we_are_how_we_work/clinical_trials/our_commitment_to_data_sharing.htm).
Acknowledgments
This study was funded by Genentech, Inc. Some of these data were presented as a poster presentation at the International Society for Pharmacoeconomics and Outcomes Research conference in 2018. The abstract is published online in a supplement of Value in Health (Best JH, Kong A, Smith D, Abbass I, Michalska M. Value Health. 2018;21 [Suppl 1]), available at: https://www.valueinhealthjournal.com/article/S1098-3015(18)32021-7/fulltext. An oral presentation was given at the American College of Rheumatology Annual Meeting in 2018. The abstract is published in an online supplement of Arthritis & Rheumatology (Best JH, Kong A, Smith D, Abbass I, Michalska M. Arthritis Rheumatol. 2018;70 [suppl 10]), available at: https://acrabstracts.org/abstract/healthcare-cost-of-potential-glucocorticoid-associated-adverse-events-in-patients-with-giant-cell-arteritis/. Support for third-party writing assistance for this manuscript, furnished by Health Interactions, Inc, was provided by Genentech, Inc.
Disclosure
JH Best, I Abbass, and M Michalska are employees and shareholders of Genentech, Inc. AM Kong and DM Smith are employees of IBM Watson Health. The authors report no other conflicts of interest in this work.
References
1. Pfeil A, Oelzner P, Hellmann P. The treatment of giant cell arteritis in different clinical settings. Front Immunol. 2019;9:3129. doi:10.3389/fimmu.2018.03129
2. Ness T, Bley TA, Schmidt WA, Lamprecht P. The diagnosis and treatment of giant cell arteritis. Dtsch Arztebl Int. 2013;110(21):376–385. doi:10.3238/arztebl.2013.0376
3. Gonzalez-Gay MA, Garcia-Porrua C, Llorca J, et al. Visual manifestations of giant cell arteritis. Trends and clinical spectrum in 161 patients. Medicine (Baltimore). 2000;79(5):283–292. doi:10.1097/00005792-200009000-00001
4. Salvarani C, Cantini F, Boiardi L, Hunder GG. Polymyalgia rheumatica and giant-cell arteritis. N Engl J Med. 2002;347(4):261–271. doi:10.1056/NEJMra011913
5. Nesher G, Breuer GS. Giant cell arteritis and polymyalgia rheumatica: 2016 update. Rambam Maimonides Med J. 2016;7(4):e0035. doi:10.5041/RMMJ.20769172
6. Kermani TA, Schafer VS, Crowson CS, et al. Increase in age at onset of giant cell arteritis: a population-based study. Ann Rheum Dis. 2010;69(4):780–781. doi:10.1136/ard.2009.111005
7. Lawrence RC, Felson DT, Helmick CG, et al. Estimates of the prevalence of arthritis and other rheumatic conditions in the United States. Part II. Arthritis Rheum. 2008;58(1):26–35. doi:10.1002/art.23176
8. Fraser JA, Weyand CM, Newman NJ, Biousse V. The treatment of giant cell arteritis. Rev Neuro Dis. 2008;5(3):140–152.
9. Broder MS, Sarsour K, Chang E, et al. Corticosteroid-related adverse events in patients with giant cell arteritis: a claims-based analysis. Semin Arthritis Rheum. 2016;46(2):246–252. doi:10.1016/j.semarthrit.2016.05.009
10. Kotter I, Henes JC, Wagner AD, Loock J, Gross WL. Does glucocorticosteroid-resistant large-vessel vasculitis (giant cell arteritis and Takayasu arteritis) exist and how can remission be achieved? A critical review of the literature. Clin Exp Rheumatol. 2012;30(1 Suppl 70):S114–S129.
11. Proven A, Gabriel SE, Orces C, O’Fallon WM, Hunder GG. Glucocorticoid therapy in giant cell arteritis: duration and adverse outcomes. Arthritis Rheum. 2003;49(5):703–708. doi:10.1002/(ISSN)1529-0131
12. Gale S, Wilson JC, Chia J, et al. Risk associated with cumulative oral glucocorticoid use in patients with giant cell arteritis in real-world databases from the USA and UK. Rheumatol Ther. 2018;5(2):1–14.
13. Lai LYH, Harris E, West RM, Mackie SL. Association between glucocorticoid therapy and incidence of diabetes mellitus in polymyalgia rheumatica and giant cell arteritis: a systematic review and meta-analysis. RMD Open. 2018;4(1):e000521. doi:10.1136/rmdopen-2017-000521
14. Wilson JC, Sarsour K, Collinson N, et al. Serious adverse effects associated with glucocorticoid therapy in patients with giant cell arteritis (GCA): a nested case-control analysis. Semin Arthritis Rheum. 2017;46(6):819–827. doi:10.1016/j.semarthrit.2016.11.006
15. Best JH, Kong AM, Lenhart GM, Sarsour K, Stott-Miller M, Hwang Y. Association between glucocorticoid exposure and healthcare expenditures for potential glucocorticoid-related adverse events in patients with rheumatoid arthritis. J Rheumatol. 2018;45(3):320–328. doi:10.3899/jrheum.170418
16. Babigumira JB, Li M, Boudreau DM, Best JH, Garrison LP. Estimating the cost of illness of giant cell arteritis in the United States. Rheumatol Ther. 2017;4(1):111–119. doi:10.1007/s40744-017-0052-8
17. Cotch MF. The socioeconomic impact of vasculitis. Curr Opin Rheumatol. 2000;12(1):20–23. doi:10.1097/00002281-200001000-00004
18. De Smit E, Palmer AJ, Hewitt AW. Projected worldwide disease burden from giant cell arteritis by 2050. J Rheumatol. 2015;42(1):119–125. doi:10.3899/jrheum.140318
19. Chandran A, Udayakumar PD, Kermani TA, Warrington KJ, Crowson CS, Matteson EL. Glucocorticoid usage in giant cell arteritis over six decades (1950 to 2009). Clin Exp Rheumatol. 2015;33(2 Suppl 89):S98–S102.
20. Nesher G, Sonnenblick M, Friedlander Y. Analysis of steroid related complications and mortality in temporal arteritis: a 15-year survey of 43 patients. J Rheumatol. 1994;21(7):1283–1286.
21. Stone JH, Tuckwell K, Dimonaco S, et al. Trial of tocilizumab in giant-cell arteritis. N Engl J Med. 2017;377(4):317–328. doi:10.1056/NEJMoa1613849
 © 2019 The Author(s). This work is published and licensed by Dove Medical Press Limited. The full terms of this license are available at https://www.dovepress.com/terms.php and incorporate the Creative Commons Attribution - Non Commercial (unported, v3.0) License.
By accessing the work you hereby accept the Terms. Non-commercial uses of the work are permitted without any further permission from Dove Medical Press Limited, provided the work is properly attributed. For permission for commercial use of this work, please see paragraphs 4.2 and 5 of our Terms.
© 2019 The Author(s). This work is published and licensed by Dove Medical Press Limited. The full terms of this license are available at https://www.dovepress.com/terms.php and incorporate the Creative Commons Attribution - Non Commercial (unported, v3.0) License.
By accessing the work you hereby accept the Terms. Non-commercial uses of the work are permitted without any further permission from Dove Medical Press Limited, provided the work is properly attributed. For permission for commercial use of this work, please see paragraphs 4.2 and 5 of our Terms.