")
Back to Journals » ClinicoEconomics and Outcomes Research » Volume 12
Healthcare Costs of Diabetes and Microvascular and Macrovascular Disease in Individuals with Incident Type 2 Diabetes Mellitus: A Ten-Year Longitudinal Study
Authors Visaria J, Iyer NN , Raval AD , Kong SX, Hobbs T, Bouchard J, Kern DM , Willey VJ
Received 29 January 2020
Accepted for publication 12 July 2020
Published 10 August 2020 Volume 2020:12 Pages 423—434
DOI https://doi.org/10.2147/CEOR.S247498
Checked for plagiarism Yes
Review by Single anonymous peer review
Peer reviewer comments 3
Editor who approved publication: Dr Samer Hamidi
Jay Visaria,1 Neeraj N Iyer,2 Amit D Raval,3 Sheldon X Kong,2 Todd Hobbs,2 Jonathan Bouchard,2 David M Kern,4 Vincent J Willey1
1HealthCore, Inc., Wilmington, DE, USA; 2Novo Nordisk, Inc., Plainsboro Township, NJ, USA; 3Merck & Co., Inc, Kenilworth, NJ, USA; 4Janssen Research and Development, Titusville, NJ, USA
Correspondence: Jay Visaria
HealthCore, Inc., 123 Justison Street, Suite 200, Wilmington, DE 19801, USA
Tel +1 302 230-2117
Email [email protected]
Objective: The objective of this study was to estimate the incremental long-term costs associated with T2DM attributable to vascular diseases.
Research Design and Methods: This retrospective cohort study identified newly diagnosed (incident) T2DM patients in 2007 (baseline to 01/01/2006) using the HealthCore Integrated Research Database, a repository of nationally representative claims data. Incident T2DM patients were 1:1 exact matched on age, gender and other factors of interest to non-DM patients, and followed until the earlier of 8 follow-up years or death. Patients with documented vascular disease diagnosis were identified during the study period. All-cause and T2DM/vascular disease-related annual healthcare costs were examined for each follow-up year.
Results: The study included 13,883 individuals with T2DM and matched non-DM controls. Among individuals with T2DM, 11,792 (85%) had vascular disease versus 9251 (66.6%) non-T2DM between 01/01/2006 and 12/31/2015. Among T2DM patients, mean all-cause annual costs were greater than in non-T2DM patients ($13,806 vs $7,243, baseline, $21,745 vs $8,524, post-index year 1, $12,756-$14,793 vs $8,349-$9,940 years 2– 8, p< 0.001), respectively. A similar trend was observed for T2DM/vascular disease-related costs (p< 0. 001). T2DM/vascular disease-related costs were largest during post-index year 1, accounting for the majority of all-cause cost difference between T2DM patients and matched non-DM controls. Incident T2DM individuals without vascular disease at any time had significantly lower costs compared to non-DM controls (p< 0. 001) between years 2– 8 of follow-up.
Conclusion: Vascular disease increased the cost burden for individuals with T2DM. The cost impact of diabetes and vascular disease was highest in the year after diagnosis, and persisted for at least seven additional years, while the cost of T2DM patients without vascular disease trended lower than for matched non-DM patients. These data highlight potential costs that could be offset by earlier and more effective detection and management of T2DM aimed at reducing vascular disease burden.
Keywords: type 2 diabetes mellitus, microvascular complications, macrovascular complications, diabetes, healthcare costs, diabetes costs
Plain Language Summary
Each year, in excess of one million individuals are newly diagnosed with T2DM, substantially adding to the more than 30 million Americans living with diabetes. The total healthcare costs attributed to diabetes management are estimated at $176 billion annually, which are projected to escalate substantially during the next few decades. Previously published long-term estimates of diabetes costs seldom reflect real-world disease progression and are often compiled from inputs derived from economic models using multiple studies. This claims-based database study shows that vascular disease drives much of the incremental cost burden in individuals with T2DM, especially in the first year after diagnosis, however costs did persist at a lower level during the seven additional years of follow-up compared to individuals without diabetes. Individuals with T2DM without vascular disease have higher overall healthcare costs in their first year after diagnosis but lower costs each subsequent year of follow-up compared to individuals without T2DM. These results add further real-world evidence to the growing recognition that earlier and more effective treatment intervention for T2DM could result in longer term economic benefits.
Introduction
Diabetes is a complex, chronic metabolic disorder that requires ongoing and frequently costly healthcare management.1,2 An estimated 34.2 million US individuals or 10.5% of the US population have been diagnosed with diabetes, and an additional 2.8% of US individuals have undiagnosed diabetes.3 Every year, 1.5 million individuals are newly diagnosed with diabetes in the United States (US), the vast majority (90–95%) with type 2 diabetes mellitus (T2DM).4,5 The multifaceted mix of morbidity, mortality and costs attributable to T2DM imposes a substantial burden on patients, their families and caregivers, healthcare providers and payers.6–8 The American Diabetes Association (ADA) estimated direct healthcare costs of diabetes at $237 billion in 2017, with inpatient care for diabetes complications such as macrovascular and microvascular disease, accounting for 43% of the total cost.5,9 Expenditures on medications to treat vascular diseases associated with diabetes consumed an estimated 18% of the total cost.10,11
The development and progression of microvascular and macrovascular complications exacerbate the clinical outcomes linked to diabetes,12–15 and invariably increased costs.11,16-20 Compared to non-DM individuals, those with T2DM are at increased risk of developing vascular diseases leading to end-stage renal failure, blindness,21,22 cardiovascular disease, amputation or death.23,24 Evidence from a systematic literature review of studies conducted across 13 countries including the United States describing the costs associated with treating cardiovascular disease in individuals with T2DM found that the annual healthcare costs per patient for T2DM and cardiovascular disease, coronary artery disease, heart failure, and stroke were, respectively, 112%, 107%, 59%, and 322% higher compared with those for T2DM patients without cardiovascular disease. This increase was driven by greater use of healthcare services, as well as increased polypharmacy, generally adding to the complexity of managing the patients’ care.25 As a result, the major goal of glycemic control for T2DM is to prevent or delay acute and long-term microvascular and macrovascular complications and comorbidities.4,5,26 In addition to improving survival, quality of life and other patient outcomes and reduce morbidity, such an approach may also prevent, or at least delay, some portion of the direct and indirect incremental cost burden associated with vascular disease in T2DM individuals. In addition, the most recent version of the ADA treatment recommendations has placed an emphasis on ascertaining the presence of atherosclerotic cardiovascular disease (ASCVD) or chronic kidney disease (CKD) to assist in guiding medication therapy selection.
The ADA has recommended multi-intervention strategies consisting of regular screening, pharmacotherapy, lifestyle and diet modification to mitigate and prevent vascular diseases among individuals with T2DM.1,2,27,28 When planning to deploy these recommendations cost-effectively in large populations, however healthcare providers and payers may benefit from a thorough understanding of the longitudinal time trend associated with the economic burden of T2DM and associated vascular disease.1,8,18,27–31 This is especially true for the large number of newly diagnosed T2DM patients where early and intensive intervention in the course of the disease may provide maximum clinical benefit.4,5
Several studies have shown that vascular diseases, specifically ASCVD and CKD, are major drivers of healthcare costs among individuals with T2DM.10,11,16,31,34 Only a few studies, however, have examined the long-term progression of disease and impact of microvascular and macrovascular diseases on healthcare costs among individuals with incident T2DM.25,35–38 Estimates of long-term healthcare costs and disease progression are often based on economic models which rely on secondary inputs extrapolated or derived from clinical and observational studies.8,18,25,30 These studies seldom reflect the year-to-year variation in cost over the course of natural progression of vascular disease in T2DM patients. To address this evidence gap, the objective of this real-world study was to estimate all-cause and diabetes/vascular disease-related healthcare costs among individuals with incident T2DM with and without vascular disease compared to matched non-DM controls for up to 10 years of follow-up.
Materials and Methods
Study Design and Data Source
This retrospective study used a matched cohort design to estimate longitudinal all-cause costs and diabetes/vascular disease-related healthcare costs for individuals with incident T2DM and matched non-DM controls. We queried integrated medical and pharmacy administrative claims data from the HealthCore Integrated Research Database (HIRD®) for a 10-year study period, spanning 01/01/2006 to 12/31/2015. The HIRD contains enrollment information and medical and pharmacy administrative claims data for approximately 57.8 million enrollees in a large US private health plan. To ascertain the vital status of individuals during the study period, data from the HIRD were linked with the Death Master File of the Social Security Administration. The researchers accessed and analyzed a Limited Data Set, described in the Health Insurance Portability and Accountability Act (HIPAA) Privacy Rule, as the objectives of this observational study did not require unique patient identifiers. All study materials were handled in strict compliance with applicable federal rules, and the privacy and security of all personal health information were safeguarded throughout the study.
Study Population
Identification of Incident T2DM Cases
A hierarchical claims-based algorithm was used to identify individuals with incident T2DM, as shown in Figure 1. From among the individuals with continuous health plan enrolment from 01/01/2006 to the earlier of date of death or end of study (12/31/2015), we identified patients with either type 1 or type 2 diabetes based on the presence of ≥2 medical claims for diabetes (ICD-9-CM codes: 250.xx), of which at least two claims were each on distinct service dates or ≥1 pharmacy fill for diabetes medication (GPI codes: 27.xx excluding 2730xx) between 01/01/2007 and 12/31/2007 (the intake period). From this pool of individuals with diabetes, those with type 1 diabetes mellitus (T1DM), identified by the presence of ≥2 medical claims on distinct service dates for T1DM (ICD-9-CM codes: 250.x1 or 250.x3); and the presence of either ≥1 pharmacy claim for insulin (GPI codes: 2710x) or ≥1 medical claim for insulin pumps (CPT codes: E0784, J1817, ICD-9 code: V53.91), and absence of pharmacy fill for non-insulin diabetes medications except metformin (GPI: 27xx, except 2710x and 2725x) during the intake period, were excluded. The study population was then restricted to individuals with T2DM, identified by the presence of ≥2 medical claims on distinct service dates for T2DM (ICD-9-CM codes: 250.x0 or 250.x2); or a combination of ≥1 pharmacy fill for diabetes medications (GPI codes: 27xx) and ≥1 medical claim for T2DM during the intake period. The earliest date of service for a pharmacy claim for a diabetes medication or a medical claim with a T2DM diagnosis code during the intake period was defined as the index date. To capture only individuals with incident T2DM, those individuals with any claims for either diabetes or diabetes medications between 01/01/2006 and the index date were excluded.
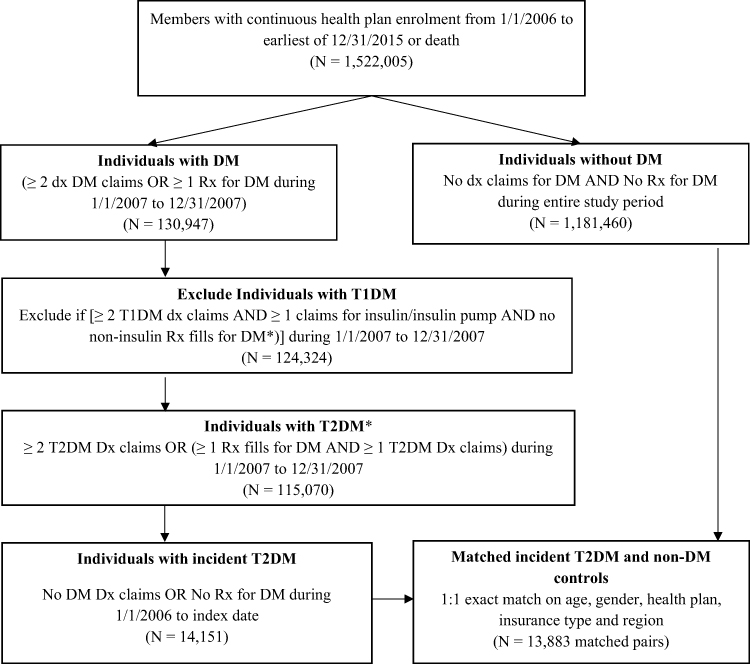 |
Figure 1 Study cohort identification criteria.Note: *Metformin was allowed.Abbreviations: Dx, diagnosis; Rx, prescription; DM, diabetes mellitus; T1DM, type 1 diabetes mellitus; T2DM, type 2 diabetes mellitus. |
Identification of Non-DM Controls
Controls were identified among patients with continuous health plan enrollment from 01/01/2006 to the earlier of date of death or 12/31/2015 as individuals without any medical claims with diabetes (ICD-9-CM diagnosis code 250.xx or ICD-10 codes: E10%, E11%, E13%) and without any pharmacy fill for diabetes medication (GPI codes: 27xx) between 01/01/2006 and 12/31/2015 or date of death, whichever was earlier.
Matching of Cases and Controls
Incident T2DM individuals were 1:1 matched to non-DM controls using a 1:1 exact attribute matching method with no replacement on age, gender, health plan type, geographic residence region, and type of health insurance (Commercial or Medicare Advantage). Each matched non-DM control was assigned a pseudo-index date equal to the index date of the incident T2DM match.
Identification of Vascular Disease
The presence of vascular disease was confirmed via the presence of ≥1 medical claim for a vascular disease between 01/01/2006 to the earlier of 12/31/2015 or death. Both microvascular diseases such as neuropathy, nephropathy, and retinopathy, and macrovascular diseases such as peripheral vascular disease, cardiovascular disease, and cerebrovascular disease were included to ascertain the presence of vascular disease. The earliest claim date for a vascular disease was defined as the incident date for vascular disease. The diagnosis codes used to identify the particular vascular diseases and other comorbidities of interest are shown in Supplemental Table 1.
Longitudinal Follow-Up
For the longitudinal analysis of all-cause and diabetes/vascular disease costs, a rolling cohort was created for each post-index follow-up year. Individuals with incident T2DM and their matched non-DM controls entered the cohort 1 year prior to the index date (baseline year) and remained in it for each subsequent year after the index date (post-index year) as long as both the case and matched control were alive at the beginning of that post-index year. If either the individual with incident T2DM or the matched control died, both were excluded from the cost analyses for all the subsequent post-index years. For example, if an individual was first diagnosed with incident T2DM on 07/01/2007 and died on 04/11/2011 and that individual’s matched non-DM control was alive until 12/31/2015, then that patient and their matched control were included in the rolling cohorts for each year from baseline (pre-index year) to post-index year 4 (year of death), but not in subsequent post-index years.
Study Outcomes
Annual all-cause and diabetes/vascular disease-related costs were calculated for each matched pair for the baseline year, as well as each of up to 8 post-index years where both the individual with incident T2DM and their matched non-DM control were alive at the beginning of the post-index year. All-cause healthcare cost consisted of the sum of total healthcare cost, i.e. the sum of plan paid and patient paid amounts for all medical services and medications across all settings. We identified healthcare costs related to diabetes and vascular disease using two methods: the attributable costs method and incremental costs method. Attributable diabetes/vascular disease-related healthcare costs were comprised of the sum of patient-paid and plan-paid costs of medical claims with primary or secondary diagnosis codes for diabetes or vascular disease and pharmacy claims for diabetes medications. Incremental costs of diabetes/vascular disease consisted of the difference in the all-cause healthcare costs between individuals with incident T2DM and matched controls. Healthcare costs were also reported by setting, categorized as inpatient hospitalization, emergency room visits, outpatient services and pharmacy services. All costs were adjusted to 2015 US dollars using the medical care component of the Consumer Price Index provided by the Bureau of Labor Statistics.39
Statistical Analysis
Bivariate descriptive statistics were reported for both continuous and categorical data for matched incident T2DM patients and non-DM controls, the subset of incident T2DM patients with vascular disease and the subset of incident T2DM patients with no vascular disease. Means (standard deviation, median) and relative frequencies (proportions) were reported for continuous and categorical baseline demographics and clinical characteristics, respectively.
Separate all-cause annual cost comparisons were conducted in each year of follow-up (baseline, post-index year 1 to 8) between incident T2DM patients and their matched non-DM controls. Identical comparisons were also conducted between incident T2DM patients with vascular disease and their matched non-DM controls as well as between incident T2DM patients with no vascular disease and their matched non-DM controls. To ensure that both members of each matched pair were able to generate healthcare costs during the measurement year, only matched pairs alive at the beginning of the measurement year were included in the cost comparison. To adjust for the unequal post-index period, we reported weighted mean annual costs, computed by weighting the annualized mean estimates by the length of follow-up time during a particular post-index measurement year. Due to the right-skewed nature of the cost data, generalized linear models with gamma distribution and log link function weighted by the length of the post-index follow-up period were used to estimate incremental total annual healthcare cost among individuals with incident T2DM over their matched non-DM controls.
Results
Characteristics of Study Cohort
We identified 115,070 individuals with T2DM from approximately 1.5 million with continuous eligibility from 01/01/2006 to the earlier of 12/31/2015 or death. Of these individuals, 14,151 met the criteria for incident T2DM. A total of 1.18 million individuals met the criteria for the pool of non-DM controls. A total of 13,883 incident T2DM cases and non-DM controls were successfully matched. (Figure 1). The number of individuals with one or more vascular disease diagnosis at some point during the study period among the incident T2DM cases was 11,792 (84.9%) and 9251 (66.6%) among matched non-DM controls. The proportion of individuals who died during the study period was 27.5% (3819/13,883) of individuals with incident T2DM, and 19.6% (2725/13,883) of the matched non-DM controls.
The mean age of individuals on the index date with incident T2DM and their matched non-DM controls was 63.6 years (standard deviation [SD]: 15.36). Among incident T2DM patients, those with documented vascular disease during the study period were aged 65.9 years (SD: 14.51) and those who never developed vascular disease during the study period were 50.6 years (SD: 13.45) on the index date. Among those with incident T2DM, 5896 individuals (42.5%) had a vascular disease claim in the year prior to the index date; cardiovascular disease (31.9%) was the most common pre-existing vascular disease followed by cerebrovascular disease (10.5%), nephropathy (8.9%), neuropathy (7.6%), peripheral vascular disease (6.9%) and retinopathy (3.3%), as shown in Table 1. Hypertension and dyslipidemia were the most frequently observed baseline comorbidities among the incident T2DM cases (63.5% and 52.6%), incident T2DM cases with vascular disease (67.0% and 54.4%) and incident T2DM cases with no vascular disease (43.5% and 42.3%), respectively. Incident T2DM cases with vascular disease had a higher prevalence of all baseline comorbidities compared to overall incident T2DM cases. With the exception of hypertension and dyslipidemia, incident T2DM cases with no vascular disease had a lower prevalence of baseline comorbidities compared to overall non-diabetic controls.
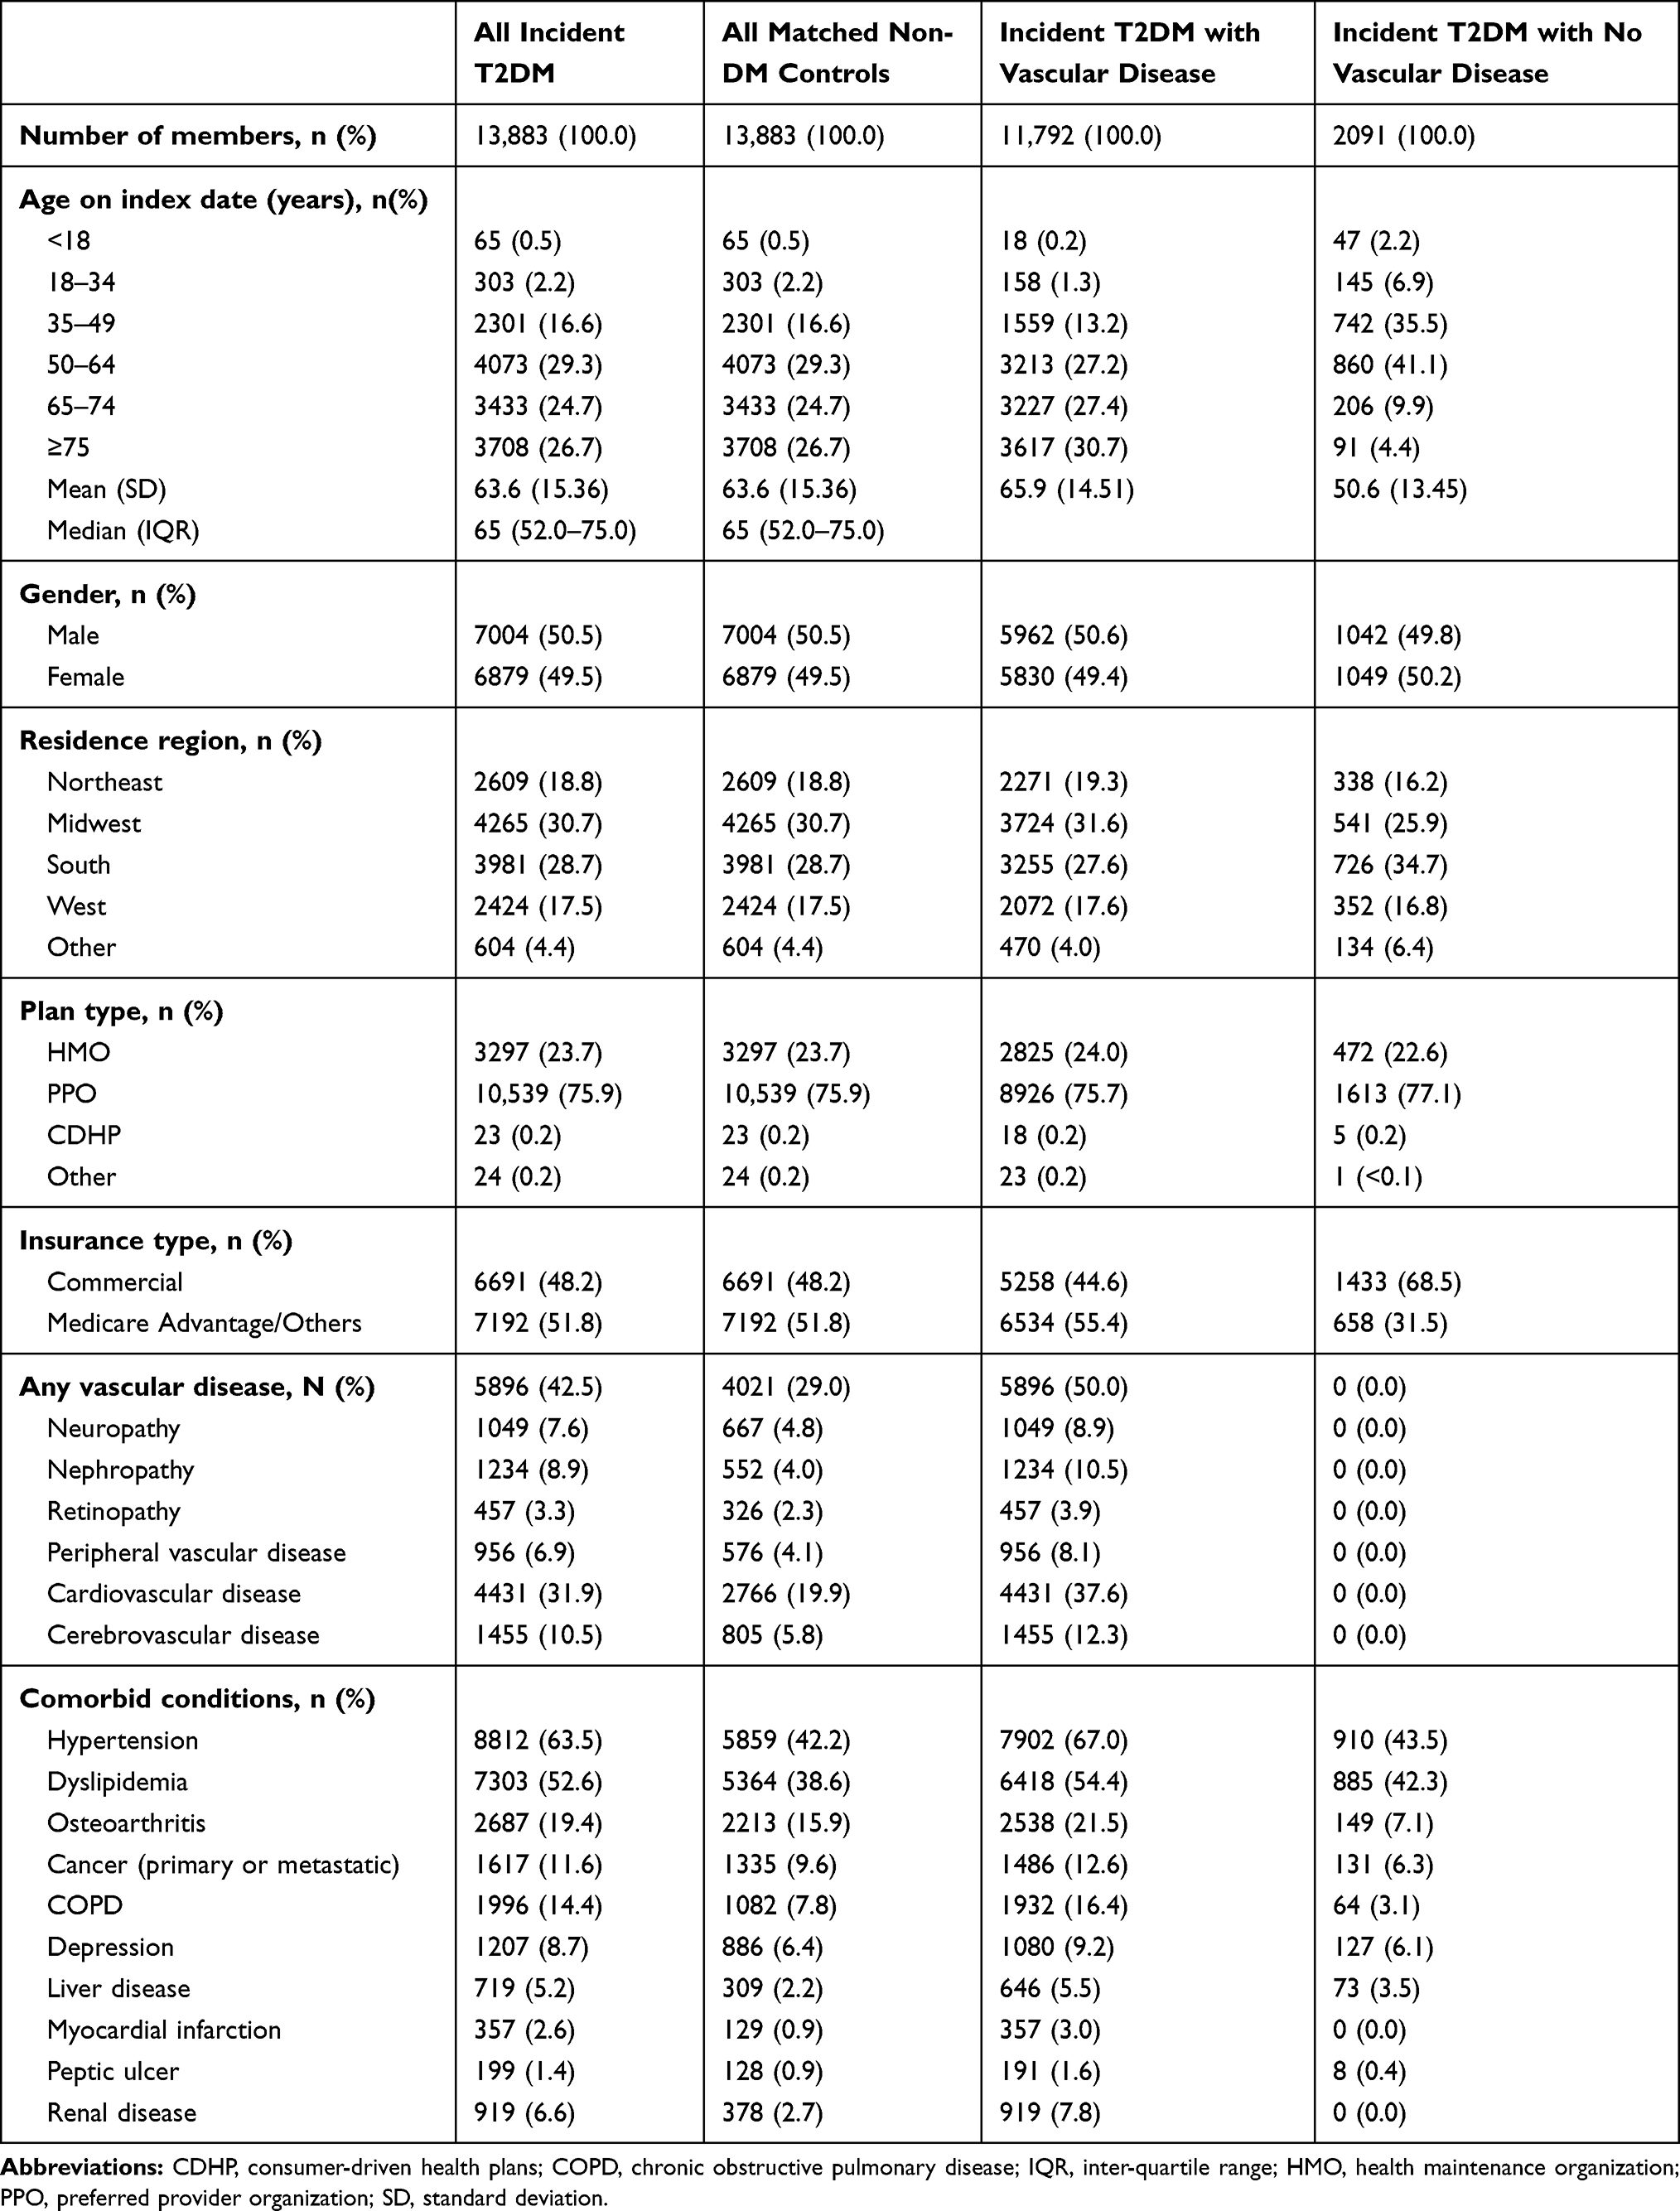 |
Table 1 Demographic and Clinical Characteristics |
Attributable Cost Trends
A total of 8393 (60.5%) of individuals with incident T2DM had at least one documented vascular disease by the end of their first-year post-index; and 1391 (10.0%) of them died during the first post-index year. For the post-index year 1, the mean weighted annual total all-cause healthcare cost for individuals with incident T2DM was nearly two and a half times greater than their matched non-DM controls ($21,745 vs. $8,524, p < 0.001), as shown in Table 2.
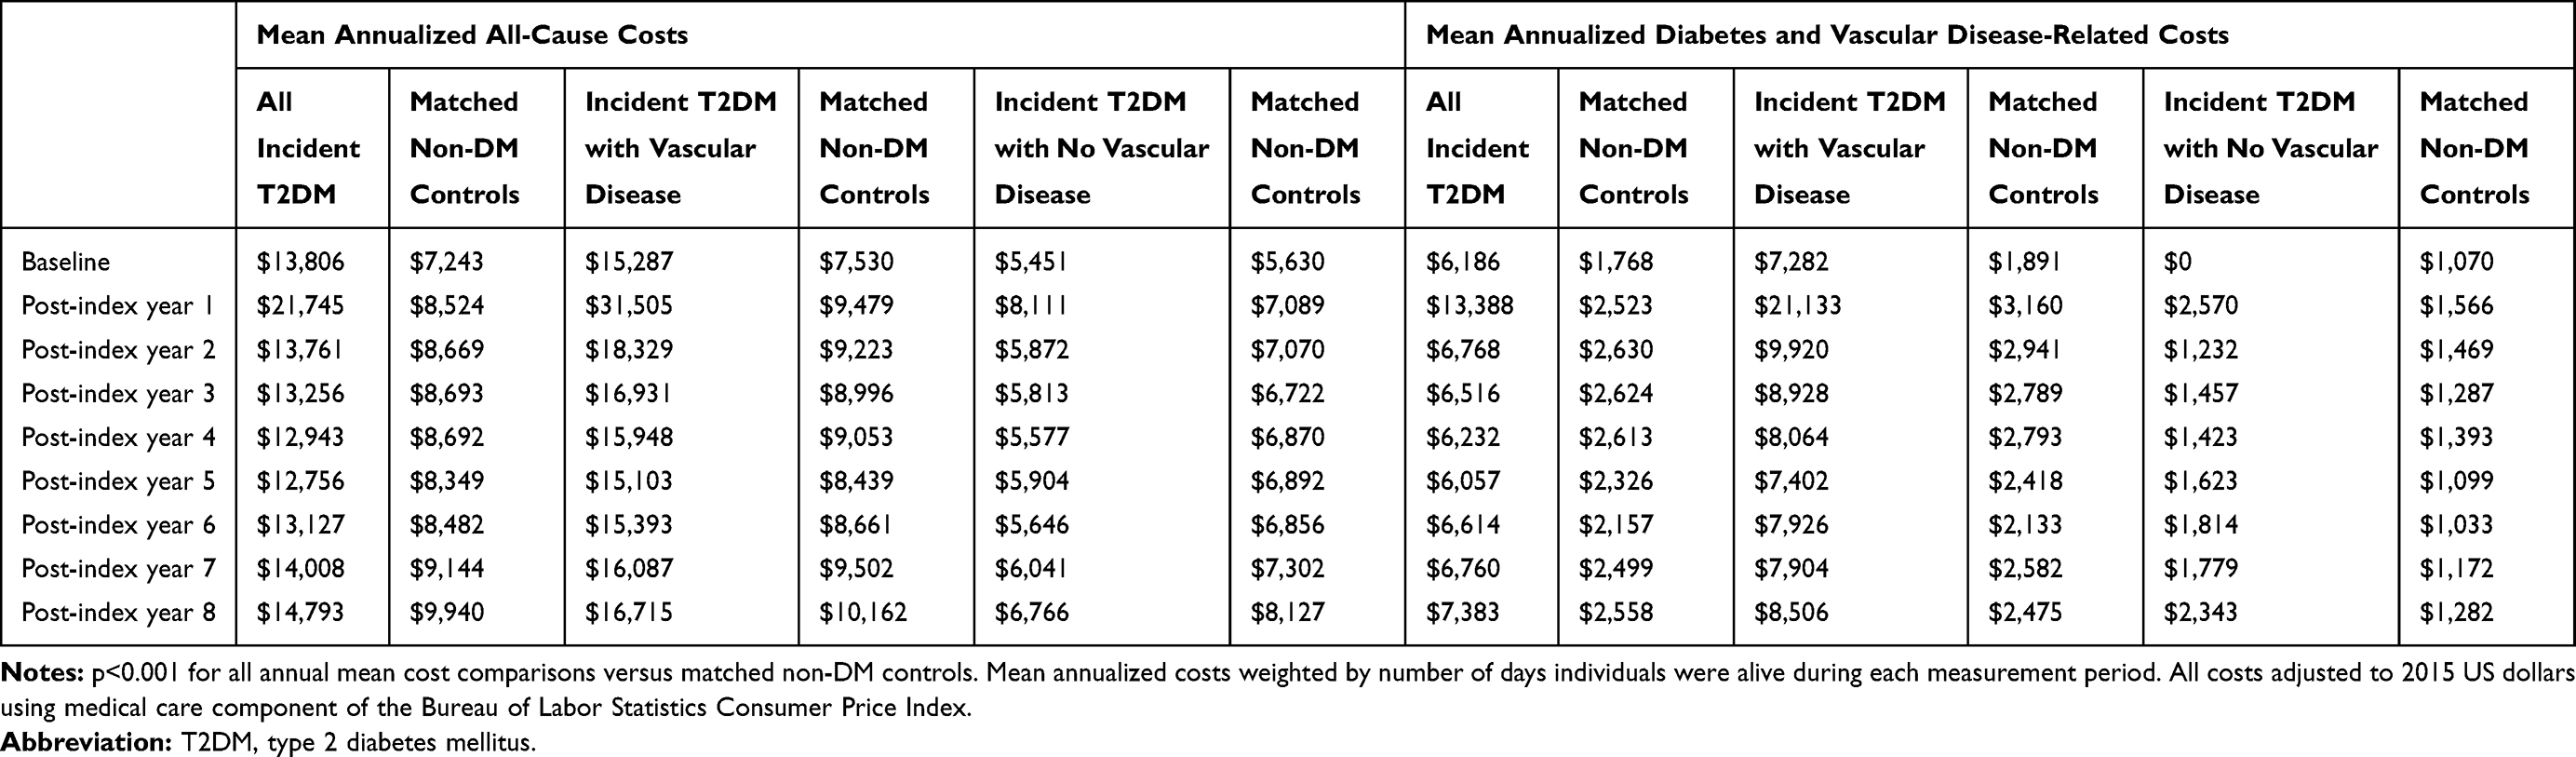 |
Table 2 Mean Annualized Total All-Cause and Diabetes/Vascular Disease-Related Healthcare Costs |
In post-index year 2, the mean weighted annual all-cause total healthcare cost was over one and a half times higher for individuals with incident T2DM versus matched non-DM controls ($13,761 vs. $8,669, p < 0.001), indicating a decline in the difference in mean annualized all-cause healthcare costs between individuals with incident T2DM and their matched controls, relative to the first year. For each of the remaining years, the weighted mean annual total healthcare cost for individuals with incident T2DM remained approximately 33–35% higher than that in matched non-DM controls (p < 0.001 for all post-index years 3–8). A parallel time trend was observed in the proportion of mean weighted annual healthcare cost attributable to diabetes and vascular disease. The difference in mean weighted annual diabetes and vascular disease cost in post-index year 1 between incident T2DM individuals versus matched non-DM controls ($13,388 vs. $2,523) declined in post-index year 2 ($6,768 vs. $2,630) and then remained approximately 60% higher among individuals with incident T2DM (p < 0.001) for post-index years 3–8, Table 2).
For individuals with incident T2DM but no vascular disease, the weighted annual average all-cause total healthcare costs were higher in post-index year 1 ($8,111 vs. $7,089), but was lower compared to controls in the subsequent post-index years (all p < 0.001), as shown in Table 2.
Costs by Type of Healthcare Service
For those with incident T2DM, a large proportion of total all-cause healthcare cost in post-index year 1 comprised of inpatient services (55.8%), followed by outpatient (31.1%), pharmacy (11.5%) and emergency room services (1.6%). In comparison, their matched non-DM controls had the largest portion of all-cause healthcare costs in post-index year 1 from outpatient services (44.0%), followed by inpatient services (36.5%), pharmacy (17.2%) and emergency room (2.3%) service-related cost, as shown in Table 3.
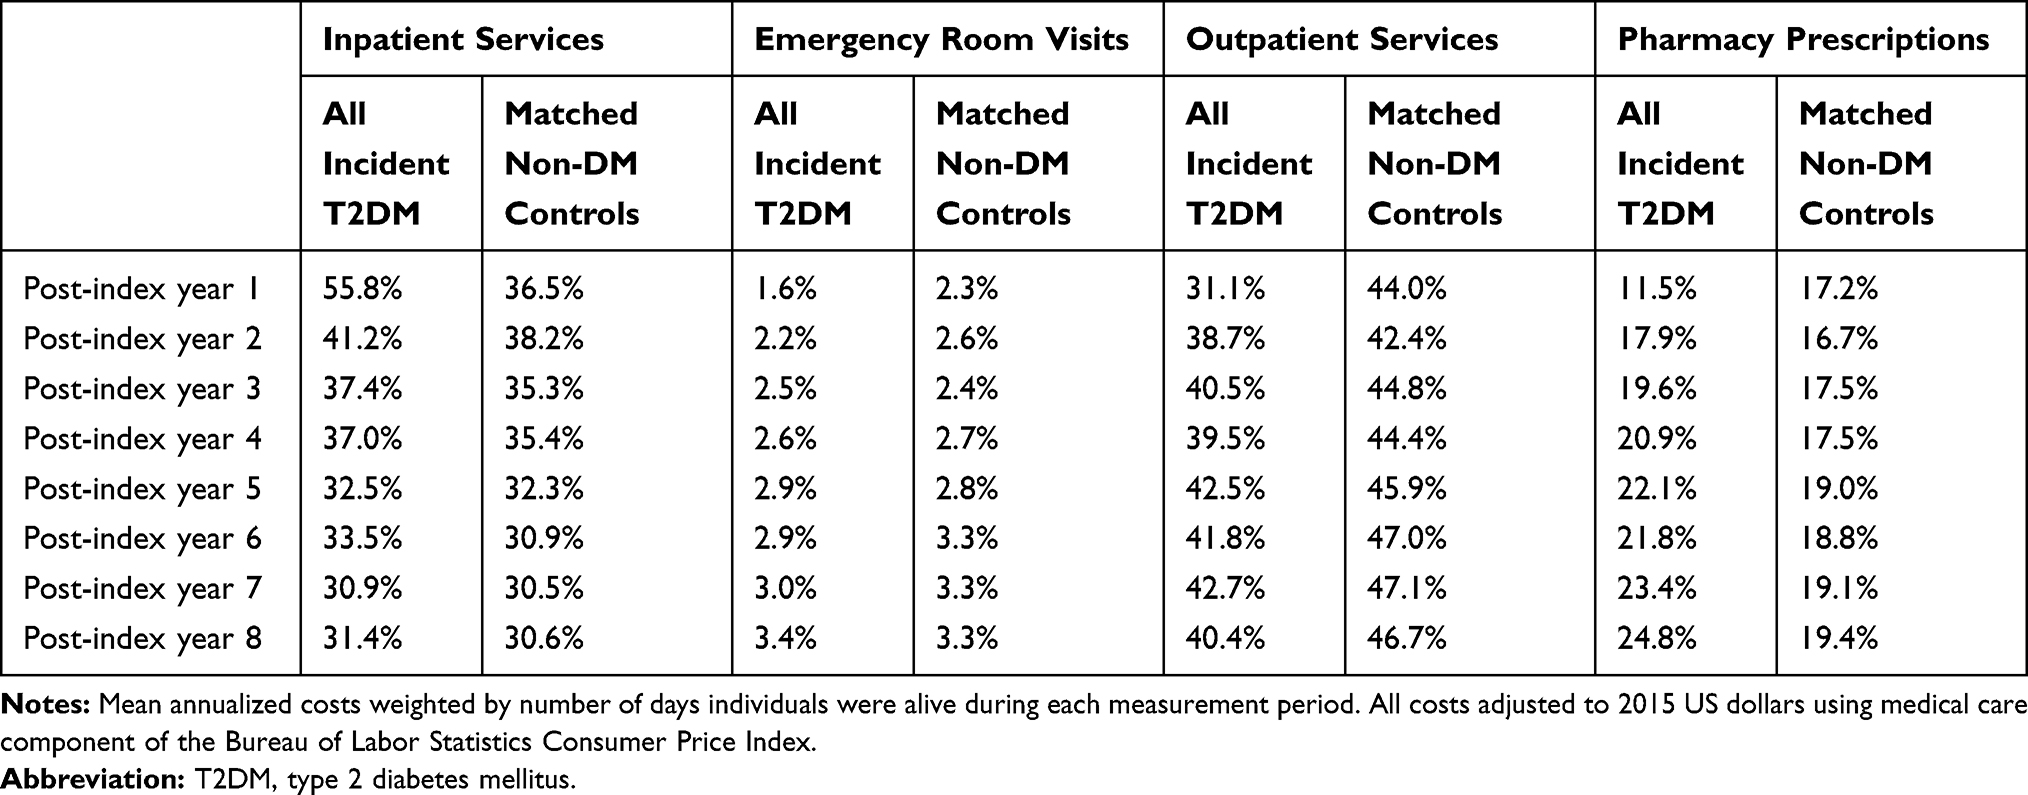 |
Table 3 Proportion of Annual All-Cause Healthcare Cost, by Type of Healthcare Service Setting |
Over the period from year 1 to 8, there was a shift in the healthcare service-related costs among individuals with incident T2DM. For example, the proportion of their inpatient costs dropped from 55.8% in post-index year 1 to 31.4% year 8. The proportion of their outpatient costs (31.1% vs. 40.4%) and pharmacy costs (11.5% vs. 24.8%) increased from the year 1 to year 8; whereas the proportion of emergency room visit costs grew marginally (1.6% vs. 3.4%) during the 8-year post-index period (Table 3).
Incremental Total Healthcare Costs
During post-index year 1, the average incremental annual all-cause healthcare cost was $13,221 as shown in Figure 2. The vast majority of the incremental annual all-cause cost of individuals with T2DM was driven by incremental diabetes and vascular disease-related costs ($10,865 in post-index year 1), which represented 82.2% of incremental total healthcare costs. While annual incremental all-cause healthcare costs ranged between a low of $4,251 to a high of $5,092 during post-index years 2 through 8, the proportion of mean annualized total incremental healthcare cost attributable to incremental diabetes and vascular disease-related costs increased from 81.3% to 99.4% during that same timeframe (Figure 2). Individuals with incident T2DM and vascular disease had even higher all-cause and diabetes and vascular disease-related mean annual incremental costs relative to their matched non-DM controls as shown in Supplementary Figure 1. During post-index year 1, the average incremental annual all-cause healthcare costs were $22,026 greater than for matched non-DM controls. The vast majority incremental all-cause annual cost of individuals with T2DM and vascular disease was also driven by incremental diabetes and vascular disease-related costs ($17,973 in post-index year 1), which represented 81.6% of incremental costs during that year. Incremental cost trends paralleled those seen in all individuals with T2DM between post-index years 2 through 8, with annual all-cause healthcare costs ranging between a low of $6,553 to a high of $9,106 between post-index years 2 through 8. This represented 76.6% to 92.0% of the incremental annual all-cause costs in individuals with T2DM and vascular disease over matched non-DM controls during that timeframe (Supplementary Figure 1).
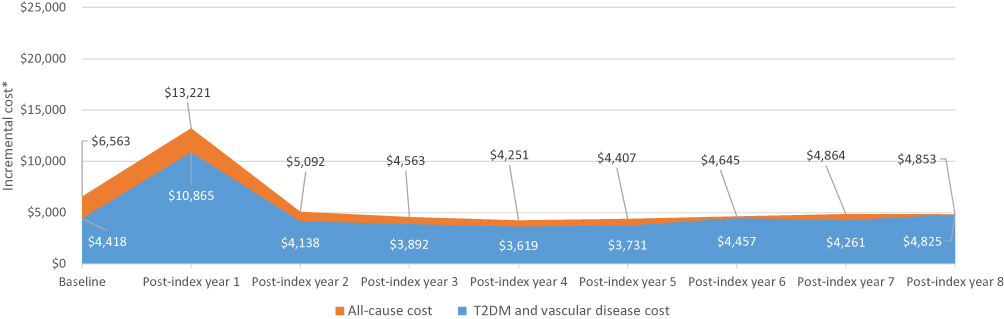 |
Figure 2 Annual mean incremental healthcare costs among all incident T2DM individuals and matched non-DM controls.Notes: *Incremental costs defined as difference in mean annual cost between all incident T2DM individuals and matched non-DM controls. Mean annualized costs weighted by number of days individuals were alive during each measurement period. All costs adjusted to 2015 US dollars using medical care component of the Bureau of Labor Statistics Consumer Price Index.Abbreviation: T2DM, type 2 diabetes mellitus. |
Discussion
This study examined direct real-world healthcare costs for individuals with incident T2DM and for non-DM-matched controls during long-term follow-up. This contemporary study examined matched cohorts in an era where T2DM management is guided by the most recent scientific, clinical and economic insights,6–8 and the availability of notable treatment improvements including newer, more innovative drug classes40–42 and delivery devices.43,44
The results of our study reflect an L-shaped cost curve pattern for individuals with T2DM having up to 8 years of post-index following the incidence of T2DM. A sharp increase in healthcare costs relative to the baseline was observed in post-index year 1, which was followed by lower, nearly flat annual average cost trend during post-index years 2–8. Among individuals with T2DM, all-cause healthcare costs were driven largely by T2DM and vascular disease. To the best of our knowledge, the longitudinal, real-world costs associated with a T2DM cohort with a broad range of microvascular and macrovascular disease versus matched non-DM controls have not been previously studied to assess the economic impact of microvascular and macrovascular diseases. Similar findings have been reported in other studies of US commercially insured patients with diabetes. A study comparing overall all-cause annual medical expenses among 19,863 patients with T2DM to those among an identical number of matched non-DM patients reported that per capita annual total excess medical expenditure for the diabetes cohort over non-DM controls sharply increased from $4,492 in the year prior to index diabetes diagnosis to $8,109 in the year immediately following diabetes diagnosis. This was followed by a decline in costs in the second year following diabetes diagnosis to $4,261 and steady increase to $6,162 by the tenth year after diabetes diagnosis, mirroring the L-shaped cost curve over time for T2DM patients that we observed. The authors found that the spike in expenditure in the year immediately following diabetes diagnosis was associated by greater use of inpatient and outpatient services by diabetes patients during that year.45 Another study, Brown et al, which looked at costs in cohorts that approximated ours over an 8-year period from 1988 to 1995, also found substantially higher incremental costs in the T2DM cases versus the non-T2DM controls. Similar to our results, they found much higher costs in year 1. They also reported higher costs at years 7 and 8, a deviation from our results, which they attributed to hospitalizations for reasons other than diabetes and its complications.35 Related studies, at the population level, reported similar temporal cost patterns, and have largely concluded that interventions to prevent or delay the manifestation of diabetes complications could translate into substantial savings in healthcare costs.8,18,25,30
The cost impact of vascular diseases was highest in the year after T2DM diagnosis, accompanied by intense utilization of inpatient services. As a result, the annual average all-cause healthcare expenditures observed in post-index year 1 among incident T2DM patients with vascular disease were two and a half times as much for non-DM controls. When considered together with the finding that 3 in 5 incident T2DM patients had vascular disease within the first year after diagnosis, our results underscored that the economic burden of vascular disease in T2DM was front-loaded.46,47 This may potentially signal that clinicians more actively screen for these vascular conditions after a T2DM diagnosis and that delayed diagnosis of T2DM leads to undetected development of these conditions. These findings may support direct cost-offset of early detection of T2DM which could allow for effective mitigation and management of vascular diseases in T2DM patients.
Overall, costs in subsequent follow-up years were considerably lower than in post-index year 1, and did not vary noticeably year-to-year. Nonetheless, costs remained significantly higher in T2DM patients than for matched non-diabetic controls during each post-index year of follow-up. Based on the healthcare resource use trends in follow-up years 2–8, this period may represent “maintenance” or “chronic” phases of the disease within the overall population. In such periods, healthcare costs are typically stable and utilization skews towards the outpatient setting and on prescription medications, rather than inpatient care. Of note, all the cost trends described above were enhanced in magnitude for the large subset of the T2DM patients with a vascular disease.
In contrast to T2DM patients with vascular disease, T2DM patients without claims for overt vascular disease over the entire follow-up period were on average 13 years younger than the overall T2DM patient population and had a baseline comorbidity profile and healthcare cost profile similar to non-diabetic controls. Even in post-index year 1, their average all-cause healthcare cost exceeded that of matched controls by less than 15% and dropped lower than matched controls during post-index years 2–8. One explanation is that these patients represented the youngest and healthiest subset of incident T2DM patients, with a shorter duration of T2DM and lower rates of important comorbidities such as hypertension and dyslipidemia due to their younger age. This appears to support the contention that earlier diagnosis of T2DM with optimized management to prevent the development of vascular complications could have a positive economic impact.
Findings from this study could have implications for bending the cost curve for individuals with T2DM. Over the 8-year post-index follow-up period, the cumulative incremental all-cause healthcare costs for individuals with incident T2DM over matched non-diabetic controls were $45,986. The National Diabetes Statistics Report estimated that 1.5 million new cases of diabetes were diagnosed in 2018,3 indicating a potential cost savings opportunity of just under $69 billion ($45,986 per individual times 1.5 million new T2DM cases) over an 8-year period for newly diagnosed individuals if the costs from diabetes and related vascular disease found in our study could be entirely avoided. While it is certainly not possible to realize all of these savings, it does show the potential magnitude of the opportunity if only a fraction of these savings could be realized.
Limitations
These results must be viewed against a few limitations. Absence of diabetes for controls was established based on post-index information, therefore, matched controls in this study may have been healthier than the general population controls with a non-zero risk of developing T2DM after the index date. This meant that at-risk individuals who developed diabetes during follow-up were not included in the control cohort. An earlier study with a similar design, however, showed minimal differences between the assigned controls from the general population who could potentially develop T2DM and a control group that never developed T2DM.48 Both disease conditions and outcomes in this study were based on claims data, in which errors of miscoding, omission and commission in the presence of diagnosis, medication and procedure codes may be present. Reliance on claims also meant we had no access to information on educational activity participation, medication management initiatives to inhibit vascular diseases and most clinical data. The presence of vascular disease was ascertained by the presence of a single diagnosis claim, and could have been erroneous; however, in a large sample, any error would likely be similar for both cohorts.49 Costs in the study were measured from a healthcare sector perspective, and defined as the actual health plan paid and the patient paid amount for products and services documented in medical and pharmacy claims. Costs were not based on assumptions, extrapolations or other secondary and/or derived long-term all-cause and condition-specific cost estimates. The study population was either insured through a commercial managed care or in Medicare Advantage plan, and results may not necessarily apply to populations with other types of insurance or no insurance.
Conclusions
Microvascular and macrovascular diseases play an important role in driving long-term costs in T2DM patients. The cost impact of T2DM and associated vascular diseases was highest in the year after T2DM diagnosis and persisted for at least seven additional years, while the cost of T2DM patients without comorbid vascular diseases was lower than that for matched non-DM patients. These data highlight the potential for costs to be offset by early and more effective detection and management of T2DM. Additional research could be useful for the evaluation of the long-term clinical and economic impact of such early interventions.
Ethics Approval and Consent to Participate
This study was exempt from Institutional Review Board review— the objectives of this observational study did not require unique patient identifiers. Researchers accessed and analyzed a Limited Data Set, described in the Health Insurance Portability and Accountability Act (HIPAA) Privacy Rule.
Acknowledgments
Bernard B. Tulsi, MSc, Senior Medical Writer at HealthCore provided writing and editorial support for this project. Partial findings from this study were presented at AMCP Nexus 2017, Dallas, TX. October 16-19, 2017.
Author Contributions
All authors contributed to data analysis, drafting and revising the article, gave final approval of the version to be published, and agree to be accountable for all aspects of the work.
Disclosure
Neeraj N. Iyer, Todd Hobbs are employees of Novo Nordisk. Sheldon Kong and Jonathan Bouchard were employees of Novo Nordisk at the time of this research. David M. Kern and Amit Raval were employees of HealthCore at the time of this research and are currently employees of Janssen Pharmaceuticals, Inc. and Merck and Company, Inc., respectively. Jay Visaria and Vincent Willey are employees of HealthCore. The authors report no other competing interests for this work.
References
1. American Diabetes Association. Standards of Medical Care in Diabetes-2015: Introduction. Diabetes Care. 2015;38(Suppl):S1–S2.
2. Gionfriddo MR, McCoy RG, Lipska KJ. The 2013 American Association of Clinical Endocrinologists’ diabetes mellitus management recommendations: improvements needed. JAMA Intern Med. 2014;174(2):179–180. doi:10.1001/jamainternmed.2013.12971
3. Centers for Disease Control and Prevention. National diabetes statistics report, 2020. Available from: https://www.cdc.gov/diabetes/data/statistics/statistics-report.html.
4. American Diabetes Association. Economic costs of diabetes in the U.S. in 2012. Diabetes Care. 2013;36(4):1033–1046. doi:10.2337/dc12-2625
5. American Diabetes Association. Economic costs of diabetes in the U.S. in 2017. Diabetes Care. 2018;41(5):917–928. doi:10.2337/dci18-0007
6. Dall TM, Zhang Y, Chen YJ, Quick WW, Yang WG, Fogli J. The economic burden of diabetes. Health Aff. 2013;6(2):297–303. doi:10.1377/hlthaff.2009.0155
7. Rowley WR, Bezold C, Arikan Y, Byrne E, Krohe S. Diabetes 2030: insights from yesterday, today, and future trends. Popul Health Manag. 2017;20:6–12. doi:10.1089/pop.2015.0181
8. Zhuo X, Zhang P, Kahn HS, Bardenheier BH, Li R, Gregg EW. Change in medical spending attributable to diabetes: national data from 1987 to 2011. Diabetes Care. 2016;39(4):1796–1803. doi:10.2337/dc14-1687
9. Montvida O, Shaw J, Atherton JJ, Stringer F, Paul SK. Long-term trends in antidiabetes drug usage in the U.S.: real-world evidence in patients newly diagnosed with type 2 diabetes. Diabetes Care. 2018;41(1):69–78. doi:10.2337/dc17-1414
10. Bottomley JM. T2ARDIS steering committee. Managing care of type 2 diabetes. Learnings from T2ARDIS. Br J Diabetes Vasc Dis. 2001;1:68–72. doi:10.1177/14746514010010011201
11. Liebl A, Khunti K, Orozco-Beltran D, Yale JF. Health economic evaluation of type 2 diabetes mellitus: a clinical practice focused review. Clin Med Insights Endocrinol Diabetes. 2015;8:13–19.
12. Beckman JA, Creager MA. Vascular complications of diabetes. Circ Res. 2016;118(11):1771–1785. doi:10.1161/CIRCRESAHA.115.306884
13. Brownrigg JR, Hughes CO, Burleigh D, et al. Microvascular disease and risk of cardiovascular events among individuals with type 2 diabetes: a population-level cohort study. Lancet Diabetes Endocrinol. 2016;4:588–597. doi:10.1016/S2213-8587(16)30057-2
14. Chen HL, Hsu WW, Hsiao FY. Changes in prevalence of diabetic complications and associated healthcare costs during a 10-year follow-up period among a nationwide diabetic cohort. J Diabetes Complications. 2015;29:523–528. doi:10.1016/j.jdiacomp.2015.02.002
15. Forbes JM, Cooper ME. Mechanisms of diabetic complications. Physiol Rev. 2013;93(1):137–188. doi:10.1152/physrev.00045.2011
16. Banerji MA, Dunn JD. Impact of glycemic control on healthcare resource utilization and costs of type 2 diabetes: current and future pharmacologic approaches to improving outcomes. Am Health Drug Benefits. 2013;6:382–392.
17. Li R, Bilik D, Brown MB, et al. Medical costs associated with type 2 diabetes complications and comorbidities. Am J Manag Care. 2013;19:421–430.
18. Zhuo X, Zhang P, Hoerger TJ. Lifetime direct medical costs of treating type 2 diabetes and diabetic complications. Am J Prev Med. 2013;45(3):253–261. doi:10.1016/j.amepre.2013.04.017
19. Weng W, Tian Y, Kong SX, et al. Impact of atherosclerotic cardiovascular disease on healthcare resource utilization and costs in patients with type 2 diabetes mellitus in a real-world setting. Clin Diabetes Endocrinol. 2020;6(1):5. doi:10.1186/s40842-019-0090-y
20. Mehta S, Ghosh S, Sander S, Kuti E, Mountford WK. Differences in all-cause health care utilization and costs in a type 2 diabetes mellitus population with and without a history of cardiovascular disease. J Manag Care Spec Pharm. 2018;24(3):280–290. doi:10.18553/jmcp.2018.24.3.280
21. Fong DS, Aiello L, Gardner TW, et al. Retinopathy in diabetes. Diabetes Care. 2004;27(Suppl 1):S84–S87. doi:10.2337/diacare.27.2007.S84
22. Fong DS, Aiello LP, Ferris FL
23. Hippisley-Cox J, Coupland C. Diabetes treatments and risk of amputation, blindness, severe kidney failure, hyperglycaemia, and hypoglycaemia: open cohort study in primary care. BMJ. 2016;352:i1450. doi:10.1136/bmj.i1450
24. Mohammedi K, Woodward M, Hirakawa Y, et al. Microvascular and macrovascular disease and risk for major peripheral arterial disease in patients with type 2 diabetes. Diabetes Care. 2016;39:1796–1803. doi:10.2337/dc16-0588
25. Einarson TR, Acs A, Ludwig C, Panton UH. Economic burden of cardiovascular disease in type 2 diabetes: a systematic review. Value Health. 2018;21(7):881–890. doi:10.1016/j.jval.2017.12.019
26. Ratner RE. The imperative to prevent diabetes. Diabetes Care. 2012;35(12):2417–2418. doi:10.2337/dc12-1997
27. American Diabetes Association. Standards of medical care in diabetes-2016: summary of revisions. Diabetes Care. 2016;39(Suppl 1):S4–S5. doi:10.2337/dc16-S003
28. American Diabetes Association. Standards of medical care in diabetes-2018: introduction. Diabetes Care. 2018;41:S1–S2.
29. Rosella LC, Lebenbaum M, Fitzpatrick T, et al. Impact of diabetes on healthcare costs in a population-based cohort: a cost analysis. Diabet Med. 2016;33(3):395–403. doi:10.1111/dme.12858
30. Zhuo X, Zhang P, Barker L, Albright A, Thompson TJ, Gregg E. The lifetime cost of diabetes and its implications for diabetes prevention. Diabetes Care. 2014;37(9):2557–2564. doi:10.2337/dc13-2484
31. Roberts S, Barry E, Craig D, Airoldi M, Bevan G, Greenhalgh T. Preventing type 2 diabetes: systematic review of studies of cost-effectiveness of lifestyle programmes and metformin, with and without screening, for pre-diabetes. BMJ Open. 2017;7(11):e017184. doi:10.1136/bmjopen-2017-017184
32. Faxon DP, Creager MA, Smith SC
33. Long AN, Dagogo-Jack S. Comorbidities of diabetes and hypertension: mechanisms and approach to target organ protection. J Clin Hypertens. 2011;13:244–251. doi:10.1111/j.1751-7176.2011.00434.x
34. McDermott MM, Criqui MH, Ferrucci L, et al. Obesity, weight change, and functional decline in peripheral arterial disease. J Vasc Surg. 2006;43(6):1198–1204. doi:10.1016/j.jvs.2006.02.036
35. Brown JB, Nichols GA, Glauber HS, Bakst AW. Type 2 diabetes: incremental medical care costs during the first 8 years after diagnosis. Diabetes Care. 1999;22(7):1116–1124. doi:10.2337/diacare.22.7.1116
36. Gandra SR, Lawrence LW, Parasuraman BM, Darin RM, Sherman JJ, Wall JL. Total and component health care costs in a non-medicare HMO population of patients with and without type 2 diabetes and with and without macrovascular disease. J Manag Care Pharm. 2006;12:546–554. doi:10.18553/jmcp.2006.12.7.546
37. Trogdon JG, Hylands T. Nationally representative medical costs of diabetes by time since diagnosis. Diabetes Care. 2008;31(12):2307–2311. doi:10.2337/dc08-1375
38. Weng W, Liang Y, Kimball ES, et al. Longitudinal changes in medical services and related costs in a single cohort of patients newly diagnosed with type 2 diabetes, 2006 to 2012. Clin Ther. 2016;38(6):1314–1326. doi:10.1016/j.clinthera.2016.03.032
39. U.S. Bureau of Labor Statistics. Consumer Price Index (CPI) for medical care. 2020. Available from: http://data.bls.gov.
40. Heerspink HJ, Perkins BA, Fitchett DH, Husain M, Cherney DZ. Sodium glucose cotransporter 2 inhibitors in the treatment of diabetes mellitus: cardiovascular and kidney effects, potential mechanisms, and clinical applications. Circulation. 2016;134(10):752–772. doi:10.1161/CIRCULATIONAHA.116.021887
41. Marso SP, Daniels GH, Brown-Frandsen K, et al. Liraglutide and cardiovascular outcomes in type 2 diabetes. N Engl J Med. 2016;375:311–322. doi:10.1056/NEJMoa1603827
42. Zinman B, Wanner C, Lachin JM, et al. Empagliflozin, cardiovascular outcomes, and mortality in type 2 diabetes. N Engl J Med. 2015;373(22):2117–2128. doi:10.1056/NEJMoa1504720
43. Mader JK, Lilly LC, Aberer F, et al. Improved glycaemic control and treatment satisfaction with a simple wearable 3-day insulin delivery device among people with type 2 diabetes. Diabet Med. 2018;35(10):1448–1456. doi:10.1111/dme.13708
44. Sutton D, Higdon CD, Nikkel C, Hilsinger KA. Clinical benefits over time associated with use of V-go wearable insulin delivery device in adult patients with diabetes: a retrospective analysis. Adv Ther. 2015;35(5):631–643. doi:10.1007/s12325-018-0703-3
45. Shrestha SS, Zhang P, Hora IA, Gregg EW. Trajectory of excess medical expenditures 10 years before and after diabetes diagnosis among U.S. adults aged 25–64 years, 2001–2013. Diabetes Care. 2019;42(1):62–68. doi:10.2337/dc17-2683
46. Khan T, Yang J, Wozniak G. Trends in medical expenditures prior to diabetes diagnosis: the early burden of diabetes. Popul Health Manag. 2020. doi:10.1089/pop.2019.0143
47. Pelletier EM, Shim B, Ben-Joseph R, Caro JJ. Economic outcomes associated with microvascular complications of type 2 diabetes mellitus: results from a US claims data analysis. Pharmacoeconomics. 2009;27(6):479–490. doi:10.2165/00019053-200927060-00004
48. Papa G, Degano C, Iurato MP, Licciardello C, Maiorana R, Finocchiaro C. Macrovascular complication phenotypes in type 2 diabetic patients. Cardiovasc Diabetol. 2013;12(1):20. doi:10.1186/1475-2840-12-20
49. Funk MJ, Landi SN. Misclassification in administrative claims data: quantifying the impact on treatment effect estimates. Curr Epidemiol Rep. 2014;1(4):175–185. doi:10.1007/s40471-014-0027-z
 © 2020 The Author(s). This work is published and licensed by Dove Medical Press Limited. The full terms of this license are available at https://www.dovepress.com/terms.php and incorporate the Creative Commons Attribution - Non Commercial (unported, v3.0) License.
By accessing the work you hereby accept the Terms. Non-commercial uses of the work are permitted without any further permission from Dove Medical Press Limited, provided the work is properly attributed. For permission for commercial use of this work, please see paragraphs 4.2 and 5 of our Terms.
© 2020 The Author(s). This work is published and licensed by Dove Medical Press Limited. The full terms of this license are available at https://www.dovepress.com/terms.php and incorporate the Creative Commons Attribution - Non Commercial (unported, v3.0) License.
By accessing the work you hereby accept the Terms. Non-commercial uses of the work are permitted without any further permission from Dove Medical Press Limited, provided the work is properly attributed. For permission for commercial use of this work, please see paragraphs 4.2 and 5 of our Terms.