")
Back to Journals » ClinicoEconomics and Outcomes Research » Volume 11
Health-related outcomes, health care resource utilization, and costs of multiple sclerosis in Japan compared with US and five EU countries
Authors Yamabe K, DiBonaventura MD , Pashos CL
Received 11 July 2018
Accepted for publication 23 October 2018
Published 7 January 2019 Volume 2019:11 Pages 61—71
DOI https://doi.org/10.2147/CEOR.S179903
Checked for plagiarism Yes
Review by Single anonymous peer review
Peer reviewer comments 2
Editor who approved publication: Professor Giorgio Colombo
Kaoru Yamabe,1 Marco D DiBonaventura,2 Chris L Pashos3
1Healthcare Policy and Access, Takeda Pharmaceutical Company Limited, Chuouku, Tokyo 103-8668, Japan; 2Health Outcomes, Kantar Health, New York, NY 10010, USA; 3Global Outcomes and Epidemiology Research. Data Sciences Institute, Takeda Pharmaceutical International, Cambridge, MA 02139, USA
Purpose: Multiple sclerosis (MS) imposes a huge burden on patients. This study examined the relationship between MS and health-related and economic burden in Japan; secondarily, health status was compared across patients with MS in Japan, US, and five European Union (5EU) countries (France, Germany, Italy, Spain, and UK).
Methods: A retrospective cross-sectional study was conducted using self-reported data from 2009 to 2014 Japan National Health and Wellness Survey (n=145,759). Health status, work productivity loss, activity impairment, health care resource utilization, and annual costs associated with MS (n=85) were compared with controls without MS (n=145,674). Propensity score matching and multivariable linear regressions determined the effect of MS after controlling for confounders. Health status in Japan was also compared with that of 5EU (n=62) and US (n=67) patients with MS.
Results: Patients with MS in Japan reported significantly worse health status via mental component summary score (MCS; 40.1 vs 45.8) and physical component summary score (PCS; 41.4 vs 51.2) and health state utility scores (0.63 vs 0.74; all P<0.001). They also reported more absenteeism (12.0% vs 3.7%), presenteeism (33.8% vs 19.8%), overall work impairment (40.9% vs 21.6%), and activity impairment (43.6% vs 24.0%), with higher indirect costs (¥2,040,672/US $20,102 vs ¥1,076,306/US$10,603) than controls (all P<0.001). Patients with MS reported higher resource use, including provider visits (8.0 vs 4.7), emergency room visits (0.03 vs 0.1), and hospitalizations (2.7 vs 0.69) in the past 6 months, with higher direct costs (¥3,670,906/US$36,162 vs ¥986,099/US$9,714) than controls (all P<0.001). Finally, Japanese patients with MS reported lower MCSs and higher PCSs than their US and 5EU counterparts.
Conclusion: MS in Japan is associated with poor health status and high work productivity loss, resource use, and costs, underscoring the need for improved treatment, especially vis-à-vis mental health, when comparing Japanese patients with their 5EU and US counterparts.
Keywords: activity impairment, direct costs, health care resource utilization, health status, indirect costs, work productivity impairment
Introduction
Multiple sclerosis (MS) is a chronic, debilitating inflammatory autoimmune disorder of the central nervous system, which involves demyelination of axons in the brain, spinal cord, and optic nerve, causing nontraumatic disability among young adults.1,2 Although the etiology of MS is still not elucidated, epidemiological studies indicate that MS is a multi-factorial complex disorder that involves environmental and genetic factors.3 Patients with MS have an increased risk of mortality and a decreased life expectancy by 7–14 years, compared with the general population.4,5
MS affects approximately 2.5 million individuals globally.6 The prevalence of MS varies according to the geographical, environmental, and ethnic characteristics of a given region.7 As per the recent international estimates, the annual prevalence of MS was found to be highest in UK (203.4/100,000) and lowest in Japan (3.9/100,000).8,9 Irrespective of region, MS usually occurs during the most productive years of one’s life, with the age of onset being between 20 and 40 years.10 Globally, MS is approximately twice as common among women than men.10,11
Progression of MS is associated with a considerable burden on the individual, employers, health care system, and society. Patients with MS accrue financial burden due to lost work productivity and increased health care resource utilization and experience poor health status. For example, a cross-sectional observational study found that patients with MS in US had low physical component summary score (PCS), mental component summary score (MCS), scores and health state utility scores from the Medical Outcomes Study Short Form 12-Item Health Survey version 2. They also reported greater absenteeism, presenteeism, and overall work impairment, as well as a greater number of health care provider (HCP) visits, emergency room (ER) visits, and hospitalizations, compared with controls.12 Results from a Japanese survey also revealed a strong negative correlation between MS symptoms and health-related quality of life, which was measured using the Functional Assessment of MS, the Nottingham Adjustment Scale-Japanese version, and the EuroQol 5D.13 Furthermore, cross-sectional analysis of real-world data from Japan14 and USA15 revealed that the monthly total cost of MS per patient was ¥93,542 ($781) and $4,912, respectively.
Very few studies have assessed the health-related burden of MS in Japan, and only one recent study evaluated economic outcomes from this region.16 As such, the burden of MS in Japan is not yet well understood, and further clarification is necessary. In addition, the limited available literature has not framed the burden of MS in Japan within a broader international context, which can help to elucidate the extent to which outcomes in Japan may generalize to other regions. Hence, the primary aim of the present study was to examine the effect of MS on health status, work productivity loss, activity impairment, health care resource utilization, and costs in Japan. The secondary objective was to compare the health status of patients with MS in Japan vs that in US and five European Union (5EU) countries (France, Germany, Italy, Spain, and UK).
Materials and methods
Sample
For the primary objective, unique respondents who participated in the Japan National Health and Wellness Survey (NHWS) between 2009 and 2014 were included for analysis (n=147,270).17 A total of 18,297 respondents completed more than 1 year of the NHWS, in which case only the respondent’s most recent year’s data were included. The study population for the secondary objective was taken from the NHWS of 5EU (n=823 patients with MS; 2010, 2011, and 2013 NHWS; total N=167,631), Japan (n=85; 2009–2014 NHWS), and US (n=2,364; 2009–2014 NHWS; N=384,481). NHWS respondents were adults (≥18 years old) recruited for the self-administered, Internet-based survey using stratified sampling designed to reflect the age and gender distribution of the adult population in the country of interest; for US NHWS only, sampling was also stratified to mimic the distribution of the adult general population by race/ethnicity. Only respondents willing to provide written informed consent were included. Since the NHWS is a retrospective self-reported survey, it was exempted from review, most recently by the Pearl Institutional Review Board (Indianapolis, IN, USA). Data will be made available, on request, for the purpose of replication in noncommercial use.
Measures
Demographics
Age, sex, education, household income, and health insurance status were all included in the analysis (Table 1).
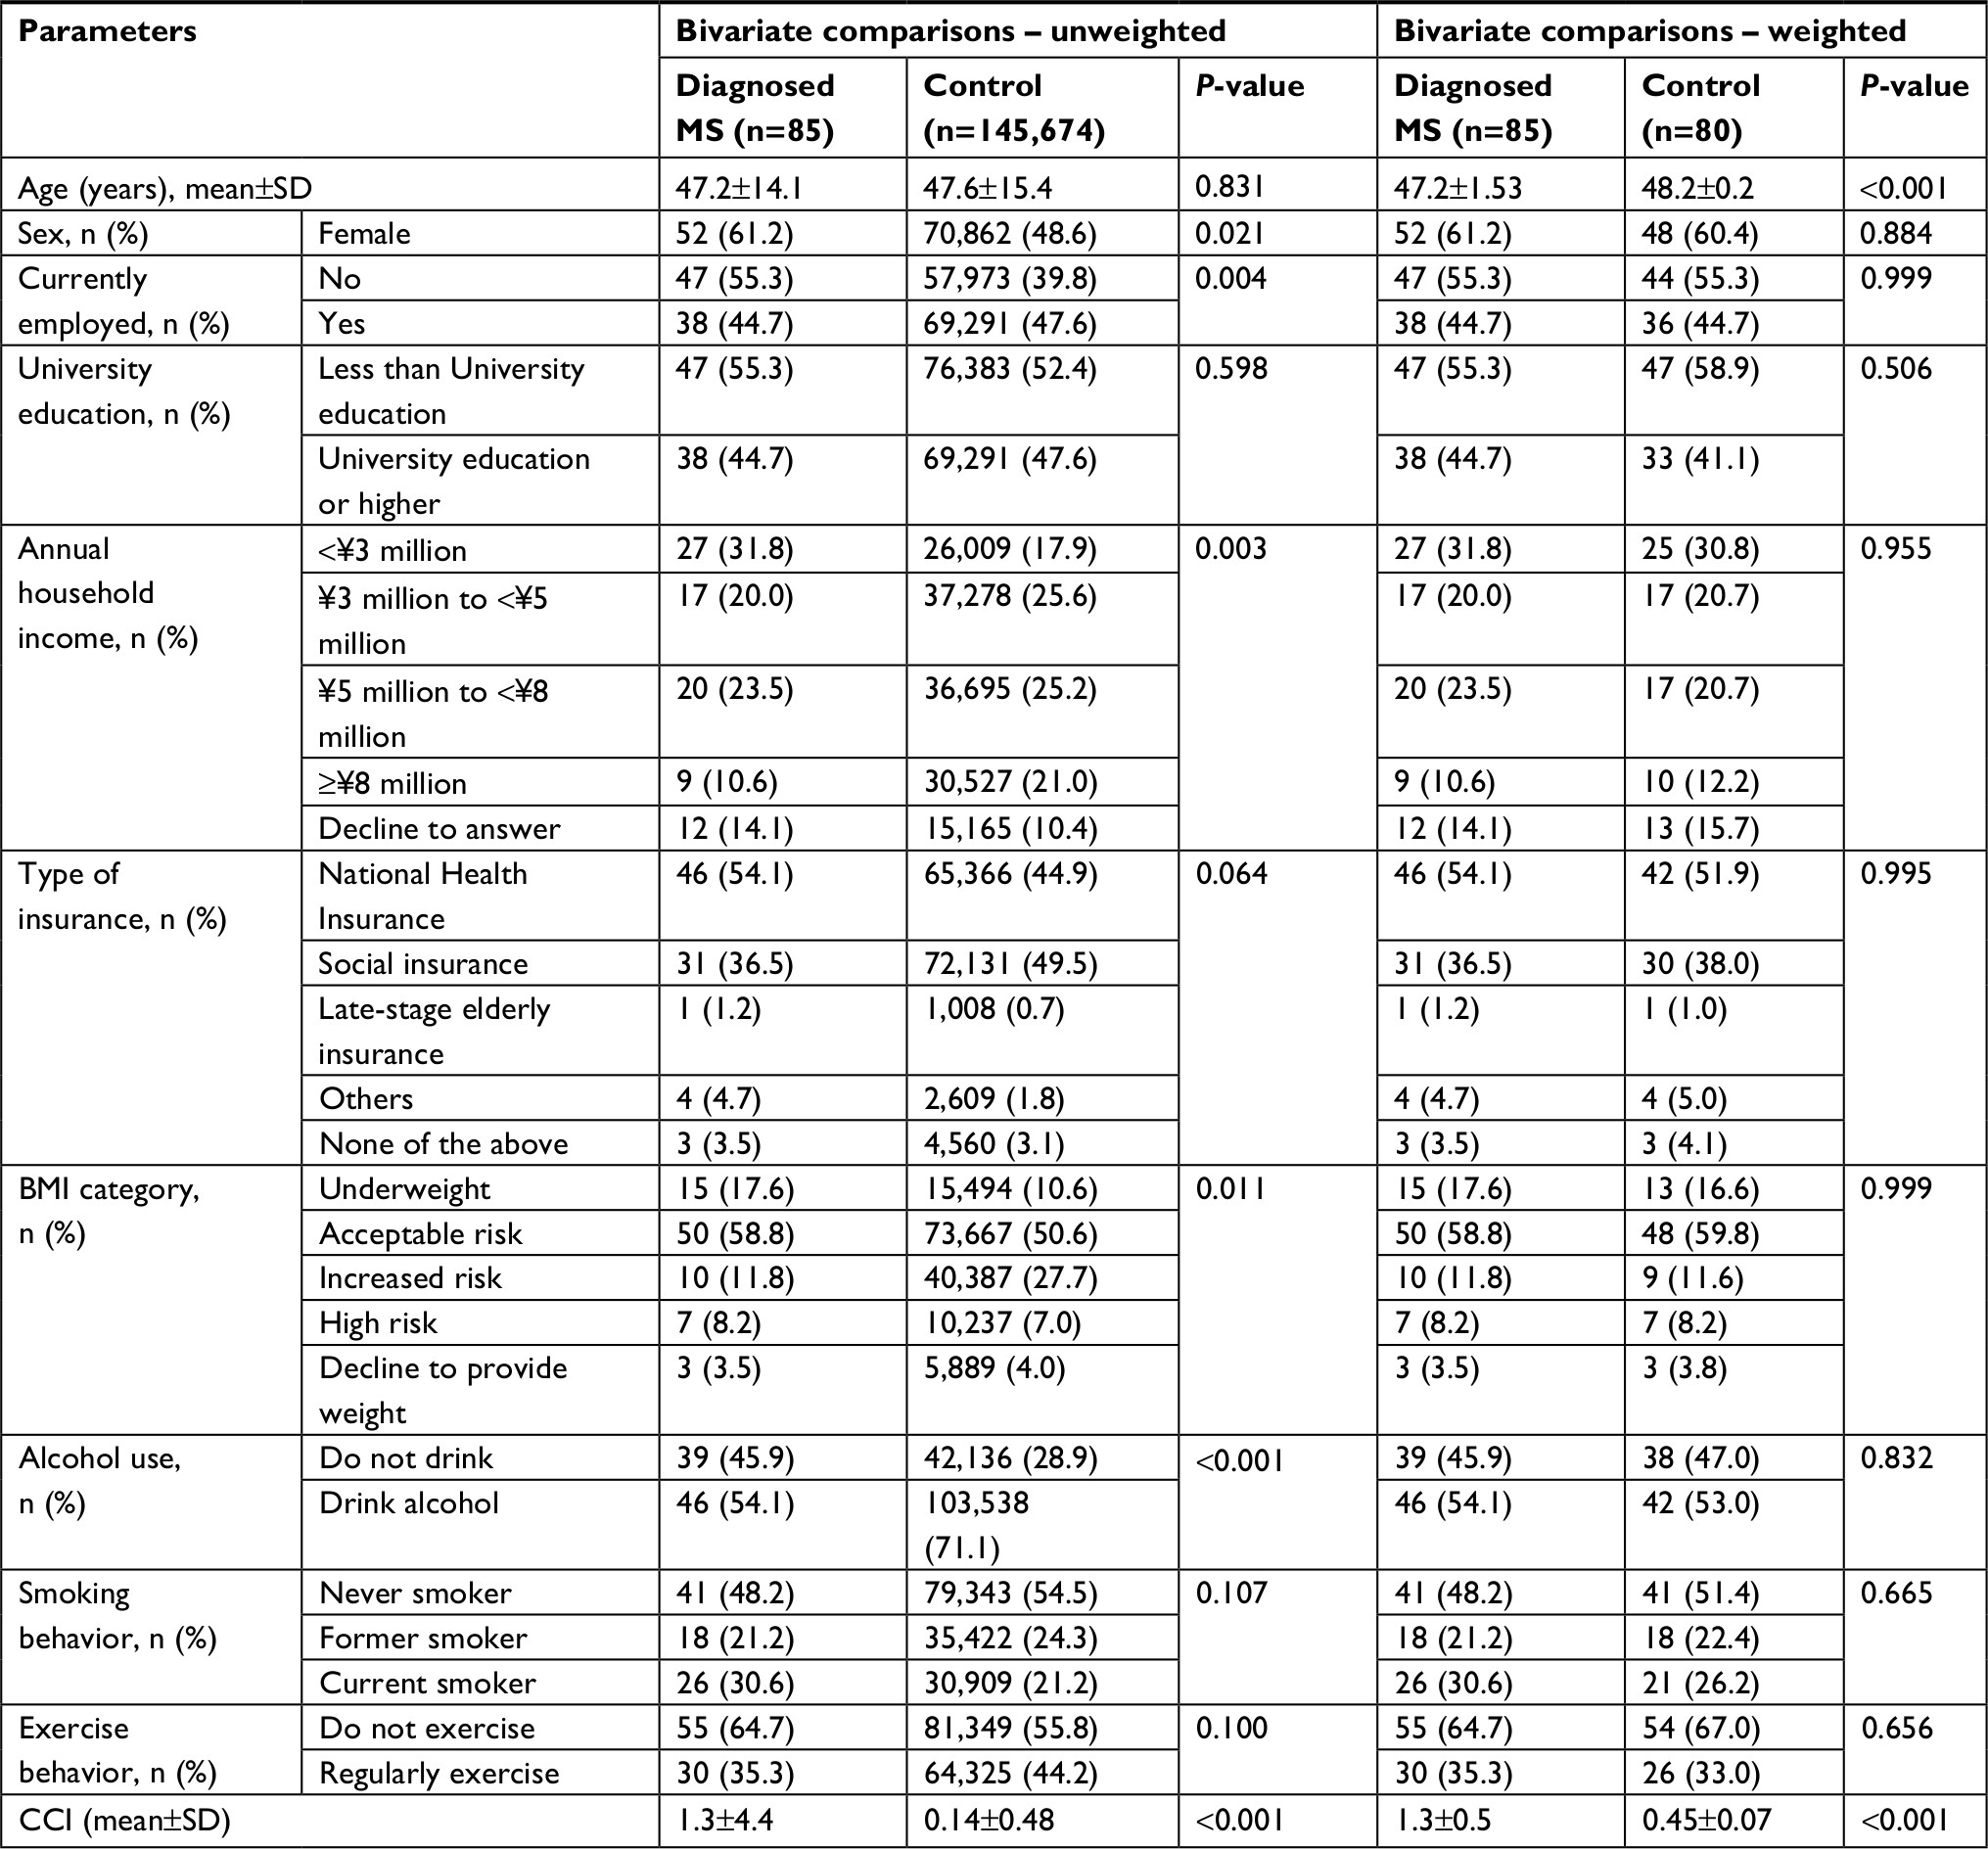 | Table 1 Comparisons of demographics and health characteristics between patients with MS and control group Note: Cost conversion: ¥3 million=US$29,553, ¥5 million=US$49,254, ¥8 million=US$78,807 as per conversion rates on July 1, 2014. Abbreviations: BMI, body mass index; CCI, Charlson comorbidity index; MS, multiple sclerosis. |
Health characteristics
Health characteristics included smoking, exercise behavior, alcohol use, and body mass index (BMI); BMI was categorized according to WHO’s guideline for Asian population18: underweight (<18.5 kg/m2), acceptable risk (18.5 to <23 kg/m2), increased risk (23 to <27.5 kg/m2), high risk (≥27.5 kg/m2), or declined to report weight. Scores from the Charlson comorbidity index (CCI) were used to measure comorbidity burden. The CCI weights and sums the self-reported presence of several chronic diseases (eg, diabetes, congestive heart failure, metastatic tumor), with higher scores signifying greater burden from comorbid conditions.19
MS status
NHWS respondents who self-reported being diagnosed with MS were included in the MS group; the remaining subjects were included in the control group.
Health status
Health status was assessed using the Medical Outcomes Study Short Form 36-Item Health Survey version 2.20 This questionnaire was used to derive two summary measures, the MCS and PCS, as well as the short form-6 dimensions (SF-6Ds), an index measure of health state utilities.21 Scores on the MCS and PCS can range up to 100, whereas scores on the SF-6D range up to 1. Higher scores on all the measures indicate better health status. Minimally important differences (MIDs) on the MCS and PCS are represented by 3.0 points,20 whereas the MID on the SF-6D is 0.04 points.22
Work productivity and activity impairment
The Work Productivity and Activity Impairment-General Health questionnaire23 was used to assess absenteeism, presenteeism, overall work impairment, and activity impairment as percentages; higher values indicate greater impairment due to one’s health in the past 7 days. Absenteeism, presenteeism, and overall work impairment data were only available for respondents currently employed (full time, part time, or self-employed), whereas activity impairment data were available for all respondents.
Health care resource utilization
Resource utilization was assessed by the number of HCP and ER visits in the past 6 months, as well as number of times hospitalized in that timeframe.
Costs
Annual indirect costs were calculated using the Lofland method, by applying hourly wage rates (from the Japan Basic Survey on Wage Structure, 2011) to the NHWS productivity impairment data.24 Each employed respondent’s annual wage was estimated from median weekly rates multiplied by work weeks per year. Annualized direct costs were derived by multiplying 6-month estimates of resource utilization by 2 and then applying corresponding unit costs.25 Hospitalization costs were obtained by multiplying costs per day by average number of days per hospitalization (according to the Organization for Economic Cooperation and Development) before applying that estimate to the number of hospitalizations.26,27 The costs were converted to US dollars according to the rate indicated at the midpoint of the final year of data included in the study (July 1, 2014).28
Analyses
Analyses were conducted using Statistical Analysis System v9.3. The analytical approach was the same for both the primary and secondary objectives.
Treatment of outliers and extraneous controls
Extraneous controls included respondents without MS whose range of age values was outside that of respondents in the MS group. The maximum age in the MS group was 77 years, and so extraneous control subjects older than 77 years were excluded from the analysis (n=1,496). Covariate distributions were examined for outliers, resulting in the removal of 15 respondents from the MS group based on the CCI scores greater than 30. The final sample used for the primary objective analyses included 145,759 respondents (Figure 1).
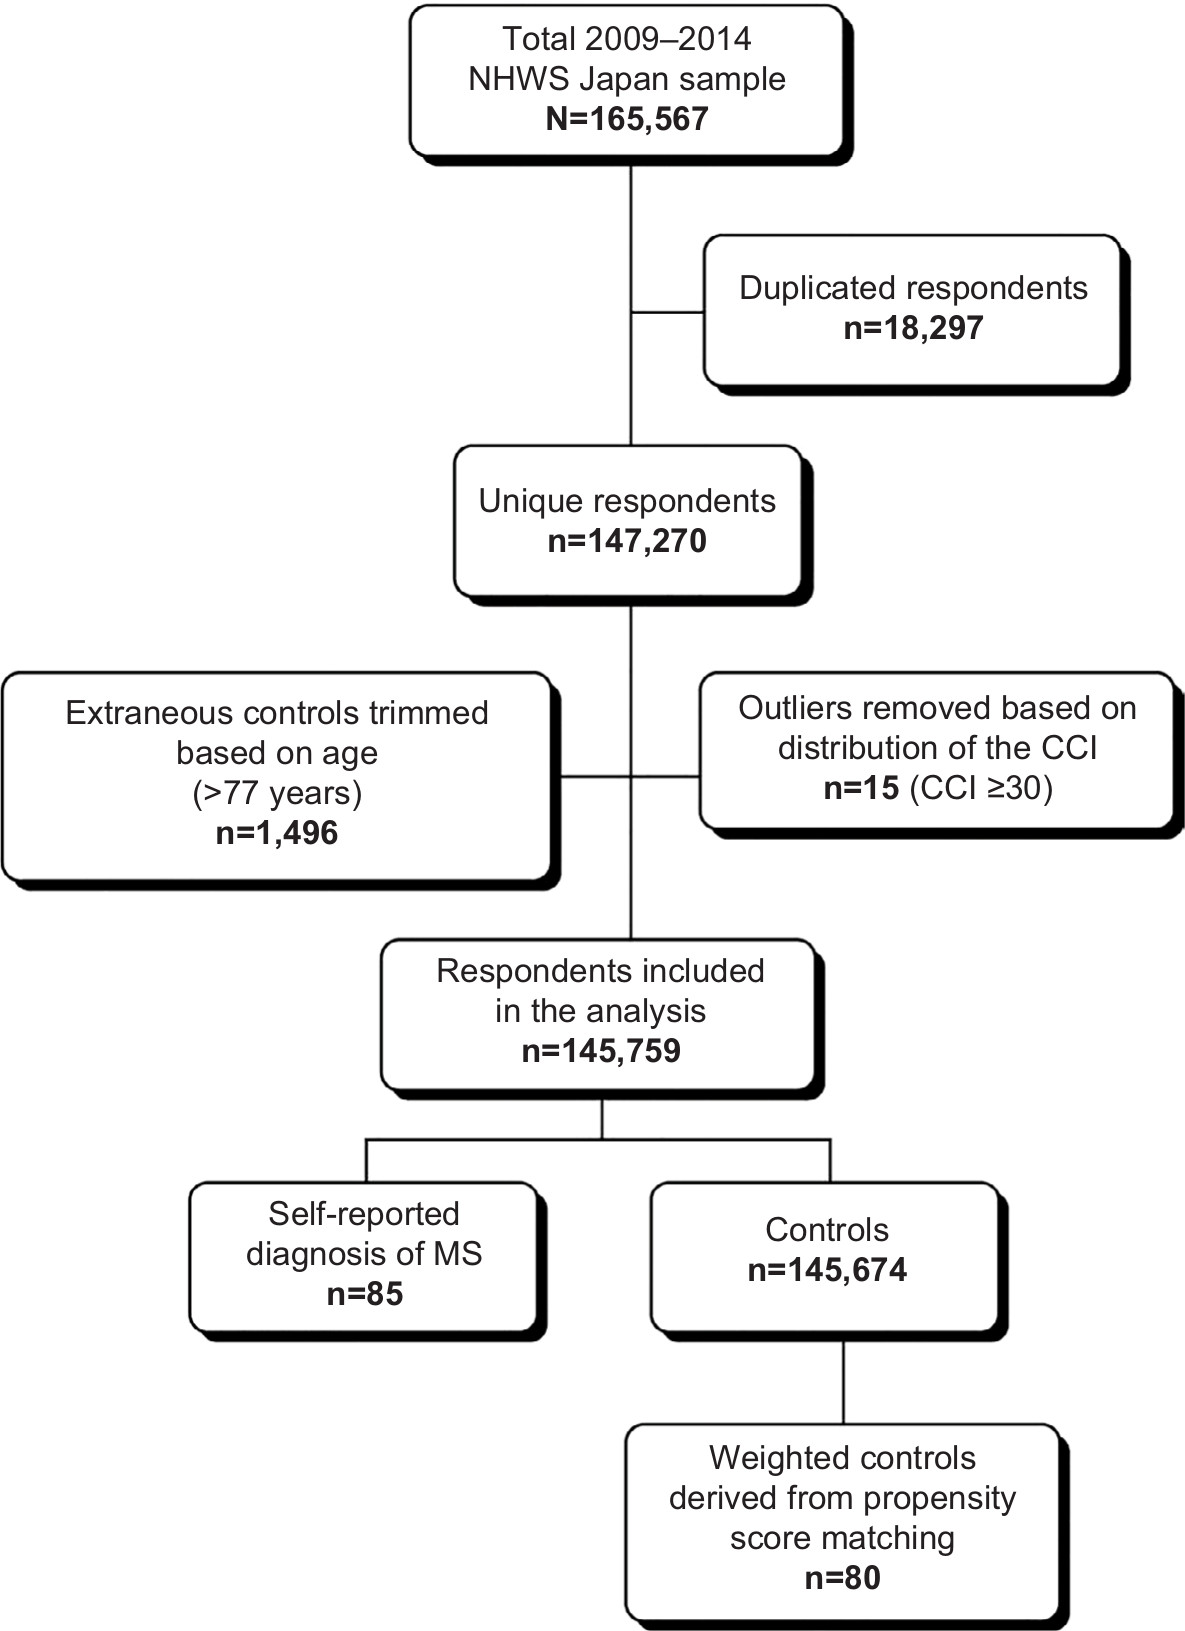 | Figure 1 Flow diagram of the study respondents. Abbreviations: CCI, Charlson comorbidity index; MS, multiple sclerosis; NHWS, National Health and Wellness Survey. |
Independent group comparisons
Demographic and health characteristics were compared across MS and control groups to help differentiate between these subpopulations and to help identify covariates for multivariable models. For categorical variables and continuous variables, chi-squared test and one-way ANOVA were used, respectively, to identify significant differences between the groups, as well as across countries for the secondary objective.
Creation of sample weights
Propensity score weighting, using weights derived with the Toolkit for Weighting and Analysis of Nonequivalent Groups, was used to minimize large anticipated baseline differences across the MS and controls group (ie, those without MS).29 Variables that differed statistically between groups, based on independent sample comparisons, were inputted into a generalized boosted model to predict MS (vs no MS) as a basis for developing weights to equate MS and non-MS controls in Japan, as well as equating patients in Japan with corresponding patients with MS in 5EU and US, so as to ensure that non-Japanese patients had similar baseline characteristics. One-, two-, and three-way interaction terms were tested in the models. The weighted samples provide a whole number that reflects the entire original sample, albeit with individual respondents counted as full or partial respondents to the extent that they are similar to or different from, respectively, the sample of patients with MS.
Propensity score analyses have important advantages over traditional regression-based approaches for covariate adjustment. For example, unlike regression, propensity score estimates are not derived from modeling of the outcome variables. This avoids misspecification of the treatment effect model and allows the specification of the model for the covariates to be independent of its potential influence on the estimated treatment effect.30 Machine learning methods, such as generalized boosted models, are more efficient and precise than logistic regression models for generating propensity scores and weights—due to their efficient exploration of interactions and consequent ability to explain more potential variance in the data—and they can be readily applied in scenarios in which there are multiple levels of treatment. With generalized boosted models, several iterations of multiple regression trees are performed for propensity score and weight estimation. The program can be modified, as needed, to ensure the most balanced propensity score model, thus highlighting a key benefit of this approach over regression-based alternatives. The Toolkit for Weighting and Analysis of Nonequivalent Groups package also enables users to assess the quality of the propensity score weights estimated from generalized boosted models.29
Multivariable analyses
Weighted generalized linear models were used to further adjust baseline differences that existed after weighting, to assess the unique burden associated with MS on health and economic outcomes, and to test if any statistically significant differences existed between those diagnosed with MS and controls, as well as among patients with MS across countries. Covariates included age and CCI score for the primary objective and only CCI score for the secondary objective, as these were the only covariates that significantly differed following the weighting procedure. Health status (MCS, PCS, and health state utilities) data were best fit using a normal distribution for the error terms and the identity link function. Given the skew of the work productivity impairment, activity impairment, health care resource use, and direct/indirect costs variables, a negative binomial distribution with a log link function provided the best fit to the data. Estimated means, standard errors, CIs, and P-values were reported for each dependent variable.
Results
Demographics of study participants
On average, the respondents were 47.6 years old, 48.7% female, 39.8% not currently employed, 52.4% had less than a university education, 17.9% earned less than ¥3 million, and 44.9% were on national health insurance (Table 1). In addition, 7.0% had a BMI that classified them as high risk, 71.1% consumed alcohol, 21.2% currently smoked, and 44.2% exercised regularly. The sample had an average CCI score of 0.14.
Overall, 85 and 145,674 respondents were categorized as diagnosed with MS or controls without MS, respectively (Figure 1). In the unweighted sample, patients with MS were significantly more likely to be females, were more likely to be unemployed, had lower annual household income, were less likely to consume alcohol, and had a significantly higher CCI score (for all, P<0.05). Controls and patients with MS also differed significantly across BMI risk categories (Table 1).
The weighted sample included 165 respondents (n=80 as controls and n=85 in the MS group). After weighting, patients with MS were found to be significantly younger and had higher CCI scores than controls (for both, P<0.001). Other parameters were not statistically different across the groups (Table 1).
Effect of MS on health status, work productivity loss, activity impairment, health care resource utilization, and costs
In the weighted sample, patients with MS had significantly lower MCS (39.8 vs 45.8), PCS (40.9 vs 50.9), and health state utility (0.62 vs 0.74; for all, P<0.001) scores than controls; all the differences exceeded the MIDs. Patients with MS reported significantly higher absenteeism (16.9% vs 4.6%), presenteeism (38.9% vs 21.6%), overall work impairment (48.9% vs 23.9%), and activity impairment (47.3% vs 25.1%), compared with controls (for all, P<0.001). In addition, patients with MS had a significantly higher number of HCP visits (16.8 vs 6.0), ER visits (0.75 vs 0.15), and hospitalizations (3.9 vs 1.0) in the past 6 months than controls, resulting in greater direct and indirect costs (for all, P<0.001; Table 2).
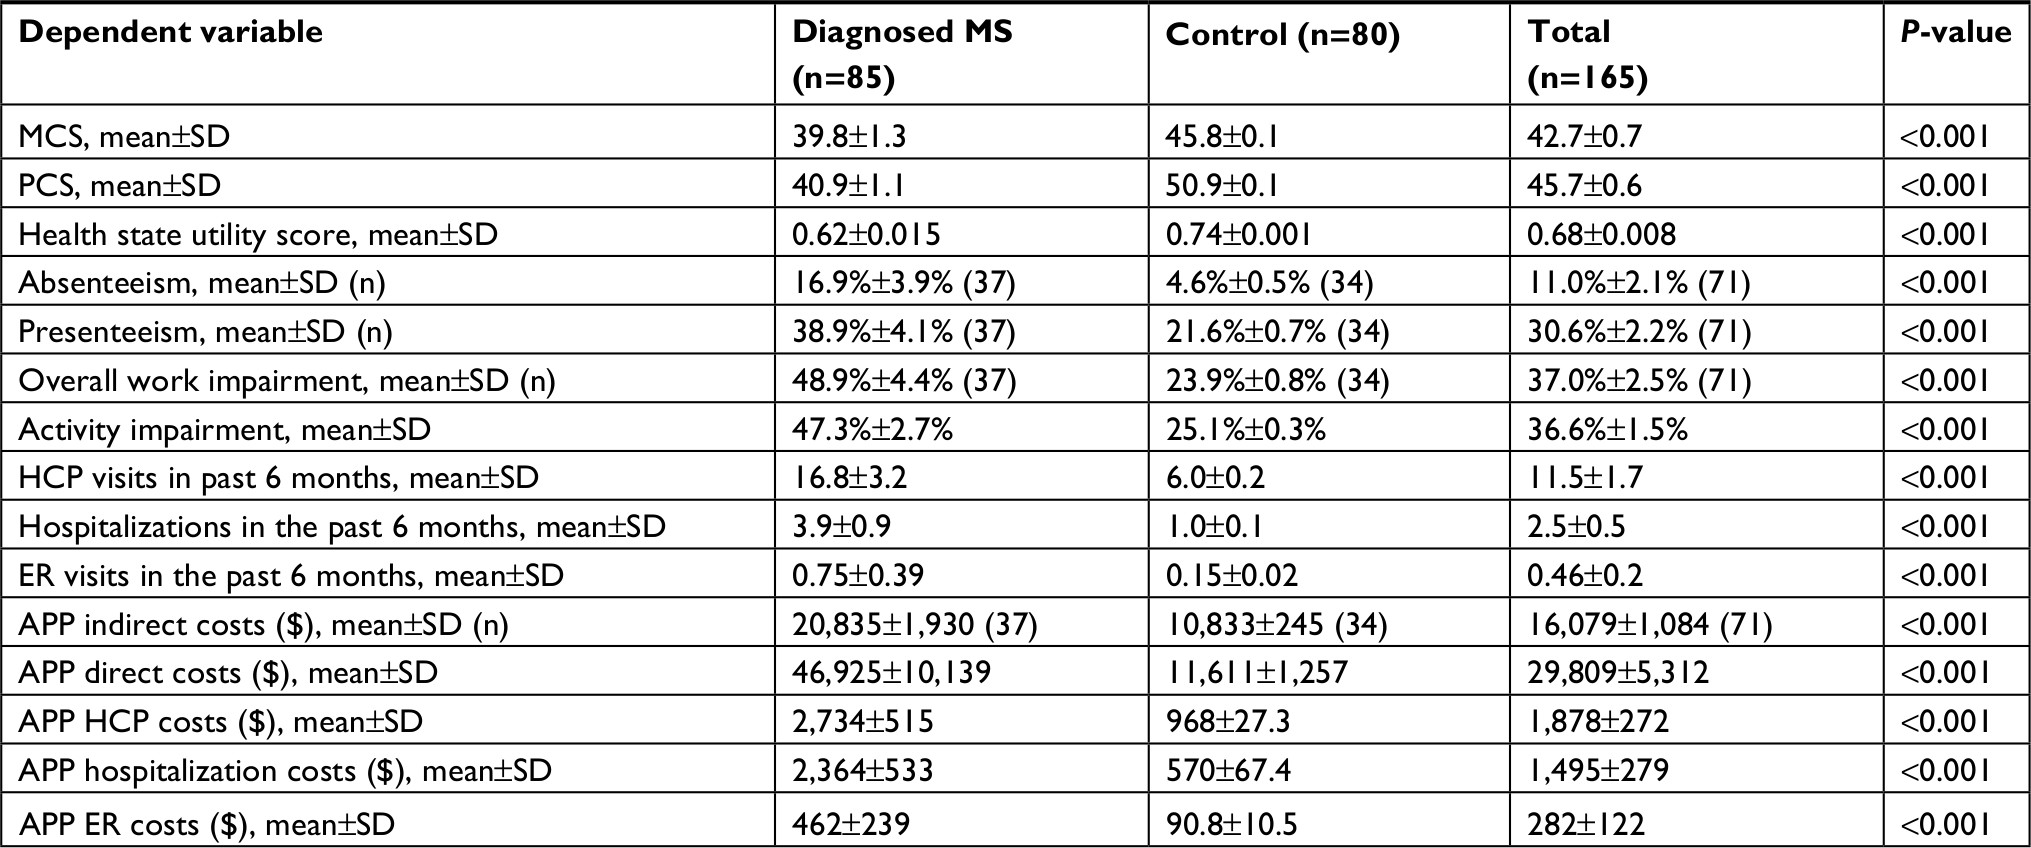 | Table 2 Effect of MS on health status, work productivity loss, activity impairment, health care resource utilization, and costs Abbreviations: APP, annual per-patient; ER, emergency room; HCP, health care provider; MCS, mental component summary score; MS, multiple sclerosis; PCS, physical component summary score. |
After further controlling for age and CCI scores, patients with MS reported significantly lower MCS (40.1 vs 45.8), PCS (41.4 vs 51.2), and health state utility (0.63 vs 0.74) scores than controls (for all, P<0.001). For all three health status measures, these differences exceeded the MIDs. In addition, patients with MS had significantly higher absenteeism (12.0% vs 3.7%), presenteeism (33.8% vs 19.8%), overall work impairment (40.9% vs 21.6%), and activity impairment (43.6% vs 24.0%) than controls (for all, P<0.001). In terms of resource use, patients with MS reported a significantly higher number of HCP visits (8.0 vs 4.7) and hospitalizations (2.7 vs 0.69) in the past 6 months, compared with controls (P<0.001 for both). Patients with MS also had significantly higher costs associated with HCP visits (¥131,701 [$1,297] vs ¥77,986 [$768]) and hospitalizations (¥167,049 [$1,646] vs ¥42,141 [$415]) than controls (P<0.001 for both). However, patients with MS had significantly fewer ER visits (0.03 vs 0.10, P=0.009) and lower associated costs (¥1,707 [$17] vs ¥5,989 [$59], P<0.001) than controls (Table 3).
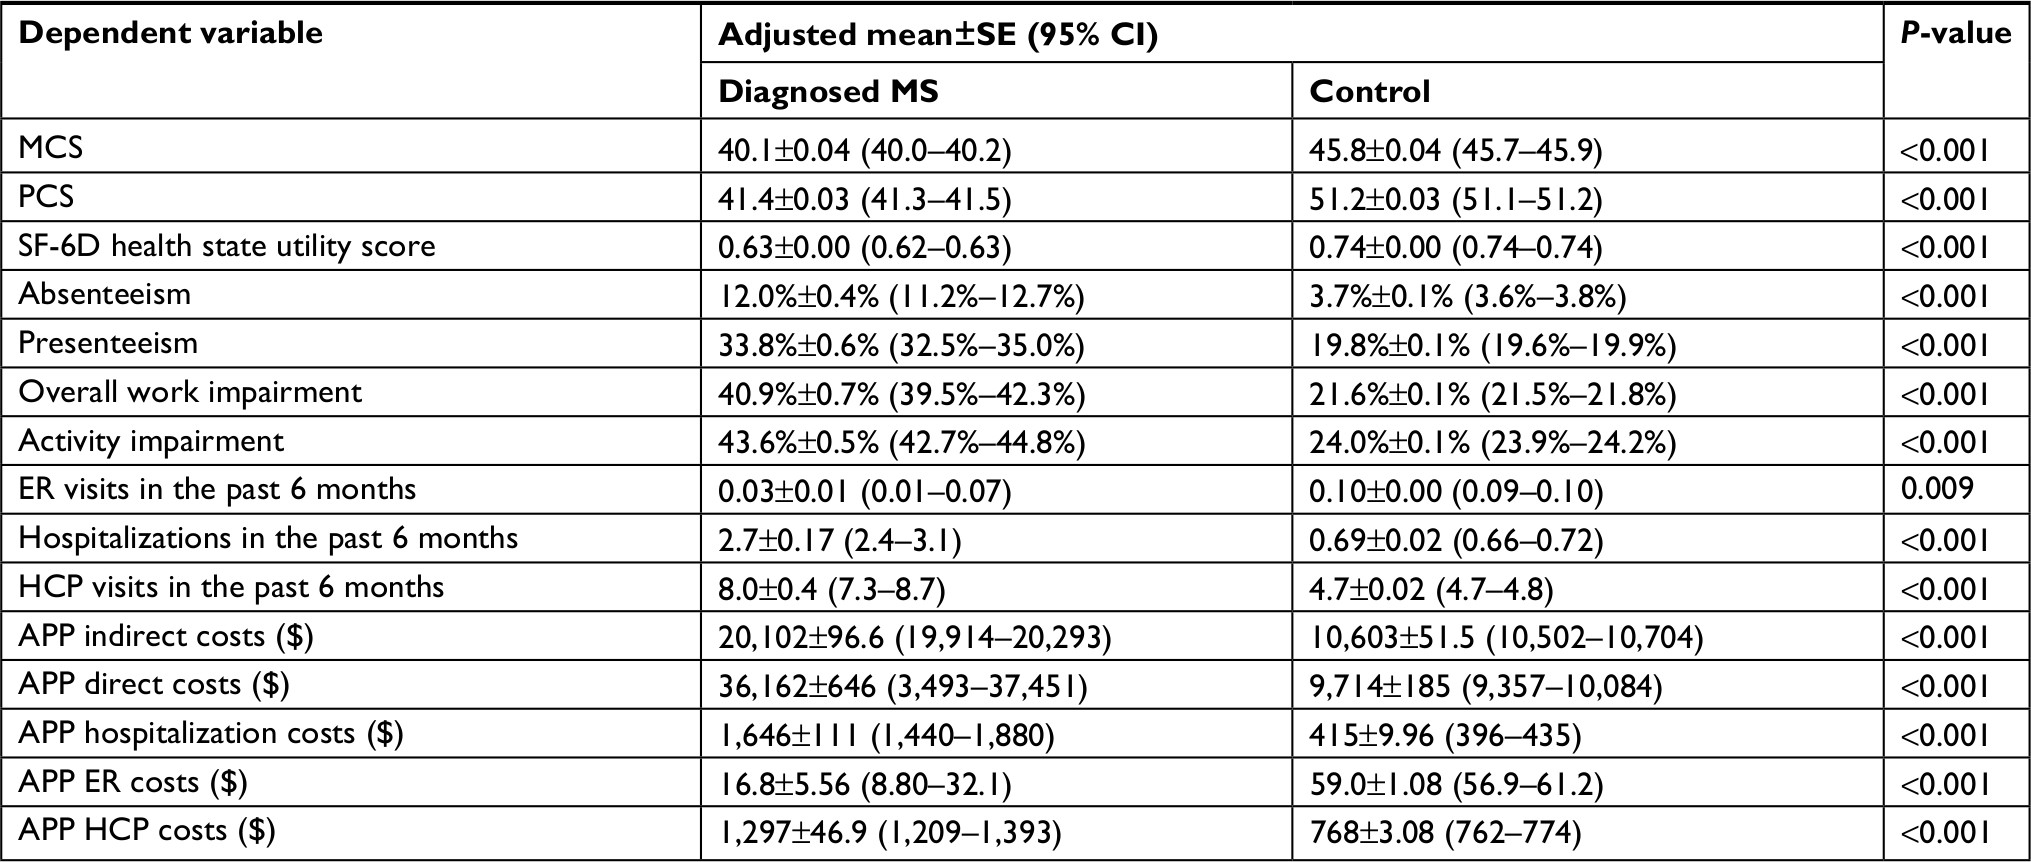 | Table 3 Effect of MS on health status, work productivity loss, activity impairment, health care resource utilization, and costs after adjustment for age and CCI score Abbreviations: APP, annual per-patient; CCI, Charlson comorbidity index; ER, emergency room; HCP, health care provider; MCS, mental component summary score; MS, multiple sclerosis; PCS, physical component summary score; SE, standard error; SF-6D, short form-6 dimensions. |
Comparison of health status among 5EU, Japan, and US patients with MS
Patients with MS in Japan, US, and the 5EU were compared on demographics, health characteristics, and health status. Significant differences existed on all demographic and health characteristics (for all, P<0.05), although patients with MS in Japan, the 5EU, and US did not differ on sex. Specifically, US patients with MS were older, less likely to be employed, and more frequently had BMI in the increased or high-risk categories, compared with those in the 5EU and Japan. In addition, Japanese patients with MS were more likely to have a university degree, less likely to exercise regularly, and had a higher CCI score, compared with 5EU and US patients with MS (Table 4).
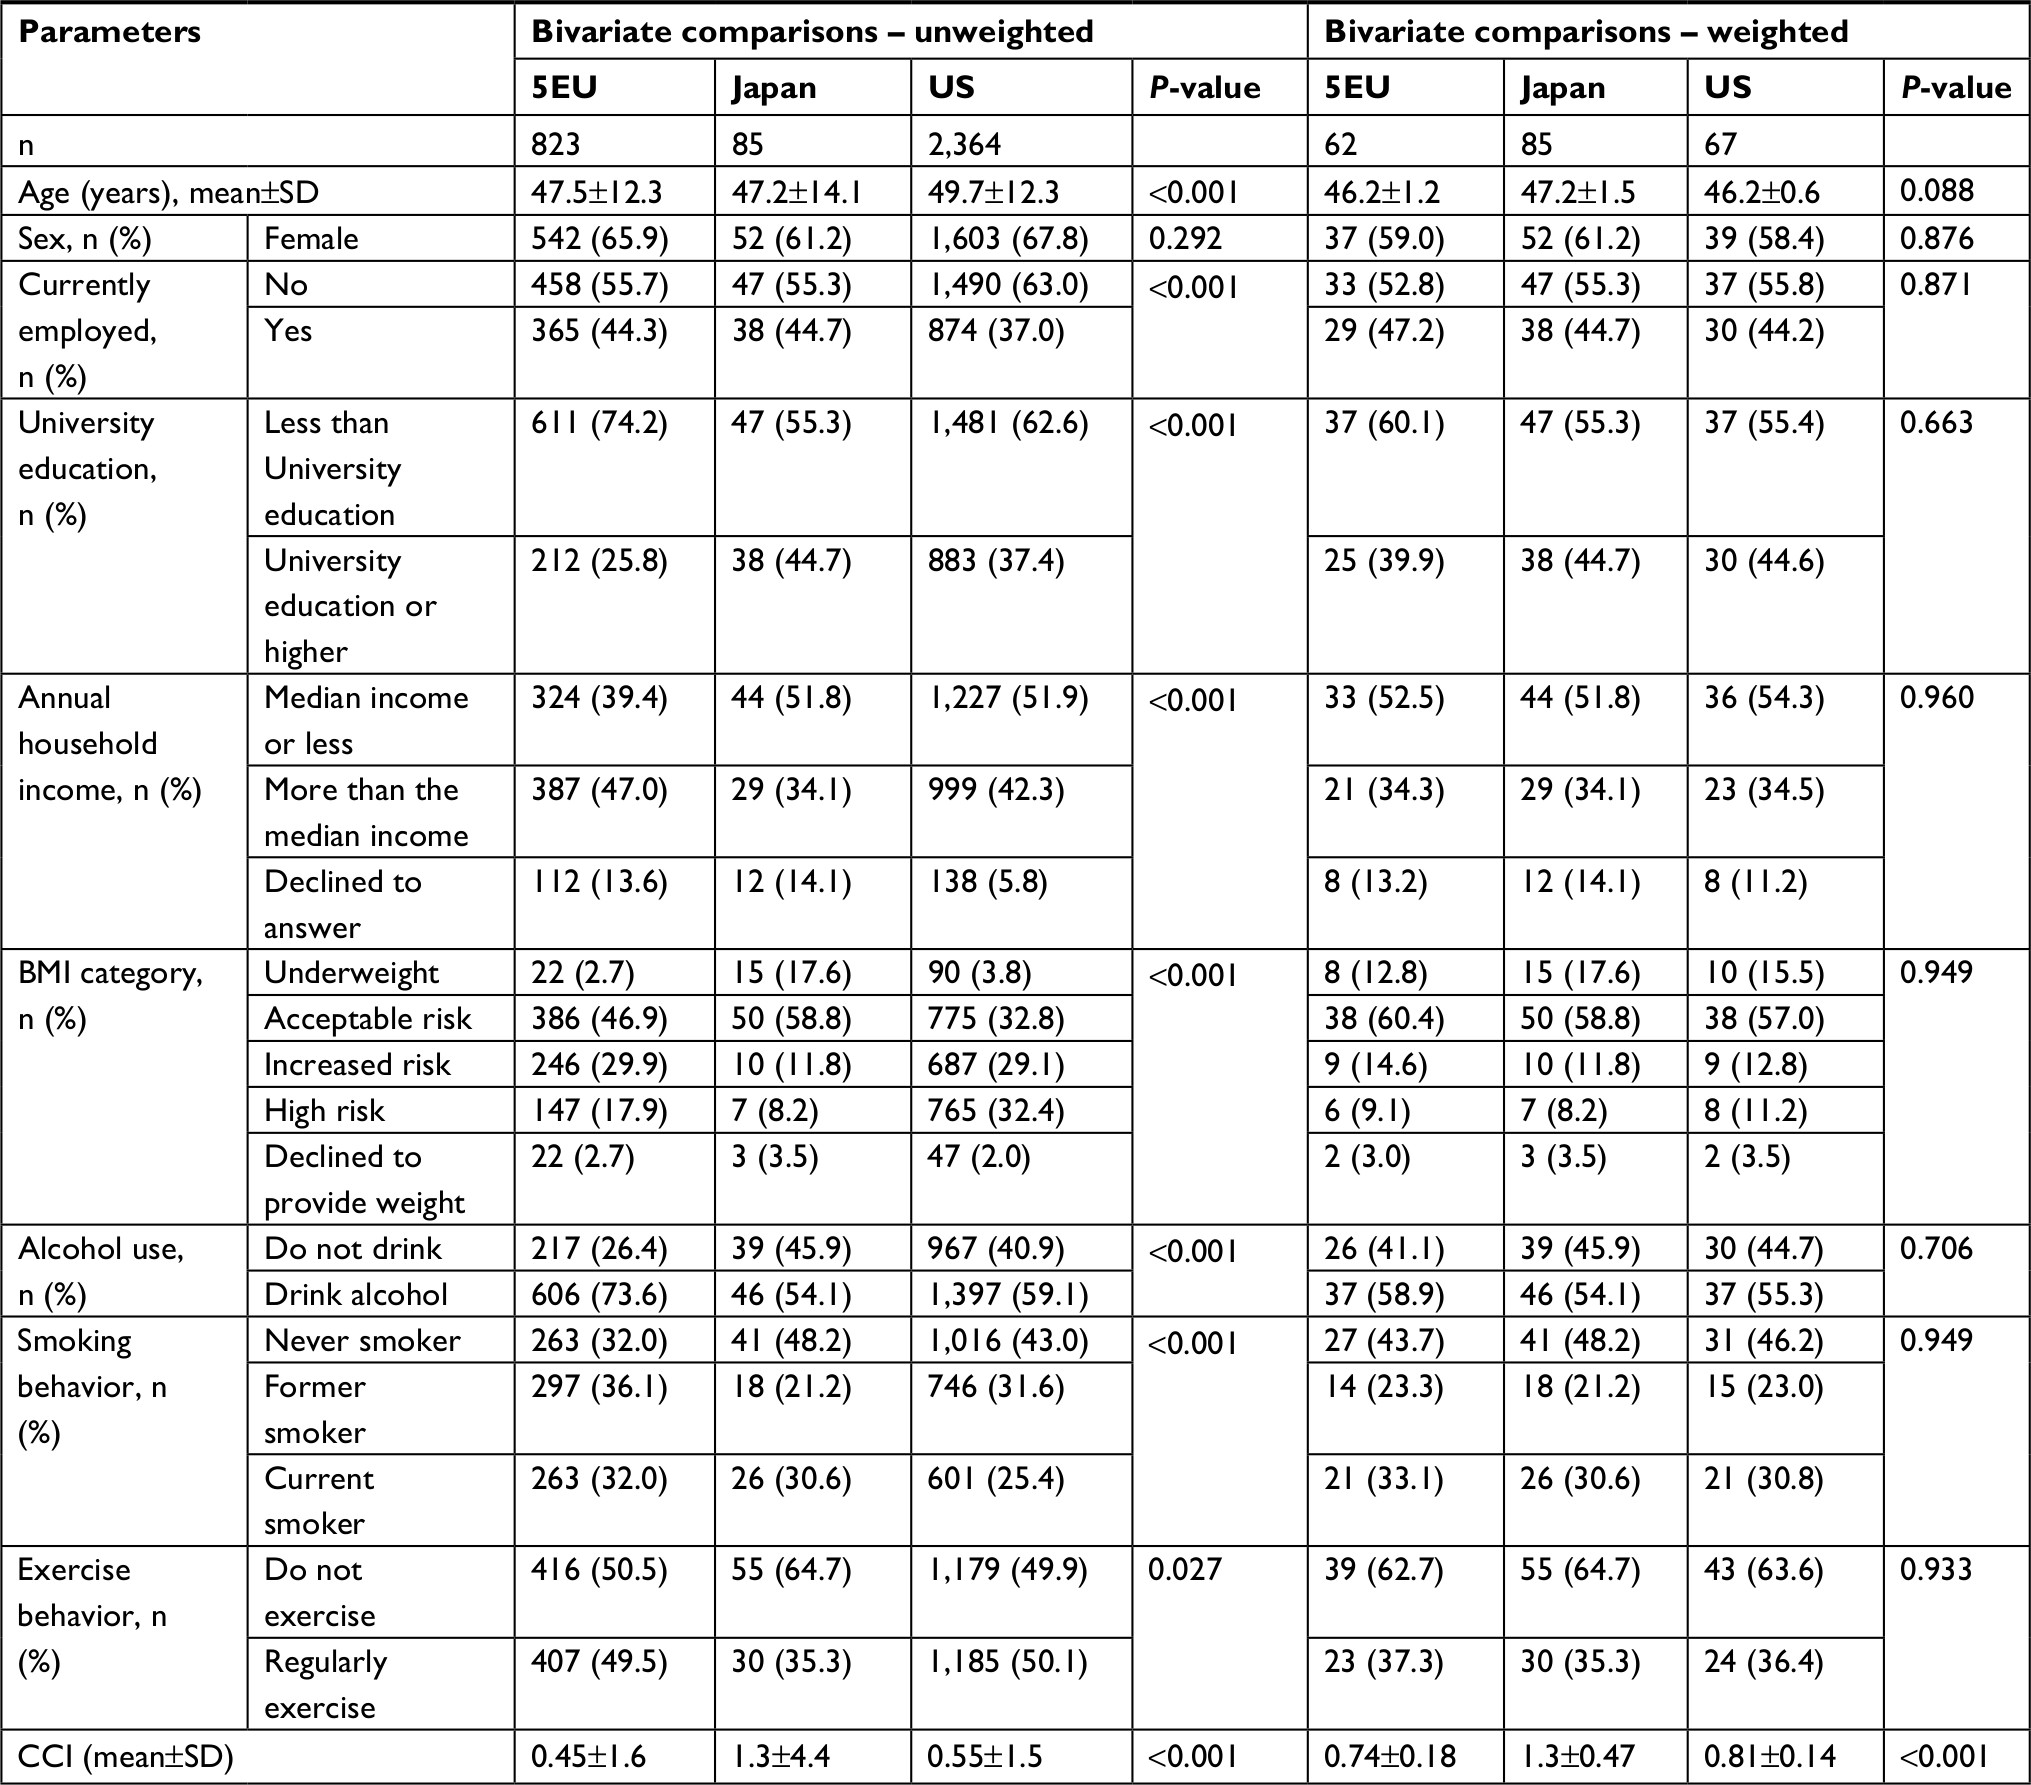 | Table 4 Independent sample comparisons for demographics and health characteristics among 5EU, Japan, and US patients with MS Abbreviations: 5EU, five European Union; BMI, body mass index; CCI, Charlson comorbidity index; MS, multiple sclerosis. |
The weighted sample sizes for 5EU, Japan, and US were 62, 85, and 67, respectively. All demographics and health characteristics variables were similar in the weighted comparisons, with the exception of CCI scores, which remained significantly different across the groups (P<0.001; Table 4).
In the weighted analysis of health status outcomes, Japanese patients with MS scored lower on the MCS, but higher on the PCS, than 5EU and US patients with MS. In pairwise comparisons, differences on the MCS exceeded MID for Japanese vs US patients with MS, while differences on the PCS exceeded MID for Japanese vs 5EU and US patients with MS. There was a significant difference in SF-6D health state utility scores, with 5EU patients scoring lower than Japanese and US counterparts; however, these differences did not reach MIDs (Table 5).
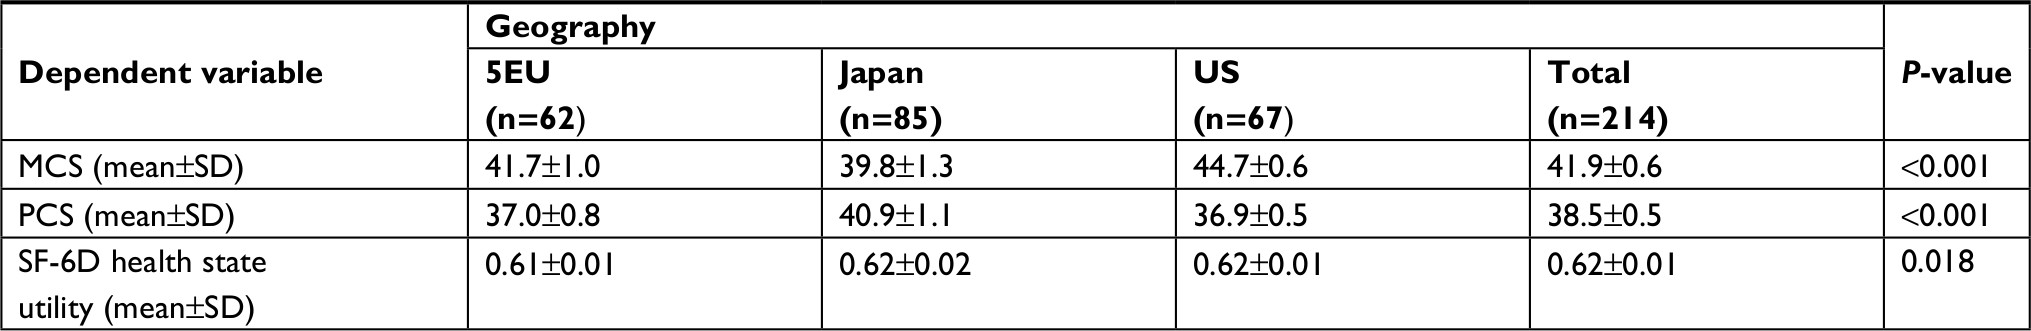 | Table 5 Weighted independent sample comparisons for health status among 5EU, Japan, and US patients with MS Abbreviations: 5EU, five European Union; MCS, mental component summary score; MS, multiple sclerosis; PCS, physical component summary score; SF-6D, short form-6 dimensions. |
After adjustment for significant differences in CCI scores, Japanese patients with MS scored lower on the MCS, but higher on the PCS than patients from the 5EU and US (P<0.001 for all). Differences for both the measures exceeded the MID. Finally, for SF-6D health state utility scores, Japanese patients with MS did not differ from US patients with MS but scored significantly higher than 5EU patients with MS (P=0.006), although the difference did not exceed MID (Table 6).
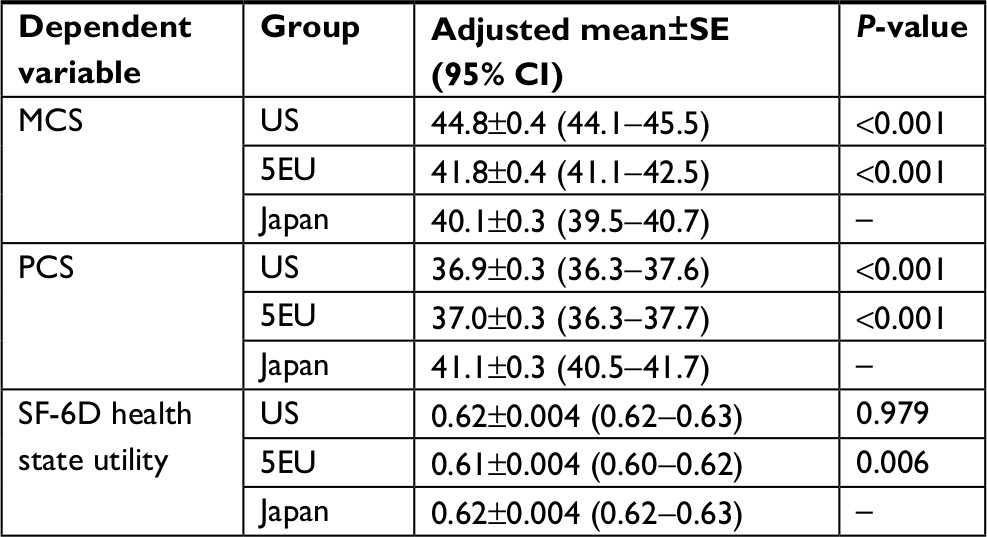 | Table 6 Adjusted means from multivariable analysis of health status in Japan vs US and 5EU as function of MS, controlling for CCI scores Abbreviations: 5EU, five European Union countries; CCI, Charlson comorbidity index; MCS, mental component summary score; MS, multiple sclerosis; PCS, physical component summary score; SE, standard error; SF-6D, short form-6 dimensions. |
Discussion
In the present study, patients with MS exhibited significantly worse health status and higher work productivity loss, health care resource use, and costs (direct and indirect), compared with controls without MS, even after adjusting for confounders. The study findings suggest that MS negatively affects health status, which is consistent with earlier research.12,16,31 For example, an observational study using Medical Expenditure Panel Survey data reported worse health status, as measured via PCSs and MCSs, among those with MS, compared with those without MS in the general population.31 Similarly, cross-sectional observational studies conducted in US and Japan reported poorer health status, with lower PCS, MCS, and SF-6D health state utility scores among patients with MS, compared with controls.12,16
Earlier studies indicated that both absenteeism and presenteeism were common among patients with MS,32 and loss of work productivity resulted from the substantial increase in the use of long- and short-term sick leave.33 In addition, employees with MS had more than four times the number of work loss days per year than controls,34 and the annual rates of absenteeism for employees with MS ranged from 3.0 to 8.1 days.35 Consistent with these previous studies, in the current study, absenteeism (3.3-fold), presenteeism (1.7-fold), overall work impairment (1.9-fold), and activity impairment (1.8-fold) were higher in patients with MS, compared with controls. As patients and controls were matched on demographics and health characteristics, results suggest that MS uniquely contributes to work productivity loss and impairment in daily activities.
Respondents with MS in this study also had significantly higher resource utilization than the control group, which is consistent with previous research.36,37 Prior studies showed that patients with MS were more than twice as likely to be hospitalized overnight or to consult with a medical professional than individuals without MS.36,37 In addition, a retrospective cohort analysis of US claims data found that newly diagnosed patients with MS were two times more likely to have one or more ER visits; 3.5 times more likely to be hospitalized; and 2.4 times more likely to have one or more visits for physical, speech, or occupational therapy than controls.38 Overall, the present study extended prior research from US and EU by providing data on health care utilization among patients with MS in Japan.
In the current study, both direct (3.7-fold) and indirect (1.9-fold) costs incurred by patients with MS were higher than those of controls. Higher direct costs were mainly driven by annual hospitalizations and HCP visits. The annual per patient direct costs for MS patients (¥3,670,906/$36,161) in the present study were approximately three times as high as estimates reported in a Japanese study by Ogino et al,14 which determined that total mean per patient per month costs were around three times as high as in Japan’s general population. The difference in medical costs of MS patients across these studies can be attributed to the varying data collection methods, criteria used to identify MS, and calculation of costs. Ogino et al used a health insurance database (reflecting primarily large hospitals) to collect data, and they identified MS according to ICD 10 revision codes. In contrast, the current study included patients who self-reported an MS diagnosis in a broad sample of respondents, with unit costs applied uniformly across patients based on the available literature.26
In the current study, direct and indirect costs accounted for 64% and 36% of the total costs, respectively; this finding is in line with estimates from a previous systematic review in which direct and indirect costs comprised 77% and 23% of the total costs, respectively.39 The annual per patient direct costs in this study were approximately 1.8-fold higher than that of observational studies conducted in USA31 and the EU,40 probably due to the differences in cost evaluation years. Our data also showed that direct costs exceeded indirect costs for patients with MS, which is consistent with a Turkish study.41 Differences between geographic regions in costs are likely to be due to the substantial variation in the study designs, cost categories, resource use patterns, and availability of health care services in each country. Considering the economic burden associated with MS, interventions to improve health status, delay disease progression, decrease the number of relapses, and help patients with MS to retain employment for a longer duration may aid in diminishing this burden.
Previously, health-related quality of life assessed in US and 16 European countries using health status measures such as EuroQol 5D and Medical Outcomes Study Short Form 12-Item Health Survey version 2 was found to be lower in patients with MS.12,31,42 This study was the first to compare the health status of patients in Japan with counterparts in US and 5EU, and important cross-national differences were identified, even when weighting to otherwise equate baseline characteristics of US and 5EU patients with those of patients in Japan. MCSs were lower in Japanese patients with MS, relative to 5EU and US patients. In contrast, their PCSs were higher than those of patients with MS from the 5EU and US. These directional differences can help provide a better understanding of the unique burden of MS in Japan. The regional differences in health status may be due to variations in personality traits, employment status, income, access to treatment, or disease information.13,43–46
The poorer mental health status of Japanese patients with MS in this study may be due to the greater social stigmatization of those with mental health conditions in Japan compared with Western countries.47,48 This stigma inhibits individuals from seeking necessary treatment, which can, in turn, exacerbate mental health conditions. In addition, negative emotional states are closely linked to poor physical health and functioning in US, whereas this association is much weaker in Japan.49 This may potentially explain why Japanese patients with MS had higher PCSs, compared with those in US and 5EU, despite their worse mental health (ie, lower MCSs).
The present study had a few limitations that should be kept in mind when interpreting the results. Specifically, study responses were self-reported, thereby increasing the chances of response bias and errors in recall. A longitudinal study that includes more recent data will help to determine if the results would replicate after accounting for temporal effects. The cross-sectional design also precluded causal inferences. Some types of variables were not assessed, and any unobserved covariates may have increased bias in the estimated propensity weights. The NHWS was designed to mimic the demographic distribution of the adult population in Japan, although it may have underrepresented adults without motivation, ability, or access to participate in an online survey. Moreover, the study sample may not have adequately represented the subpopulation of adults with MS, which may also account for the relatively high prevalence. Comparisons between Japan and other countries were focused on patients with MS and the absolute outcomes of Japanese patients vs their counterparts (with similar baseline characteristics) elsewhere; therefore, the outcomes for the other countries are not intended to be representative of the broader MS patient populations in those countries. Other global studies, including corresponding control groups within each country, will be needed to evaluate the relative burden of MS across diverse patient populations in different countries. Similarly, non-MS controls in the current study were intended to reflect the MS population in Japan and are not representative of the broader non-MS population.
Conclusion
MS in Japan poses a substantial burden on patients due to poor health status and high work productivity loss, health care resource utilization, and costs. We hope that these findings can serve as a focus for subsequent efforts by HCPs and policymakers to reduce this burden. Cross-national differences in health status were also observed among patients with MS in Japan, the 5EU, and US, which suggests that the burden of MS is not uniform and may potentially be influenced, at least in part, by cultural factors. Further study is required to study and compare the clinical aspects of MS across countries.
Abbreviations
5EU, five European Union; BMI, body mass index; CCI, Charlson comorbidity index; ER, emergency room; HCP, health care provider; MCS, mental component summary score; MID, minimally important difference; MS, multiple sclerosis; NHWS, National Health and Wellness Survey; PCS, physical component summary score; SF-6D, short form-6 dimensions.
Acknowledgments
The authors acknowledge Urmila Rao, PhD, and Ramu Periyasamy, PhD, from Indegene Pvt Ltd. for their assistance with literature review and writing, as well as Martine C Maculaitis, PhD, for editing assistance on behalf of Kantar Health. This research was funded by Takeda Pharmaceutical Company Limited.
Author contributions
Kaoru Yamabe: study design, data analysis, interpretation, and manuscript development. Marco DiBonaventura: study design, data analysis, interpretation, and manuscript development. Chris Pashos: data analysis, interpretation, and manuscript development. All authors contributed to data analysis, drafting and revising the article, gave final approval of the version to be published, and agree to be accountable for all aspects of the work.
Disclosure
Kaoru Yamabe is an employee of Takeda Pharmaceutical Company Limited. Marco DiBonaventura, at the time of this study, was an employee of Kantar Health, a paid consultant of Takeda Pharmaceutical Company Limited. Chris Pashos is an employee of Takeda Pharmaceuticals International Co. The authors report no other conflicts of interest in this work.
References
Compston A, Coles A. Multiple sclerosis. Lancet. 2008;372(9648):1502–1517. | ||
Eskandarieh S, Heydarpour P, Minagar A, Pourmand S, Sahraian MA. Multiple Sclerosis Epidemiology in East Asia, South East Asia and South Asia: A Systematic Review. Neuroepidemiology. 2016;46(3):209–221. | ||
Ghasemi N, Razavi S, Nikzad E. Multiple sclerosis: Pathogenesis, symptoms, diagnoses and cell-based therapy. Cell J. 2017;19(1):1–10. | ||
Lunde HMB, Assmus J, Myhr KM, Bø L, Grytten N. Survival and cause of death in multiple sclerosis: a 60-year longitudinal population study. J Neurol Neurosurg Psychiatry. 2017;88(8):621–625. | ||
Scalfari A, Knappertz V, Cutter G, Goodin DS, Ashton R, Ebers GC. Mortality in patients with multiple sclerosis. Neurology. 2013;81(2):184–192. | ||
Haussleiter IS, Brüne M, Juckel G. Psychopathology in multiple sclerosis: diagnosis, prevalence and treatment. Ther Adv Neurol Disord. 2009;2(1):13–29. | ||
Aguirre-Cruz L, Flores-Rivera J, De La Cruz-Aguilera DL, Rangel-López E, Corona T. Multiple sclerosis in Caucasians and Latino Americans. Autoimmunity. 2011;44(7):571–575. | ||
Mackenzie IS, Morant SV, Bloomfield GA, MacDonald TM, O’Riordan J. Incidence and prevalence of multiple sclerosis in the UK 1990-2010: a descriptive study in the General Practice Research Database. J Neurol Neurosurg Psychiatry. 2014;85(1):76–84. | ||
Kira J. Multiple sclerosis in the Japanese population. Lancet Neurol. 2003;2(2):117–127. | ||
Hunter SF. Overview and diagnosis of multiple sclerosis. Am J Manag Care. 2016;22(6 Suppl):S141–S150. | ||
Alonso A, Hernán MA. Temporal trends in the incidence of multiple sclerosis: a systematic review. Neurology. 2008;71(2):129–135. | ||
Gupta S, Goren A, Phillips AL, Dangond F, Stewart M. Self-reported severity among patients with multiple sclerosis in the U.S. and its association with health outcomes. Mult Scler Relat Disord. 2014;3(1):78–88. | ||
Kikuchi H, Mifune N, Niino M, et al. Impact and characteristics of quality of life in Japanese patients with multiple sclerosis. Qual Life Res. 2011;20(1):119–131. | ||
Ogino M, Kawachi I, Otake K, et al. Current treatment status and medical cost for multiple sclerosis based on analysis of a Japanese claims database. Clin Exp Neuroimmunol. 2016;7(2):158–167. | ||
Jones E, Pike J, Marshall T, Ye X. Quantifying the relationship between increased disability and health care resource utilization, quality of life, work productivity, health care costs in patients with multiple sclerosis in the US. BMC Health Serv Res. 2016;16:294. | ||
Nohara C, Hase M, Liebert R, Wu N. The burden of multiple sclerosis in Japan. J Med Econ. 2017;20(12):1290–1298. | ||
Kantar Health. National Health and Wellness Survey. Patient-Reported Healthcare Insights. New York: Kantar Health. Available from: http://www.kantarhealth.com/docs/datasheets/kh-national-health-and-wellness-survey.pdf. Accessed October 11, 2018. | ||
WHO Expert Consultation. Appropriate body-mass index for Asian populations and its implications for policy and intervention strategies. Lancet. 2004;363(9403):157–163. | ||
Charlson ME, Pompei P, Ales KL, MacKenzie CR. A new method of classifying prognostic comorbidity in longitudinal studies: development and validation. J Chronic Dis. 1987;40(5):373–383. | ||
Maruish ME. User’s Manual for the SF36v2 Health Survey. 3rd ed. Lincoln: QualityMetric Incorporated; 2011. | ||
Brazier J, Roberts J, Deverill M. The estimation of a preference-based measure of health from the SF-36. J Health Econ. 2002;21(2):271–292. | ||
Walters SJ, Brazier JE. Comparison of the minimally important difference for two health state utility measures: EQ-5D and SF-6D. Qual Life Res. 2005;14(6):1523–1532. | ||
Reilly MC, Zbrozek AS, Dukes EM. The validity and reproducibility of a work productivity and activity impairment instrument. Pharmacoeconomics. 1993;4(5):353–365. | ||
Basic Survey on Wage Structure [homepage on the Internet]. Tokyo: Ministry of Health Labour and Welfare of Japan; 2011. Available from https://www.mhlw.go.jp/english/database/db-l/wage-structure.html. Accessed November 28, 2018. | ||
Basic Survey on Healthcare Costs [homepage on the Internet]. Tokyo: Ministry of Health Labour and Welfare of Japan; 2011. Available from: http://www.mhlw.go.jp/stf/shingi/2r9852000001wj9o-att/2r9852000001wje3.pdf. Accessed September 5, 2017. | ||
2013 Fiscal Year Trends of Medical Expenses [homepage on the Internet]. Tokyo, Japan: Ministry of Health, Labour and Welfare, 2014. Available from: http://www.mhlw.go.jp/topics/medias/c-med/2013/04/index.html. Accessed September 5, 2017. | ||
Oecd-ilibrary.org [homepage on the internet]. Paris: Average length of stay in hospitals. Health at a glance 2011. OECD Indicators, OECD publishing; 2011. Available from: http://dx.doi.org/10.1787/health_glance-2011-33-en. Accessed September 5, 2017. | ||
XE currency table: JPY – Japanese Yen [homepage on the Internet]. Rate as per 2014 Jul 01. Available from: https://www.xe.com/currencytables/?from=JPY&date=2014-07-01. Accessed July 24, 2018. | ||
Ridgeway G, McCaffrey D, Morral A, Burgette L, Griffin BA. Toolkit for Weighting and Analysis of Nonequivalent Groups: A Tutorial for the Twang Package. Santa Monica, CA: RAND Corporation; 2017. | ||
McCaffrey DF, Griffin BA, Almirall D, Slaughter ME, Ramchand R, Burgette LF. A tutorial on propensity score estimation for multiple treatments using generalized boosted models. Stat Med. 2013;32(19):3388–3414. | ||
Campbell JD, Ghushchyan V, Brett Mcqueen R, et al. Burden of multiple sclerosis on direct, indirect costs and quality of life: National US estimates. Mult Scler Relat Disord. 2014;3(2):227–236. | ||
Glanz BI, Dégano IR, Rintell DJ, Chitnis T, Weiner HL, Healy BC. Work productivity in relapsing multiple sclerosis: associations with disability, depression, fatigue, anxiety, cognition, and health-related quality of life. Value Health. 2012;15(8):1029–1035. | ||
Naci H, Fleurence R, Birt J, Duhig A. Economic burden of multiple sclerosis: a systematic review of the literature. Pharmacoeconomics. 2010;28(5):363–379. | ||
Ivanova JI, Birnbaum HG, Samuels S, Davis M, Phillips AL, Meletiche D. The cost of disability and medically related absenteeism among employees with multiple sclerosis in the US. Pharmacoeconomics. 2009;27(8):681–691. | ||
Brook RA, Rajagopalan K, Kleinman NL, Melkonian AK. Absenteeism and health-benefit costs among employees with MS. Curr Med Res Opin. 2009;25(6):1469–1476. | ||
Pohar SL, Jones CA, Warren S, Turpin KV, Warren K. Health status and health care utilization of multiple sclerosis in Canada. Can J Neurol Sci. 2007;34(2):167–174. | ||
Stolp-Smith KA, Atkinson EJ, Campion ME, O’Brien PC, Rodriguez M. Health care utilization in multiple sclerosis: a population-based study in Olmsted County, MN. Neurology. 1998;50(6):1594–1600. | ||
Asche CV, Singer ME, Jhaveri M, Chung H, Miller A. All-cause health care utilization and costs associated with newly diagnosed multiple sclerosis in the United States. J Manag Care Pharm. 2010;16(9):703–712. | ||
Adelman G, Rane SG, Villa KF. The cost burden of multiple sclerosis in the United States: a systematic review of the literature. J Med Econ. 2013;16(5):639–647. | ||
Kobelt G, Berg J, Lindgren P, Fredrikson S, Jönsson B. Costs and quality of life of patients with multiple sclerosis in Europe. J Neurol Neurosurg Psychiatry. 2006;77(8):918–926. | ||
Karabudak R, Karampampa K, Calıs¸kan Z; TRIBUNE Study Group. Treatment experience, burden and unmet needs (TRIBUNE) in MS study: results from Turkey. J Med Econ. 2015;18(1):69–75. | ||
Kobelt G, Thompson A, Berg J, Gannedahl M, Eriksson J; MSCOI Study Group; European Multiple Sclerosis Platform. New insights into the burden and costs of multiple sclerosis in Europe. Mult Scler. 2017;23(8):1123–1136. | ||
Piccolo L, Kumar G, Nakashima I, et al. Multiple sclerosis in Japan appears to be a milder disease compared to the UK. J Neurol. 2015;262(4):831–836. | ||
Strober LB. Personality in multiple sclerosis (MS): impact on health, psychological well-being, coping, and overall quality of life. Psychol Health Med. 2017;22(2):152–161. | ||
Zarbo IR, Minacapelli E, Falautano M, Demontis S, Carpentras G, Pugliatti M. Personality traits predict perceived health-related quality of life in persons with multiple sclerosis. Mult Scler. 2016;22(4):551–558. | ||
Miller A, Dishon S. Health-related quality of life in multiple sclerosis: The impact of disability, gender and employment status. Qual Life Res. 2006;15(2):259–271. | ||
Furnham A, Murao M. A cross-cultural comparison of British and Japanese lay theories of schizophrenia. Int J Soc Psychiatry. 2000;46(1):4–20. | ||
Griffiths KM, Nakane Y, Christensen H, Yoshioka K, Jorm AF, Nakane H. Stigma in response to mental disorders: a comparison of Australia and Japan. BMC Psychiatry. 2006;6:21. | ||
Curhan KB, Sims T, Markus HR, et al. Just how bad negative affect is for your health depends on culture. Psychol Sci. 2014;25(12):2277–2280. |
 © 2019 The Author(s). This work is published and licensed by Dove Medical Press Limited. The full terms of this license are available at https://www.dovepress.com/terms.php and incorporate the Creative Commons Attribution - Non Commercial (unported, v3.0) License.
By accessing the work you hereby accept the Terms. Non-commercial uses of the work are permitted without any further permission from Dove Medical Press Limited, provided the work is properly attributed. For permission for commercial use of this work, please see paragraphs 4.2 and 5 of our Terms.
© 2019 The Author(s). This work is published and licensed by Dove Medical Press Limited. The full terms of this license are available at https://www.dovepress.com/terms.php and incorporate the Creative Commons Attribution - Non Commercial (unported, v3.0) License.
By accessing the work you hereby accept the Terms. Non-commercial uses of the work are permitted without any further permission from Dove Medical Press Limited, provided the work is properly attributed. For permission for commercial use of this work, please see paragraphs 4.2 and 5 of our Terms.