")
Back to Journals » Neuropsychiatric Disease and Treatment » Volume 15
HDAC4 gene silencing alleviates epilepsy by inhibition of GABA in a rat model
Authors Zhang YN, Dong HT, Duan L, Niu L, Yuan GQ, Dai JQ, Hou BR, Pan YW
Received 27 July 2018
Accepted for publication 4 November 2018
Published 4 February 2019 Volume 2019:15 Pages 405—416
DOI https://doi.org/10.2147/NDT.S181669
Checked for plagiarism Yes
Review by Single anonymous peer review
Peer reviewer comments 2
Editor who approved publication: Dr Yuping Ning
Yinian Zhang,1,2,* Hua-Teng Dong,3,* Lei Duan,1,2 Liang Niu,1,2 Guo-Qiang Yuan,1,2 Jun-Qiang Dai,1,2 Bo-Ru Hou,1,2 Ya-Wen Pan1,2
1Department of Neurosurgery and Laboratory of Neurosurgery, Lanzhou University Second Hospital, Lanzhou 730030, People’s Republic of China; 2Institute of Neurology, Lanzhou University, Lanzhou 730030, People’s Republic of China; 3Department of Pediatric Neurology, Gansu Provincial Maternity and Child-Care Hospital, Lanzhou 730050, People’s Republic of China
*These authors contributed equally to this work
Objectives: Despite the availability of effective antiepileptic drugs, epileptic patients still suffer from intractable seizures and adverse events. Better control of both seizures and fewer side effects is needed in order to enhance the patient’s quality of life. We performed the present study with an attempt to explore the effect that HDAC4 gene silencing would have on epilepsy simulated by model rats. Furthermore, the study made additional analysis on the relativity of the HDAC4 gene in regard to its relationship with the gamma-aminobutyric acid (GABA) signaling pathway.
Materials and methods: Tremor rats were prepared in order to establish the epilepsy model. The rats would go on to be treated with si-HDAC4 in order to identify roles of the HDAC4 in levels of GABAARα1, GABAARα4, GAD65, GAT-1, and GAT-3. Finally, both electroencephalogram behavior and cognitive function of the rats following the treatment of si-HDAC4 were observed.
Results: Levels of the GABAARα1 and GABAARα4 showed an evident increase, while GAD65, GAT-1, and GAT-3 displayed a decline in the epilepsy rats treated with the aforementioned si-HDAC4 when compared with the epilepsy rats. After injection of si-HDAC4, the epilepsy rats presented with a reduction in seizure degree, latency and duration of seizure, amount of scattered epileptic waves, and occurrence of epilepsy, with an improvement in their cognitive function.
Conclusion: The study highlighted the role that HDAC4 gene silencing played in easing the cases of epilepsy found in the model rats. This was shown to have occurred through the upregulation of both GABAARα1 and GABAARα4 levels, as well as in the downregulation of GAD65, GAT-1, and GAT-3 levels. The evidence provided shows that the HDAC4 gene is likely to present as a new objective in further experimentation in the treatment of epilepsy.
Keywords: epilepsy, HDAC4, gene silencing, GABA receptor, GABA transporter, seizures
Introduction
Epilepsy is categorized as a brain disorder characterized by an enduring predisposition, usually generating seizures by displaying emotional and cognitive dysfunction which affects ~50 million people worldwide.1–3 Epilepsy is known to exhibit self-limiting abnormal discharge as well as the typical short, episodic, repetitive, and even stereotypical malfunctions relative to the central nervous system (CNS).4 The incidence of epilepsy in the developing nations is significantly higher than that in the developed countries.5 Moreover, the incidence of epilepsy present among males has been shown to be far higher than that among the female populations.6 To date, it has been scientifically confirmed that factors involving genetics, infection, trauma, poisoning, brain abnormalities, and interaction between both underlying genetic factors and the environment all have the potential to lead to epilepsy.7
Gamma-aminobutyric acid (GABA) is acknowledged as an inhibitory neurotransmitter of the CNS in mammals, widely distributed throughout the nervous system.8 Mammalian Gamma-aminobutyric acid receptors (GABARs) are composed of pentameric, ligand-gated ion channels assembled from various (α1–α6, β1–β3, γ1–γ3, δ, π) polypeptide subunits. The α family is the largest of the aforementioned subunits, with six different subtypes contributing significantly to the functional characterization of the GABARs. GABAR α1 is the most widely expressed of all the subtypes, showing a high level of expression in most regions of the brain.9 Several reports have done well to highlight the decrease in the communication of GABA-mediated inhibitory synapses, resulting from an overexcitement of neurons during the process of epilepsy.10 In the synaptic cleft, only GABA transporters (GATs) are able to clear GABA.11 There are four GATs in the brain of a rat: GAT-1, GAT-2, GAT-3, and BGT-1. GAT-1 and GAT-3 are commonly known subtypes and are both particularly and strongly related to incidences of epilepsy.12 Histone deacetylase (HDAC), as a common enzyme family, has been shown to play essential roles in the stabilization of gene transcription.13 This is done through regulating the acetylation levels of histone as well as nonhistone.14 Presently, HDACs are known to be presented in 18 different types of mammals. Furthermore, four categories in particular, among which HDAC2, HDAC3, and HDAC4, have been proven to have a negative regulation effect on nerve growth and development, as well as on their memory cognition.15–17 HDAC4 has produced large expression levels in the brain tissues, while existing predominately in the cytoplasm of neurons, whose cytoplasm location is directly linked with the electrical activity of both the neurons and the phosphorylation of calcium/calmodulin-dependent protein kinase.18 HDAC4 has the ability to travel between the cytoplasm and the nucleus under instruction provided by the specific signals from HDAC4, consisting of a C-terminal binding protein region of N-terminal, myocyte enhancer factor 2 (MEF2) binding region, heterochromatin 1 binding region, and HDAC structural domain of C-terminal.19 HDAC4 gene is capable of protecting the neuron from apoptosis due to its inhibition of the cyclin-dependent kinase.20 Moreover, RNA interference was discovered as a recently developed gene regulating technology, proven to be a useful tool in the further exploration of various gene functions in mammals relating to the degradation of the mRNA of a corresponding sequence.21 Therefore, the central aim during this study was made to explore as well as to evaluate the effects of HDAC4 gene silencing on the epilepsy in rats. Additionally, the relativity of HDAC4 gene silencing in relation to the GABA signaling pathway may act as a new approach in the treatment of epilepsy.
Materials and methods
Ethical statement
During the experiment, feeding, the intake of both material and treatment were conducted in accordance with the relative animal ethical standards of the Guide for the Care and Use of Laboratory Animals published by the Ministry of Science and Technology of the People’s Republic of China in 2006. The experimental process was approved overall by The Experimental Animal Ethics Committee of Lanzhou University Second Hospital.
Subjects
Thirty healthy SD rats provided by the Experiment Animal Center of Lanzhou University Second Hospital were used during the study. Furthermore, a total of 60 tremor rats (TRM rats) found in the genetic epilepsy rat model were introduced by Kyoto University (Japan). TRM rats as well as healthy rats were both male, aged 8–12 months, and weighed between 210 and 250 g. The rats were fed in the second grade animal house at a temperature of 22°C with a contrast of 12-hour light and 12-hour darkness in alternation along with free access to food and water.
WSLP/siRNA injection synthesizing
siRNA was synthesized according to the mRNA sequence of the HDAC4 gene. The siRNA sequences were 3′-GAGACCCAAUGCCAAUGC-5′ and 5′-AGGCAGCGCCAGUACUCA-5′. Water-soluble lipid polymer (WSLP) was synthesized. Three grams of polyethylenimine (PEI) (mw 1,800, Polysciences Company) were added into the mixture containing 10 mL anhydrous dichloromethane and 100 μL triethylamine (Aldrich Chemical), then the mixture was placed on the ice and mixed for 30 minutes. One gram of cholesterol was dissolved in 5 mL frozenly preserved anhydrous dichloromethane, while being subsequently added to the PEI solution slowly in order to dissolve the cholesterol for 30 minutes. The mixture was then stirred over the ice for a period of 12 hours, followed by drying of the product with a rotary evaporator.
The powder was dissolved in a 50 mL 1 mol/L hydrochloric acid followed by filtering with a glass fiber filter. Unreacted cholesteryl chloroformate was dissolved and removed by dichloromethane, ether, and acetone as follows: unreacted cholesteryl chloroformate was removed with a three-time extraction of aqueous solution by 100 mL dichloromethane; the extracted aqueous solution was filtered in a glass fiber filter; following the evaporation of the solvent and concentration of the product, there was a great amount of acetone and concentrated product in the sediment, which was subsequently pumped under the vacuum. The powder was then dissolved in water, with the powder precipitated by acetone three times soon after. Following the washing process with methanol, the product was further washed with ether an additional three times. Matrix-assisted laser desorption-time-of-flight was used in order to analyze the white powder product. Voyager DE STR mass spectrometer (PE Applied Biosystems) was used with anti-4-hydroxy-3-methoxy-cinnamic acid as the auxiliary matrix, showing the cholesterol and mw 1,800 PEI using nuclear magnetic resonance at 400 MHz 1 hour with a molar ratio of 1:1. The final product of WSLP was stored at −20°C for further experimentation. Soon after, the WSLP/siRNA complex was prepared. Prior to using, both WSLP and siRNA were added into the 5% glucose solution by the mass ratio of 7:1 and incubated at room temperature for 30 minutes.
Animal grouping
The WSLP/siRNA complex was prepared with a dose of 3.5 μg of siRNA per rat along with the mass ratio of 7:1. For the si-HDAC4 group, 30 TRM rats were randomly chosen and given an intrathecal injection of WSLP/siRNA. In regard to the epilepsy control, 30 TRM rats were chosen at random and given intrathecal injections of normal saline (NS) to prepare a control group. For the normal control, 30 healthy rats were selected randomly and given intrathecal injections with NS to prepare a control group. Rats in each group were fed in the animal room and given injections twice a week (50 μL for every injection). Ten rats were observed at the 1st, 14th, and 30th day following administration regulations. The rats were observed in order to analyze the incidence of 2-hour administration. The rat seizure latency, seizure duration, and seizure grade were all subsequently recorded.
Reverse transcription quantitative PCR (RT-qPCR)
After setting the administration time, rats in each group were strongly anesthetized, receiving an intraperitoneal injection of 10% chloral hydrate. Then, the rats were swiftly beheaded with their brain carefully removed in order to expose the hippocampus, which were frozen and preserved with a Trizon solution for further use. The RT-qPCR was used to detect the mRNA level of GABAARα1, GABAARα4, GAD65, GAT-1, and GAT-3 (GATs) in the hippocampus tissues of rats in each group. TRIzol was used in order to extract the total RNA in the hippocampus tissues of each group. The OD260/280 value of each extracted RNA sample was detected using an ultraviolet spectrophotometer. The RNA concentration was then subsequently calculated, and the sample was preserved at −80°C. In the reverse transcription PCR system: 20 μL of RNA, 10 μL of diethyl pyrocarbonate-treated water, 10 μL of 5× buffer, 1 μL of RNasin, 3 μL of dNTP, 4 μL of Oligo (Dt) 15, and 2 μL of M-MLV with a total volume of 50 μL. Primer5.0 primer design software was used to design the primer sequences, which were synthesized by Shanghai Sangon Biotech (Shanghai, China). The primer sequences used are shown in Table 1. RT-qPCR reaction conditions were as follows: predenaturation at 95°C for 30 seconds, a cycle of 40 times of denaturation at 95°C for 5 seconds, and annealing/extension for 30 seconds with β-actin used as the internal reference. Ct value of the target gene was compared with the Ct value of β-actin. Finally, the relative mRNA expression of each target gene was calculated with the following formula: ΔCt (target) = Ct (target) − Ct (β-actin) and ΔΔCt = ΔCt (experimental group) − ΔCt (control group); 2−ΔΔCt was used to express the ratio of the relative expression of the target gene to the internal reference gene.
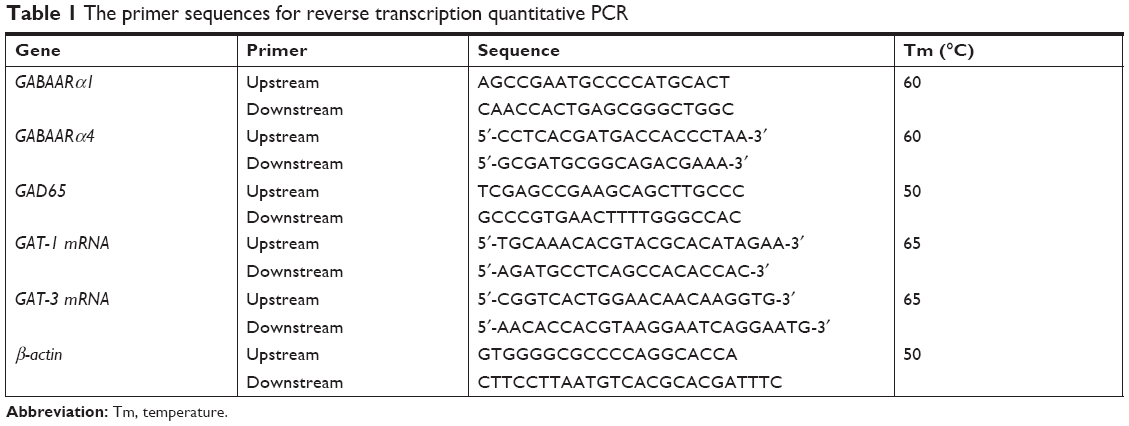 | Table 1 The primer sequences for reverse transcription quantitative PCR |
SABC immunohistochemical staining
After setting up the administration time, the rats were anesthetized and received intraperitoneal injections of 10% chloral hydrate. The chest and abdominal cavity were then cut open in order to expose the viscera. The right auricle was subsequently cut with the needle inserted from the apex all the way to the right with the use of a 45-degree angle at the beginning of the aorta to perfuse 250 mL NS rapidly. Rat perfusion was then rinsed with 250 mL 4% polyformaldehyde until the rat limbs were both rigid and its liver turned white in color, following which the puncture needle was set to be removed. The rat was then beheaded, with the brain removed to strip the hippocampal tissue. The tissue was fixed along with 4% polyformaldehyde and kept overnight at a temperature of 4°C with 30% sucrose solution until the tissue was completely deposited. Continuous coronal sections were obtained using constant cold and frozen sections in the machine with a thickness of ~20 μm and placed in the refrigerator at 4°C. The SABC method (SABC immunohistochemistry kit was purchased from BOSTER Biological Technology Co., Ltd., Wuhan, Hubei, China) was used for an immunohistochemical staining for the detection of GABAARα1, GABAARα4, GAD65, GAT-1, and GAT-3. Then, the 40-well plate was added with 0.01 mol/L PBS (~2/3 of PBS per well), supplemented with a piece of brain slice each well, and rinsed three times (5 minutes/time). The brain slice was treated with 3% H2O2 under conditions void of light for a period of 30 minutes. Subsequently, the brain slice was rinsed three times with 0.01 mol/L PBS (5 minutes/time) and incubated in thermostat for 30 minutes after addition of 5% serum. Then, the brain slice was added with diluted first antibody (1:400), and further incubated in a 37°C thermostat for 2 hours. PBS (0.01 mol/L) was replaced with the first antibody, acting as the negative control. The brain slices were washed three times with 0.01 mol/L PBS (5 minutes/time), added with diluted second antibody (1:400), and incubated in the 37°C thermostat for a total of 90 minutes followed by three times 0.01 mol/L PBS rinses (5 minutes/time). After the third antibody had successfully been prepared (duration of 30 minutes), the mixture was again placed in the 37°C thermostat for 90 minutes and rinsed three times with 0.01 mol/L PBS (5 minutes/time). Then, 0.05% DAB was added to brain slice for a period of 5-minute colorization, followed by the slice being rinsed three times with 0.01 mol/L PBS (5 minutes/time). The slice was bleached and dried using natural air, after which 70%, 80%, 90%, and 95% alcohol solutions were used to complete the dehydration purposes for a period of 5 minutes. Approximately, 100% alcohol I and II were used for 10 minutes, respectively (twice each), and xylene I and II for a period of 30 minutes, respectively, to clear the slice. The slice was mounted by neutral balata, dried, and observed under the microscope.
Western blot analysis
Western blot analysis was applied to detect protein levels of GABAARα1, GABAARα4, GAD65, GAT-1, and GAT-3 in the rat hippocampal tissues. The rat in each group was beheaded, and the hippocampus was separated and ground. Next, the tissues were added with RIPA cell lysis buffer at a ratio of 150 μL/20 mg and centrifuged (4°C) at 25,764 g for 5 minutes with the supernatant collected. Then, the obtained supernatant was transferred into the new Eppendorf tube, and the protein concentration was detected based on the instructions provided by the bicinchoninic acid kit (Wuhan Boster Biological Technology Ltd., Wuhan, Hubei, China). The extracted protein was added with the loading buffer, with 25 μg of protein loaded in each lane to process with SDS-PAGE for the purposes of protein separation at an electrophoretic voltage of 80–120 v using the wet transfer method. The transmembrane voltage was set at 100 mv for 45–70 minutes, and the protein was transferred on to the polyvinylidene fluoride membrane. Then, the membrane was blocked with 5% BSA at room temperature for 1 hour. Subsequently, the membrane was incubated with addition of diluted rabbit antimouse HDAC4, GABAARα1, GABAARα4, GAD65, GAT-1, and GAT-3 antibodies (1:200, Santa Cruz Biotechnology Inc., Santa Cruz, CA, USA) overnight at 4°C. The next day, the membrane was rinsed three times with Tris-buffered saline with Tween 20 for 5 minutes, and further incubated with addition of the second antibody (1:5,000) for 1 hour. Finally, the membrane was washed three times (5 minutes/time), developed with DAB, and photographed with the Bio-Rad gel imaging system. β-actin was used as the internal reference. The images were developed using the GEL DOC EZ IMAGER (Bio-Rad Laboratories Inc., Hercules, CA, USA). The gray value of the target band was analyzed using the ImageJ software.
Epilepsy detection and behavior observation
After each injection, the epilepsy behaviors of the rats in each group were continuously monitored for 2 hours, recording the frequency, average time, and grade of each seizure. The seizure grade was decided according to the Racine standard 17. The seizure was classified into six grades according to the degree of convulsion: grade 0, no seizure; I, rhythmic mouth or facial tic; II, nodding or tail shaking; III, single limb tic; IV, limbs tic or ankylosis; and V, generalized tonic–clonic seizure.
After the preset administration time, two rats in each group were randomly chosen to participate in an electroencephalogram (EEG). The electrode was installed using the methods as follows. The rats were anesthetized by intraperitoneal injections of 350 mg/kg of 10% chloral hydrate, and then the electrode was installed and fixed in the rat’s hippocampus area and frontal cortex. The rats were fastened on the brain stereotaxic apparatus, and the collection electrodes were installed in the hippocampus and cortex acquisition area. The left ear was used as the reference electrode with a unipolar lead. A physiological signal acquisition system was used, and a 5-minute constant EEG of rats in each group was recorded using the EEG-4418K to observe the changes in EEG of the rats in each group.
Morris water maze test
After the preset administration time, six rats from each group were randomly chosen to participate in the Morris water maze test. The water maze was 150 cm in diameter, 50 cm in wall height, 40 cm in depth, and (21–23)°C in temperature. A 10 cm diameter platform 1 cm beneath the water was placed in the center of the target quadrant. Following the adaptation training, the rats were prepared to perform the positioning navigation experiment as follows. The rats were gone into the pool facing toward the wall side with the time needed to find the platform being recorded. If the rats found the platform within 2 minutes, the escape latency was recorded; if the rats did not find the platform within 2 minutes, they were led onto the platform and stayed there for an additional 20 seconds, the escape latency was recorded at 2 minutes. Then, the space search experiment was carried out as follows: after the positioning navigation experiment, the platform was removed and the rat residence time in the target quadrant was recorded.
Statistical analysis
The statistical analyses were conducted using a SPSS18.0 (IBM Corporation, Armonk, NY, USA). The measurement data were expressed using the mean ± SD. Measurement data of normal distribution differences between groups were compared using least significant difference. Comparisons among multiple groups were analyzed using one-way ANOVA. Data of different time points were analyzed by repeated measurement of the ANOVA. The enumeration data were expressed as both percentages and ratios. Chi-squared tests were used. P<0.05 was indicative of a significant statistical difference.
Results
Increased mRNA level of GABAARα1 and GABAARα4 and reduced mRNA level of GAD65, GAT-1, and GAT-3 observed in hippocampus tissues of epilepsy rats treated with si-HDAC4
RT-qPCR and immunohistochemistry were used to detect the mRNA levels of GABAARα1, GABAARα4, GAD65, GAT-1, and GAT-3 specifically in the rat’s hippocampus tissues. As the results depicted in Figure 1, the mRNA levels of GABAARα1 and GABAARα4 in the si-HDAC4 group increased, while those of GAD65, GAT-1, and GAT-3 decreased on the 1st day, 14th day, and 30th day of observation (all P<0.05). The mRNA levels of GABAARα1 and GABAARα4 in the epilepsy group decreased, while those of GAD65, GAT-1, and GAT-3 all increased on the 1st day, 14th day, and 30th day of observation (all P<0.05). No significant changes regarding the mRNA levels of GABAARα1 and GABAARα4 on the 1st day, 14th day, and 30th day were found in the control group (all P>0.05). At the same time, in comparison with the control group, the mRNA levels of GABAARα1 and GABAARα4 in the si-HDAC4 and epilepsy groups significantly decreased, while those of GAD65, GAT-1, and GAT-3 increased (all P<0.05). At the same time, in comparison with the epilepsy group, the mRNA levels of GABAARα1 and GABAARα4 in the si-HDAC4 group exhibited significant increases, while those of GAD65, GAT-1, and GAT-3 all displayed a significant decline (all P<0.05). Altogether, si-HDAC4 enhanced the levels of GABAARα1 and GABAARα4, while reducing the levels of GAD65, GAT-1, and GAT-3 in epilepsy rats.
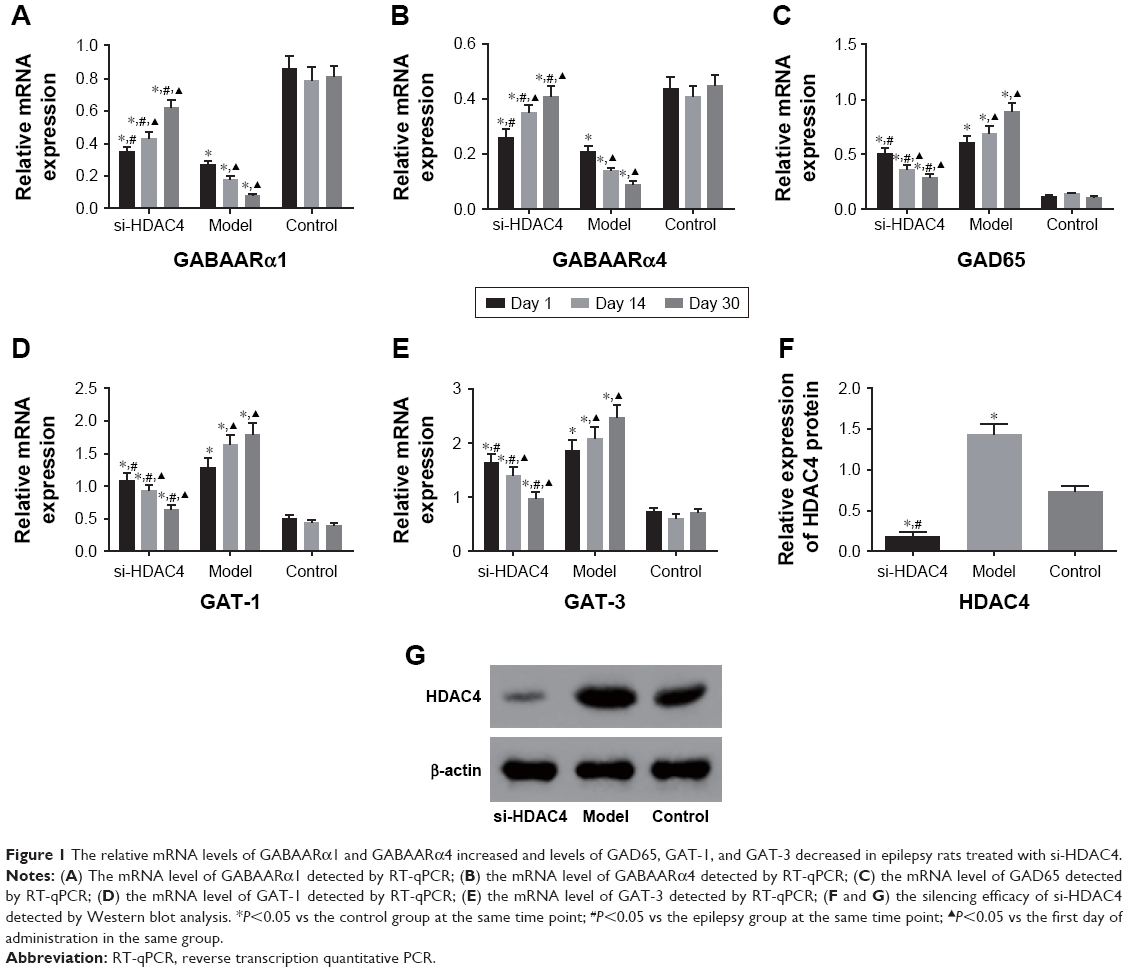 | Figure 1 The relative mRNA levels of GABAARα1 and GABAARα4 increased and levels of GAD65, GAT-1, and GAT-3 decreased in epilepsy rats treated with si-HDAC4. |
Western blot analysis was used with the intent of detecting the protein level of HDAC4 in the hippocampus tissues of rats in each group, and the results are displayed in Figure 1F and G. In comparison with the control group, the level of HDAC4 in the hippocampus tissues of the si-HDAC4 group significantly decreased, while the HDAC4 level in the hippocampus tissues of the epilepsy group markedly increased (P<0.05). In comparison with the epilepsy group, the level of HDAC4 in the hippocampus tissues of the si-HDAC4 group significantly decreased (P<0.05).
Number of positive cells of GABAARα1 and GABAARα4 increase, while positive cells of GAD65, GAT-1, and GAT-3 decrease in the hippocampus tissues of epilepsy rats after treatment of si-HDAC4
The number of positive cells of GABAARα1, GABAARα4, GAD65, GAT-1, and GAT-3 in the rat’s hippocampus tissues at different time point was counted under the microscope (Figure 2). The positive cells of GABAARα1 and GABAARα4 in the si-HDAC4 group definitively increased, while those of GAD65, GAT-1, and GAT-3 decreased on the 1st, the 14th, and the 30th day (all P<0.05). The positive cells of GABAARα1 and GABAARα4 in the epilepsy group showed a noticeable decrease, while the positive cells of the GAD65, GAT-1, and GAT-3 presented with a distinct increase on the 1st, the 14th, and the 30th day (all P<0.05). The positive cells of GABAARα1 and GABAARα4 in the control group showed no significant difference on the 1st, the 14th, and the 30th day (all P>0.05). At the same time, in comparison with the control group, the positive cells of GABAARα1 and GABAARα4 in the epilepsy group displayed a significant decline, while those of GAD65, GAT-1, and GAT-3 showed an evident increase (all P<0.05). The number of positive cells of GABAARα1 and GABAARα4 in the si-HDAC4 group significantly decreased, while those of GAD65, GAT-1, and GAT-3 all increased on the 1st day and the 14th day compared with the control group (all P<0.05). The positive cells of GABAARα1, GAD65, GAT-1, and GAT-3 in the si-HDAC4 group showed no significant difference on the 30th day compared with the control group (all P>0.05). At the same time, in comparison with the epilepsy group, the positive cells of GABAARα1 in the si-HDAC4 group significantly increased, while those of GAD65, GAT-1, and GAT-3 notably decreased (all P<0.05). Based on the aforementioned results, the HDAC4 gene silencing was shown to increase the number of positive cells for both GABAARα1 and GABAARα4, while reducing the number of positive cells for GAD65, GAT-1, and GAT-3 in rats with epilepsy.
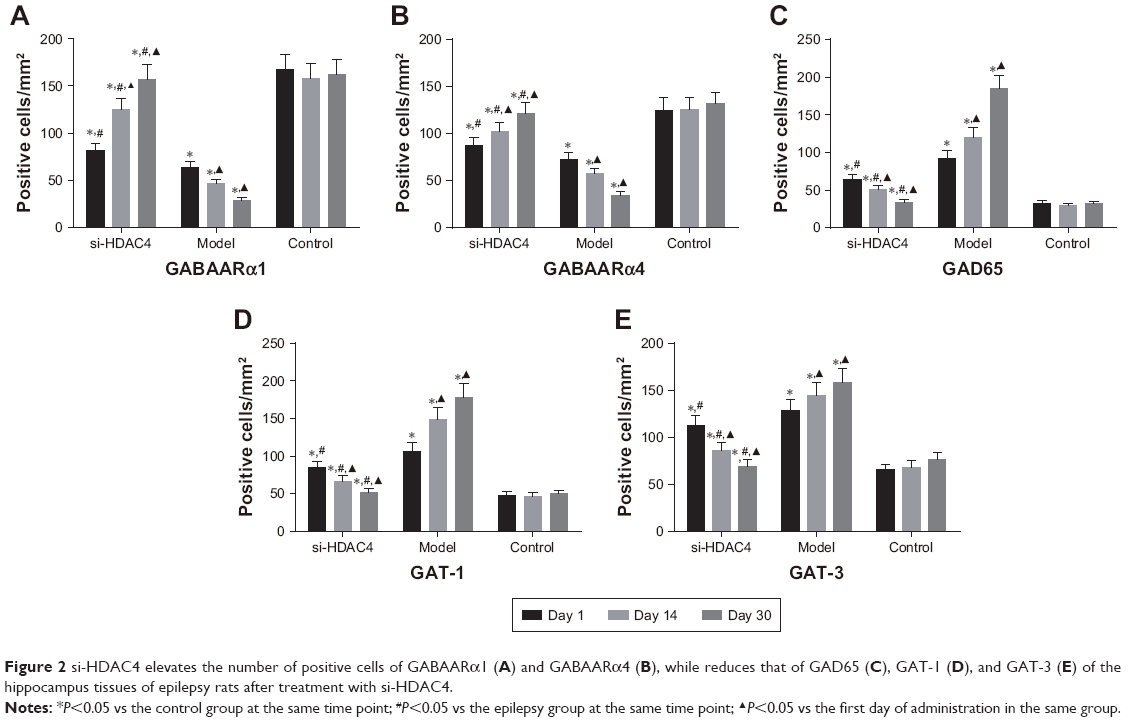 | Figure 2 si-HDAC4 elevates the number of positive cells of GABAARα1 (A) and GABAARα4 (B), while reduces that of GAD65 (C), GAT-1 (D), and GAT-3 (E) of the hippocampus tissues of epilepsy rats after treatment with si-HDAC4. |
Protein levels of GABAARα1 and GABAARα4 are elevated, while protein levels of GAD65, GAT-1, and GAT-3 are decreased in the hippocampus tissues of epilepsy rats after treatment with si-HDAC4
Subsequently, the relative protein levels of GABAARα1, GABAARα4, GAD65, GAT-1, and GAT-3 in the rat’s hippocampus tissues at different time points were all collectively detected by Western blot analysis, with the results presented in Figure 3. The relative protein levels of both GABAARα1 and GABAARα4 in the si-HDAC4 group increased, while the protein levels associated with GAD65, GAT-1, and GAT-3 all decreased on the 1st day, 14th day, and 30th day (all P<0.05). The relative protein levels for GABAARα1 and GABAARα4 in the epilepsy group had decreased, while the same of the GAD65, GAT-1, and GAT-3 increased on the 1st day, 14th day, and 30th day (all P<0.05). The relative protein levels of hippocampus tissues in the control group showed no significant differences on the 1st day, the 14th day, and the 30th day (all P>0.05). At the same time, in comparison with the control group, the relative protein levels of both GABAARα1 and GABAARα4 in the epilepsy group showed significant decline, while the same subject of the GAD65, GAT-1, and GAT-3 all presented with an increase (all P<0.05). Relative protein levels of GABAARα1 and GABAARα4 in the si-HDAC4 group both significantly decreased, while those of GAD65, GAT-1, and GAT-3 increased on the 1st day and 14th day (all P<0.05). The relative protein levels of GABAARα1 and GAD65, as well as the GAT-1 and GAT-3 in the si-HDAC4 group and the control group showed no significant difference on the 30th day of observation (all P>0.05). At the same time, in comparison with the epilepsy group, the relative protein levels of GABAARα1 and GABAARα4 in the si-HDAC4 group significantly increased, while those of the GAD65, GAT-1, and GAT-3 all decreased (all P<0.05). According to the results, we came to the conclusion that HDAC4 silencing could enhance the protein levels of both GABAARα1 and GABAARα4, while decreasing the protein level of GAD65, GAT-1, and GAT-3 in rats with epilepsy.
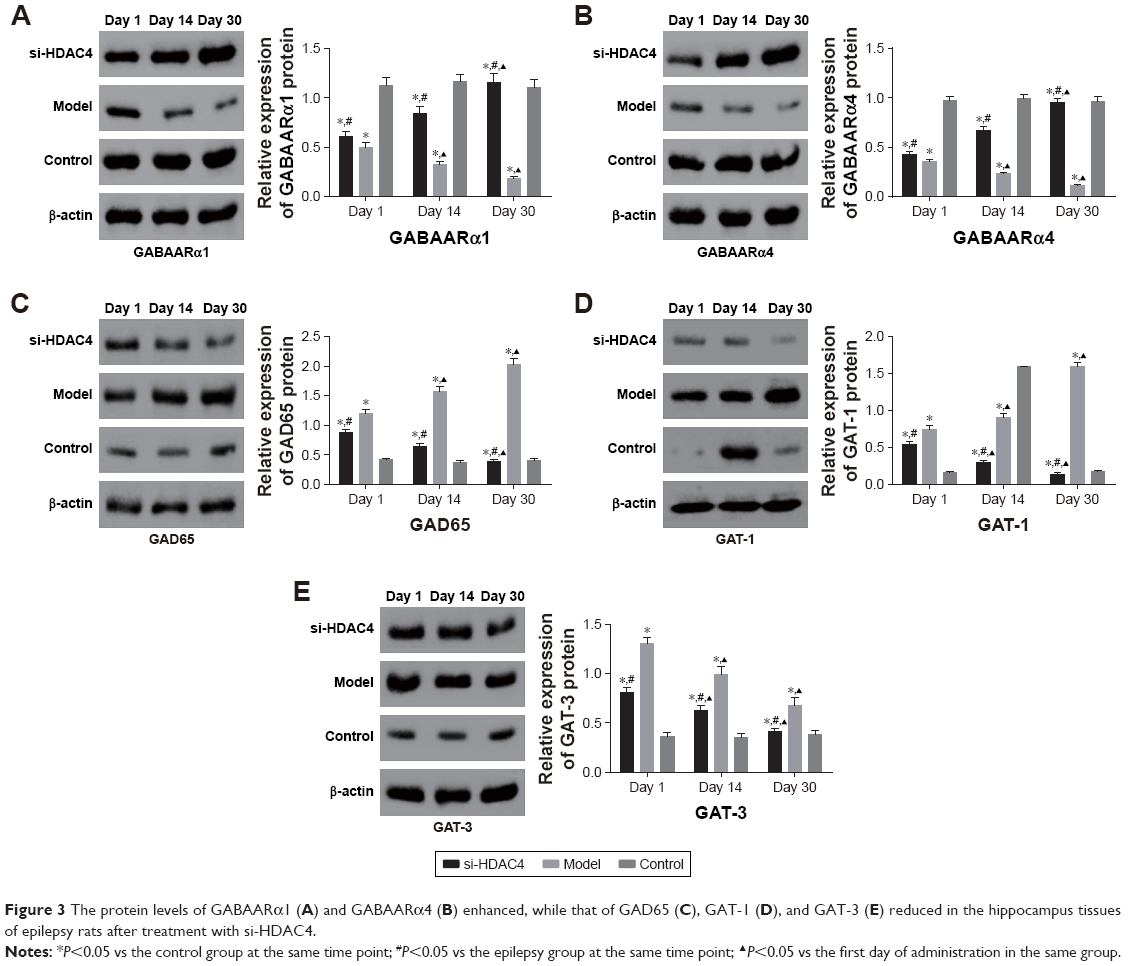 | Figure 3 The protein levels of GABAARα1 (A) and GABAARα4 (B) enhanced, while that of GAD65 (C), GAT-1 (D), and GAT-3 (E) reduced in the hippocampus tissues of epilepsy rats after treatment with si-HDAC4. |
Silence of HDAC4 inhibits epilepsy
Finally, the EEG of the rats and behavior observation were conducted to identify roles of HDAC4 in the occurrence of epilepsy. The EEG of the rats in each group is shown in Figure 4. In the control group, the EEG of rats mainly presented with α wave or β wave, and the basic wave slightly scattered within θ wave with no obvious rhythm. In the si-HDAC4 group and the epilepsy group, the EEG of rats displayed a large amount of scattered epileptic waves, mainly high spike waves, spike waves, and slow spike colligation waves together with a large number of epileptic discharges. In comparison with the epilepsy group, the rats in the si-HDAC4 displayed a reduced number of scattered epileptic waves.
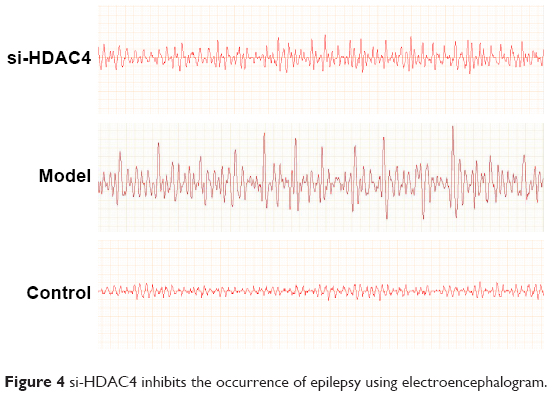 | Figure 4 si-HDAC4 inhibits the occurrence of epilepsy using electroencephalogram. |
The behavior observation results of the epileptic rats are presented in Table 2. In the si-HDAC4 group and the epilepsy group, rats exhibited skeletal muscle tremors, nodding, and frequent chewing; in the control group, rats showed no epilepsy. Following this, the rats were flipped to the left, displaying epileptic limb symptoms as well as a tail rigidity for ~2–5 hours. During the seizure phase, the seizure symptoms disappeared. Nonetheless, the rats appeared to be easily irritated, while displaying strong notions of aggressive behavior. At the same time, compared with the epilepsy group, on the 30th day of administration, the latency period and seizure duration of rats in the si-HDAC4 group showed a reduction in the rate, grade, and frequency of seizure (P<0.05). In the same group, but at different time points, in comparison with the 1st day of administration, the rats showed no significant differences on the 14th day; on the 30th day, the latency period and seizure duration of rats had shortened. Additionally, the grade and frequency of seizure also shortened (P<0.05). Collectively, these aforementioned findings revealed that silencing HDAC4 could inhibit the occurrence of epilepsy.
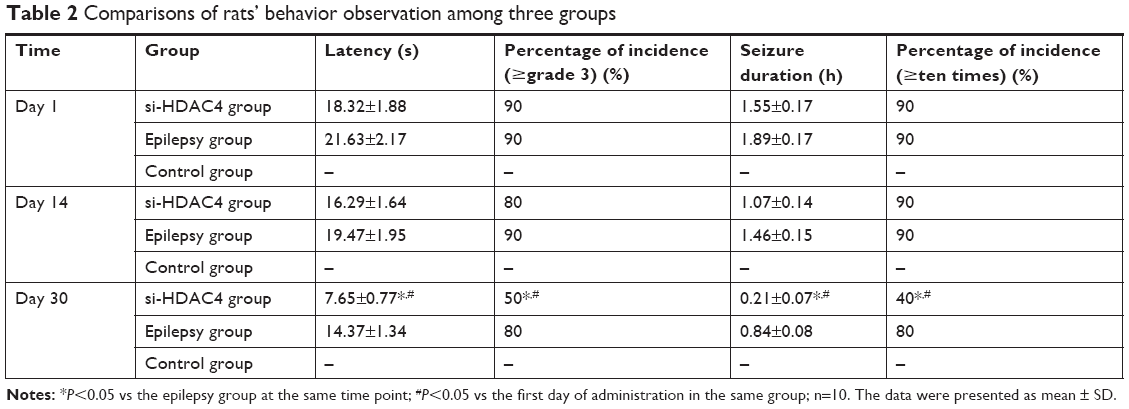 | Table 2 Comparisons of rats’ behavior observation among three groups |
Silence of HDAC4 promotes cognitive function
Morris water maze test was used in order to detect the cognitive ability of rats in each group, with the results shown in Figure 5. In comparison with the control group, the escape latency of the epileptic rats in the si-HDAC4 group decreased, with the time spent in the target quadrant increasing successfully on the 1st day, 14th day, and 30th day (P<0.05); both the model group and the control group showed no significant differences in the escape latency as well as the time spent in the target quadrant on the 1st day, 14th day, and 30th day (all P>0.05). At the same time, in comparison with the control group, the escape latency of the epilepsy group significantly increased (P<0.05), while the time spent in the target quadrant significantly reduced (P<0.05); at the same time, in comparison with the epilepsy group, the escape latency of the si-HDAC4 group significantly decreased (P<0.05), with the time spent in the target quadrant becoming significantly enhanced (P<0.05).
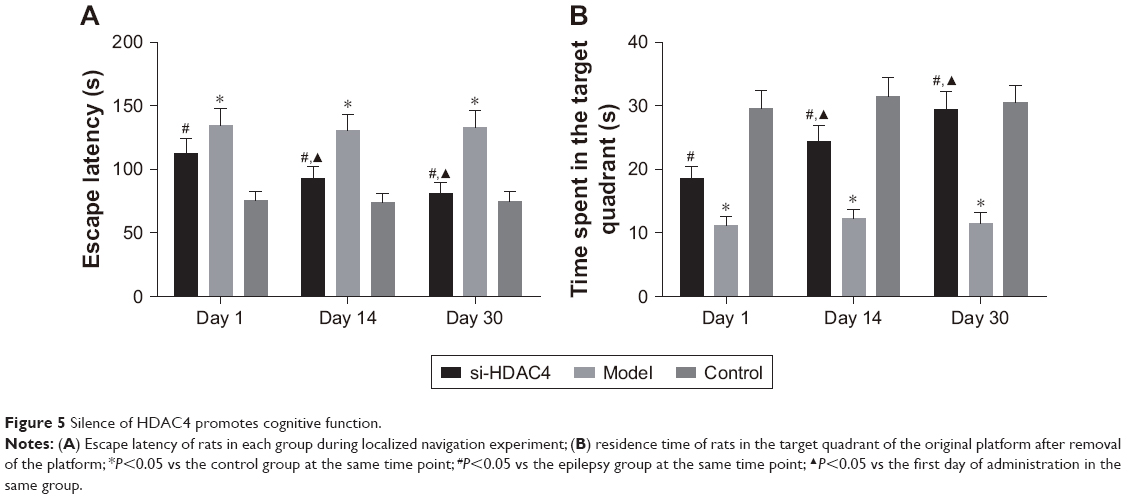 | Figure 5 Silence of HDAC4 promotes cognitive function. |
Discussion
In accordance with the current research, various types of diseases have been highlighted with different expression of HDAC. HDAC has been shown to play a key role in many attempts to cure disease. RNA interference has also been shown to be a powerful research tool, as well as the siRNA inhibiting endogenous gene and exogenous gene expressions in mammal cells.22 During this study, it had also been discovered that the HDAC4 gene silencing played a role in providing relief in the seizures experienced by the subject epileptic rats. Upregulation of GABAARα1 and GABAARα4, while downregulation of GAD65, GAT-1, and GAT-3 in epileptic rats allowed us to come to the idea that HDAC4 is likely to become a new therapeutic target in the treatment of epilepsy.
The GABAA receptor is known as an inhibitory neurotransmitter receptor closely related to epilepsy within the CNS; α1 and α4 are important among GABAAR subunits, which are widely distributed in neurons of normal brain tissues such as the hippocampus, cortex, and thalamus.23,24 Expressions of GABAAR, GABAARα1, and GABAARα4 were found in the brain tissues of the epileptic rats and especially decreased in the hippocampal formation.25 HDAC is a chromatin modifying factor, affecting the growth of nerves by regulating the transcription factor and controlling the related expressions of its downstream function genes.26 CREB is an important transcription factor regulating nerve’s growth.27 Evidentiary data have indicated that HDAC regulates the plasticity of memory and synapse negatively through CREB.27 Through CREB’s original response of luciferase reporter gene, it has been discovered that the transfer of HDAC4 into the nucleus directly inhibits transcriptional activity of CREB.28 HDAC4, in the process of regulating gene expression, does not only inhibit gene expression through histone deacetylation but also controls the transfection factor’s function through its binding with the transfection factors.29 In muscle tissues and bones, HDAC4 can bind with MEF2 in the nucleus to inhibit the MEF2 activity, inhibiting the differentiation of muscles and bones.30 Moreover, HDAC4 can also bind with MEF2 and CREB and inhibit their expressions to lead to neuronal death.31 In 2006, Payne et al discovered that the abnormal expression of GABA α1 receptor could lead to an epileptic-like abnormal discharge in mice, providing evidence that the GABA α1 receptor is closely linked to the discharge induced by an abnormal excitation of neurons.32 Mao et al further demonstrated the role of GABA α1 receptor in abnormal discharge of hippocampal neurons in 2010.33 Therefore, it can be deduced that the reason for the increasing of GABAARα1 and GABAARα4 expressions lies within the idea that HDAC4 gene silencing improves the nerve electrophysiological function of cortex as well as the hippocampus by increasing collectively the GABAARα1 and GABAARα4 expressions, while decreasing excitability of the nervous system, and furthermore, by inhibiting high-frequency discharges of neurons to further inhibit epilepsy.
RT-qPCR results also showed us that the mRNA levels of GAD65, GAT-1, and GAT-3 in epilepsy rats treated with silenced HDAC4 significantly downregulated, which was proven once again by the Western blot analysis. GAD as a rate-limiting enzyme synthesized by GABA can affect GABA content in the brain. The content of the GAD is similar to that of the GABA neurons, with GAD frequently used as a direct marker for the GABA neurons.34 It has been displayed that epilepsy can lead to GAD changes in the brain and as a result of these changes, a decrease in the overall expression of GAD.35 These findings are parallel with the results achieved throughout our study noting that HDAC4 can suppress epilepsy seizures of rats by decreasing GAD65 expressions. One study has shown that an increased GAT-1 expression after epileptic seizures is an important etiological link in the process of epileptic disease, the increase of GAT-1, so that more GABA is cleared out of the intercellular space, neural network inhibition function is further weakened, and the epileptic symptoms become aggravated.36 Furthermore, a study conducted by Pirttimaki et al reported that GAT-1 and GAT-3 expressions were decreased following an episode of epilepsy, potentially due to a reactive change in the organism that decreased the intake in the transport of GABA as well as inhibited the discharge generalization of the neurons to inhibit the seizure of epilepsy.37 Mattiske et al analyzed the differentially expressed genes of ARX mutant mice and normal mice by RNAseq, finding that the transcriptional regulators such as HDAC4 may be closely related to epilepsy.38 It has also been reported that loss of the putative catalytic domain of HDAC4 may lead to a reduced thermal nociception and seizures.39 To sum this all up, HDAC4 gene silencing can inhibit both GAT-1 and GAT-3, thereby downregulating the expressions of both GAT-1 and GAT-3 in the brain. In addition, HDAC4 silencing can cause a reduction in the intake and transport of GABA, potentially increasing the concentration of GABA in the brain synaptic space, thus indicating its antiepileptic function.
Conclusion
In conclusion, this study has demonstrated that the HDAC4 gene silencing could reduce seizure degree, latency, duration of seizure, the amount of scattered epileptic waves, and occurrence of epilepsy. In addition, HDAC4 gene silencing provided a superior controlling mechanism in regard to the outbreak of epilepsy in rats. This controlling is essentially a product of the upregulation of GABAARα1 and GABAARα4 expressions along with the downregulation of GAD65, GAT-1, and GAT-3 expressions. However, the detailed mechanism still needs more exploration, which will be taken care of in further experiments.
Acknowledgments
This study was supported by the Fundamental Research Funds for the Central Universities (lzujbky-2018-60), Gansu Provincial Innovation and Entrepreneurship Project of Longyuan Youth Talents, Cuiying Scientific and Technological Innovation Program of Lanzhou University Second Hospital (CY2017-MS04), and The Counterpart Funds of Lanzhou University Second Hospital. The authors would like to acknowledge the reviewers for their helpful comments on this paper.
Disclosure
The authors report no conflicts of interest in this work.
References
Duncan JS, Sander JW, Sisodiya SM, Walker MC. Adult epilepsy. Lancet. 2006;367(9516):1087–1100. | ||
Vezzani A, French J, Bartfai T, Baram TZ. The role of inflammation in epilepsy. Nat Rev Neurol. 2011;7(1):31–40. | ||
Zhang Y, Seeburg DP, Pulli B, et al. Myeloperoxidase nuclear imaging for epileptogenesis. Radiology. 2016;278(3):822–830. | ||
Vezzani A, Fujinami RS, White HS, et al. Infections, inflammation and epilepsy. Acta Neuropathol. 2016;131(2):211–234. | ||
Newton CR, Garcia HH. Epilepsy in poor regions of the world. Lancet. 2012;380(9848):1193–1201. | ||
Gu L, Liang B, Chen Q, et al. Prevalence of epilepsy in the People’s Republic of China: a systematic review. Epilepsy Res. 2013;105(1–2):195–205. | ||
Guerrini R, Marini C, Mantegazza M. Genetic epilepsy syndromes without structural brain abnormalities: clinical features and experimental models. Neurotherapeutics. 2014;11(2):269–285. | ||
Li Z, An SC, Li JN. [The interaction between gamma-aminobutyric acid and other related neurotransmitters in depression]. Sheng Li Ke Xue Jin Zhan. 2014;45(3):190–194. Chinese. | ||
McKernan RM, Whiting PJ. Which GABAA-receptor subtypes really occur in the brain? Trends Neurosci. 1996;19(4):139–143. | ||
Wan L, Liu X, Wu Z, et al. Activation of extrasynaptic GABA(A) receptors inhibits cyclothiazide-induced epileptiform activity in hippocampal CA1 neurons. Neurosci Bull. 2014;30(5):866–876. | ||
Kragholm B, Kvist T, Madsen KK, et al. Discovery of a subtype selective inhibitor of the human betaine/GABA transporter 1 (BGT-1) with a non-competitive pharmacological profile. Biochem Pharmacol. 2013;86(4):521–528. | ||
Lehre AC, Rowley NM, Zhou Y, et al. Deletion of the betaine-GABA transporter (BGT1; slc6a12) gene does not affect seizure thresholds of adult mice. Epilepsy Res. 2011;95(1–2):70–81. | ||
Yanuar A, Azminah EY, Andika EY, Erlina L, Syahdi RR. In silico approach to finding new active compounds from histone deacetylase (HDAC) family. Curr Pharm Des. 2016;22(23):3488–3497. | ||
Tryba M. Death on the table during implantation of a hip prosthesis – a neglected peroperative risk? Reg Anaesth. 1989;12(6):107–109. | ||
Jung KH, Noh JH, Kim JK, et al. HDAC2 overexpression confers oncogenic potential to human lung cancer cells by deregulating expression of apoptosis and cell cycle proteins. J Cell Biochem. 2012;113(6):2167–2177. | ||
Sando R 3rd, Gounko N, Pieraut S, Liao L, Yates J 3rd, Maximov A. HDAC4 governs a transcriptional program essential for synaptic plasticity and memory. Cell. 2012;151(4):821–834. | ||
Park D, Park H, Kim Y, Kim H, Jeoung D. HDAC3 acts as a negative regulator of angiogenesis. BMB Rep. 2014;47(4):227–232. | ||
Cohen TJ, Choi MC, Kapur M, Lira VA, Yan Z, Yao TP. HDAC4 regulates muscle fiber type-specific gene expression programs. Mol Cells. 2015;38(4):343–348. | ||
Fitzsimons HL. The Class IIa histone deacetylase HDAC4 and neuronal function: Nuclear nuisance and cytoplasmic stalwart? Neurobiol Learn Mem. 2015;123:149–158. | ||
Zeng LS, Yang XZ, Wen YF, et al. Overexpressed HDAC4 is associated with poor survival and promotes tumor progression in esophageal carcinoma. Aging (Albany NY). 2016;8(6):1236–1248. | ||
Li Z, Rana TM. Molecular mechanisms of RNA-triggered gene silencing machineries. Acc Chem Res. 2012;45(7):1122–1131. | ||
Sun J, Li X, Feng P, et al. RNAi-mediated silencing of fungal acuD gene attenuates the virulence of Penicillium marneffei. Med Mycol. 2014;52(2):167–178. | ||
Lund IV, Hu Y, Russek SJ, Brooks-Kayal AR. GABA | mechanisms of GABA A receptor gene regulation in epilepsy. In: Schwartzkroin P, editor. Encyclopedia of Basic Epilepsy Research. 1st ed. Cambridge, MA: Academic Press; 2009:294–298. | ||
Lévi S, Le Roux N, Eugène E, Poncer JC. Benzodiazepine ligands rapidly influence GABAA receptor diffusion and clustering at hippocampal inhibitory synapses. Neuropharmacology. 2015;88:199–208. | ||
Mao X, Ma P, Cao D, et al. Altered expression of GABAA receptors (α4, γ2 subunit), potassium chloride cotransporter 2 and astrogliosis in tremor rat hippocampus. Brain Res Bull. 2011;86(5–6):373–379. | ||
Chen W, Sheng P, Huang Z, et al. MicroRNA-381 regulates chondrocyte hypertrophy by inhibiting histone deacetylase 4 expression. Int J Mol Sci. 2016;17(9):1377. | ||
Zhou Z, Wang R, Yang X, et al. The cAMP-responsive element binding protein (CREB) transcription factor regulates furin expression during human trophoblast syncytialization. Placenta. 2014;35(11):907–918. | ||
Zhao Z, Fan L, Fortress AM, Boulware MI, Frick KM. Hippocampal histone acetylation regulates object recognition and the estradiol-induced enhancement of object recognition. J Neurosci. 2012;32(7):2344–2351. | ||
Choi MC, Cohen TJ, Barrientos T, et al. A direct HDAC4-MAP kinase crosstalk activates muscle atrophy program. Mol Cell. 2012;47(1):122–132. | ||
Backs J, Worst BC, Lehmann LH, et al. Selective repression of MEF2 activity by PKA-dependent proteolysis of HDAC4. J Cell Biol. 2011;195(3):403–415. | ||
Schwartz S, Truglio M, Scott MJ, Fitzsimons HL. Long-term memory in drosophila is influenced by histone deacetylase HDAC4 interacting with SUMO-conjugating enzyme Ubc9. Genetics. 2016;203(3):1249–1264. | ||
Payne HL, Donoghue PS, Connelly WM, et al. Aberrant GABA(A) receptor expression in the dentate gyrus of the epileptic mutant mouse stargazer. J Neurosci. 2006;26(33):8600–8608. | ||
Mao X, Guo F, Yu J, et al. Up-regulation of GABA transporters and GABA(A) receptor α1 subunit in tremor rat hippocampus. Neurosci Lett. 2010;486(3):150–155. | ||
Liimatainen S, Peltola J. Epilepsy associated with glutamic acid decarboxylase antibody (GADA). Eur J Neurol. 2012;19(6):799. | ||
Stagg CJ, Lang B, Best JG, et al. Autoantibodies to glutamic acid decarboxylase in patients with epilepsy are associated with low cortical GABA levels. Epilepsia. 2010;51(9):1898–1901. | ||
Malarkey EB, Parpura V. Mechanisms of glutamate release from astrocytes. Neurochem Int. 2008;52(1–2):142–154. | ||
Pirttimaki T, Parri HR, Crunelli V. Astrocytic GABA transporter GAT-1 dysfunction in experimental absence seizures. J Physiol. 2013;591(4):823–833. | ||
Mattiske T, Lee K, Gecz J, Friocourt G, Shoubridge C. Embryonic forebrain transcriptome of mice with polyalanine expansion mutations in the ARX homeobox gene. Hum Mol Genet. 2016;25(24):5433–5443. | ||
Rajan I, Savelieva KV, Ye GL, et al. Loss of the putative catalytic domain of HDAC4 leads to reduced thermal nociception and seizures while allowing normal bone development. PLoS One. 2009;4(8):e6612. |
 © 2019 The Author(s). This work is published and licensed by Dove Medical Press Limited. The full terms of this license are available at https://www.dovepress.com/terms.php and incorporate the Creative Commons Attribution - Non Commercial (unported, v3.0) License.
By accessing the work you hereby accept the Terms. Non-commercial uses of the work are permitted without any further permission from Dove Medical Press Limited, provided the work is properly attributed. For permission for commercial use of this work, please see paragraphs 4.2 and 5 of our Terms.
© 2019 The Author(s). This work is published and licensed by Dove Medical Press Limited. The full terms of this license are available at https://www.dovepress.com/terms.php and incorporate the Creative Commons Attribution - Non Commercial (unported, v3.0) License.
By accessing the work you hereby accept the Terms. Non-commercial uses of the work are permitted without any further permission from Dove Medical Press Limited, provided the work is properly attributed. For permission for commercial use of this work, please see paragraphs 4.2 and 5 of our Terms.