")
Back to Journals » OncoTargets and Therapy » Volume 13
HBXIP Regulates Gastric Cancer Glucose Metabolism and Malignancy Through PI3K/AKT and p53 Signaling
Authors Qiu L , Lu F, Zhang L, Wang G, Geng R, Miao Y
Received 21 December 2019
Accepted for publication 30 March 2020
Published 21 April 2020 Volume 2020:13 Pages 3359—3374
DOI https://doi.org/10.2147/OTT.S243250
Checked for plagiarism Yes
Review by Single anonymous peer review
Peer reviewer comments 2
Editor who approved publication: Dr Leo Jen-Liang Su
Lei Qiu,1,* Feng Lu,1,* Lili Zhang,2,* Gang Wang,1 Rui Geng,3 Yongchang Miao1
1Department of General Surgery, The Second People’s Hospital of Lianyungang, Lianyungang, Jiangsu, People’s Republic of China; 2Emergency Department, The Second People’s Hospital of Lianyungang, Lianyungang, Jiangsu, People’s Republic of China; 3School of Public Health, Nanjing Medical University, Nanjing, Jiangsu, People’s Republic of China
*These authors contributed equally to this work
Correspondence: Yongchang Miao Email [email protected]
Introduction: Hepatitis B X-interacting protein (HBXIP) overexpression is related to the progression of multiple cancers. However, its role in gastric cancer (GC) remains unclear.
Materials and Methods: HBXIP expression was determined in human GC specimens and cell lines by quantitative polymerase chain reaction (qRT-PCR) and Western blot. The effects of HBXIP depletion or ectopic expression on GC proliferation were evaluated in vitro using the cell counting kit-8 (CCK-8), 5-ethynyl-2ʹ-deoxyuridine (EdU) incorporation, colony formation, and cell cycle assays. The in vivo effects were investigated using a mouse xenograft model. Apoptosis was evaluated by flow cytometry (in vitro) and immunohistochemistry (IHC; in vivo). Cell migration and invasion were evaluated in vitro using wound healing, transwell migration, and matrigel invasion assays; and in vivo by quantifying distant metastases from injection of GC cells in the lateral tail vein.
Results: Herein, we reported that HBXIP expression was higher in GC than in normal tissues, and this high expression indicated a poorer prognosis. Gain- and loss-of-function assays showed that HBXIP promoted GC proliferation, migration, and invasion, and inhibited apoptosis. High-performance liquid chromatography (HPLC) quantification of glycolytic metabolites revealed that HBXIP promoted glucose metabolic reprogramming. Investigation of the PI3K/AKT and p53 pathways highlighted their role in this HBXIP-mediated metabolic reprogramming.
Conclusion: Our results indicate that the up-regulation of HBXIP leads to GC progression by positively regulating glucose metabolism. Therefore, HBXIP is a potential target for the treatment of GC.
Keywords: HBXIP, glucose metabolism, PI3K/AKT, p53, gastric cancer
Introduction
Gastric cancer (GC) remains one of the most lethal cancers in the world. Although significant advances have been made in the treatment of GC, the long-term outcomes for GC patients remain unsatisfactory. The 5-year survival rate for patients with advanced GC remains poor.1–4 Therefore, there is an urgent requirement for investigations that may identify the molecular mechanisms important for GC development and progression, and that may lead to the development of novel therapeutic modalities.
The hepatitis B X-interacting protein (HBXIP) is a conserved ~18 kDa protein that interacts with the C-terminus of the hepatitis B virus X protein.5–7 HBXIP is overexpressed in several malignancies and plays a vital role in regulating cell proliferation, apoptosis, and cell division.8 Nonetheless, the role of HBXIP in GC progression is unclear.
Glucose metabolic reprogramming is very common in a variety of cancers. Cancer cells proliferate very rapidly, and therefore, they produce more energy by glycolysis for macromolecular synthesis.9–12 Otto Warburg reported that cancer cells tend to favor aerobic glycolysis than oxidative phosphorylation (OXPHOS) to generate energy. This is known as the Warburg effect.13–17 Recently, several reports suggested that HBXIP was involved in the reprogramming of glucose metabolism. HBXIP promoted the proliferation of hepatocellular carcinoma cells by suppressing gluconeogenesis.18 In breast cancer, HBXIP’s suppression of the synthesis of cytochrome C oxidase 2 (SCO2) and pyruvate dehydrogenase E1 alpha 1 (PDHA1) expressions promoted glucose metabolic reprogramming.19 However, our understanding of the role of HBXIP in glucose metabolic reprogramming is insufficient. Furthermore, its role in GC progression has not been studied.
It has been shown that the activation of oncogenes, signaling pathways, and transcription factors, as well as the inactivation of tumor suppressors, induce the Warburg effect in cancer cells.20 Noticeably, the phosphoinositide-3-kinase/protein kinase B (PI3K/AKT) pathway plays a crucial role in many processes involved in glucose metabolism.21 Moreover, the tumor suppressor protein p53 can bind to glucose-6-phosphate dehydrogenase (G6PD) and block its dimerization and activity, thereby suppressing the pentose phosphate pathway (PPP). A recent study has also reported that p53 dysfunction could contribute to the Warburg effect.22
Therefore, we explored the function of HBXIP in GC. In our study, we found that HBXIP overexpression promoted GC progression, potentially by regulating glucose metabolism via the PI3K/AKT and the p53 signaling pathways.
Materials and Methods
Tissue Samples
Paired GC and corresponding adjacent non-tumor tissues were obtained from 100 patients who had radical gastrectomy at The Second People’s Hospital of Lianyungang, Jiangsu, China. Patient consent was acquired before specimen collection. After collection, tissues were frozen and preserved in liquid nitrogen.
Cell Culture
All cell lines were procured from the Chinese Academy of Sciences (Shanghai, China), cultured in the RPMI-1640 medium containing 10% fetal bovine serum (FBS; Gibco, USA) and incubated in a humidified atmosphere under 5% CO2 at 37°C.
Quantitative Real-Time Polymerase Chain Reaction (qRT-PCR)
Total RNA was extracted using the TRIzol reagent (Invitrogen), and cDNA was synthesized using the PrimeScript RT Reagent (TaKaRa Bio). qRT-PCR was carried out on the 7500 Real-time PCR System. The specific primers used were as follows: HBXIP forward 5ʹ-GAGCCCAAGCCTTCGTCAG-3ʹ and reverse 5ʹ-GGCACGTCCTTCTCCACCA-3ʹ; β-actin forward 5ʹ-GCATCGTCACCAACTGGGAC-3ʹ and reverse 5ʹ-ACCTGGCCGTCAGGCAGCTC-3ʹ.
Cell Transfection
Vectors for the up- and down-regulation of HBXIP using the lentiviral gene transfer system were purchased from Genepharma (Shanghai, China). Stable cell lines were established by puromycin (6 μg/mL; Sigma-Aldrich, USA) selection of transduced GC cells.
Cell Counting Kit-8 (CCK-8) Assays
Cells were seeded into 96-well plates at 2000 cells/well and cultured in 100 µL/well RPMI 1640 (10% FBS) for five days. CCK-8 solution (10 µL) was then added, and the plates were incubated for 2 h at 37°C. To measure proliferation, the plates were read at 450 nm optical density (OD).
Colony Formation Assay
Cells were seeded at 500 cells/well in 6-well plates and cultured in 2 mL RMPI-1640 medium (10% FBS). After three weeks, GC cells were stained using crystal violet for 20 min, and the numbers of colonies containing more than 50 cells were counted.
5-Ethynyl-2ʹ-Deoxyuridine (EdU) Assay
The EdU assay was performed according to the manufacturer’s instructions. In brief, cells were treated with 50 µM EdU, and 400 μL of the ApolloR reaction cocktail was added to fluorescently-label EdU. Hoechest33342 (400 μL) was also added to identify the nuclei.
Flow Cytometry
Flow cytometric (FCM) methods were employed to detect cell cycle and apoptotic effects. For cell cycle analysis, GC cells were harvested and centrifuged at 1500 rpm for 3 min. Cells were then fixed overnight in 2 mL chilled 75% ethanol. Just prior to detection, the cells were rinsed using phosphate-buffered saline (PBS) and stained with 500 µL propidium iodide (PI) for 20 min at 37°C. For apoptosis detection, GC cells were harvested, washed, and resuspended in chilled PBS. Apoptotic cells were stained for 20 min with PI and Annexin V-FITC at 37°C in the dark. Data were acquired with the FACScan flow cytometer.
Wound Healing Assay
HGC27 and SGC7901 cells (8×10⁵ cells/well) were seeded in 6-well plates and cultured until confluency. A sterile 200 μL pipet tip was used to introduce a uniform scratch. After 24 h, the magnitude of wound recovery was captured using a microscope (Nikon, Japan).
Transwell Assays
Cell migration and invasion were evaluated by transwell migration and invasion assays (Corning, USA). For the migration assay, 500 μL culture medium and 200 μL serum-free medium containing 2×10⁴ GC cells were added to the lower and upper chambers, respectively. For invasion assays, a similar setup was made, where cells were seeded in the upper chamber, this time a coat of Matrigel separates the upper and lower chambers. After 24 h, the cells in the upper chamber were removed, and those that have migrated and invaded were dyed using crystal violet for 20 min, counted, and statistically analyzed.
Glucose Consumption and Lactate Production
The glucose uptake colorimetric assay (Biovision) and the lactate colorimetric assay (Biovision) kits were used to detect glucose consumption and lactate production in GC cells, according to the manufacturer’s instructions.
Oxygen Consumption Rate (OCR) and Extracellular Acidification Rate (ECAR)
The OCR and ECAR were detected using the Seahorse Bioscience XF24 extracellular flux analyzer (Seahorse Bioscience), according to the manufacturer’s instructions.11
Western Blot Analyses
Proteins were separated by sodium dodecyl sulfate-polyacrylamide gel electrophoresis (SDS-PAGE) and then transfer to polyvinylidene difluoride (PVDF) membranes (Millipore, USA). After blocking at 37°C for 2 h, the membranes were incubated with primary antibodies at 4°C overnight. The membranes were washed with tris-buffered saline-tween (TBST) and incubated with secondary antibodies at 37°C for 2 h, and the specific proteins were detected using the electrochemiluminescence (ECL) detection system.
Metabolomics Determination
Metabolic profiling was carried out using a UPLC Ultimate 3000 system (Dionex, Germering, Germany) coupled to an Orbitrap mass spectrometer (Thermo Fisher Scientific, Bremen, Germany). The mass spectral data were collected in both positive and negative modes simultaneously. The chromatographic separation was carried out in a 1.9 μm Hypersile Gold C18 column (100 mm × 2.1 mm; Thermo Fisher Scientific, Bremen, Germany) maintained at 40°C. A multistep gradient with mobile phases consisting of 0.1% formic acid (solvent A) and acetonitrile (solvent B) was used. The gradient operated at a flow rate of 0.4 mL/min over a total run time of 15 min. The UPLC autosampler temperature was set at 4°C, and the injection volume for each sample was 10 μL. For both positive and negative modes, the operating parameters were as follows: 3.5 kV positive spray voltage, 2.5 kV negative spray voltage, 300°C capillary temperature, 50 arbitrary units for sheath gas flow, and 13 arbitrary units for auxiliary gas flow.
Tumor Xenograft Model
Female nude mice (4 weeks old) were obtained from Vitalriver (Nanjing, China). To study proliferation in vivo, 12 mice were randomly assigned to 4 groups (n = 3 per group). Stably transfected cell lines (HGC27-sh-HBXIP, HGC27-sh-ctrl, SGC7901-LV-HBXIP, and SGC7901-LV-NC) were injected subcutaneously into the flanks of the nude mice (1×10⁶/100 µL PBS). HGC27-sh-ctrl and HGC27-sh-HBXIP cells (1×10⁶ cells/100 µL PBS) were injected into the tail vein of nude mice (6 mice/group) to study metastasis in vivo. Four weeks later, the IVIS imaging system was employed to identify distant metastases.
Immunohistochemistry (IHC)
Immunohistochemistry was performed as per a previously described method.23 The following primary antibodies were used: HBXIP (Abcam), p-AKT, p53, Bax, N-cadherin, vimentin, E-cadherin (Cell signaling technology), and Ki-67 (Maixin Bio, China).
Statistical Analysis
SPSS 19.0 software package was employed to perform statistical analyses. The data were expressed as mean ± standard deviation (SD). The p values: *P < 0.05, **P < 0.01, and ***P < 0.001 was used to indicate statistical significance.
Results
HBXIP Is Up-Regulated in Human GC and Is Related to Its Clinicopathological Features
Using The Cancer Genome Atlas (TCGA) stomach adenocarcinoma mRNA sequencing datasets, we found that HBXIP expression is low in normal gastric tissues (n = 32), but is dramatically elevated in gastric cancer tissues (n = 375) (Figure 1A). To further analyze the expression of HBXIP in GC, we performed qRT-PCR on 100 paired GC and corresponding normal tissues. We found that HBXIP mRNA expression was higher in GC tissues than in the corresponding normal tissues (Figure 1B). HBXIP protein expression was then determined in six randomly chosen GC and normal tissue pairs using Western blot. HBXIP expression was consistently higher in GC tissues in comparison to normal tissues (Figure 1C). Moreover, when we explored HBXIP expression in GES-1 and GC cell lines by qRT-PCR, we found that HBXIP mRNA levels were elevated in the GC lines but not in the normal GES-1 cell line (Figure 1D). Consistent with the in vivo result, Western blot revealed that HBXIP expression was elevated in GC cell lines (Figure 1E). IHC was also performed to investigate the expression of HBXIP in 12 pairs of GC and normal tissues. We found that the GC tissues highly expressed HBXIP, while it was poorly expressed in the non-tumor tissues. Representative images of HBXIP expression in tissues have been shown in Figure 1F. These results demonstrated that HBXIP was up-regulated in human GC.
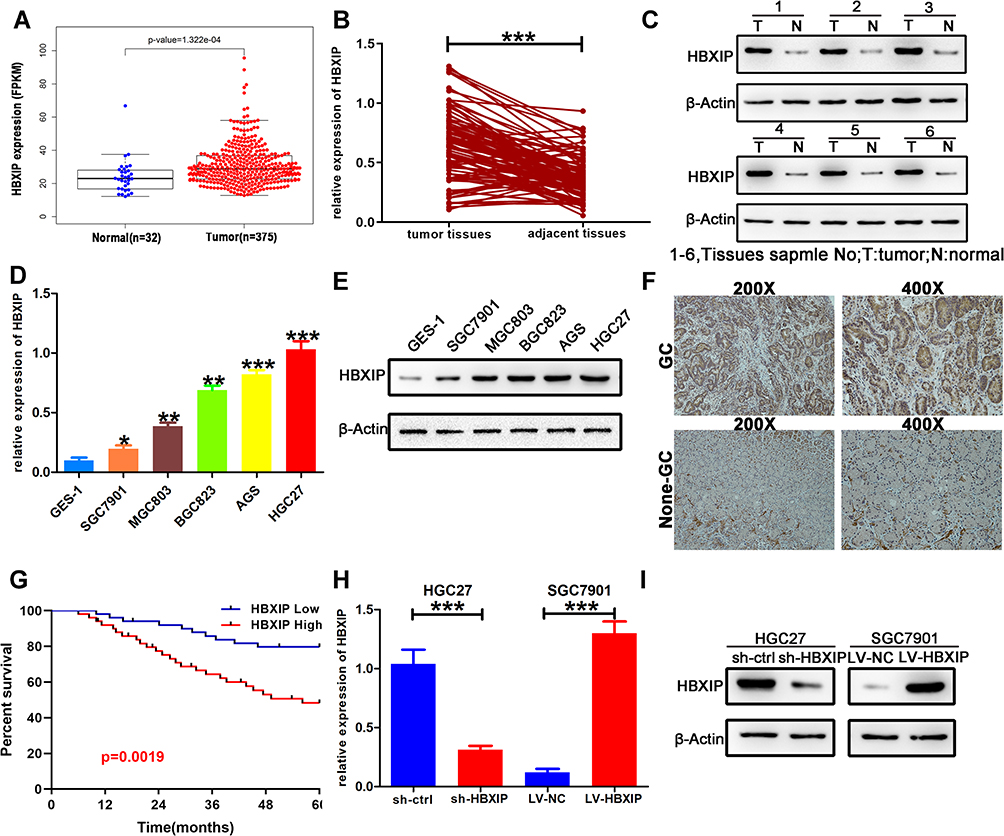 |
Figure 1 HBXIP expression in GC tissues, cells, and transfected cells. (A) TCGA sequencing data of HBXIP tissue expression. (B) HBXIP mRNA expression in 100 paired GC and non-tumor tissues as quantified by quantitative polymerase chain reaction (qRT-PCR). (C) HBXIP protein expression in six randomly selected pairs of GC (T) and non-tumor (N) tissues as determined by Western blot. (D, E) HBXIP expression in GC and GES-1 cells as quantified by qRT-PCR and Western blot. (F) Representative images of HBXIP staining in GC and non-tumorous tissues. (G) A Kaplan–Meier graph showing the 5-year overall survival (OS) of patients with “HBXIP High” and “HBXIP Low”-expressing tumors. (H, I) qRT-PCR and Western blot validation of HBXIP expression in cells transfected with sh-ctrl, sh-HBXIP, LV-NC, and LV-HBXIP vectors. *p<0.05, **p<0.01, ***p<0.001. |
We further evaluated the link between HBXIP mRNA expression and GC clinicopathology. GC patients were allocated into two groups based on their HBXIP mRNA expression levels. The data revealed that patients with high HBXIP expression had larger tumors, more advanced cancer stage, and more lymph node metastases N1–N3 (Table 1). A Kaplan–Meier survival curve demonstrated that GC patients with high HBXIP expression had worse overall survival (OS) than those with low HBXIP expression (P = 0.0019; Figure 1G). Multivariate analysis by COX regression showed that high HBXIP expression was an independent prognostic factor predicting worse survival outcomes for GC patients (Table 2). These results demonstrated that HBXIP was positively correlated with GC progression.
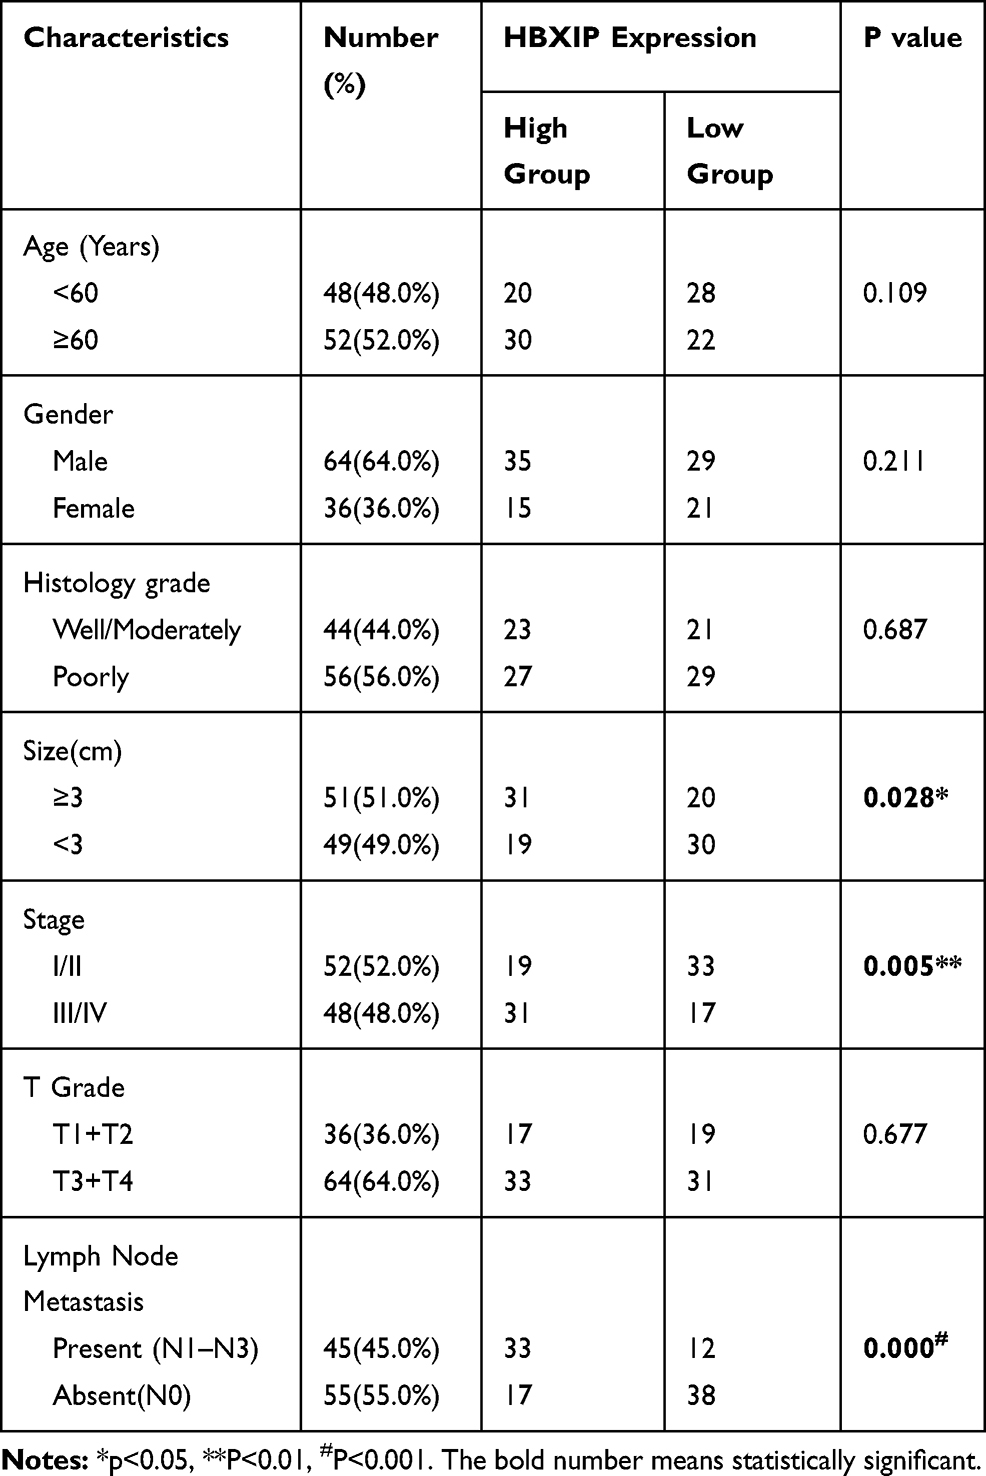 |
Table 1 Expression of HBXIP Protein in Human Gastric Cancer According to Patients’ Clinicopathological Characteristics |
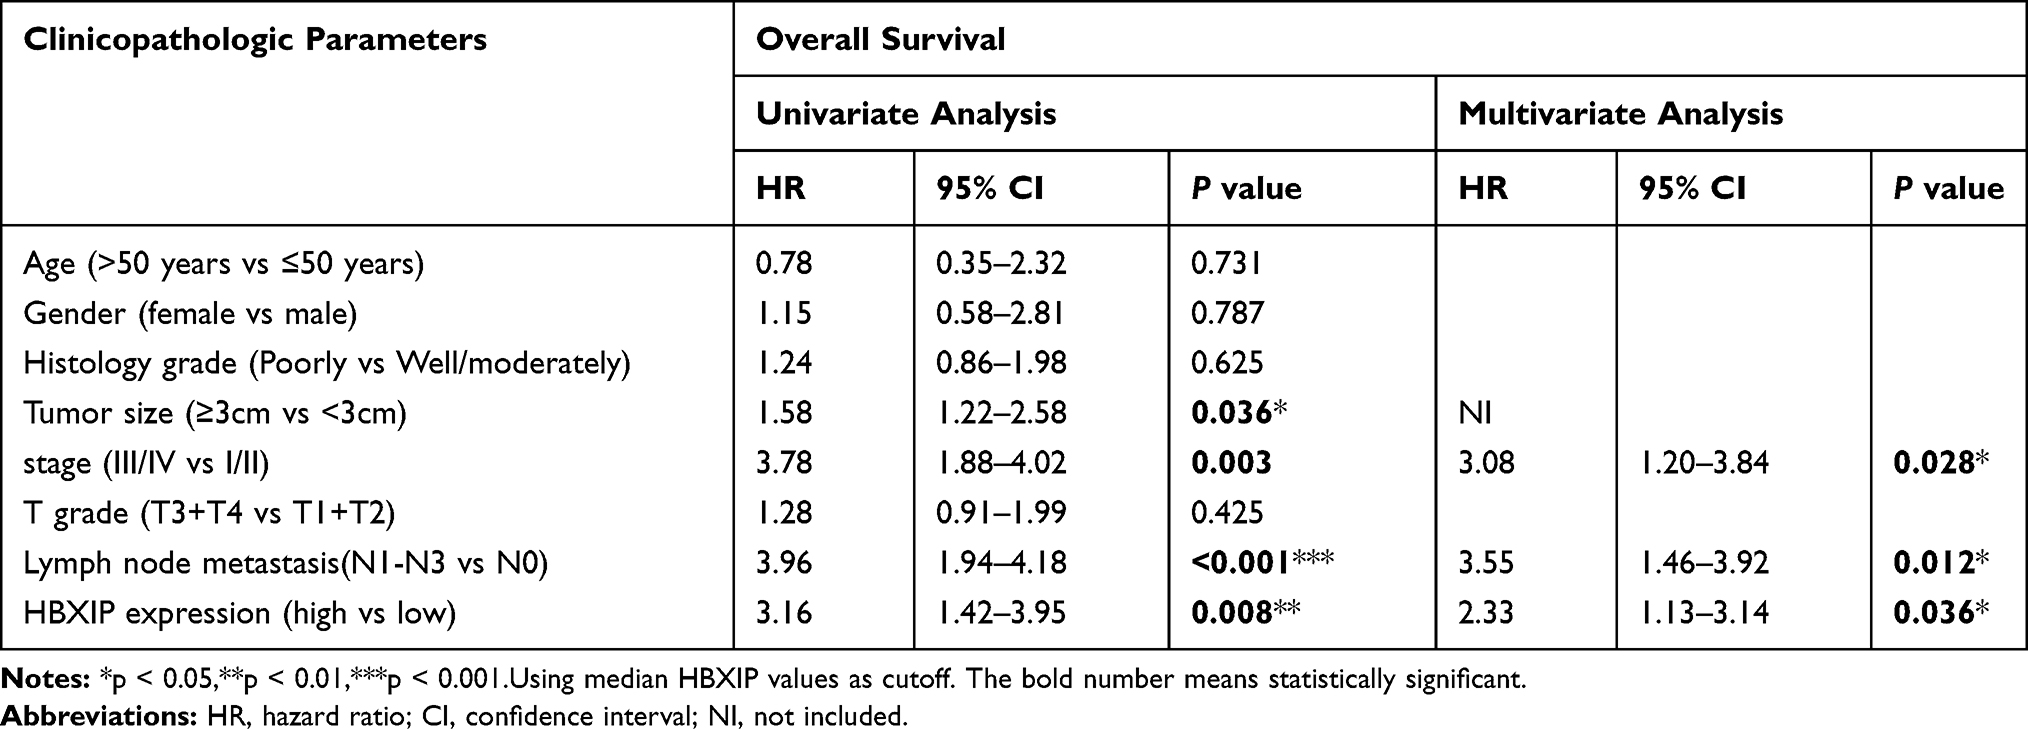 |
Table 2 Univariate and Multivariate Overall Survival Analysis of Prognostic Factors for GC Patients (n = 100) |
HBXIP Promotes the Proliferation of GC Cells
To investigate the biological functions of HBXIP in GC, we selected two GC cell lines based on their HBXIP mRNA levels as detected by qRT-PCR. We knocked down HBXIP in HGC27, a cell line that highly expressed this protein, and overexpressed it in the low expressing SGC7901 line, to produce HGC27-sh-HBXIP and SGC7901-LV-HBXIP respectively. Control vectors were also introduced into these cell lines to produce negative control lines: HGC27-sh-ctrl and SGC7901-LV-NC. qRT-PCR and Western blotting were used to verify the transfection efficiency of HBXIP in these cells. As shown in Figure 1H and I, HGC27-sh-HBXIP cells had a 70% reduction of HBXIP expression in comparison to the expression in HGC27-sh-ctrl (negative control) cells, whereas SGC7901-LV-HBXIP cells had a 10.8-fold increase in HBXIP expression when compared to the expression in SGC7901-LV-NC (negative control) cells.
A CCK-8 assay was used to investigate the effects of HBXIP on GC proliferation in these cell lines. It showed that the HBXIP-silenced HGC27-sh-HBXIP cell line proliferated at a slower rate in comparison to their non-silenced counterpart. In contrast, overexpressing HBXIP in SGC7901-LV-HBXIP cells promoted proliferation (Figure 2A and B). We further used an EdU incorporation assay, which has greater specificity and sensitivity, to investigate HBXIP’s effect on proliferation. There were fewer EdU-positive cells in the HGC27-sh-HBXIP cell line than in its control vector counterpart (HGC27-sh-ctrl). However, in comparison to SGC7901-LV-NC cells, SGC7901-LV-HBXIP had more EdU positive cells (Figure 2C and D). We next investigated the capacity of these cells to form colonies and found that HBXIP down-regulation resulted in an impairment of this ability. Whereas, more colonies were formed when HBXIP was overexpressed in the SGC7901 cell line (Figure 2E and F). These in vitro results indicated that HBXIP positively regulated the proliferation of GC cells.
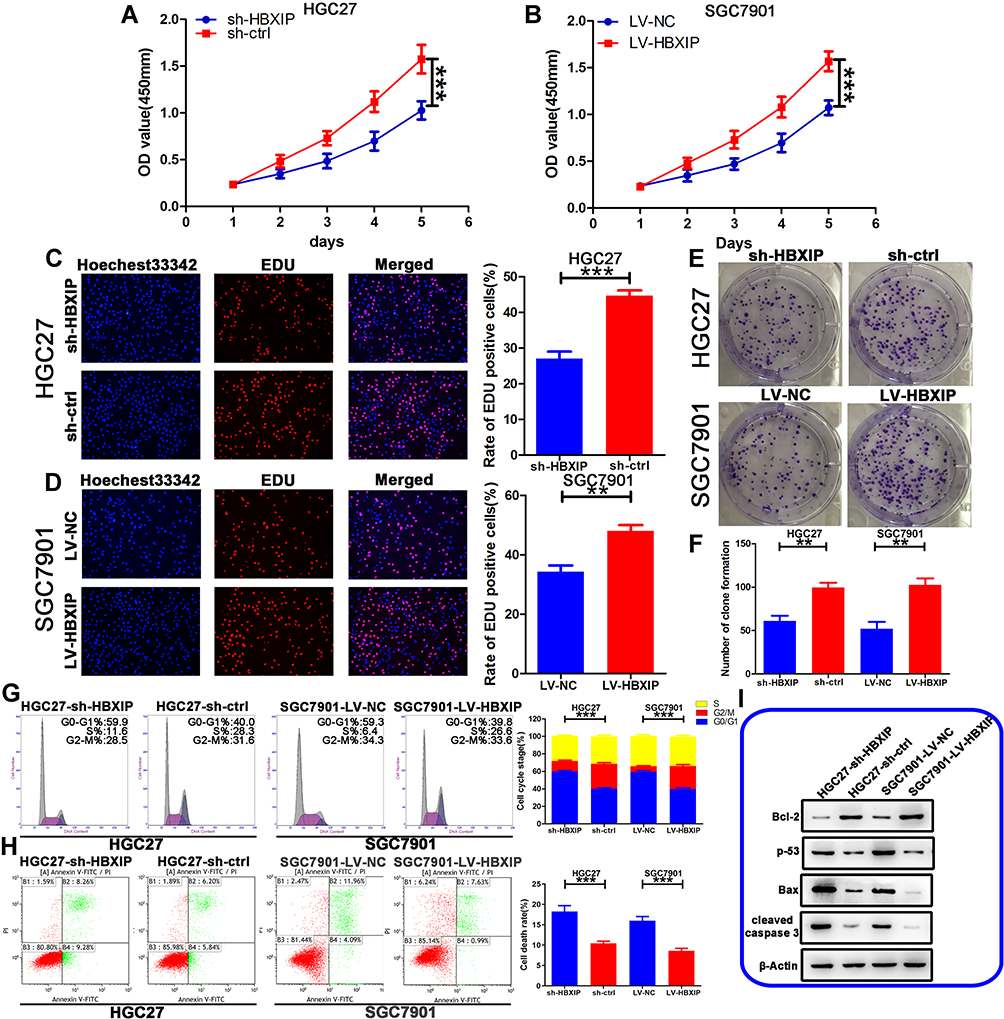 |
Figure 2 HBXIP promotes cell proliferation and inhibits cell apoptosis. (A, B) The proliferation of the stably transfected GC cells as measured by the CCK-8 assay. (C, D) The proliferation of the stably transfected GC cells as measured by the EdU assay. (E, F) The effects of changing HBXIP expression on the colony formation. (G) The effects of changing HBXIP expression on cell cycle distribution. (H) The effects of changing HBXIP expression on cell apoptosis as measured by fluorescence-activated cell sorting (FACS). (I) Western blot of apoptotic proteins: Bax, Bcl-2, cleaved Caspase 3, and p53. **p<0.01, ***p<0.001. |
HBXIP Inhibits G0/G1 Cell Cycle Arrest and Suppresses the Apoptosis of GC Cells
To explore whether the HBXIP-induced changes in proliferation was due to perturbation of the cell cycle, we investigated the cell cycle distribution of these GC cell lines by FCM. We found that knockdown of HBXIP expression in HGC27-sh-HBXIP cells induced G0/G1 cell cycle arrest, whereas the up-regulation of HBXIP expression in SGC7901-LV-HBXIP cells had the opposite effect (Figure 2G).
FCM was also used to investigate the effect of HBXIP on apoptosis. The HGC27-sh-HBXIP cell line had more apoptotic cells than their HGC27-sh-ctrl counterparts. Conversely, the up-regulation of HBXIP in SGC7901-LV-HBXIP cells suppressed apoptosis (Figure 2H). The expression of apoptotic genes such as the anti-apoptotic protein Bcl-2, the tumor suppressor gene p53, the pro-apoptotic protein Bax, and cleaved caspase-3 was also determined by Western blotting. With HBXIP knockdown in HGC27-sh-HBXIP cells, the expression of pro-apoptotic p53, Bax, and cleaved caspase-3 had increased, whereas, anti-apoptotic protein Bcl-2 expression was down-regulated. Conversely, the opposite was observed in the SGC7901-LV-HBXIP cell line that overexpressed HBXIP (Figure 2I). In general, these in vitro findings indicated that HBXIP inhibited cell cycle progression by inducing G0/G1 arrest and suppressed apoptosis in GC.
HBXIP Promotes the Migration and Invasion of GC Cells
The clinicopathological features associated with HBXIP expression listed in Table 1 suggest that HBXIP may have a role in GC migration and invasion. The effect of HBXIP expression on GC cell migration was investigated using a wound healing assay. The ability of HGC27 cells to migrate was decreased when HBXIP was knocked down, whereas, in the overexpressing SGC7901-LV-HBXIP cell line, this effect was increased (Figure 3A and B). The transwell assay was also used to determine the effects of HBXIP on migration and invasion. Consistent with the wound healing assay, GC cell migration through the transwells was impaired when HBXIP was knocked down, while it was enhanced when this protein was overexpressed (Figure 3C and D). Moreover, silencing HBXIP also significantly impaired GC cell invasion through the Matrigel layer, whereas HBXIP up-regulation augmented this effect (Figure 3E and F).
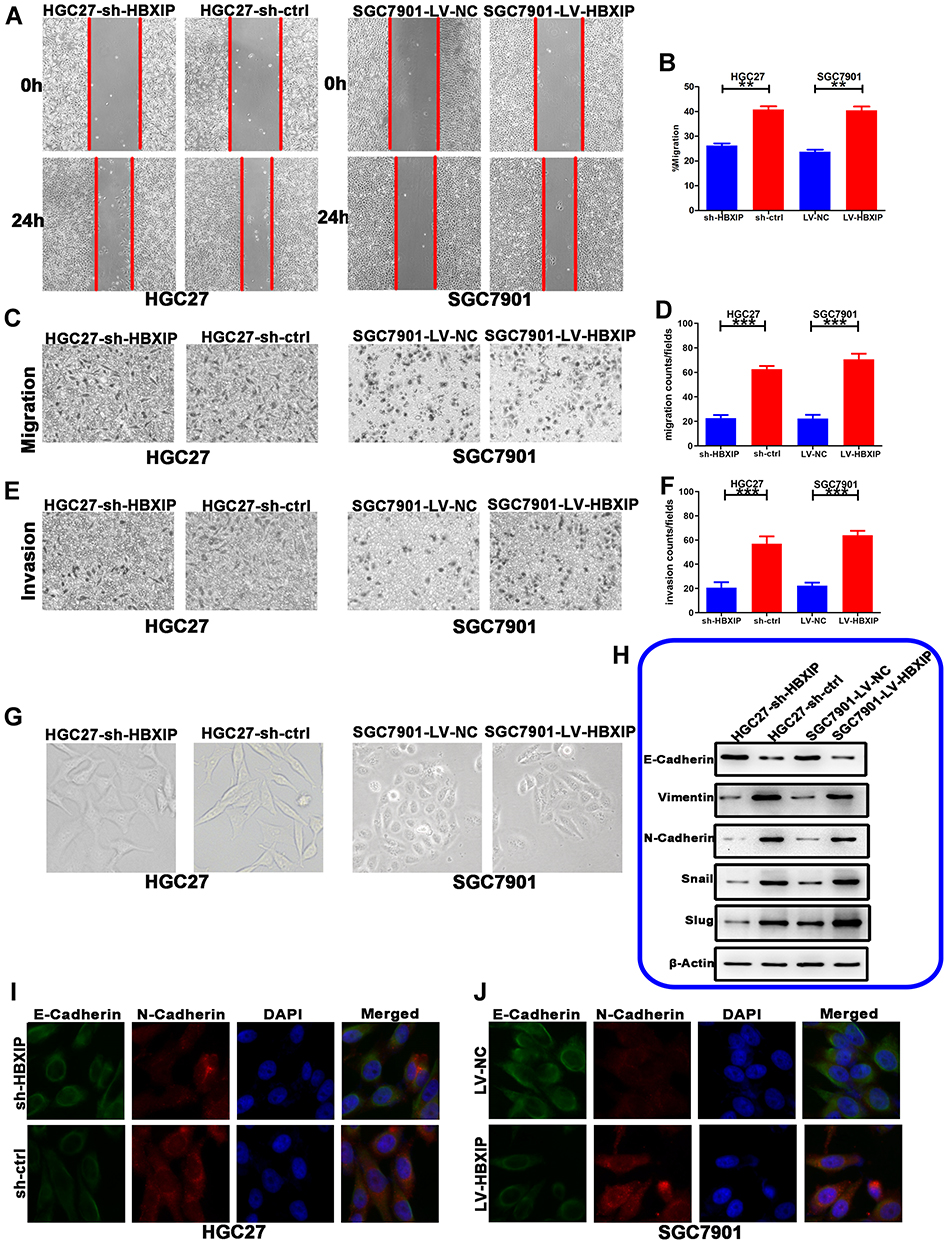 |
Figure 3 HBXIP promotes GC cell migration, invasion, and EMT. (A, B) Wound healing assays showing GC cell migration. (C, D) Transwell migration assays of stably-transfected GC cells following transfection with sh-HBXIP, LV-HBXIP, or empty vector. (E, F) Matrigel invasion assays of the stably transfected GC cells following transfection with sh-HBXIP, LV-HBXIP, or empty vector. (G) Representative images showing changes in cell morphology when HBXIP expression was altered. (H) The expression of EMT markers in response to changing HBXIP expression as detected by Western blot. (I, J) Immunofluorescence showing of E-cadherin (green) and N-cadherin (red) expression in SGC7901 and HGC27 cells. **p<0.01, ***p<0.001. |
Epithelial-to-mesenchymal transition (EMT) is considered essential for tumor cells to migrate and invade.24,25 As shown in Figure 3G, HGC27 cells became tightly packed when HBXIP was silenced, which is a morphological characteristic attributed to GC epithelial cells. Whereas, HBXIP up-regulation in SGC790 cells led to a more spindle-like mesenchymal morphology. The expression of “EMT master genes” was also assessed to determine whether HBXIP promoted cell migration and invasion via EMT. The HBXIP-silenced HGC27-sh-HBXIP cells had up-regulated expression of the epithelial marker E-cadherin and reduced expression of mesenchymal markers N-cadherin and vimentin, and the EMT transcription factors snail and slug. Conversely, HBXIP up-regulation showed the opposite effect in the SGC7901-LV-HBXIP cells (Figure 3H). Immunofluorescence revealed that silencing HBXIP increased the expression of E-cadherin and reduced that of N-cadherin, whereas HBXIP up-regulation had the opposite effects (Figure 3I and J). In general, these data demonstrated that HBXIP modulates GC cell migration and invasion by promoting EMT.
HBXIP Promotes Glucose Metabolism in GC Cells
To explore the effects of HBXIP expression on cellular metabolism, we used HPLC to identify glycolysis-related metabolites. In comparison to their vector controls, HBXIP knockdown in GC cell lines exhibited a reduced glucose metabolism, whereas its overexpression had the opposite effect (Figure 4A and B). We then examined glucose consumption and lactate production. As anticipated, HBXIP silencing in HGC27-sh-HBXIP cells decreased glucose consumption and lactate production. Whereas, HBXIP up-regulation in SGC7901-LV-HBXIP cells had opposite effects, suggesting that HBXIP stimulated glycolysis (Figure 4C and D). ECAR measures the rate of lactate-induced acidification of culture medium and is another measurement of glucose metabolism. Silencing HBXIP in HGC27 cells decreased ECAR while HBXIP up-regulation in SGC7901 cells increased this measurement (Figure 4E and F). ECAR results indicated that HBXIP promoted lactate formation during glycolysis. Cellular oxygen consumption, as measured by the OCR, could directly reflect a mitochondrial respiration. The OCR was reduced when HBXIP was knocked down in HGC27 cells and increased when it was overexpressed in SGC7901 cells (Figure 4G and H). This indicates that HBXIP is a regulator of mitochondrial respiration, and increase in the glucose consumption is accompanied by elevated mitochondrial metabolism. Taken together, these results demonstrate that HBXIP promotes glucose uptake and increases glycolysis and mitochondrial respiration in GC cells.
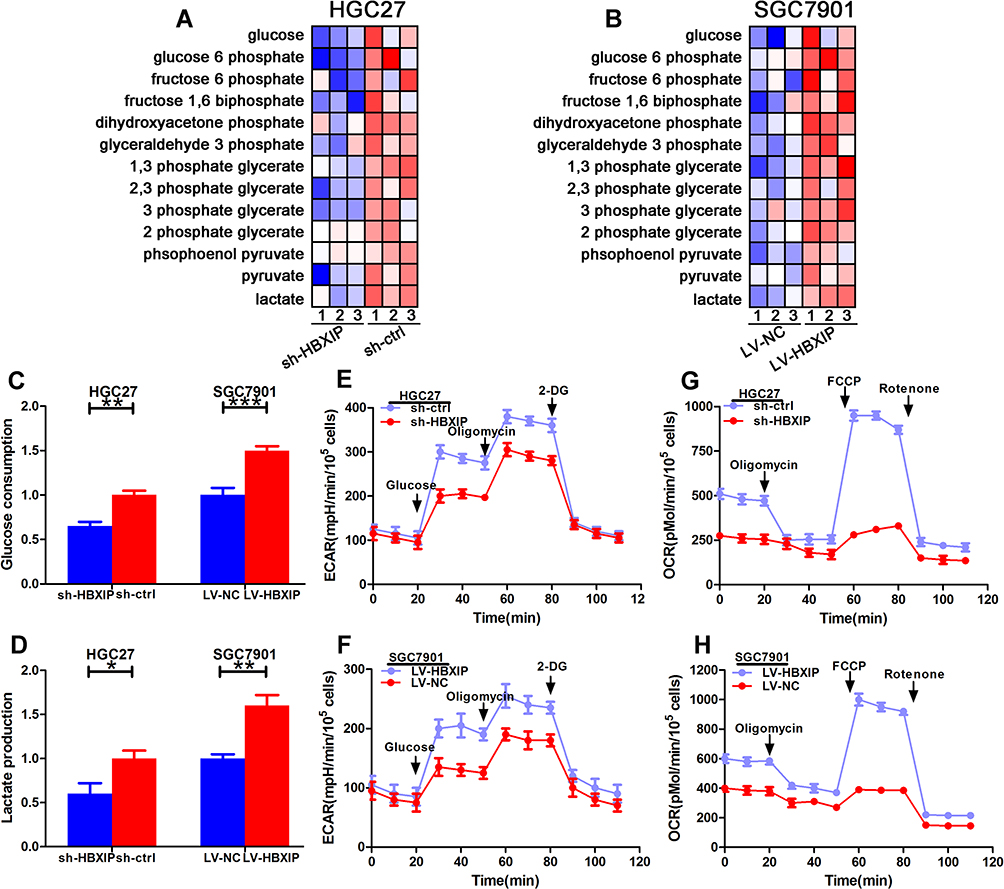 |
Figure 4 Upregulation of HBXIP increases glucose metabolism in GC (A, B) Glycolysis-related metabolites produced by HGC27 and SGC7901 cells as determined by HPLC. (C, D) The effect of altering HBXIP expression on glucose consumption and lactate production as determined using culture medium. (E, F) The extracellular acidification rate (ECAR) measuring changes in GC glycolysis when HBXIP expression was altered. Glucose, oligomycin, and 2-deoxyglucose (2-DG) were added at the indicated points. (G, H) The oxygen consumption rate (OCR) showing changes in mitochondrial respiration when HBXIP expression was altered. Oligomycin, FCCP, and rotenone were added at the indicated points. *p<0.05, **p<0.01, ***p<0.001. |
HBXIP Promotes Glucose Metabolism by Activating PI3K/AKT Signaling and Inhibiting p53 Signaling
The reprogramming of glucose metabolism in cancer cells has been attributed to a wide range of causal factors. Among these, the PI3K/AKT pathway, which regulates multiple glucose metabolic processes, plays a crucial role. We showed that silencing HBXIP in HGC27 cells significantly decreased the expression of phospho-AKT (pAKT), whereas HBXIP overexpression in SGC7901 cells significantly increased pAKT (Figure 5A). To further investigate the role of PI3K/AKT in HBXIP-induced glucose metabolic reprogramming, we treated SGC7901-LV-HBXIP cells with the PI3K inhibitor LY294002. The results showed that following a 24-h incubation with LY294002, AKT was inactivated in these cells with a decrease in pAKT expression (Figure 5B). Furthermore, treatment with LY294002 decreased both glucose consumption and lactate production (Figure 5C and D). Correlatively, the ECAR and OCR were also decreased by LY294002 treatment (Figure 5E and F). These findings suggest that HBXIP activates PI3K/AKT signaling and thus promote glucose metabolic reprogramming in GC cells.
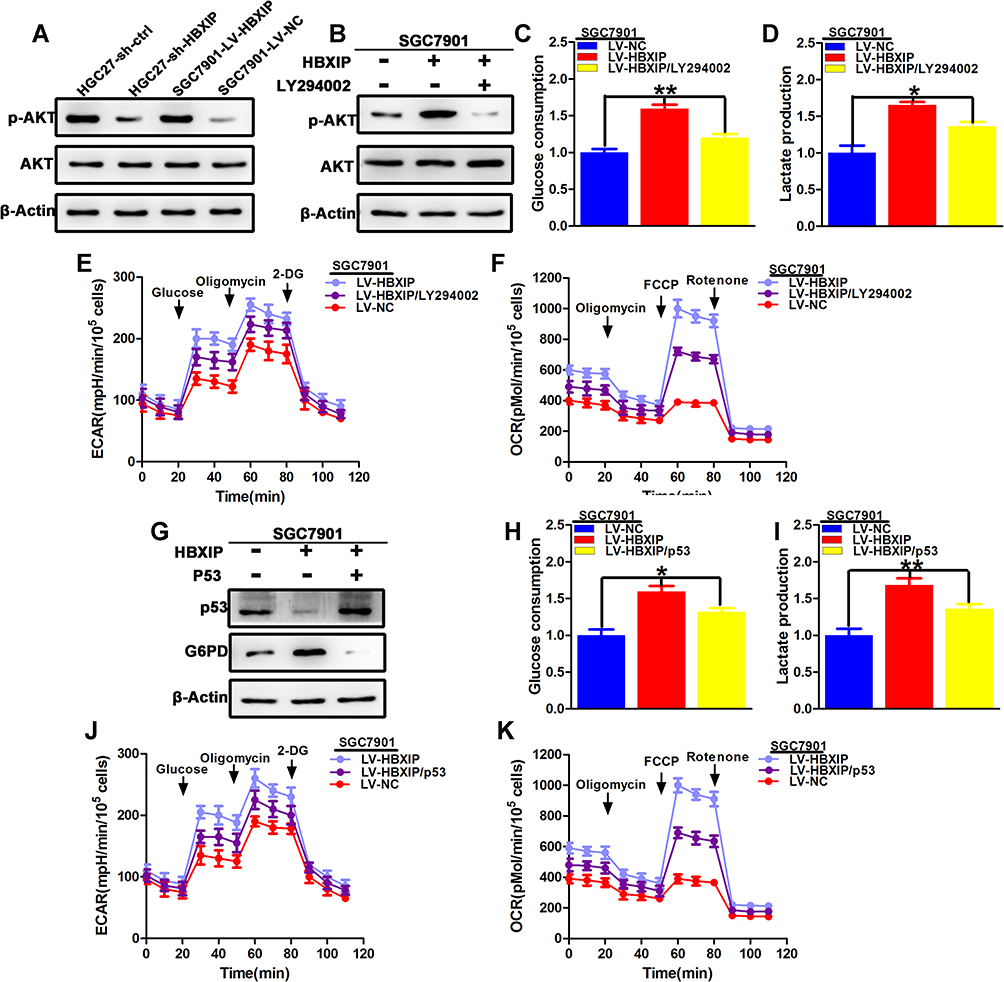 |
Figure 5 Molecular mechanisms underlying glucose metabolic reprogramming in SGC7901-LV-HBXIP cells. (A) Western blot of p-AKT and AKT cellular expression. (B) The expression of p-AKT and AKT following treatment with LY294002 as detected by Western blot. (C, D) Glucose consumption and lactate production following treatment with LY294002. (E, F) The extracellular acidification rate (ECAR) and the oxygen consumption rate (OCR) in cells following LY294002 treatment. (G) Verification of p53 and G6PD expressions by Western blot. (H, I) Glucose consumption and lactate production in SGC7901 cells following restoration of p53 expression in these cells. (J, K) The ECAR and OCR following restoration of p53 expression in these cells. *p<0.05, **p<0.01. |
p53 dysfunction has previously been shown to activate PPP and contribute to the Warburg effect. As shown in Figure 2I, in comparison to the control cell lines, p53 expression was elevated in HGC27-sh-HBXIP cells and reduced in SGC7901-LV-HBXIP cells. To further investigate the role of p53 in HBXIP-induced metabolic reprogramming, the wild-type p53 gene was transfected into the SGC7901-LV-HBXIP cell line, and its expression was verified by Western blotting (Figure 5G). Western blotting was also employed to confirm the inverse relationship between p53 and G6PD. As expected, G6PD expression was higher in SGC7901-LV-HBXIP than in their vector counterpart, and restoration of p53 expression in these cells suppressed G6PD expression (Figure 5G). Furthermore, restoration of p53 expression also decreased glucose consumption and lactate production in these cells (Figure 5H and I). Accordingly, the ECAR and the OCR were decreased when p53 expression was restored (Figure 5J and K). These results indicated that HBXIP promoted PPP and contributed to the Warburg effect by inhibiting p53 expression.
HBXIP-Induced Glucose Metabolic Reprogramming Promotes Proliferation, Migration, and Invasion
To further clarify the mechanisms underlying HBXIP-induced GC cell proliferation, migration, and invasion, we inhibited the PI3K/AKT and the p53 signaling pathways. HBXIP’s effects on proliferation and apoptosis in SGC7901-LV-HBXIP cells was reversed by either PI3K/AKT inhibition or by restoration of the p53 expression (Figure 6A–D). HBXIP-mediated enhancement of migration and invasion was likewise reversed (Figure 6E and F). Cumulatively, these results demonstrated that HBXIP-induced metabolic reprogramming was responsible for GC proliferation, migration, and invasion.
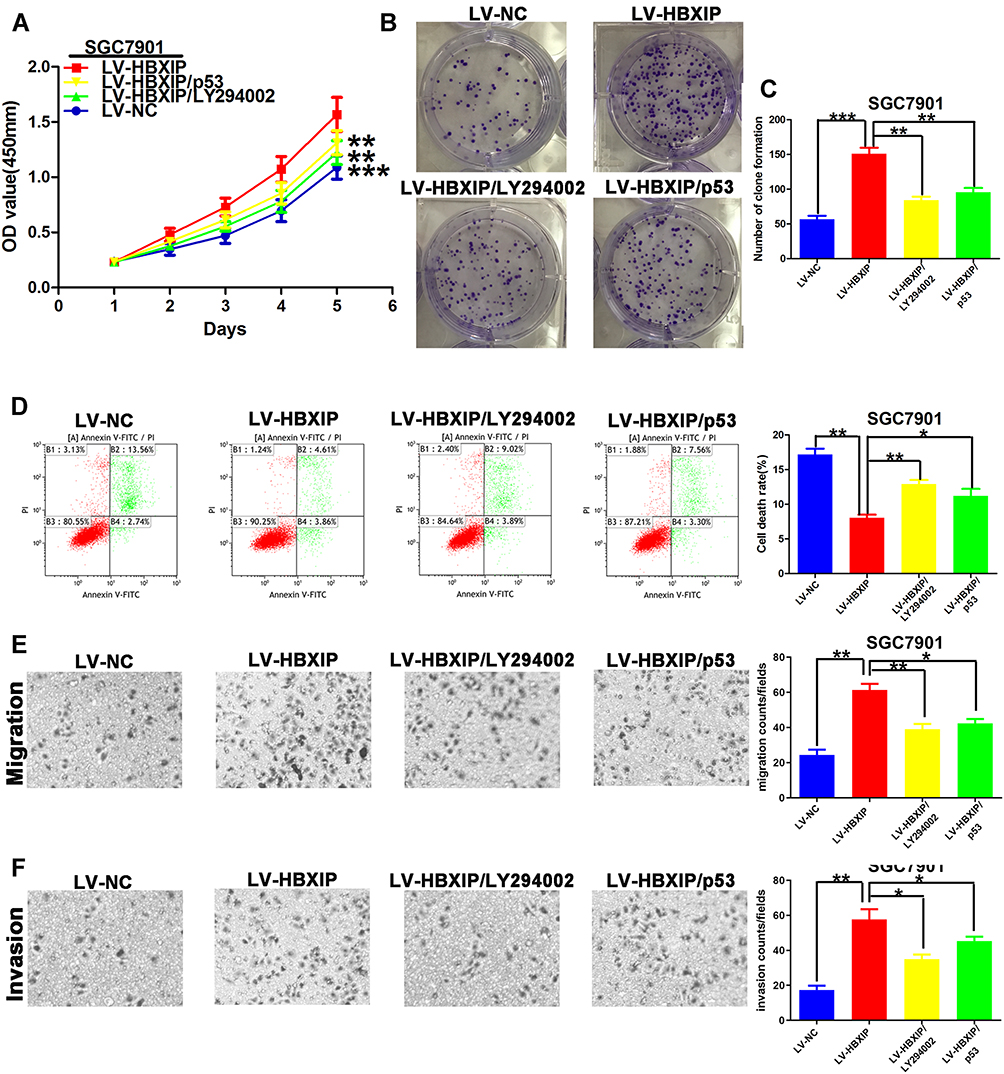 |
Figure 6 Targeting the PI3K/AKT and p53 pathways in the HBXIP-mediated reprogramming of glucose metabolism promotes cell proliferation, migration, and invasion. (A–C) CCK8 and colony formation assays testing the effect of blocking the PI3K/AKT pathway or restoring p53 on SGC7901-LV-HBXIP cell proliferation. (D) The apoptotic rate of GC cells as measured by flow cytometry when the PI3K/AKT pathway was blocked or when p53 expression was restored in SGC7901-LV-HBXIP cells. (E, F) Transwell assays showing SGC7901-LV-HBXIP cell migration following blockage of the PI3K/AKT pathway or restoration of p53. *p<0.05, **p<0.01, ***p<0.001. |
The in vivo Effects of HBXIP on Tumor Growth, Apoptosis, Metastasis, and EMT
For in vivo validation of our in vitro results, we established GC xenograft models from the stably transfected HGC27-sh-HBXIP and SGC7901-LV-HBXIP cell lines and their paired negative controls. As shown in Figure 7A–D, tumor growth was reduced with HBXIP knockdown in HGC27-derived tumors, whereas this was promoted in HBXIP–overexpressing SGC7901 tumors. To explore whether HBXIP down-regulation could inhibit GC metastasis in vivo, HGC27-sh-HBXIP and HGC27-sh-ctrl cells were injected into the tail vein of nude mice. Four weeks later, the nude mice injected with HGC27-sh-ctrl cells displayed a higher incidence of distant metastasis (5/6), than those injected with HGC27-sh-HBXIP (1/6; Figure 7E). Metastases to the main organs are listed in Figure 7F. Tumor tissues were also investigated for the expression of proliferation, apoptotic, and EMT markers. Figure 7G showed that HGC27-sh-HBXIP tumors possessed a lower proliferation (Ki67 labeling) index in comparison to their vector control, whereas the opposite was observed in SGC7901-transfected tumors. HBXIP knockdown in HGC27-transfected tumors also increased p53 and Bax expressions, which were decreased in SGC7901-LV-HBXIP tumors. Similarly, the terminal deoxynucleotidyl transferase-mediated dUTP nick end labeling (TUNEL) assay also showed that the apoptotic index was significantly higher in HGC27-sh-HBXIP tumors than in those derived from their control cell line, indicating that cell viability was compromised. However, in SGC7901-derived tumors, the opposite effect was observed. HBXIP knockdown tumors had increased E-cadherin and decreased N-cadherin and vimentin expressions, which indicates that EMT was inhibited. The opposite effect was observed in SGC7901-derived tumors, demonstrating that EMT was enhanced in these tumors. AKT activity was also down-regulated in HGC27-sh-HBXIP-derived tumors, and up-regulated in SGC7901-LV-HBXIP tumors.
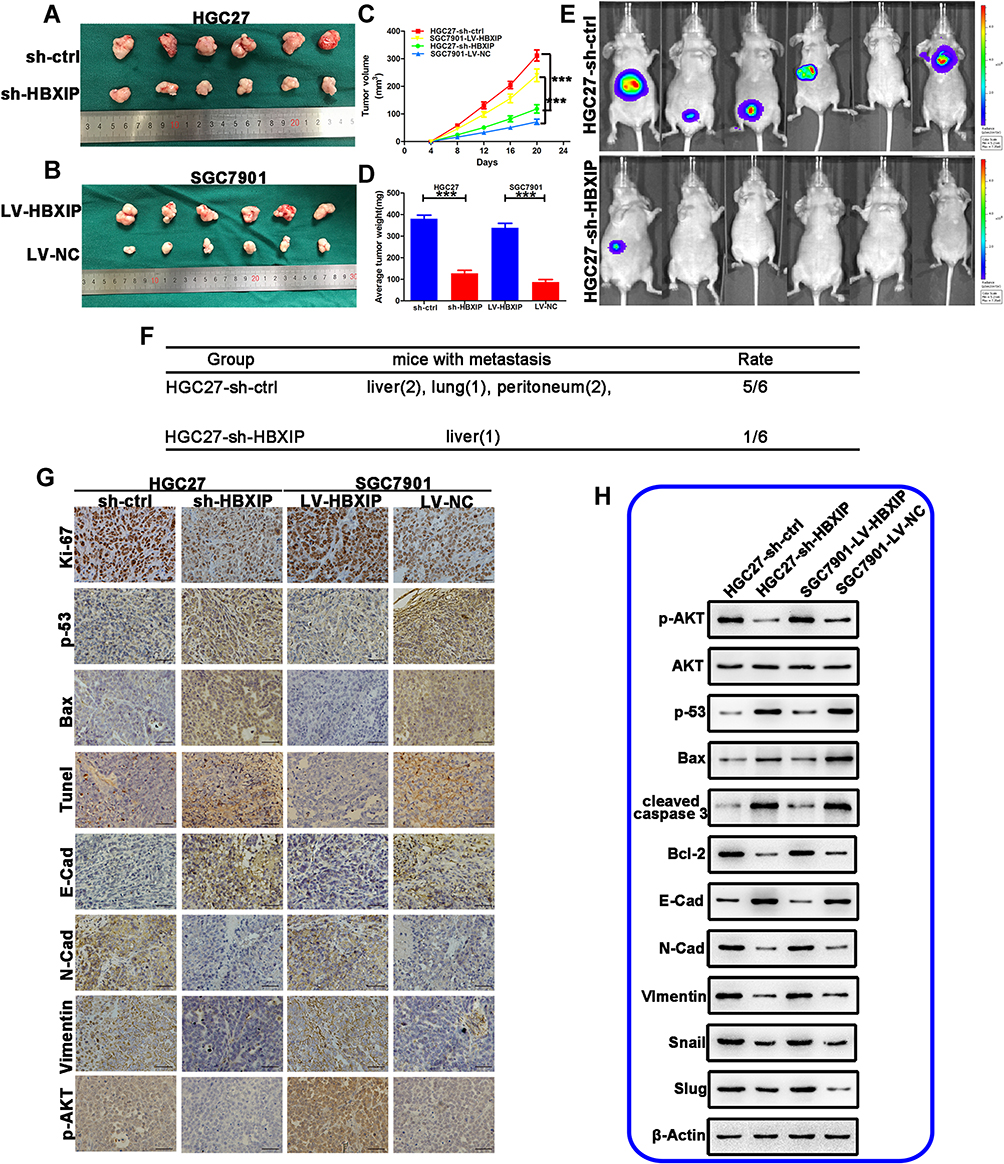 |
Figure 7 The effects of HBXIP knockdown or overexpression on tumor growth, metastasis, and EMT in GC xenograft models established from transfected HGC27 and SGC7901 cell lines. (A, B) Representative images of tumors sections. (C) Tumor growth curve showing the tumor volume as a function of time (D) The mean tumor weight in these xenograft models. (E) Representative images of distant metastases captured by the IVIS Imaging System four weeks after HGC27-sh-HBXIP and HGC27-sh-ctrl cells were injected into the tail vein of nude mice. (F) The type and number of main organ metastases. (G) Terminal deoxynucleotidyl transferase-mediated dUTP nick end labeling (TUNEL) and immunohistochemical (IHC) staining of pAKT, E-cadherin, N-cadherin, vimentin, Bax, p53, and ki67 in tumors. (H) The expression of proliferation, apoptosis, metastasis, and EMT markers in the xenograft tumors as measured by Western blot. **p<0.01, ***p<0.001. |
Western blot was employed to confirm the data obtained by IHC (Figure 7H). Consistent with in vitro results, pAKT expression was suppressed in HGC27-sh-HBXIP tumors, but were increased in SGC7901-LV-HBXIP–derived tumors. The increased expressions of pro-apoptotic Bax, cleaved caspase-3, and p53; and decreased expression of anti-apoptotic Bcl-2, demonstrated that HBXIP was required for GC growth by inhibiting apoptosis. HBXIP knockdown down-regulated the expression of mesenchymal markers, and up-regulated the expression of an epithelial marker, whereas the opposite was observed with HBXIP overexpression. These results confirm our in vitro findings and uncover vital functions of HBXIP in GC.
Discussion
It is widely acknowledged that many tumors have altered glucose metabolism.9,26 Glucose metabolic reprogramming can induce tumor cell proliferation, migration, and invasion, and thus, is important for tumorigenesis. For example, metabolic and oxidative stress-induced changes to glucose metabolism increased snail,27 inhibitor-κB kinase ε (IKKε),28 and HIF-129 expression, which promoted cancer cell survival, growth, and metastasis. However, while there has been tremendous progress in identifying its clinical importance and potential causal factors,30 the molecular mechanisms underlying glucose metabolic reprogramming and its role in cancer progression, particularly in GC, have not been fully clarified.
Mammalian HBXIP, a conserved ~18 kDa protein of unknown functions, is located at position 1p13.3 on the human chromosome 1. Accumulating evidence has demonstrated that HBXIP plays a pivotal role in the progression of multiple tumor types, including breast, cervical, and ovarian cancers. Recent studies have found that HBXIP promoted breast cancer cell proliferation, migration, and angiogenesis by activating transcription factors.8,31,32 HBXIP was also shown to contribute to ovarian cancer cell migration by up-regulating the S-phase kinase-associated protein 2.33 Moreover, HBXIP overexpression in hepatocellular carcinoma resulted in endothelial cell proliferation, migration, and angiogenesis.34 However, the functional importance and underlying mechanisms of HBXIP in GC remain poorly understood. Hence, further research on HBXIP’s role in GC progression is warranted. Here, we found that HBXIP expression was significantly higher in GC tissues and cell lines, in comparison to corresponding normal tissues and cell line (GES-1). Stepwise investigation of patient clinicopathological features showed that patients with high HBXIP expressions had larger tumors, more advanced tumor staging, and more lymph node metastasis (N1–N3). Moreover, high HBXIP expression correlated with poor prognosis. Subsequently, we explored the effects of changing HBXIP expression on GC proliferation, migration, and invasion. The results revealed that HBXIP up-regulation promoted both in vitro and in vivo proliferation, migration, and invasion, whereas the opposite was observed when HBXIP was downregulated. Moreover, HBXIP up-regulation also induced EMT, a crucial process in cancer progression, as evidenced by increased migration, invasion, expression of EMT markers, and mesenchymal cell morphology in our overexpressing cell lines and tumors. These results demonstrated that HBXIP was positively associated with GC progression.
There is mounting evidence that glucose metabolic reprogramming is a characteristic of tumorigenesis. Recently, HBXIP has been reported to contribute to glucose metabolic reprogramming in liver cancer, where it suppressed gluconeogenesis,18 and in breast cancer, where it down-regulated SCO2 and PDHA1 for glucose metabolic reprogramming.19 The role of HBXIP in GC glucose metabolic reprogramming is poorly understood. The present study demonstrated that HBXIP could promote glucose metabolism in GC cells.
It is widely acknowledged that glucose metabolic reprogramming can be driven by multiple oncogenic pathways. The metabolic shift from aerobic to anaerobic glycolysis in tumor cells is primarily mediated by the PI3K/AKT pathway. AKT promotes the activation of mammalian target of rapamycin (mTOR) and its downstream effector hypoxia-inducible factor 1-alpha (HIF1α). This leads to the induction of glucose transporter 1 (GLUT1), other glycolytic enzymes, and pyruvate dehydrogenase kinase (PDK). Consequentially, pyruvate flux into the tricarboxylic acid (TCA) cycle is suppressed.35 p53 is a multifaceted protein that inhibits aerobic glycolysis and has vital roles in other aspects of glucose metabolic reprogramming, as well as other biological functions such as cell cycle arrest, apoptosis, and senescence.4,36,37 p53 interaction with G6PD prevents its dimerization, resulting in the inhibition of PPP.22,38 Correlatively, p53 dysfunction in cancer enhances glucose consumption by accelerating PPP and glycolysis. It has been reported that HBXIP overexpression promotes an MDM2-mediated p53 degradation.39 The relationship between HBXIP, pAKT, and p53 have also been discussed recently. Li et al reported that HBXIP regulated the MDM2/p53 feedback loop39 and promoted breast cancer growth by decreasing p53 expression via the miR-18b/MDM2 and the pAKT/MDM2 pathways.40 Wang et al demonstrated that HBXIP contributed to the growth of a human liver cancer cell line (HepG2) by activating the PI3K/AKT pathway.41 Hence, we hypothesized that HBXIP affected both PI3K/AKT and p53 signaling pathways, which may be responsible for glucose metabolic reprogramming in GC. In concordance with our hypothesis, our data demonstrated that HBXIP overexpression promoted glycolysis by activating PI3K/AKT and inactivating p53. Moreover, blocking the PI3K/AKT pathway or rescuing p53 expression in HBXIP-overexpressing cells impeded cell proliferation, migration, and invasion. Collectively, these results indicate that there is a close relationship between glucose metabolic reprogramming mediated by HBXIP and the tumor cells’ ability to proliferate, migrate, and invade.
This is the first study that investigated HBXIP’s effect on GC glucose metabolism. Our results suggest that HBXIP promotes proliferation, migration, and invasion by up-regulating glucose metabolism through activation of the PI3K/AKT pathway and inhibition of p53. In conclusion, this study highlights potential mechanisms for glucose metabolic reprogramming by HBXIP in GC and identifies new strategies for GC treatment.
Abbreviations
GC, gastric cancer; HBXIP, hepatitis B X-interacting protein; FBS, fetal bovine serum; BSA, bull serum albumin; PBS, phosphate-buffered solution; DAPI: 4ʹ,6-diamidino-2-phenylindole; PCR, polymerase chain reaction; CCK-8, cell counting kit 8; TUNEL, terminal deoxynucleotidyl transferase-mediated dUTP nick end labeling.
Data Sharing Statement
All data described and/or analyzed in our study are available upon request.
Ethics and Consent Statement
The present study was approved by the Ethics Committee of The Second People’s Hospital of Lianyungang affiliated to Bengbu Medical College. All experiments were performed according to the National Institutes of Health guide for the care and use of laboratory animals. Patients or their relatives were informed of the proper usage for the human samples and gave written consent before sample acquisition.
Acknowledgments
This work was partially supported by the Six Talents Peak Project of Jiangsu Province (2018-WSW-326); "Youth Science and Technology Project of Lianyungang Health Commission (QN1809).
Author Contributions
All authors contributed to data analysis, drafting or revising the article, gave final approval of the version to be published, and agree to be accountable for all aspects of the work.
Disclosure
The authors declare no conflict of interest in this work.
References
1. Siegel R, Ma J, Zou Z, Jemal A. Cancer statistics, 2014. CA Cancer J Clin. 2014;64(1):9–29. doi:10.3322/caac.21208
2. Chen W, Zheng R, Baade PD, et al. Cancer statistics in China, 2015. CA Cancer J Clin. 2016;66(2):115–132. doi:10.3322/caac.21338
3. Yu T, Chen X, Lin T, et al. KLF4 deletion alters gastric cell lineage and induces MUC2 expression. Cell Death Dis. 2016;7(6):e2255. doi:10.1038/cddis.2016.158
4. Li Q, Li Z, Wei S, et al. Overexpression of miR-584-5p inhibits proliferation and induces apoptosis by targeting WW domain-containing E3 ubiquitin protein ligase 1 in gastric cancer. J Exp Clin Cancer Res. 2017;36(1):59. doi:10.1186/s13046-017-0532-2
5. Wang Y, Fang R, Cui M, et al. The oncoprotein HBXIP up-regulates YAP through activation of transcription factor c-Myb to promote growth of liver cancer. Cancer Lett. 2017;385:234–242. doi:10.1016/j.canlet.2016.10.018
6. Lara-Pezzi E, Serrador JM, Montoya MC, et al. The hepatitis B virus X protein (HBx) induces a migratory phenotype in a CD44-dependent manner: possible role of HBx in invasion and metastasis. Hepatology. 2001;33(5):1270–1281. doi:10.1053/jhep.2001.1270
7. Molina-Jimenez F, Benedicto I, Murata M, et al. Expression of pituitary tumor-transforming gene 1 (PTTG1)/securin in hepatitis B virus (HBV)-associated liver diseases: evidence for an HBV X protein-mediated inhibition of PTTG1 ubiquitination and degradation. Hepatology. 2010;51(3):777–787. doi:10.1002/hep.23468
8. Yue L, Li L, Liu F, et al. The oncoprotein HBXIP activates transcriptional coregulatory protein LMO4 via Sp1 to promote proliferation of breast cancer cells. Carcinogenesis. 2013;34(4):927–935. doi:10.1093/carcin/bgs399
9. Redis RS, Vela LE, Lu W, et al. Allele-specific reprogramming of cancer metabolism by the long non-coding RNA CCAT2. Mol Cell. 2016;61(4):520–534. doi:10.1016/j.molcel.2016.01.015
10. Li J, Huang Q, Long X, et al. Mitochondrial elongation-mediated glucose metabolism reprogramming is essential for tumour cell survival during energy stress. Oncogene. 2017;36:4901–4912. doi:10.1038/onc.2017.98
11. Li Q, Pan X, Zhu D, Deng Z, Jiang R, Wang X. Circular RNA MAT2B promotes glycolysis and malignancy of hepatocellular carcinoma through the miR-338-3p/PKM2 axis under hypoxic stress. Hepatology. 2019;70(4):1298–1316.
12. Qin Y, Hu Q, Ji S, et al. Homeodomain-interacting protein kinase 2 suppresses proliferation and aerobic glycolysis via ERK/cMyc axis in pancreatic cancer. Cell Prolif. 2019;52(3):e12603. doi:10.1111/cpr.12603
13. Hamanaka RB, Chandel NS. Targeting glucose metabolism for cancer therapy. J Exp Med. 2012;209(2):211–215. doi:10.1084/jem.20120162
14. Gitenay D, Wiel C, Lallet-Daher H, et al. Glucose metabolism and hexosamine pathway regulate oncogene-induced senescence. Cell Death Dis. 2014;5:e1089. doi:10.1038/cddis.2014.63
15. Lin YH, Wu MH, Huang YH, et al. Taurine up-regulated gene 1 functions as a master regulator to coordinate glycolysis and metastasis in hepatocellular carcinoma. Hepatology. 2018;67(1):188–203. doi:10.1002/hep.29462
16. Nie H, Li J, Yang XM, et al. Mineralocorticoid receptor suppresses cancer progression and the Warburg effect by modulating the miR-338-3p-PKLR axis in hepatocellular carcinoma. Hepatology. 2015;62(4):1145–1159. doi:10.1002/hep.27940
17. Chen J, Yu Y, Chen X, et al. MiR-139-5p is associated with poor prognosis and regulates glycolysis by repressing PKM2 in gallbladder carcinoma. Cell Prolif. 2018;51(6):e12510. doi:10.1111/cpr.12510
18. Shi H, Fang R, Li Y, et al. The oncoprotein HBXIP suppresses gluconeogenesis through modulating PCK1 to enhance the growth of hepatoma cells. Cancer Lett. 2016;382(2):147–156. doi:10.1016/j.canlet.2016.08.025
19. Liu F, Zhang W, You X, et al. The oncoprotein HBXIP promotes glucose metabolism reprogramming via downregulating SCO2 and PDHA1 in breast cancer. Oncotarget. 2015;6(29):27199–27213. doi:10.18632/oncotarget.4508
20. Son J, Lyssiotis CA, Ying H, et al. Glutamine supports pancreatic cancer growth through a KRAS-regulated metabolic pathway. Nature. 2013;496(7443):101–105. doi:10.1038/nature12040
21. Hong SY, Yu FX, Luo Y, Hagen T. Oncogenic activation of the PI3K/Akt pathway promotes cellular glucose uptake by downregulating the expression of thioredoxin-interacting protein. Cell Signal. 2016;28(5):377–383. doi:10.1016/j.cellsig.2016.01.011
22. Zhao L, Mao Y, Zhao Y, Cao Y, Chen X. Role of multifaceted regulators in cancer glucose metabolism and their clinical significance. Oncotarget. 2016;7(21):31572–31585. doi:10.18632/oncotarget.7765
23. Li Z, Wang JW, Wang WZ, et al. Natriuretic peptide receptor A inhibition suppresses gastric cancer development through reactive oxygen species-mediated G2/M cell cycle arrest and cell death. Free Radic Biol Med. 2016;99:593–607. doi:10.1016/j.freeradbiomed.2016.08.019
24. Xiong Y, Sun F, Dong P, et al. iASPP induces EMT and cisplatin resistance in human cervical cancer through miR-20a-FBXL5/BTG3 signaling. J Exp Clin Cancer Res. 2017;36(1):48. doi:10.1186/s13046-017-0520-6
25. Cao Q, Liu F, Ji K, et al. MicroRNA-381 inhibits the metastasis of gastric cancer by targeting TMEM16A expression. J Exp Clin Cancer Res. 2017;36(1):29. doi:10.1186/s13046-017-0499-z
26. Li HM, Yang JG, Liu ZJ, et al. Blockage of glycolysis by targeting PFKFB3 suppresses tumor growth and metastasis in head and neck squamous cell carcinoma. J Exp Clin Cancer Res. 2017;36(1):7. doi:10.1186/s13046-016-0481-1
27. Kim NH, Cha YH, Lee J, et al. Snail reprograms glucose metabolism by repressing phosphofructokinase PFKP allowing cancer cell survival under metabolic stress. Nat Commun. 2017;8:14374. doi:10.1038/ncomms14374
28. Zubair H, Azim S, Srivastava SK, et al. Glucose metabolism reprogrammed by overexpression of IKKepsilon promotes pancreatic tumor growth. Cancer Res. 2016;76(24):7254–7264. doi:10.1158/0008-5472.CAN-16-1666
29. Zhao T, Zhu Y, Morinibu A, et al. HIF-1-mediated metabolic reprogramming reduces ROS levels and facilitates the metastatic colonization of cancers in lungs. Sci Rep. 2014;4:3793. doi:10.1038/srep03793
30. Ji S, Qin Y, Liang C, et al. FBW7 (F-box and WD repeat domain-containing 7) negatively regulates glucose metabolism by Targeting the c-Myc/TXNIP (thioredoxin-binding protein) axis in pancreatic cancer. Clin Cancer Res. 2016;22(15):3950–3960. doi:10.1158/1078-0432.CCR-15-2380
31. Liu F, You X, Wang Y, et al. The oncoprotein HBXIP enhances angiogenesis and growth of breast cancer through modulating FGF8 and VEGF. Carcinogenesis. 2014;35(5):1144–1153. doi:10.1093/carcin/bgu021
32. Liu S, Li L, Zhang Y, et al. The oncoprotein HBXIP uses two pathways to up-regulate S100A4 in promotion of growth and migration of breast cancer cells. J Biol Chem. 2012;287(36):30228–30239. doi:10.1074/jbc.M112.343947
33. Xu F, Zhu X, Han T, et al. The oncoprotein hepatitis B X-interacting protein promotes the migration of ovarian cancer cells through the upregulation of S-phase kinase-associated protein 2 by Sp1. Int J Oncol. 2014;45(1):255–263. doi:10.3892/ijo.2014.2411
34. Wang F, Fei H, Qi B, Yao S, Chang Z. Overexpression of hepatitis B x-interacting protein in HepG2 cells enhances tumor-induced angiogenesis. Mol Cell Biochem. 2012;364(1–2):165–171. doi:10.1007/s11010-011-1215-5
35. Cairns RA, Harris IS, Mak TW. Regulation of cancer cell metabolism. Nat Rev Cancer. 2011;11(2):85–95. doi:10.1038/nrc2981
36. Wang SJ, Gu W. To be, or not to be: functional dilemma of p53 metabolic regulation. Curr Opin Oncol. 2014;26(1):78–85. doi:10.1097/CCO.0000000000000024
37. Chen RJ, Wu PH, Ho CT, et al. P53-dependent downregulation of hTERT protein expression and telomerase activity induces senescence in lung cancer cells as a result of pterostilbene treatment. Cell Death Dis. 2017;8(8):e2985. doi:10.1038/cddis.2017.333
38. Wang G, Dong F, Xu Z, et al. MicroRNA profile in HBV-induced infection and hepatocellular carcinoma. BMC Cancer. 2017;17(1):805. doi:10.1186/s12885-017-3816-1
39. Li H, Liu Q, Wang Z, et al. The oncoprotein HBXIP modulates the feedback loop of MDM2/p53 to enhance the growth of breast cancer. J Biol Chem. 2015;290(37):22649–22661. doi:10.1074/jbc.M115.658468
40. Li H, Wang Z, Jiang M, et al. The oncoprotein HBXIP promotes human breast cancer growth through down-regulating p53 via miR-18b/MDM2 and pAKT/MDM2 pathways. Acta Pharmacol Sin. 2018;39(11):1787–1796. doi:10.1038/s41401-018-0034-6
41. Wang FZ, Fei HR, Lian LH, Wang JM, Qiu YY. Hepatitis B x-interacting protein induces HepG2 cell proliferation through activation of the phosphatidylinositol 3-kinase/Akt pathway. Exp Biol Med. 2011;236(1):62–69. doi:10.1258/ebm.2010.010179
 © 2020 The Author(s). This work is published and licensed by Dove Medical Press Limited. The full terms of this license are available at https://www.dovepress.com/terms.php and incorporate the Creative Commons Attribution - Non Commercial (unported, v3.0) License.
By accessing the work you hereby accept the Terms. Non-commercial uses of the work are permitted without any further permission from Dove Medical Press Limited, provided the work is properly attributed. For permission for commercial use of this work, please see paragraphs 4.2 and 5 of our Terms.
© 2020 The Author(s). This work is published and licensed by Dove Medical Press Limited. The full terms of this license are available at https://www.dovepress.com/terms.php and incorporate the Creative Commons Attribution - Non Commercial (unported, v3.0) License.
By accessing the work you hereby accept the Terms. Non-commercial uses of the work are permitted without any further permission from Dove Medical Press Limited, provided the work is properly attributed. For permission for commercial use of this work, please see paragraphs 4.2 and 5 of our Terms.