")
Back to Journals » Nature and Science of Sleep » Volume 13
Gut Microbiota in Patients with Type 1 Narcolepsy
Authors Zhang R, Gao S, Wang S, Zhang J , Bai Y, He S, Zhao P, Zhang H
Received 18 July 2021
Accepted for publication 17 October 2021
Published 6 November 2021 Volume 2021:13 Pages 2007—2018
DOI https://doi.org/10.2147/NSS.S330022
Checked for plagiarism Yes
Review by Single anonymous peer review
Peer reviewer comments 2
Editor who approved publication: Professor Ahmed BaHammam
Ruirui Zhang,1 Shanjun Gao,2 Shenghui Wang,3 Jiewen Zhang,1,3 Yingying Bai,3 Shuang He,3 Pan Zhao,3 Hongju Zhang1,3
1Department of Neurology, Henan Provincial People’s Hospital Affiliated to Henan University, Zhengzhou, Henan, People’s Republic of China; 2Microbiome Laboratory, Henan Provincial People’s Hospital, Zhengzhou, Henan, People’s Republic of China; 3Department of Neurology, Henan Provincial People’s Hospital Affiliated to Zhengzhou University, Zhengzhou, Henan, People’s Republic of China
Correspondence: Hongju Zhang
Department of Neurology, Henan Provincial People’s Hospital Affiliated to Henan University, Zhengzhou, Henan, People’s Republic of China
Email [email protected]
Purpose: To explore the characteristics of gut microbiota and its relationship between clinical manifestations in patients with type 1 narcolepsy (NT1).
Patients and Methods: Scale and polysomnography were performed in 20 NT1 patients and 16 healthy controls (HC group) to evaluate the clinical characteristics of NT1. Illumina sequencing was performed on bacterial 16S ribosomal RNA gene using V3-V4 regions to compare the fecal microbiota in all subjects. Associations between clinical characteristics and gut microbiota were analyzed using partial correlation analysis.
Results: Compared with the HC group, the NT1 group had a significantly higher ESS score, longer total sleep time, increased wakefulness, decreased sleep efficiency, disturbance of sleep structure, shorter mean sleep latency, and increased sleep-onset REM periods (all P < 0.05). No differences in alpha and beta diversity were observed between the two groups. In contrast, there were significant differences at the level of class, order, family, and genus (all P < 0.05). LEfSe analysis showed that the relative abundance of Klebsiella in the NT1 group was higher than that in the HC group (P < 0.05), while the relative abundance of Blautia, Barnesiellaceae, Barnesiella, Phocea, Lactococcus, Coriobacteriia, Coriobacteriales, Ruminiclostridium_5, and Bilophila were lower (all P < 0.05). Partial correlation analysis revealed that partial differential bacteria in the NT1 group were correlated with total sleep time, sleep efficiency, stage 1 sleep, arousal index, and sleep latency (all P < 0.05).
Conclusion: Our data revealed differences in intestinal flora structure between NT1 patients and the normal population, thus providing a theoretical basis for future microecological therapy for narcolepsy. However, future larger sample size studies and different study designs are needed to further clarify the possible pathogenesis and potential causality of intestinal flora in NT1 patients and explore the new treatment strategies.
Keywords: type 1 narcolepsy, gut microbiota, 16SrRNA, high throughput sequencing
Introduction
Narcolepsy is a rare sleep disorder characterized by excessive daytime sleepiness, cataplexy, sleep paralysis, and sleep hallucinations. Some patients may develop nocturnal sleep disturbance, obesity, mental and emotional disorders, and other problems.1–3 According to the content of hypocretin (Hcrt), narcolepsy can be divided into type 1 narcolepsy (NT1) (Hcrt concentration ≦ 110 pg/mL) and type 2 narcolepsy.4 NT1, which is believed to be an autoimmune disease mediated by T cells, irreversibly damages hypocretin neurons and reduces hypocretin content.5,6 Symptomatic drugs that stimulate the central nervous system are currently considered the only treatment that can help people with narcolepsy stay awake during the day.7
Narcolepsy is the result of the interaction between genetic and environmental factors. Previous studies have found that carrying the HLA-DBQ1-0602 gene can increase the risk of narcolepsy by 200 times,8 and up to 98% of NT1 patients are positive for this gene.9 Over recent years, studies have found that influenza A virus infection, vaccination, and streptococcal infection all increase the risk of narcolepsy.10–12 Streptococcus infection increases the narcolepsy risk by 5.4 times.13 In 65% of patients who recently experienced narcolepsy attack, serum anti-streptolysin O titers were increased,10 thus emphasizing the relevance of the infection factors in the role of narcolepsy onset.
High-throughput sequencing technology that uses 16S rRNA gene sequencing is a powerful method for detecting unculturable microorganisms in the gastrointestinal tract.14 The human gut contains 1000 to 1150 species of about 100 trillion bacteria, which are 10 times higher than the number of human cells and 150 times larger than the human gene complement in the body.15 Gut microbiota has a variety of physiological functions and is closely related to human health, affecting cell metabolism, digestion, nutrient absorption, and the development and maturation of the host’s immune system.16 Gut microbiota has also been closely associated with diseases of central nervous system, immune-related diseases, psychiatric diseases, metabolic diseases, and sleep disorders.17–24 More recently, it has been suggested that patients with narcolepsy are at high risk of gut microbiota dysregulation.23 LeComte et al23 reported reduced beta diversity in NT1 patients compared to HC patients. In this study, we explored the characteristics of intestinal microflora of Chinese NT1 patients by 16SrRNA gene sequencing technology so as to understand the effect of gut microbiota on NT1.
Patients and Methods
Study Population
From January 2017 to December 2019, 20 patients with narcolepsy (NT1 group) from the Department of Neurology, Henan Provincial People’s Hospital, and 16 healthy volunteers (HC group) were recruited. General information including age, sex, course of the disease, body mass index (BMI), Epworth Sleepiness Scale (ESS), and Hamilton Depression Scale (HAMD) were collected in both groups, and polysomnography (PSG), multiple sleep latency test (MSLT), Hcrt and HLA-DBQ1 * 0602 gene tests were performed. The NT1 was diagnosed according to the diagnostic criteria of the International Classification of Sleep Disorders (3rd edition).4 NT1 patients had no history of taking neuro stimulant drugs. Two patients were taking anticataplexy drug (venlafaxine) six months ago.
All subjects were from the same province and were eating similar diets. Subjects in the two groups did not take any drugs that could affect sleep, did not have gastrointestinal diseases, organic brain diseases, mental diseases, autoimmune diseases, or other major diseases, and did not take any antibiotics, probiotics, or prebiotics for at least one month before the examination. All subjects were able to provide stool samples.
PSG and MSLT
All subjects underwent sleep monitoring (PSG and MSLT) in our sleep center, in a quiet, comfortable, and temperature-controlled place. The monitoring contents included electroencephalogram, electroophthalmogram, electrocardiogram, chin and bilateral tibial anterior electromyogram, oral-nasal airflow, snoring, chest and abdominal movement, pulse oxygen, and body movement. Overnight nocturnal polysomnography was followed by multiple sleep latency tests the next day. A total of 5 naps were arranged with an interval of 2 hours each time, and patients were asked to get up and stay awake after each nap of 30 minutes. The monitoring results were automatically analyzed by the system and corrected by the sleep technician according to the Sleep and Related Events interpretation manual version 2.3.
Measurements of CSF Hcrt and HLA-DQB1*0602 Gene
The cerebrospinal fluid (CSF) samples were collected by lumbar puncture. CSF samples were snap-frozen and subsequently stored at −80°C until further analysis. CSF Hcrt was measured using a 125I radioimmunoassay kit (Phoenix Pharmaceuticals, Belmont, CA, USA).25 All samples were measured in duplicate, averaged, and compared to standard CSF samples with known CSF hcrt levels. The HLA-DQB1*0602-specific codon 9 amino acid was determined using PCR sequence-specific primer method.26 The presence of DQB1*0602 is reported as positive and absence as negative.
Collection and Sequencing of Fecal Samples
Collection of Fecal Samples
The stool samples of the NT1 and HC groups were collected by sterile fecal collection tubes in the hospital. The general procedure was as follows: first, urine was drained, and then 3–4 spoonfuls of feces were collected by sterile collection tubes. Then, the fecal samples were transported to GENEWIZ through dry ice for high-throughput sequencing of 16SrRNA.
DNA Extraction, Library Construction, and Illumina Sequencing
DNA was extracted from the samples using a DNA extraction kit according to manufacturer’s Protocols. DNA concentration was measured using the Equalbit dsDNA HS Assay Kit. Using 20–30ng DNA as a template, a series of PCR primers designed by GENEWIZ were used to amplify two hypervariable regions, including V3 and V4 on the 16S rDNA of prokaryotes. Then, a linker with Index was added to the end of the PCR product of 16S rDNA by PCR for Illumina sequencing. The library was purified by magnetic beads; the concentration was detected by a microplate reader, and the fragment size was detected by agarose gel electrophoresis. To quantify the library to 10nM, and PE250 double-ended sequencing was performed according to the instructions of Illumina Miseq (Illumina, San Diego, CA, USA) instrument. The sequence information was read by MiSeq Control Software (MCS).
Bioinformatics Analysis
After quality filtration, the chimeric sequence was removed, and the final sequence was used for OTU clustering. Sequence clustering was performed using the VSearch (1.9.6) (sequence similarity was set as 97%), and the 16S rRNA reference database used for comparison was SILVA 132. Then, the RDP classifier (Ribosomal Database Program) Bayesian algorithm was used to carry out taxonomic analysis on the representative sequences of OTU, and the community composition of each sample was counted at different species classification levels.
Based on the results of OTU analysis, the Alpha diversity index (ACE index, Chao index, Shannon index, Simpson index) of each sample was analyzed to obtain the species abundance and diversity information of each sample. Beta diversity analysis was visualized with Non-Metric Multidimensional Scaling (NMDS) to visually display the differences in community structure among different samples and groups. LEfSe analysis was used to identify statistically significant biomarkers between the two groups.
Statistical Analysis
General data, sleep parameters, and alpha diversity analysis were performed using SPSS 22 statistical software. Shapiro–Wilk normality test and homogeneity of variance test were performed on measurement data. Measurement data conforming to normal distribution and homogeneity of variance were expressed as mean±standard deviation ( ); two independent samples t-test were used. Measurement data conforming to normal distribution but not conforming to the homogeneity of variance were expressed as mean±standard deviation (
 ); two independent samples t' -test were used. Measurement data that did not conform to normal distribution were represented by median (quaternary)[M(Q25, Q75)], and the Mann–Whitney U-test was adopted. Counting data were expressed as cases and compared using Fisher’s exact probability method. Beta diversity was visualized with NMDS and compared statistically with Anosim. LEfSe online analysis tool was used to analyze the differences in community structure between groups and search for biomarkers with statistical differences. Partial correlation analysis was used to analyze the correlation between the clinical indicators and the differential flora in NTI patients. P < 0.05 was considered statistically significant. All data visualization was performed with the R statistical programming language.
Results
General Data
There were no statistically significant differences in age, gender, and BMI (all P > 0.05) between the NT1 group and HC group. The disease duration in the NT1 group was 3.0 (2.0, 7.0) years. The median BMI of the NT1 group was 25.7kg/m2 (overweight); 8 patients (40%) had normal BMI, 5 patients (25%) were overweight, and 7 patients (35%) were obese. The average ESS score of NT1 group was 18.0±3.9, which was statistically different compared with the HC group (P = 0.000). There was no statistically significant difference in HAMD scores between the two groups (P > 0.05) (Table 1).
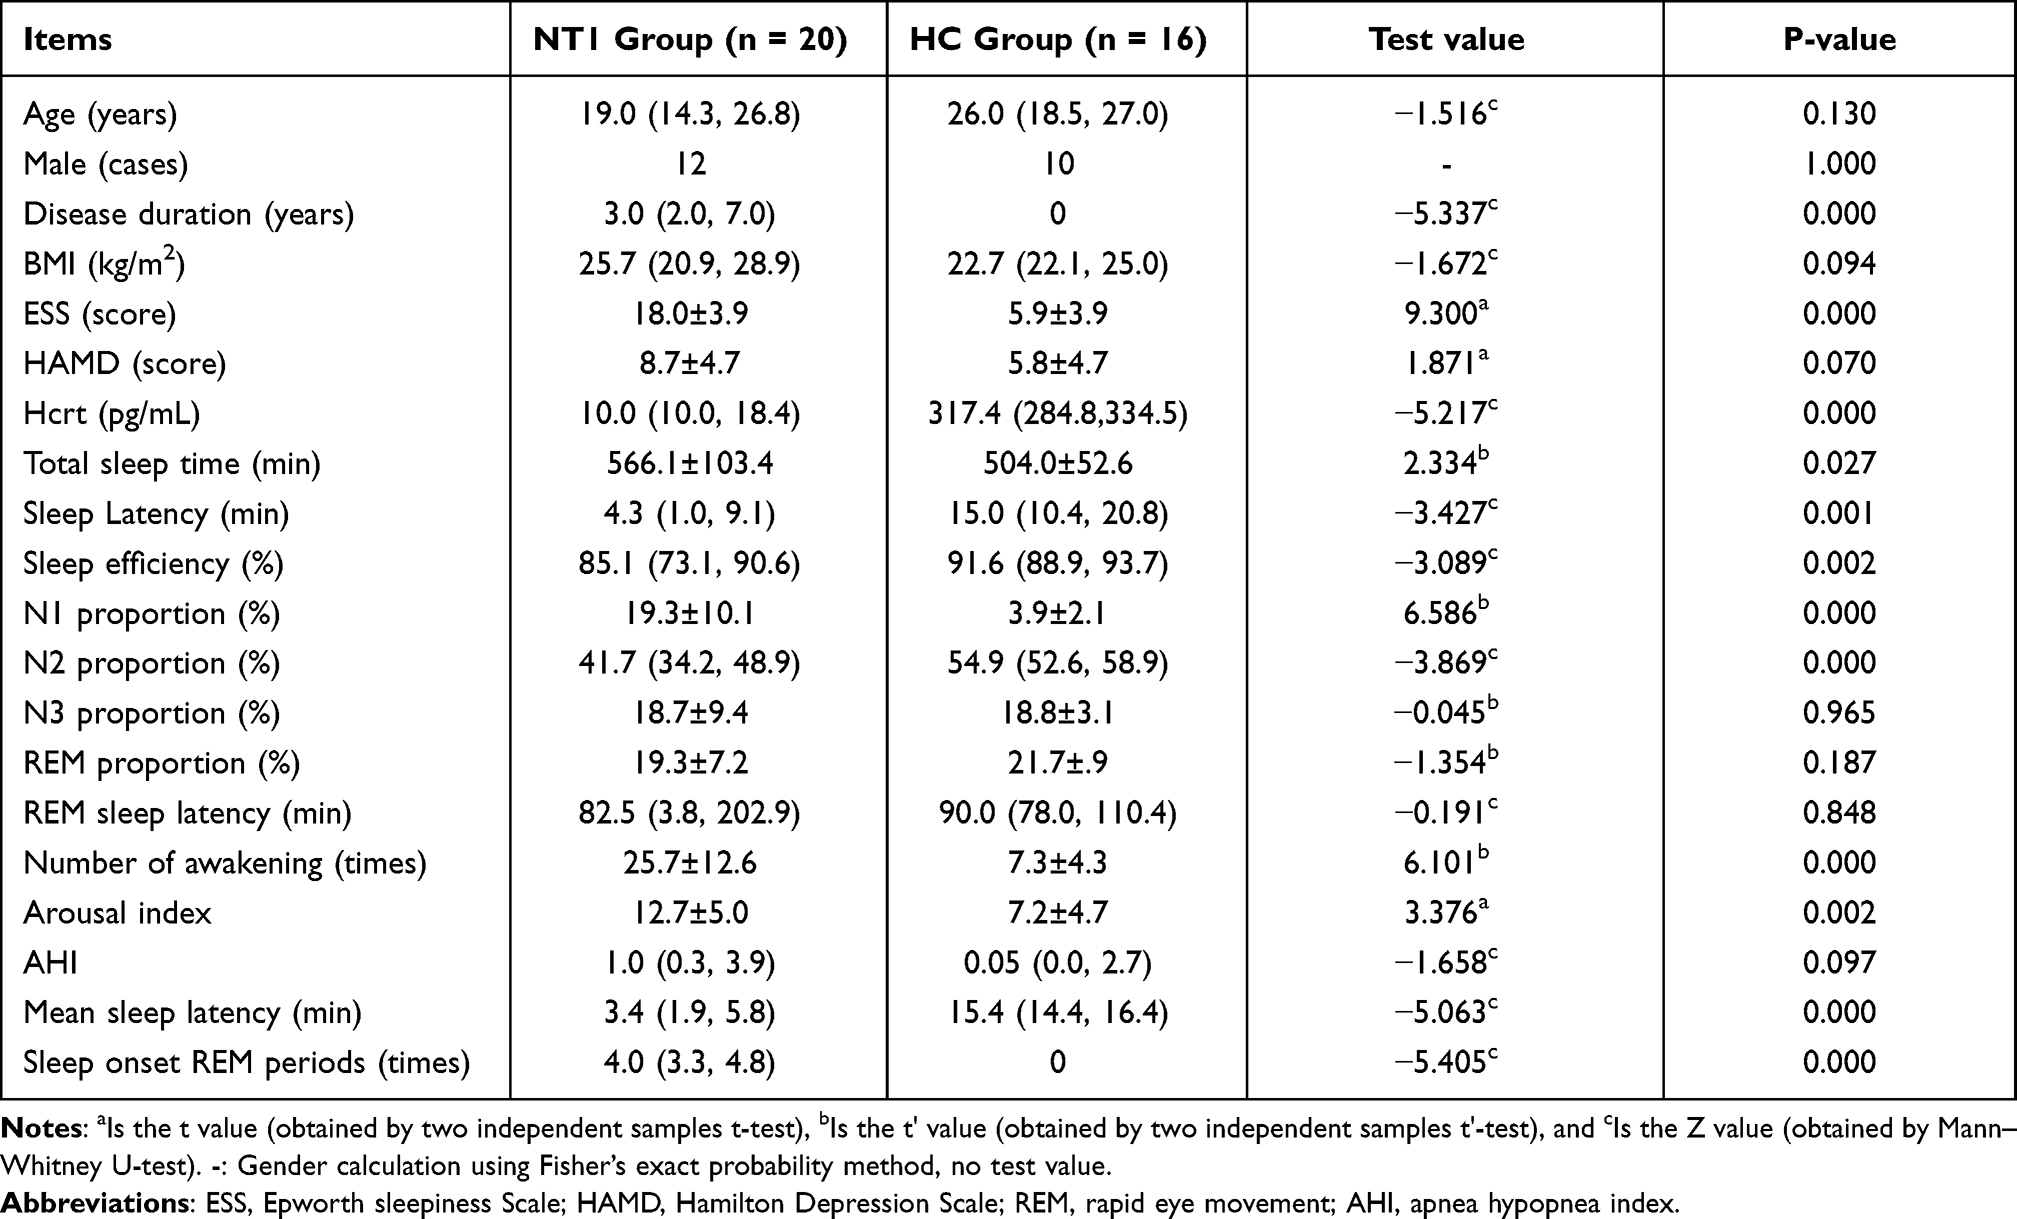 |
Table 1 Comparison of General Data and Sleep Parameters Between NT1 Group and HC Group |
PSG and MSLT
Patients with NT1 slept longer during the night, had a shorter nocturnal sleep latency, decreased sleep efficiency, increased proportion of stage 1 sleep, decreased proportion of stage 2 sleep, increased number of awakening and arousal index, shorter mean sleep latency, and increased SOREMPs compared to the HC group (all P < 0.05). There were no significant differences in the proportion of stage 3 sleep, REM sleep, REM sleep latency, and sleep apnea-hypopnea index (AHI) between the two groups (all P > 0.05). The detailed results are shown in Table 1.
Detection of CSF Hcrt and HLA-DQB1*0602 Gene
The level of Hcrt in CSF in all NT1 patients was <110pg/mL, with an average of 10.0 (10.0, 18.4) pg/mL. All NT1 patients were positive for the HLA-DQB1*0602 gene. While the CSF Hcrt of all control groups was >110pg/mL, with an average of 317.4 (284.8,334.5) pg/mL, and all were negative for the HLA-DQB1 *0602 gene (Table 1).
Analysis of Gut Microbiota
Alpha Diversity Analysis
Alpha diversity analysis was used to analyze the abundance and diversity of microorganisms in the sample. The abundance index, including the ACE index and Chao index, was positively correlated with microbial abundance. The diversity index included the Simpson index and Shannon index. Simpson index was negatively correlated with microbial diversity, while Shannon index was positively correlated with microbial diversity. As shown in Table 2, there was no statistically significant difference in alpha diversity between the two groups (P > 0.05).
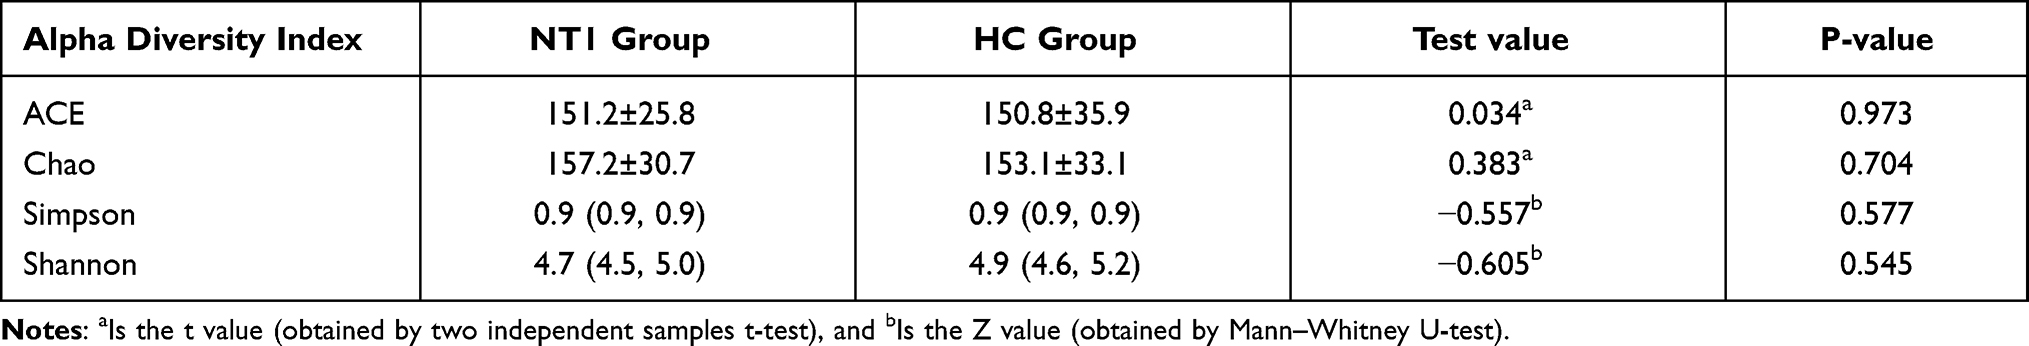 |
Table 2 Alpha Diversity Analysis |
Beta Diversity Analysis
Beta diversity reflects the difference in diversity between different samples and is an indicator that measures the similarity of microbial composition between individuals. Beta diversity, based on Bray-Curtis dissimilarity, was visualized with NMDS and compared statistically with Anosim. In Anosim analysis, the range of R-value was [−1, 1]; values closer to 0 indicated no significant difference between and within groups, while values closer to 1 indicated that the difference between groups was greater than the difference within groups. As shown in Figure 1, there was no statistically significant difference in beta diversity between the two groups (P = 0.634, R = −0.018).
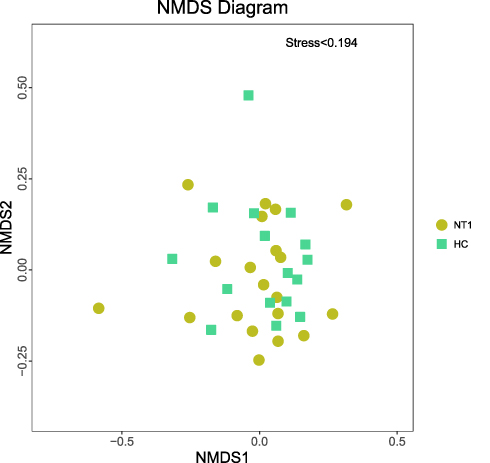 |
Figure 1 NMDS ordination plot. Each point in the figure represents a sample, the yellow point represents the NT1 group, and the green point represents the HC group. The closer the two points are, the more similar the microbial composition is. Stress < 0.2 indicates that NMDS can accurately reflect the degree of difference between samples. |
Differential Microbial Abundance Analyses
We used LEfSe27 analysis to identify differential microbiota between NT1 patients and the HC group. LEfSe analysis combines nonparametric Kruskal–Wallis, Wilcoxon rank-sum test, and Linear discriminant analysis (LDA) Effect Size. LEfSe analysis can directly carry out a statistical test and difference analysis on the classification level of phylum/class/order/family/genus/species simultaneously, and more emphasis is placed on finding robust differences between groups, namely biomarkers. In LEfSe analysis, there are two thresholds for screening marker species, ie, P < 0.05 and LDA ≥ 2 (default, the higher the LDA is, the more strict the LDA is). Only when these two conditions are met simultaneously, the taxon can be considered a marker species.
This analysis revealed significant differences in bacterial clades from class to species level (except phylum level) between NT1 patients and the HC group (Figures 2–4). In the NT1 group, the relative abundance of Klebsiella was higher than that in the HC group (LDA = 3.19, P = 0.047), while the relative abundance of Blautia, Barnesiellaceae, Barnesiella, Phocea, Lactococcus, Coriobacteriia, Coriobacteriales, Ruminiclostridium_5, and Bilophila were lower than that of HC group (all LDA > 2, P < 0.05) (Table 3).
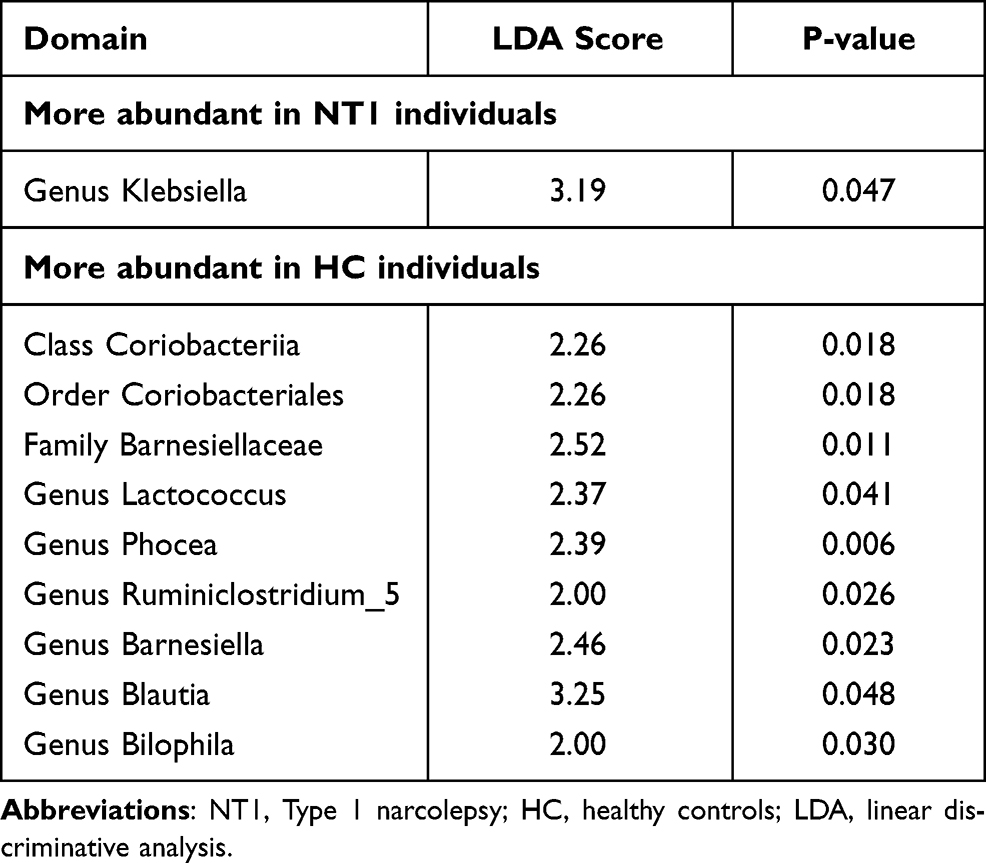 |
Table 3 Differential Microbial Abundance Analyses at Different Taxonomic Levels |
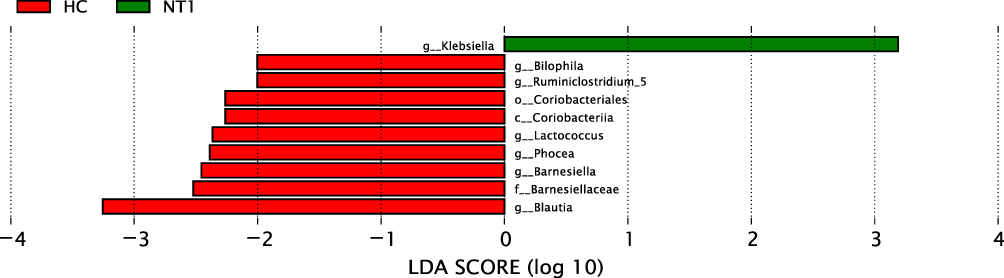 |
Figure 2 Histogram of LDA score distribution. This figure shows the significantly different species with LDA scores greater than the default (default 2.0). In the bar chart, the red represents the HC group, the green represents the NT1 group, and the length represents the LDA score, namely the contribution degree of the significantly different species to the different groups. |
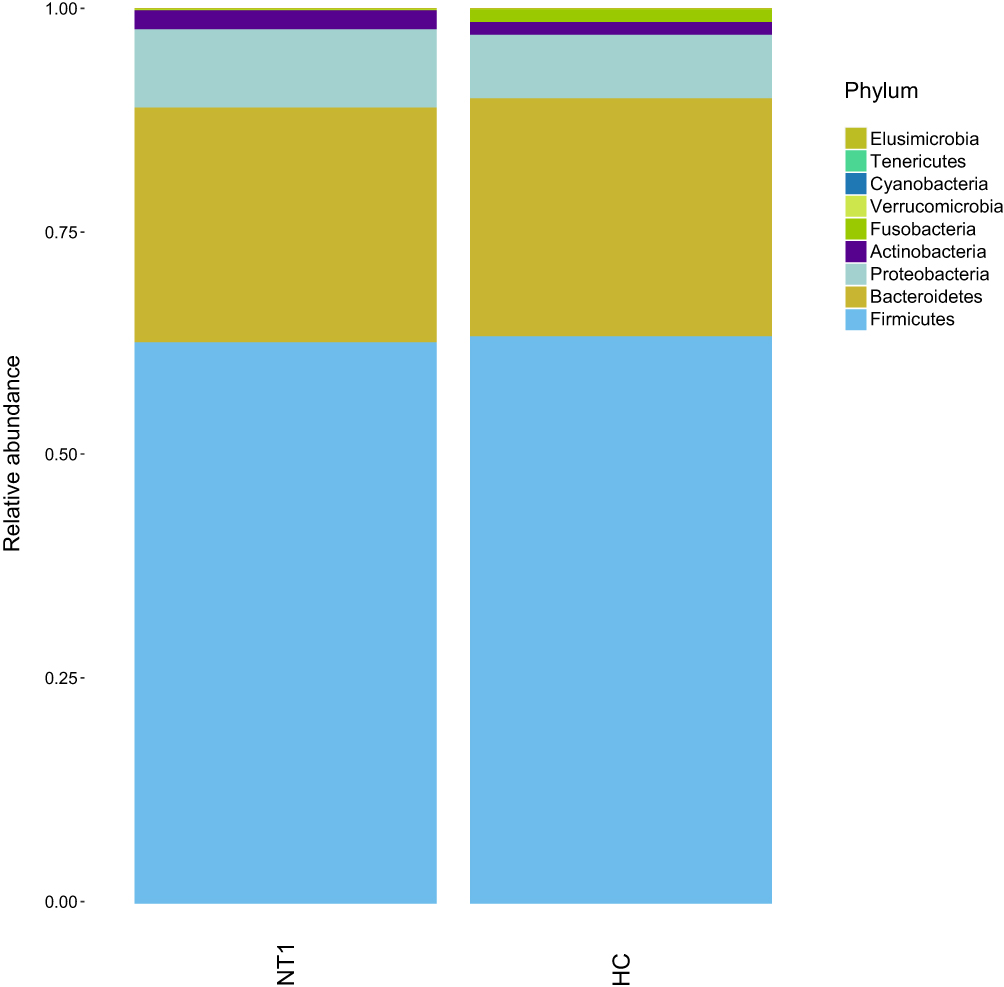 |
Figure 3 Histogram of species distribution at the phylum level. |
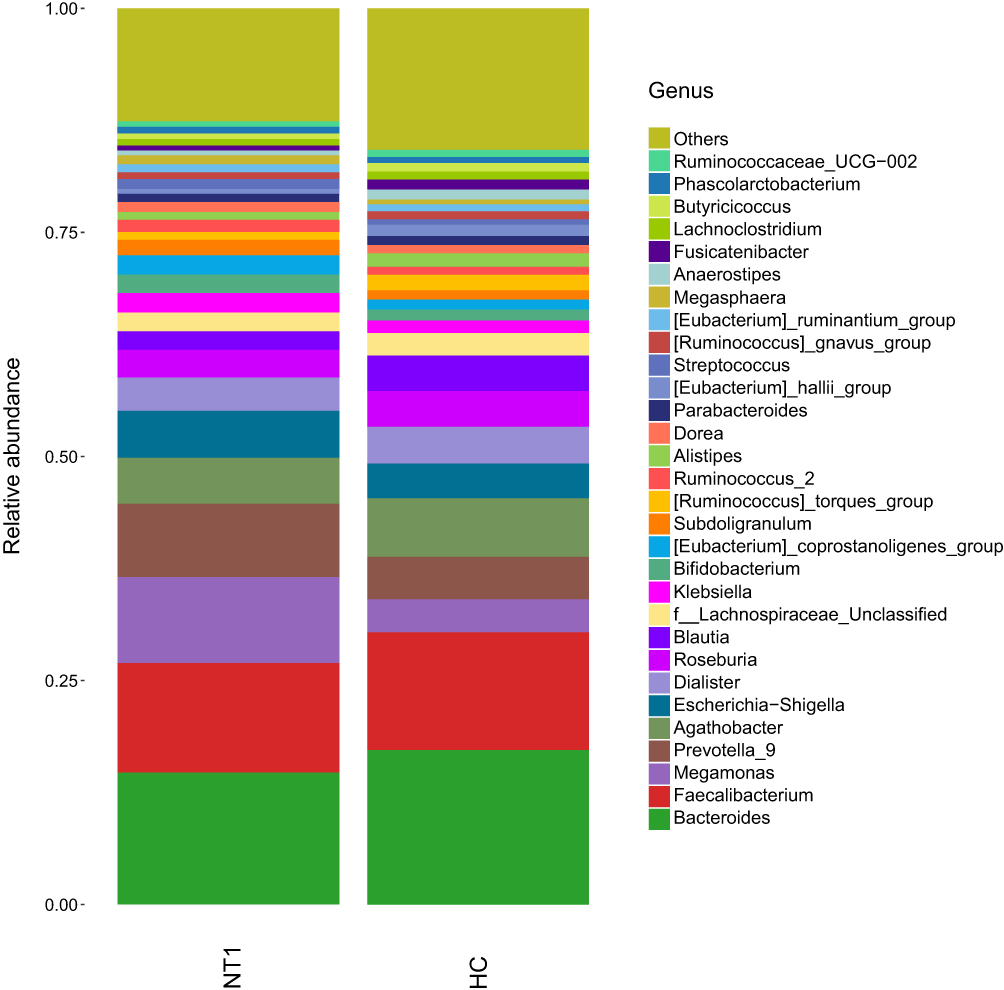 |
Figure 4 Histogram of species distribution at the genus level. |
Partial Correlation Analysis
Considering that gender, age, and course of the disease can affect the flora, the confounding factors were controlled, after which we conducted a partial correlation analysis between the differential flora and the clinical data (Sleep parameters and scale assessment) in NTI patients. The results showed that the Hcrt level was negatively correlated with the number of SOREMPs (r = −0.763; P < 0.05). The relative abundance of Coriobacteriales, Coriobacteriia, and Blautia were negatively correlated with total sleep time (r = −0.510, −0.510, −0.489; P < 0.05). The relative abundance of Coriobacteriales and Coriobacteriia were negatively correlated with sleep efficiency (r = −0.592, −0.592; P < 0.05). The relative abundance of Lactococcus was positively correlated with stage 1 sleep and negatively correlated with arousal index (r = 0.617, −0.522; P < 0.05). The abundance of Klebsiella was positively correlated with sleep latency (r = 0.547; P < 0.05).
Discussion
This study found significantly higher ESS score, longer total sleep time, increased wakefulness, decreased sleep efficiency, disturbance of sleep structure, shorter mean sleep latency, and increased sleep-onset REM periods in patients with NT1 compared to healthy controls. Moreover, there were no significant differences in alpha and beta diversity between the NT1 and HC groups; yet, a significant difference was found at the level of class, order, family, and genus between the two groups (except at the phylum level). The relative abundance of Klebsiella in the NT1 group was higher than that in the HC group, while the relative abundance of Blautia, Barnesiellaceae, Barnesiella, Phocea, Lactococcus, Coriobacteriia, Coriobacteriales, Ruminiclostridium_5, and Bilophila were lower than in the HC group. In addition, a partial correlation analysis showed that Hcrt was negatively correlated with sleep-onset REM periods; total sleep time was negatively correlated with the abundance of Coriobacteriales, Coriobacteriia, and Blautia; sleep efficiency was negatively correlated with Coriobacteriales and Coriobacteriia; Lactococcus was positively correlated with stage 1 sleep and negatively correlated with arousal index, and sleep latency was positively correlated with the abundance of Klebsiella.
Clinical and Electrophysiological Characteristics of NT1
The results of this study revealed no significant differences in age, gender, BMI, and HAMD scores between the NT1 group and HC group. Nevertheless, the ESS score of the NT1 group was significantly increased compared with that of the HC group. Previous studies have shown that patients with narcolepsy are more likely to be obese (their BMI was 10–20% higher than the general population).28–30 Our study revealed no significant difference in BMI between the two groups: the median BMI of the NT1 group was 25.7kg/m2 (representing overweight); 8 cases (40%) had normal BMI, 5 cases (25%) were overweight, and 7 cases (35%) were obese, which might be related to sample size. Previous studies have found that 30% of NT1 patients are accompanied by depression and other emotional problems,31 which is believed to be related to the effect the disease was having on patients.7 Yet, this was not found in this study; the inconsistencies may be related to the disease course (the average disease course is 3 years). Besides, the significant increase in ESS in this study indicated that NT1 patients suffer from daytime sleepiness.32
This study revealed that compared with the HC group, the NT1 group had longer total sleep time, shorter nocturnal sleep latency, decreased sleep efficiency, increased proportion of stage 1 sleep, decreased proportion of stage 2 sleep, increased number of awakening and arousal index, shorter mean sleep latency, and increased SOREMPs. There were no significant differences in the proportion of stage 3 sleep, REM sleep, REM sleep latency, and AHI between the NT1 group and the HC group. Previous studies have reported that NT1 patients have fragmented sleep, increased wakefulness, and disturbed sleep structure at night,2 which is consistent with the results of this study. In this study, the mean sleep latency of NT1 patients was 3.4 (1.9, 5.8) min, and the number of SOREMPs was 4.0 (3.3, 4.8) times, which met the international diagnostic standard of NT1.4 Previous studies reported that approximately 30% of NT1 patients were associated with Obstructive sleep apnea.33 This study did not find differences in AHI between NT1 and HC groups, which may be related to the fact that obesity was not obvious in NT1 patients in this study.
Gut Microbiota of NT1
In the present study, we found no changes in Alpha diversity and Beta diversity, which symbolize the homeostasis of gut microbes, between the NT1 patients and the HC group. The intestinal flora of the two groups were mainly composed of Firmicutes, Bacteroidetes, Proteobacteria, and Actinobacteria. Yet, the comparison between NT1 and HC groups at the level of class, order, family, and genus showed statistical differences; however, these differences accounted for a relatively low proportion in the whole, suggesting that overall intestinal microecology did not significantly change during NT1. The difference in some bacteria may be related to the disease duration. As a T cell-mediated immune disease, NT1 may go through great environmental changes at the beginning of the disease, which may lead to intestinal microbiota disturbance. Furthermore, with the extension of the disease duration, just like the infection indicators can only be detected in the recent onset of narcolepsy patients,10 intestinal microbiota changes may not be as obvious as at the beginning of the disease. Yet, due to the rarity of the disease and inadequate inspection equipment, narcolepsy is usually diagnosed in a later stage;34 thus, it is difficult to collect stool samples from disease onset.
LEfSe analysis identified statistically significant biomarkers between the two groups. It revealed that the relative abundance of Klebsiella was higher than that in the HC group, while the relative abundance of Blautia, Barnesiellaceae, Barnesiella, Phocea, Lactococcus, Coriobacteriia, Coriobacteriales, Ruminiclostridium_5, and Bilophila were lower than that in HC group. Klebsiella is a conditional pathogen and a pro-inflammatory bacterium found in the human intestine and respiratory tract, where it can cause bronchitis, pneumonia, meningitis, and other infectious diseases.35–37 Blautia is a gut microbial genus that produces butyric acid and acetic acid and has an anti-inflammatory effect.38 The increase of Klebsiella and the decrease of Blautia further suggest that the incidence of NT1 is related to the inflammatory response.
A previous study suggested that Coriobacteriia was associated with depressive symptoms in an inflammation model of depression,39 and Phocea has been associated with anxiety and motor function in Parkinson’s rats.40 Therefore, we speculated that emotional problems in NT1 patients might be related to these two bacteria.
Previous studies also found that the number of Barnesiella was positively correlated with lean body weight in mice (ie, fat-free body weight, mostly bone and muscle).41,42 Blautia was negatively correlated with visceral fat accumulation,43 and significantly decreased in obese children.38 Furthermore, Bilophila and Lactococcus have been shown to be related to obesity.44,45 The obesity in patients with NT1 may be mediated by the above four bacteria. Previous studies also found that intestinal Klebsiella, Blautia, and Ruminiclostridium_544 are all associated with inflammatory response, and NT1 with a genetic susceptibility,46,47 infection induction48,49 and T cell-mediated autoimmune disease.49 Gut microbiota can exert a great influence on the brain immune function through the brain-gut axis.50 The changes in the abundance of intestinal flora mentioned above may be involved in the pathogenesis of NT1.
Correlation Between Clinical Features of NT1 and Gut Microbiota
Since most patients with NT1 are accompanied by obesity, which is closely related to intestinal bacteria,17,51,52 we examined the relationship between obesity and intestinal bacteria of NT1, and BMI was not taken as a covariable in the present study. Partial correlation analysis was conducted between the different flora of NT1 and abnormal clinical features. We found that the Hcrt level was negatively correlated with the number of SOREMPs. Coriobacteriales, Coriobacteriia, and Blautia were negatively correlated with total sleep time; Coriobacteriales and Coriobacteriia were negatively correlated with sleep efficiency; Lactococcus was positively correlated with stage 1 sleep and negatively correlated with sleep arousal index; Klebsiella was positively correlated with sleep latency.
Previous studies have shown that NT1 patients have fragmented sleep at night and are prone to frequent awakenings.2 A low level of Hcrt can easily lead to sleep-wake instability,53 and sleep disruption may be one of the causes of daytime sleepiness.54 In this study, the content of Hcrt in the NT1 group was extremely low; Hcrt was negatively correlated with the number of SOREMPs, and the proportion of REM sleep at night was lower than that in the HC group, although there was no statistical difference. It is speculated that a low level of Hcrt leads to awakenings at night, frequent interruption of REM sleep at night, and more SOREMPs due to REM sleep pressure. At present, no study reported on sleep structure and the above different bacteria in NT1 patients. The different bacteria found in this study are mostly related to mood, obesity, and inflammation, and the association between these bacteria and sleep fragmentation is still unclear. In addition, inflammatory factors can lead to increased sleep.18 Further studies are needed to confirm whether inflammation-related bacteria in NT1 contribute to sleepiness symptoms. Furthermore, NT1 is a T-cell-mediated immune disease. Whether these inflammation-related bacteria have an important role in its onset needs to be confirmed in the acute phase of NT1. In this study, no statistically significant correlation was observed between depression score and mood-related microflora in NT1 patients, nor between BMI and obesity-related microflora, which may be related to the fact that there were no statistically significant differences in HAMD score and BMI between the two groups in the present study.
At present, only a few studies reported on the intestinal microbiota in NT1 patients,23 while there is still a lack of research on the intestinal microbiota of narcolepsy in China. LeComte et al23 found no statistically significant difference in alpha diversity between NT1 patients and the HC group, while beta diversity decreased in NT1 patients. Comparison of microbial abundance at different taxonomic levels revealed only a few differences in OTU levels, which were no longer statistically significant after adjusting for BMI values. This indicated that the overall intestinal microecology of NT1 patients does not significantly change, which is consistent with our conclusions. The reasons why Beta diversity analysis and differential microbial abundance analysis were inconsistent between these studies may be due to the following: first, recruited patients were from different countries; geographical location, ethnicity, diet, lifestyle, and other aspects may affect the composition of intestinal flora.55 Second, the BMI of NT1 patients enrolled in a previous study23 was higher than that of the control group, and the observed difference was statistically significant. Previous studies have found that obesity is closely related to the intestinal flora.17,51,52 Finally, unlike their study, none of our patients had recently taken medication for narcolepsy. According to some estimation, more than a quarter of 1000 drugs we used, most of which were not antibiotics, are likely to affect gut flora.56
This study has some advantages and limitations. The advantage of this study is that the diagnosis of the included patients was clear, and the Hcrt content of all the patients was less than 110pg/mL, which met the diagnostic criteria of NT1. All the patients came from our province, thus having similar dietary structures and no racial differences. None of the patients had recently taken drugs to treat NT1, ruling out the possible effects of drugs on intestinal microbes. The major study limitations are: firstly, the sample size was small; thus, a subgroup analysis was not carried out. However, the incidence of NT1 in the Chinese population has been reported to be only 0.033% (1 in 2500 people).57 The rarity of the disease proves the rationality of this study to explore the intestinal microbiota of NT1 in China on a small scale. In addition, our study lacks a detailed assessment of the lifestyle and diet of the subjects, lacks collection of inflammatory indicators in blood or cerebrospinal fluid, and fails to successfully include the control group with positive HLA-DBQ1*0602 gene, which may further improve the influence of confounding factors and deepen understanding of intestinal microbiota in the pathogenesis of NT1.
In conclusion, we found some differences in intestinal flora structure between NT1 patients and normal people, thus providing a theoretical basis for future microecological therapy for narcolepsy. However, future larger sample size studies and different study designs need to be carried out to further clarify the possible pathogenesis and potential causality of intestinal flora in NT1 patients and explore the new treatment strategies.
Data Sharing Statement
The datasets used or analyzed during the current study are available from the corresponding author on reasonable request.
Ethics Statements
The study was approved by the Ethics Committee of Henan Provincial People’s Hospital (No.2021141), and all participants signed written informed consent prior to participation. This study was conducted in accordance with the Declaration of Helsinki.
Acknowledgments
We thank all the neurology faculty for helping recruiting suitable subjects for this study. I would like to thank teacher Shuai Chen and senior sister apprentice Jing Zhao for answering questions and guidance in my paper writing. Thanks to Dr. Shanjun Gao for providing us with a place to store stool samples. Finally, we are also grateful to all GENEWIZ employees involved in the 16SrRNA gene sequencing.
Funding
This research has not received a specific grant from any funding agency in the public, commercial or profit-making sector.
Disclosure
All authors declare no conflict of interest.
References
1. Chabas D, Foulon C, Gonzalez J, et al. Eating disorder and metabolism in narcoleptic patients. Sleep. 2007;30(10):1267–1273. doi:10.1093/sleep/30.10.1267
2. Roth T, Dauvilliers Y, Mignot E, et al. Disrupted nighttime sleep in narcolepsy. J Clin Sleep Med. 2013;9(9):955–965. doi:10.5664/jcsm.3004
3. Parmar A, Yeh EA, Korczak DJ, et al. Depressive symptoms, sleep patterns, and physical activity in adolescents with narcolepsy. Sleep. 2019;42(8). doi:10.1093/sleep/zsz111.
4. Medicine AAOS. International Classification of Sleep Disorders: Diagnostic and Coding Manual.
5. Latorre D, Kallweit U, Armentani E, et al. T cells in patients with narcolepsy target self-antigens of hypocretin neurons. Nature. 2018;562(7725):63–68. doi:10.1038/s41586-018-0540-1
6. Pedersen NW, Holm A, Kristensen NP, et al. CD8+ T cells from patients with narcolepsy and healthy controls recognize hypocretin neuron-specific antigens. Nat Commun. 2019;10(1):837. doi:10.1038/s41467-019-08774-1
7. Cla B, Adamantidis A, Burdakov D, et al. Narcolepsy - clinical spectrum, aetiopathophysiology, diagnosis and treatment. Nat Rev Neurol. 2019;15(9):519–539.
8. Tafti M, Hor H, Dauvilliers Y, et al. DQB1 locus alone explains most of the risk and protection in narcolepsy with cataplexy in Europe. Sleep. 2014;37(1):19–25. doi:10.5665/sleep.3300
9. Liblau RS, Vassalli A, Seifinejad A, Tafti M. Hypocretin (orexin) biology and the pathophysiology of narcolepsy with cataplexy. Lancet Neurol. 2015;14(3):318–328. doi:10.1016/S1474-4422(14)70218-2
10. Aran A, Lin L, Nevsimalova S, et al. Elevated anti-streptococcal antibodies in patients with recent narcolepsy onset. Sleep. 2009;32(8):979–983. doi:10.1093/sleep/32.8.979
11. Dauvilliers Y, Montplaisir J, Cochen V, et al. Post-H1N1 narcolepsy-cataplexy. Sleep. 2010;33(11):1428–1430. doi:10.1093/sleep/33.11.1428
12. Han F, Lin L, Warby SC, et al. Narcolepsy onset is seasonal and increased following the 2009 H1N1 pandemic in China. Ann Neurol. 2011;70(3):410–417. doi:10.1002/ana.22587
13. Koepsell TD, Longstreth WT, Ton TG. Medical exposures in youth and the frequency of narcolepsy with cataplexy: a population-based case-control study in genetically predisposed people. J Sleep Res. 2010;19(1 Pt 1):80–86. doi:10.1111/j.1365-2869.2009.00756.x
14. Böttger EC. Rapid determination of bacterial ribosomal RNA sequences by direct sequencing of enzymatically amplified DNA. FEMS Microbiol Lett. 1989;53(1–2):171–176. doi:10.1111/j.1574-6968.1989.tb03617.x
15. Qin J, Li R, Raes J, et al. A human gut microbial gene catalogue established by metagenomic sequencing. Nature. 2010;464(7285):59–65. doi:10.1038/nature08821
16. Rooks MG, Garrett WS. Gut microbiota, metabolites and host immunity. Nat Rev Immunol. 2016;16(6):341–352. doi:10.1038/nri.2016.42
17. Turnbaugh PJ, Ley RE, Mahowald MA, Magrini V, Mardis ER, Gordon JI. An obesity-associated gut microbiome with increased capacity for energy harvest. Nature. 2006;444(7122):1027–1031. doi:10.1038/nature05414
18. Krueger JM, Opp MR. Sleep and microbes. Int Rev Neurobiol. 2016;131:207–225.
19. Poroyko VA, Carreras A, Khalyfa A, et al. Chronic sleep disruption alters gut microbiota, induces systemic and adipose tissue inflammation and insulin resistance in mice. Sci Rep. 2016;6:35405. doi:10.1038/srep35405
20. Zheng P, Zeng B, Zhou C, et al. Gut microbiome remodeling induces depressive-like behaviors through a pathway mediated by the host’s metabolism. Mol Psychiatry. 2016;21(6):786–796. doi:10.1038/mp.2016.44
21. Badran M, Mashaqi S, Gozal D. The gut microbiome as a target for adjuvant therapy in obstructive sleep apnea. Expert Opin Ther Targets. 2020;24(12):1263–1282. doi:10.1080/14728222.2020.1841749
22. Cryan JF, O’Riordan KJ, Sandhu K, Peterson V, Dinan TG. The gut microbiome in neurological disorders. Lancet Neurol. 2020;19(2):179–194. doi:10.1016/S1474-4422(19)30356-4
23. Lecomte A, Barateau L, Pereira P, et al. Gut microbiota composition is associated with narcolepsy type 1. Neurol Neuroimmunol Neuroinflamm. 2020;7(6):e896. doi:10.1212/NXI.0000000000000896
24. Yu L, Han X, Cen S, et al. Beneficial effect of GABA-rich fermented milk on insomnia involving regulation of gut microbiota. Microbiol Res. 2020;233:126409. doi:10.1016/j.micres.2020.126409
25. Mignot E, Lammers GJ, Ripley B, et al. The role of cerebrospinal fluid hypocretin measurement in the diagnosis of narcolepsy and other hypersomnias. Arch Neurol. 2002;59(10):1553–1562. doi:10.1001/archneur.59.10.1553
26. Mignot E, Young T, Lin L, Finn L. Nocturnal sleep and daytime sleepiness in normal subjects with HLA-DQB1*0602. Sleep. 1999;22(3):347–352.
27. Segata N, Izard J, Waldron L, et al. Metagenomic biomarker discovery and explanation. Genome Biol. 2011;12(6):R60. doi:10.1186/gb-2011-12-6-r60
28. Schuld A, Hebebrand J, Geller F, Pollmächer T. Increased body-mass index in patients with narcolepsy. Lancet. 2000;355(9211):1274–1275. doi:10.1016/S0140-6736(05)74704-8
29. Inocente CO, Lavault S, Lecendreux M, et al. Impact of obesity in children with narcolepsy. CNS Neurosci Ther. 2013;19(7):521–528. doi:10.1111/cns.12105
30. Rocca FL, Pizza F, Ricci E, Plazzi G. Narcolepsy during childhood: an update. Neuropediatrics. 2015;46(3):181–198. doi:10.1055/s-0035-1550152
31. Cohen A, Mandrekar J, St LEK, Silber MH, Kotagal S. Comorbidities in a community sample of narcolepsy. Sleep Med. 2018;43:14–18. doi:10.1016/j.sleep.2017.11.1125
32. Kallweit U, Schmidt M, Bassetti CL. Patient-reported measures of narcolepsy: the need for better assessment. J Clin Sleep Med. 2017;13(5):737–744. doi:10.5664/jcsm.6596
33. Rosenberg Russell,Hirshkowitz Max,Rapoport David M, Kryger Meir. The role of home sleep testing for evaluation of patients with excessive daytime sleepiness: focus on obstructive sleep apnea and narcolepsy. Sleep Med. 2019; 56:80–89.doi:10.1016/j.sleep.2019.01.014
34. Thorpy MJ, Krieger AC. Delayed diagnosis of narcolepsy: characterization and impact. Sleep Med. 2014;15(5):502–507. doi:10.1016/j.sleep.2014.01.015
35. Hui DS, Ip M, Ling T, et al. A multicentre surveillance study on the characteristics, bacterial aetiologies and in vitro antibiotic susceptibilities in patients with acute exacerbations of chronic bronchitis. Respirology. 2011;16(3):532–539. doi:10.1111/j.1440-1843.2011.01943.x
36. Achouiti A, de Vos AF, van ‘T Veer C, et al. Receptor for Advanced Glycation End Products (RAGE) serves a protective role during Klebsiella pneumoniae - induced pneumonia. PLoS One. 2016;11(1):e0141000. doi:10.1371/journal.pone.0141000
37. Liao H, Zhang Y, Guo W, et al. Characterization of the blood and cerebrospinal fluid microbiome in children with bacterial meningitis and its potential correlation with inflammation. mSystems. 2021;6(3):e0004921. doi:10.1128/mSystems.00049-21
38. Benítez-Páez A, Gómez DPEM, López-Almela I, Moya-Pérez Á, Codoñer-Franch P, Sanz Y. Depletion of blautia species in the microbiota of obese children relates to intestinal inflammation and metabolic phenotype worsening. mSystems. 2020;5(2). doi:10.1128/mSystems.00857-19
39. Huang N, Hua D, Zhan G, et al. Role of Actinobacteria and Coriobacteriia in the antidepressant effects of ketamine in an inflammation model of depression. Pharmacol Biochem Behav. 2019;176:93–100. doi:10.1016/j.pbb.2018.12.001
40. Jang JH, Yeom MJ, Ahn S, et al. Acupuncture inhibits neuroinflammation and gut microbial dysbiosis in a mouse model of Parkinson’s disease. Brain Behav Immun. 2020;89:641–655. doi:10.1016/j.bbi.2020.08.015
41. Everard A, Lazarevic V, Derrien M, et al. Responses of gut microbiota and glucose and lipid metabolism to prebiotics in genetic obese and diet-induced leptin-resistant mice. Diabetes. 2011;60(11):2775–2786. doi:10.2337/db11-0227
42. Fielding RA, Reeves AR, Jasuja R, Liu C, Barrett BB, Lustgarten MS. Muscle strength is increased in mice that are colonized with microbiota from high-functioning older adults. Exp Gerontol. 2019;127:110722. doi:10.1016/j.exger.2019.110722
43. Ozato N, Saito S, Yamaguchi T, et al. Blautia genus associated with visceral fat accumulation in adults 20–76 years of age. NPJ Biofilms Microbiomes. 2019;5(1):28. doi:10.1038/s41522-019-0101-x
44. Jiao N, Baker SS, Nugent CA, et al. Gut microbiome may contribute to insulin resistance and systemic inflammation in obese rodents: a meta-analysis. Physiol Genomics. 2018;50(4):244–254. doi:10.1152/physiolgenomics.00114.2017
45. Dahl WJ, Rivero MD, Lambert JM. Diet, nutrients and the microbiome. Prog Mol Biol Transl Sci. 2020;171:237–263.
46. Picchioni D, Mignot EJ, Harsh JR. The month-of-birth pattern in narcolepsy is moderated by cataplexy severity and may be independent of HLA-DQB1*0602. Sleep. 2004;27(8):1471–1475. doi:10.1093/sleep/27.8.1471
47. Shimada M, Miyagawa T, Toyoda H, Tokunaga K, Honda M. Epigenome-wide association study of DNA methylation in narcolepsy: an integrated genetic and epigenetic approach. Sleep. 2018;41(4). doi:10.1093/sleep/zsy019
48. Sarkanen T, Alakuijala A, Julkunen I, Partinen M. Narcolepsy associated with pandemrix vaccine. Curr Neurol Neurosci Rep. 2018;18(7):43. doi:10.1007/s11910-018-0851-5
49. Vuorela A, Freitag TL, Leskinen K, et al. Enhanced influenza A H1N1 T cell epitope recognition and cross-reactivity to protein-O-mannosyltransferase 1 in Pandemrix-associated narcolepsy type 1. Nat Commun. 2021;12(1):2283. doi:10.1038/s41467-021-22637-8
50. Morais LH, Schreiber HL, Mazmanian SK. The gut microbiota-brain axis in behaviour and brain disorders. Nat Rev Microbiol. 2021;19(4):241–255. doi:10.1038/s41579-020-00460-0
51. Fei N, Zhao L. An opportunistic pathogen isolated from the gut of an obese human causes obesity in germfree mice. ISME J. 2013;7(4):880–884. doi:10.1038/ismej.2012.153
52. van Son J, Koekkoek LL, La Fleur SE, Serlie MJ, Nieuwdorp M. The role of the gut microbiota in the gut-brain axis in obesity: mechanisms and future implications. Int J Mol Sci. 2021;22(6):2993. doi:10.3390/ijms22062993
53. Hansen MH, Kornum BR, Jennum P. Sleep-wake stability in narcolepsy patients with normal, low and unmeasurable hypocretin levels. Sleep Med. 2017;34:1–6. doi:10.1016/j.sleep.2017.01.021
54. Harsh J, Peszka J, Hartwig G, Mitler M. Night-time sleep and daytime sleepiness in narcolepsy. J Sleep Res. 2000;9(3):309–316. doi:10.1046/j.1365-2869.2000.00217.x
55. Gupta VK, Paul S, Dutta C. Geography, ethnicity or subsistence-specific variations in human microbiome composition and diversity. Front Microbiol. 2017;8:1162. doi:10.3389/fmicb.2017.01162
56. Maier L, Pruteanu M, Kuhn M, et al. Extensive impact of non-antibiotic drugs on human gut bacteria. Nature. 2018;555(7698):623–628. doi:10.1038/nature25979
57. Wing YK, Li RH, Lam CW, Ho CK, Fong SY, Leung T. The prevalence of narcolepsy among Chinese in Hong Kong. Ann Neurol. 2002;51(5):578–584. doi:10.1002/ana.10162
 © 2021 The Author(s). This work is published and licensed by Dove Medical Press Limited. The full terms of this license are available at https://www.dovepress.com/terms.php and incorporate the Creative Commons Attribution - Non Commercial (unported, v3.0) License.
By accessing the work you hereby accept the Terms. Non-commercial uses of the work are permitted without any further permission from Dove Medical Press Limited, provided the work is properly attributed. For permission for commercial use of this work, please see paragraphs 4.2 and 5 of our Terms.
© 2021 The Author(s). This work is published and licensed by Dove Medical Press Limited. The full terms of this license are available at https://www.dovepress.com/terms.php and incorporate the Creative Commons Attribution - Non Commercial (unported, v3.0) License.
By accessing the work you hereby accept the Terms. Non-commercial uses of the work are permitted without any further permission from Dove Medical Press Limited, provided the work is properly attributed. For permission for commercial use of this work, please see paragraphs 4.2 and 5 of our Terms.