")
Back to Journals » Open Access Journal of Clinical Trials » Volume 6
Growing risk avoidance in Asian oncology site selection: how trends in site selection are limiting growth of the Asia cancer trial landscape
Authors Horsburgh D, Lee Y, Lansang E, Lee K, Ogg M, Wai K
Received 28 August 2013
Accepted for publication 18 September 2013
Published 17 December 2013 Volume 2014:6 Pages 1—9
DOI https://doi.org/10.2147/OAJCT.S53670
Checked for plagiarism Yes
Review by Single anonymous peer review
Peer reviewer comments 3
Video abstract presented by David Horsburgh.
Views: 52
David Horsburgh,1 Yi-Chen Josey Lee,2 Elvira Zenaida Lansang,1 Ken J Lee,3 Malcolm Ogg,4 Karen Wai1
1Feasibility and Site Identification Asia, Quintiles East Asia Pte Ltd, Singapore; 2Feasibility and Site Identification Asia, Quintiles East Asia Pte Ltd, Taipei, Taiwan; 3Site Services Asia, Quintiles East Asia Pte Ltd, Singapore; 4Global Integrated Site Services, Quintiles, Green Park, Reading, Berkshire, United Kingdom
Background: Asia-Pacific represents the fastest-growing region for clinical trials, with growth in oncology studies being a strong contributor. Such demand has seen a rapid change in Asia's total site pool and the number of experienced and inexperienced, or naïve, sites being activated. Given the perceived risks involved with naïve sites, this study aims to investigate changes in the rate of naïve site selection and how this risk management may influence future growth within the region.
Methods: Rates of total naïve and experienced sites initiated per year, per protocol, and the relative contribution of each to the yearly site total were analyzed. Data was collected from Quintiles internal metrics as well as from the publicly available ClinicalTrials.gov database and was filtered to include oncology studies involving at least one Asian country, between the years 2000 and 2012.
Results and discussion: Despite a general increase in the number of sites activated overall, the contribution of naïve sites to the yearly total fell to 20% in 2012. Experienced sites were heavily favored, with reliance on the existing site network preferred to expansion through naïve sites. This is likely a result of the perceived challenges with using inexperienced sites and the industry desire to avoid this risk. However, fluctuations in naïve sites activation suggest that the limited level of growth in the site pool may not be enough to sustain demand, with sudden outreaches to naïve sites necessary as current site pool capacity is occasionally reached. This may cause a sudden period of high risk converse to the initial risk-avoidance strategy. On the basis of this analysis we propose an alternative site selection policy of steady site pool expansion through naïve site activation, combined with risk management policies. This constant managed-risk method could allow for greater prediction of site challenges and could provide the necessary site network as Asia continues to increase its contribution to the global clinical trial landscape.
Keywords: site, naïve, experienced, inexperienced, capacity, risk, site contribution, trend, growth, sustainable, oncology, landscape
Introduction
In recent years, the emergence of Asia as a major component of the global clinical trial landscape has become less about potential and more an accepted shift within the industry. Although still in its infancy given the perceived potential, growth in the region has been steadily increasing, while other more established areas have stagnated or declined.1–3 Financial considerations such as reduced per-patient costs and shortened recruitment timelines are often touted as the major drivers of this growth, along with access to a large, ethnically diverse population and new therapeutic markets.2–5 Oncology trials have been a major area of focus for this growth, joining cardiovascular and endocrinology trials as those most commonly located to the region.3 As of April 2013, 23% of all oncology trials in the ClinicalTrials.gov database involved Asian countries. This area is predicted to be an important high-growth market for clinical trials in the near future, due to rapidly aging populations across Asia and the growing influence of Western habits and lifestyles.4,6–8 The ethnic diversity present in the region also provides a unique opportunity for drug development, offering a way to work with higher disease incidences than may be seen in Europe or America.9
What is less well known is how this has affected trial conduct and particularly the selection of healthcare facilities, hereafter referred to as “sites.” Whereas less than a decade ago the small number of oncology trials taking place in Asia meant that the availability of experienced sites would have been limited, recent growth suggests that this is no longer the case.1,2,5 Pharmaceutical companies and contract research organizations looking to place oncology trials in the Asia-Pacific region can now select not only from naïve sites (those with no previous trial experience), but also from sites with past experience and proven performance. This is of importance in oncology trials, given their unique demands on resources, investigator experience and the challenges of patient recruitment.10,11 Therefore, the selection pattern between naïve and experienced sites presents an interesting insight into how the industry has expanded into Asia and also how to handle the expected growth in the region.
To investigate these patterns further, we utilized information from Quintiles’ internal database collected between 2000 and 2012 and data collected from ClinicalTrials.gov. Since 1993, Quintiles has conducted more than 900 trials in the Asia-Pacific region for pharmaceutical companies of all sizes. By highlighting the number of protocols, sites, and patients, this study aims to show the general trends in site selection across the last 12 years.
Methods
Data sources
Data were collected from Quintiles’ internal performance metrics database, filtered for oncology trials of all phases taking place between the years 2000 and 2012 in Asia-Pacific countries. In order to identify only those sites that were successfully initiated onto trials, the data were additionally filtered using the statuses “initiated,” “closed,” “dropped,” “enrollment closed,” and “enrollment open.”
For comparison to the industry as a whole, a separate data pull was performed using the ClinicalTrials.gov database, accessed in April 2013. All Phase I to Phase III oncology trials located in Asia-Pacific countries between 2000 and 2012 were collected for analysis. This analysis was performed independently of that using the Quintiles internal database information.
Calculation of yearly totals
The number of new protocols per year was determined using the earliest date of the final approved protocol listed in the database. A site list was then created according to the protocols selected in the previous filtering steps; sites that were either not fully initiated or that were currently still in startup were excluded. The remaining sites were given a year of “first activation,” taken directly from the earliest protocol date of the first protocol they conducted. Prior to this year, the site was considered naïve and after this “first activation,” the site was considered experienced. Therefore, initiation of a site for the first time was considered activation of a naïve site for that year, and further use of that site by new protocols later in the time period was considered the activation of an experienced site.
Yearly patient recruitment in oncology trials was calculated by using the “calculated enrollment date” for each patient. Patient numbers were tabulated for each year from 2000–2012.
Trends and data analysis
In order to protect Quintiles’ proprietary data, the yearly totals of new protocols, sites, and patients enrolled were converted to a percentage of the maximum value observed during the 12-year time period. This was done using the following calculation:

Linear regression and coefficient of determination (R2 value) was calculated using Microsoft Excel® (Microsoft Corporation, Redmond, WA, USA). A regression line was created to visualize the trends. The slope of this regression (trend line) then provided the average annual growth rate (AAGR), a measure that has been used in trend analyses of clinical trial globalization.12–14
Results
The number of oncology protocols initiated in Asian countries per year increased from 2000 to 2012 (Figure 1). The average annual growth rate in the overall number of sites initiated per year was 6.75%, with the growth rate in the number of experienced sites (8.10%) being higher than that of naïve sites (3.51%). The distribution of the data also varied between the two groups, with a larger R2 value (0.845) seen with the experienced site data. Data collected on the number of naïve sites per year had a small R2 value (0.175) and, rather than a steady increase towards the maximum observed value, three distinct peaks were seen in 2004, 2006, and 2011. These were followed by reductions in the naïve-sites-per-year value for the following year or for a number of subsequent years, as seen between 2007 and 2010.
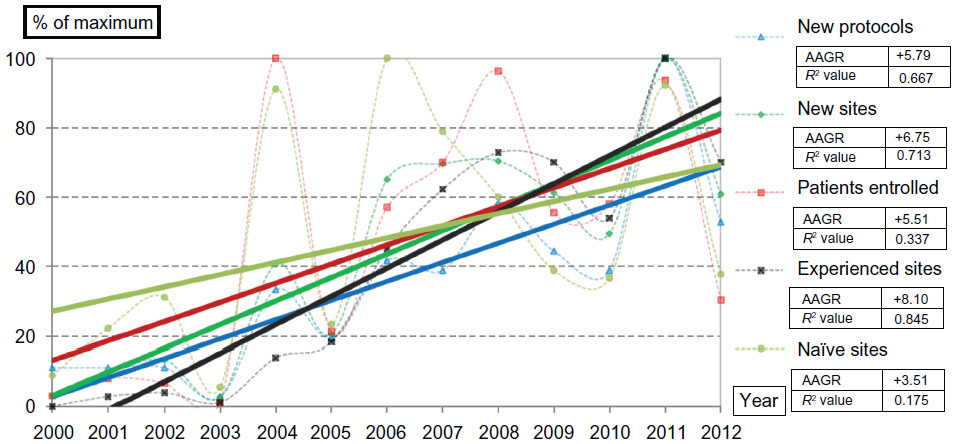 | Figure 1 Total value site trends: the number of new protocols each year between 2000 and 2012. |
The number of sites activated for each protocol increased over the observed period at a rate of 2.53% (Figure 2). However, differences were again seen when the data were broken down into experienced and naïve sites. The number of experienced sites activated per protocol was initially low before increasing to the highest observed values in 2007 and 2009. Again, the distribution of the experienced site data closely followed the expected trend line, with a strong increasing relationship (R2 value =0.729). The number of naïve sites activated on each protocol steadily declined over the 12-year period (AAGR =−3.78) from the highest observed value in 2002 to 23% of this value in 2012.
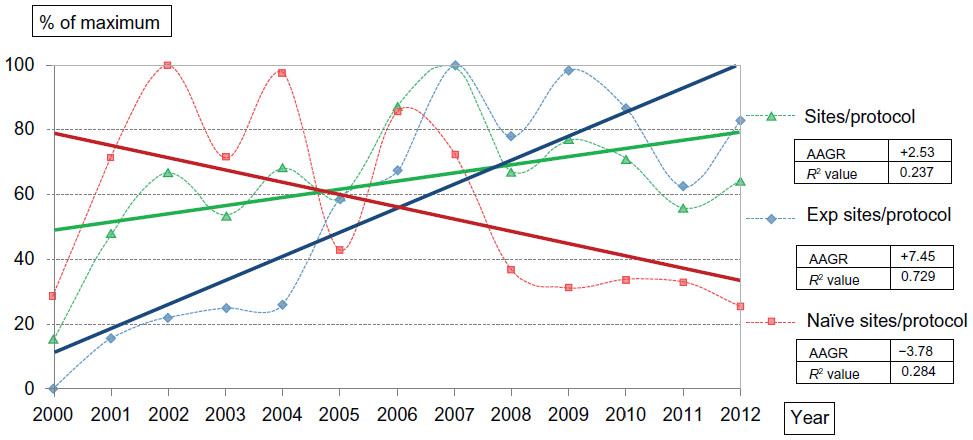 | Figure 2 Per protocol site trends: the number of all new sites, experienced sites, and naïve sites initiated per protocol, per year between 2000 and 2012. |
The contribution of experienced and naïve sites to the total number of sites activated per year also indicates a direct inverse relationship (Figure 3). At the beginning of the observed period, close to 100% of sites initiated on new studies were classified as naïve, with 0% percent considered to have past oncology experience. However, by the end of the observed period, the contribution of naïve sites to the yearly site total had fallen to 20%, with the majority of selected sites from 2007 onwards being considered experienced.
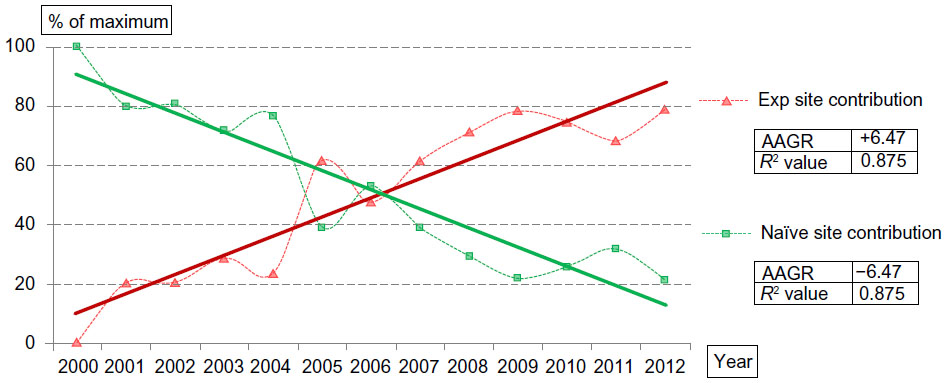 | Figure 3 Experienced versus naïve site contribution: the percentage of total new sites initiated per year between 2000 and 2012 that were considered either experienced or naïve for oncology trials. |
Data from ClinicalTrials.gov displayed similar increases in the number of protocols per year and total oncology sites initiated in the Asia-Pacific region. As seen with Quintiles’ internal data, the rate of increase in the number of sites activated was faster than the rate seen with the number of purely naïve sites, which remained almost constant across the observed period.
Another similarity was seen with the declining percentage contribution of naïve sites to the yearly site total. Although a smaller percentage of sites were originally considered naïve at the beginning of the 12-year period, a steady decline from 40% contribution in 2000 to less than 20% at the end of 2012 was evident.
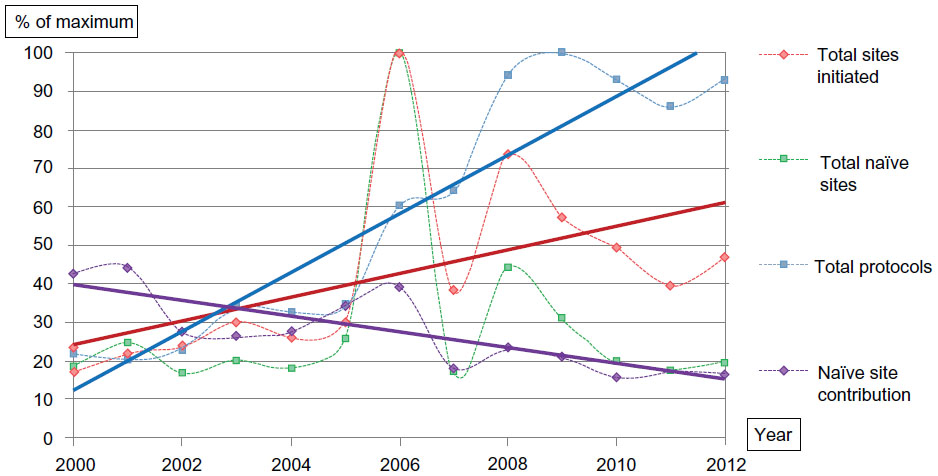
Trend lines from Figures 1 and 3 were extended beyond 2013 in order to visualize the impact of current rates on the Asian oncology site landscape (Figure 5). Using these extrapolated values, the rate of decline in naïve site contribution across the observed period will lead hypothetically to 0% inclusion of naïve sites between 2014 and 2015. It is expected that the number of protocols, total sites, and patients enrolled will increase. The disparity creates a potentially growing deficit in site capacity, as indicated by the highlighted area.
 | Figure 4 Site selection trends from ClinicalTrials.gov database between 2000 and 2012. |
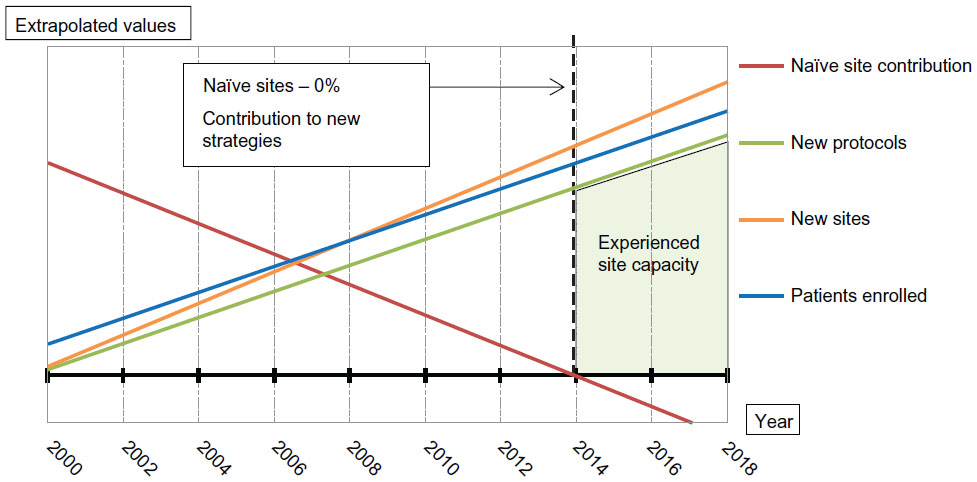 | Figure 5 Predicted industry trends in oncology against naïve site contribution. |
In comparison to the more consistent increases seen with the experienced site data, changes in the total number of naïve sites displayed a more fluctuating pattern, with rapid increases seen in 2004, 2006, and 2011 followed by significant decreases in the following years (Figure 6). The number of naïve sites activated per protocol followed a similar pattern, although it decreased rather than increased over the observed period.
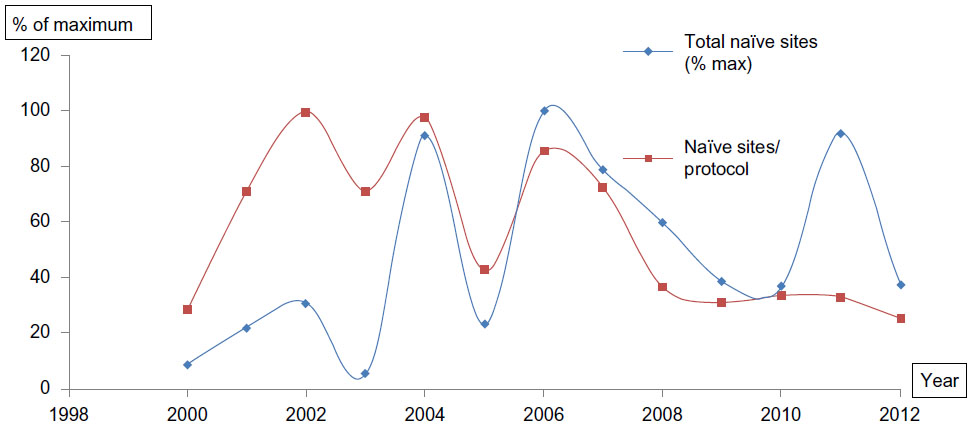 | Figure 6 Fluctuating pattern of naïve site growth between 2000 and 2012. |
Discussion
Asian oncology: a growing force
As of April 2013, more than 9,000 ongoing studies in Asian countries were listed in the ClinicalTrials.gov database, amounting to 20% of the global clinical trial landscape. Of these Asia studies, 27% were Phase I, Phase II, or Phase III oncology trials. These numbers were mirrored in Quintiles’ internal databases, with oncology trials making up one quarter of all of Quintiles’ ongoing studies. Additionally, slightly less than 10% of all patients enrolled during the observed period were involved in oncology studies.
As had been expected, all three of the industry indicators assessed (the number of protocols, sites initiated, and patients enrolled per year) showed a steady upward trend in Figure 1. Of particular significance is the positive trend in the number of new protocols (AAGR =+5.49), which exists as a result of the increased outsourcing towards the region and the expansion of local sponsors.1,4,6 The growth in site numbers (AAGR =+6.75) and recruitment (AAGR =+5.51) therefore supported the necessary adjustment in capacity, used here to describe the limits of site resources and recruitment potential, as Asian countries are expected to contribute a greater amount to the global landscape. In addition to the general trends, the yearly values of all three of the data sets follow a similar distribution pattern, with a period of relatively little growth followed by a marked increase occurring between 2004 and 2006. This is again in line with previous trend analyses that have identified this as a period of general increase in the Asian trial landscape, rather than in just oncology alone.2,3
Increasing reliance on experienced sites
As the overall number of sites initiated per year has increased, the number of those classified as both naïve and experienced has increased as well. However, the rate at which the number of experienced sites per year has increased (AAGR =+8.10) is significantly higher than that for naïve sites (AAGR =+3.51). Additionally, when broken down per protocol as in Figure 2, the number of naïve sites has actually declined year-on-year over the observed period (AAGR =−3.78), while the number of experienced sites being initiated showed a strong increase (AAGR =+7.45). This suggests that oncology-experienced sites are regularly favored during the site selection process, a detail that is further emphasized in Figure 3 by the contribution of either naïve or experienced sites to the overall number initiated. This shows a clear inverse relationship, with only 20% of all sites in 2012 classified as naïve – a significant decline from what was observed earlier on. The cross-over point at which experienced sites became the major contributors to new strategies was between 2006 and 2007.
This trend is not unexpected, as the activation of naïve sites directly increases the pool of experienced sites available. Therefore, the experienced site pool becomes large enough that it allows later studies to be conducted using more of these sites or experienced sites alone. What is highlighted, however, is the impact of potential risk, with this concept perhaps even more evident in oncology than other therapeutic areas due to the severity of the patient’s condition.10,11 From an operational perspective, experienced sites are often thought to offer reduced training costs and startup times, as well as familiarity with safety protocols and International Conference on Harmonisation/Good Clinical Practice guidelines.15–18 This is of particular importance due to the development of complex regulatory structures and punishments for protocol violations, potentially deterring associations with inexperienced investigators.19,20 Overall, experienced sites are considered to offer less risk, and this general risk avoidance appears to be a primary driver in site-selection strategies.
This same trend was seen using both Quintiles’ internal database and the publically available data from ClinicalTrials.gov, indicating the industry-wide nature of this pattern. The contribution of naïve sites to yearly site totals in Figure 4 not only displayed a similar decreasing movement, but the 2012 value from ClinicalTrials.gov was actually lower than it was with Quintiles-only studies.
Challenges ahead
The growth of the oncology trial landscape in Asia looks set to continue increasing. The region still provides a large population of trial-naïve patients and, importantly for oncology studies, rapidly aging populations with increasing prevalence of Western lifestyle-associated habits and conditions.4,7,8 The associated timeline benefits, significant cost benefits in less commonly utilized countries, and other regulatory and marketing incentives suggest that Asia is still an attractive destination for these trials.4,13,21
The effect of these attractive attributes of Asia will be further growth in the demand for patients and sites as the region is asked to contribute a larger amount toward the global landscape. This will only be feasible if matched to additional increases in the general capacity of Asian countries to host oncology trials. Yet given the current selection trends shown in Figure 5, it is possible that new studies may be close to being entirely reliant on existing experienced sites as early as 2014.
This shift away from the activation of new naïve sites means that the current experienced-site pool will have to increase capacity internally year-on-year, in order to deal with growing demand. One such method would be to improve the level of efficiency at the site level, particularly in patient accrual, which has unique challenges in oncology studies.11,15,22 Another would be the lateral expansion of oncology indications at each site, increasing the number of studies possible without growing the number of sites. However, both would only provide a short-term solution. As we near maximum capacity in patient numbers and site resources, the additional strain may negatively impact quality and safety and may even negate some of the cost and timeline benefits of the region. In the longer term it will be necessary to increase the number of sites available.
Rather than a steady increase in the site pool over time, the individual data points from both the total naïve sites activated per year and naïve sites per protocol suggest that new site activation occurs in a fluctuating pattern. As is shown with the peaks in Figure 6, the level of risk-avoidance slows the growth of the site pool to the point where maximum capacity of the current site pool is reached and the industry then undergoes a sudden readjustment in site selection, with a large outreach to naïve sites. As a consequence, potential risks associated with naïve sites may be magnified and the short-term operational benefits that originally led to the bias toward experienced sites may actually become negated by the sudden outreach.
Steady naïve site selection
Although quality, safety, and performance are factors in site selection,23 the concern with the observed level of risk aversion is that it is not sustainable with the growth rates present in the Asia-Pacific region. There is a possibility that the current number of experienced sites will not be able to provide the necessary capacity in the long term, regardless of increased efficiency at the sites themselves. Over the observed period, a pattern of sudden increases in naïve site selection existed whenever the assumed demands on experienced sites reached a critical point. This appears to have been sufficient to expand the experienced site pool to handle additional trials for the next few years, before the cycle repeated itself. It appears likely that we are approaching this critical point once again, and another hasty outreach to naïve sites will have to occur. In effect, the current risk-avoidance mindset is giving rise to a cycle of low-risk periods followed by a forced period of very high risk.
In order to better prepare the region for the expected increase in capacity while limiting potential risk, an alternative methodology would be expansion of the experienced site pool through the consistent initiation of naïve sites. This strategy would involve the conscious inclusion of a portion of naïve sites per protocol, ideally at a rate relative to the expected growth of trial numbers and general demand on the region. This could also include risk-management strategies such as mentoring schemes and training programs between experienced and naïve investigators, better preparing the new sites prior to actual initiation.15,18 Rather than the cycle of low–high risk, constantly minimized and appropriately managed risk would arguably be beneficial, providing the necessary increase in capacity without the consequences of sudden readjustments. However, implementing such a change at an industry level would require a joint effort from all parties involved and the switch from the current short-term mindset of complete risk avoidance to a long-term view of sustainability.
Conclusion
The data in this study represents a top-level analysis of the Asian oncology trial landscape, developed from Quintiles’ internal databases. The extrapolation of industry metrics beyond the observed period is purely hypothetical according to existing trends in the literature relating to Asia’s growing contribution to clinical trials. Furthermore, as the aim was to investigate the overall oncology landscape, the data look only at a regional level and do not display individual country trends. As Asia contains both highly developed and developing countries, it is important to note that these data may not be representative of the landscape in each specific country; however, this could provide a potential basis for future investigation.
The data suggest the need for a fundamental change in the way sites are developed for oncology trials, and particularly on the concept of risk in site selection. The current strategy of minimizing risk on a protocol-by-protocol basis may not be sustainable. An approach using managed risk in direct relation to site capacity need could provide a consistent way to grow Asia’s oncology site pool. Perhaps key to this argument will be a good understanding of the risks involved with selection of naïve sites. Currently, the lack of published literature on the performance and safety of naïve versus experienced sites, particularly in a challenging area such as oncology, makes it difficult to quantify the benefits of a constant-risk strategy. Further investigation into this relationship may be necessary before an industry-wide mindset change can be considered.
Acknowledgments
We would like to thank Alban Fabre for his advice on statistical analysis, and Willis Lau and Xu Su for their support with data collection and background research.
Author contributions
KW, KJL, YCJL and DH formulated the concept of this investigation, and KW and DH participated in the design and monitoring of progress. DH conducted the data collection from the Quintiles and ClinicalTrials.gov databases and well as the statistical analysis and development of results. DH drafted the manuscript, with KW reviewing and overseeing the process. MO also reviewed the drafts and provided valuable feedback on the interpretation of the results. All authors made substantial contributions to data generation and analysis, drafting or critical revision of the manuscript, and approval for the final version to be published.
Disclosure
All authors have completed the International Committee of Medical Journal Editors uniform disclosure form and declare that, at the time of writing, all authors of this manuscript were currently employed by Quintiles, a provider of clinical trial services for biopharmaceutical companies worldwide. All authors also work directly in the field of site selection for studies but have no direct links to these biopharmaceutical companies. The authors report no other conflicts of interest in this work.
References
Karlberg JPE. The establishment of emerging trial regions. Clinical Trial Magnifier. 2011;4(1):7–23. | |
PricewaterhouseCoopers (2010) – Trends in Asia Clinical Outsourcing. | |
Karlberg JPE. Asia clinical trial trends by type of sponsor, trial phase, disease area and country. Clinical Trial Magnifier. 2011;4(2):53–68. | |
Price Waterhouse Coopers. The Changing Dynamics of Pharma Outsourcing in Asia: Are You Readjusting Your Sights? 2008. Available from: http://www.pwc.be/en/pharma/the-changing-dynamics-of-pharma-outsourcing-in-asia.pdf. Accessed September 18, 2013. | |
Applied Clinical Trials Online. Conducting clinical trials in Asia [homepage on the Internet]. Iselin, NJ: Advanstar Communications; 2013. Available from: http://www.appliedclinicaltrialsonline.com/appliedclinicaltrials/article/articleDetail.jsp?id=334577. Accessed September 18, 2013. | |
Wong E. Clinical trials in Southeast Asia: an update. Drug Inf J. 2009;43(1):57–61. | |
Saw C, Shogan J. Frontiers of cancer care in Asia-Pacific Region. Biomed Imaging Interv J. 2008;4(3):e45. | |
Pharma IQ. Will Asia become the global hub for oncology clinical trials? [homepage on the Internet]. London, UK: 2011. Available from: http://www.pharma-iq.com/clinical/articles/will-asia-become-the-global-hub-for-oncology-clini/#.UVDuLjfeBU4. Accessed September 18, 2013. | |
Iwasaki M, Hinotsu S, Katsura J. Clinical trials and approvals of anti-cancer agents. Jpn J Clin Oncol. 2010;40(Suppl 1):i65–i69. | |
Prabhakar VR. Global Clinical Trials in Asia: Challenges and Opportunities. Horsham, PA: Drug Information Association; 2010. Available from: http://www.diahome.org/productfiles/22993/day3/402/s402 01_vijay prabhakar.pdf. Accessed September 18, 2013. | |
DAVA Oncology. Patient Recruitment in Cancer Clinical Trials. A DAVA Oncology White Paper. DAVA Oncology: Dallas, TX; 2012. Available from: http://www.davaonc.com/assets/pdf/DIA2012White Paper.pdf. Accessed September 18, 2013. | |
Hartmann M. Impact assessment of the European Clinical Trials Directive: a longitudinal, prospective, observational study analyzing patterns and trends in clinical drug trial applications submitted since 2001 to regulatory agencies in six EU countries. Trials. 2012;13:53. | |
Thiers FA, Sinskey AJ, Berndt ER. Trends in the globalization of clinical trials. Nature Rev Drug Discov. 2008;7(1):13–14. | |
Getz KA. Global clinical trial activity in the details [homepage on the Internet]. Iselin, NJ: Applied Clinical Trials Online; 2007. Available from: http://appliedclinicaltrialsonline.findpharma.com/appliedclinicaltrials/article/articleDetail.jsp?id=453243&sk=&date=&pageID=3&searchStrin=global trials. Accessed September 18, 2013. | |
Mills I. Productive Partnering – The Next Stage in Patient Recruitment for Clinical Trials. Sausalito, CA: Caribou Publishing; 2008. Available from: http://obroncology.com/documents/OBR_nov08_PP.pdf. Accessed September 18, 2013. | |
US Food and Drug Administration. Guidance for Industry, Investigator Responsibilties – Protecting the Rights, Safety, and Welfare of Study Subjects. Silver Spring, MD: US Department of Health and Human Services; 2009. Available from: http://www.fda.gov/downloads/Drugs/GuidanceComplianceRegulatoryInformation/Guidances/UCM187772.pdf. Accessed September 18, 2013. | |
Schulz G. Clinical trial in Asia: opportunities and challenges [homepage on the Internet]. Wanchai, Hong Kong: Zuellig Pharma Asia Pacific Ltd; 2012. Available from: http://www.zuelligpharma.com/news/clinical-trial-asia-opportunities-and-challenges. Accessed September 18, 2013. | |
Baer AR, Bridges KD, O’Dwyer M, Ostroff J, Yasko J. Clinical research site infrastructure and efficiency. J Oncol Pract. 2010;6(5):249–252. | |
Alsumidaie M. How has bureaucracy affected clinical trials? [homepage on the Internet]. New York, NY: Annex Clinical; 2011. Available at: http://www.annexclinical.com/annexpost/blog11.21.12. Accessed September 18, 2013. | |
Califf RM. Clinical trials bureaucracy: unintended consequences of well-intentioned policy. Clin Trials. 2006;3(6):496–502. | |
Engineer F, Tharmaratnam A. Realizing the Promise of Asia-Pacific: The Region’s Strategic Shift from Outsourcing to Innovation. Durham, NC: Quintiles; 2010. Available from: http://www.quintiles.com/assets/0/111/118/233/1336/f28b5d15-531a-4d91-88a2-058d9ea451b1.pdf. Accessed September 18, 2013. | |
Nuttall A. Considerations for Improving Patient Recruitment into Clinical Trials. San Francisco, CA: RDP Clinical Outsourcing; 2012. Available from: http://www.rdpclinical.com/pdfs/RDP_Recruitment_Whitepaper_23Mar12.pdf. Accessed September 18, 2013. | |
Bhatt A. Quality of clinical trials: A moving target. Perspect Clin Res. 2011;2(4):124–128. |
 © 2013 The Author(s). This work is published and licensed by Dove Medical Press Limited. The full terms of this license are available at https://www.dovepress.com/terms.php and incorporate the Creative Commons Attribution - Non Commercial (unported, v3.0) License.
By accessing the work you hereby accept the Terms. Non-commercial uses of the work are permitted without any further permission from Dove Medical Press Limited, provided the work is properly attributed. For permission for commercial use of this work, please see paragraphs 4.2 and 5 of our Terms.
© 2013 The Author(s). This work is published and licensed by Dove Medical Press Limited. The full terms of this license are available at https://www.dovepress.com/terms.php and incorporate the Creative Commons Attribution - Non Commercial (unported, v3.0) License.
By accessing the work you hereby accept the Terms. Non-commercial uses of the work are permitted without any further permission from Dove Medical Press Limited, provided the work is properly attributed. For permission for commercial use of this work, please see paragraphs 4.2 and 5 of our Terms.