")
Back to Journals » International Journal of Nanomedicine » Volume 16
Graphene Oxide Theranostic Effect: Conjugation of Photothermal and Photodynamic Therapies Based on an in vivo Demonstration
Authors Romero MP , Buzza HH, Stringasci MD, Estevão BM, Silva CCC, Pereira-da-Silva MA, Inada NM , Bagnato VS
Received 18 October 2020
Accepted for publication 14 January 2021
Published 1 March 2021 Volume 2021:16 Pages 1601—1616
DOI https://doi.org/10.2147/IJN.S287415
Checked for plagiarism Yes
Review by Single anonymous peer review
Peer reviewer comments 4
Editor who approved publication: Dr Thomas Webster
Maria P Romero,1,2 Hilde H Buzza,1 Mirian D Stringasci,1 Bianca M Estevão,1 Cecilia CC Silva,3 Marcelo A Pereira-da-Silva,1 Natalia M Inada,1 Vanderlei S Bagnato1
1São Carlos Institute of Physics, IFSC/USP, São Carlos, São Paulo, Brazil; 2Departamento de Materiales, Facultad de Ingeniería Mecánica, Escuela Politécnica Nacional, Quito, Ecuador; 3MackGraphe, Mackenzie Presbyterian University, São Paulo, São Paulo, Brazil
Correspondence: Maria P Romero
Departamento de Materiales, Facultad de Ingeniería Mecánica, Escuela Politécnica Nacional, Quito, Ecuador
Tel +593999008658
Email [email protected]
Introduction: Cancer is the second leading cause of death globally and is responsible, where about 1 in 6 deaths in the world. Therefore, there is a need to develop effective antitumor agents that are targeted only to the specific site of the tumor to improve the efficiency of cancer diagnosis and treatment and, consequently, limit the unwanted systemic side effects currently obtained by the use of chemotherapeutic agents. In this context, due to its unique physical and chemical properties of graphene oxide (GO), it has attracted interest in biomedicine for cancer therapy.
Methods: In this study, we report the in vivo application of nanocomposites based on Graphene Oxide (nc-GO) with surface modified with PEG-folic acid, Rhodamine B and Indocyanine Green. In addition to displaying red fluorescence spectra Rhodamine B as the fluorescent label), in vivo experiments were performed using nc-GO to apply Photodynamic Therapy (PDT) and Photothermal Therapy (PTT) in the treatment of Ehrlich tumors in mice using NIR light (808 nm 1.8 W/cm2).
Results: This study based on fluorescence images was performed in the tumor in order to obtain the highest concentration of nc-GO in the tumor as a function of time (time after intraperitoneal injection). The time obtained was used for the efficient treatment of the tumor by PDT/PTT.
Discussion: The current study shows an example of successful using nc-GO nanocomposites as a theranostic nanomedicine to perform simultaneously in vivo fluorescence diagnostic as well as combined PDT-PTT effects for cancer treatments.
Keywords: graphene oxide, photodynamic therapy, photothermal therapy, cancer treatments, nanomedicine, nanocomposites based on graphene oxide, nanoparticle-based drug delivery systems, theranostic
Introduction
In medical nanotechnology applications, a unique class of nanoparticles is designed to make both cancer diagnosis and therapy, providing the so-called theranostics strategy. Cell surface cancer receptors recognize nanoparticles bearing these ligands, thus allowing better nanoparticles absorption of cancer cells. The rapid growth of nanotechnology toward the development of nanomedicine agents holds great promise for overcoming several limitations of traditional cancer treatment.1 Nowadays, Carbon-based materials (graphene, carbon nanotubes, fullerenes, quantum dots, etc.) have demonstrated suitable properties for biomedical application, such as excellent optical properties (eg emission properties), high mechanical resistance, low toxicity, and good biocompatibility. In addition, they are also ideal for the supply of drugs that can achieve efficient drug loading through π-π stacking.2–4. These carbon materials showed large specific surface areas and a tunable cavity, which can be used as efficient carriers to deliver hydrophobic photosensitizers (PS) used in Photodynamic Therapy (PDT) with a high drug load, a controlled release, and a tumor-targeting effect by functionalizing the surface.5
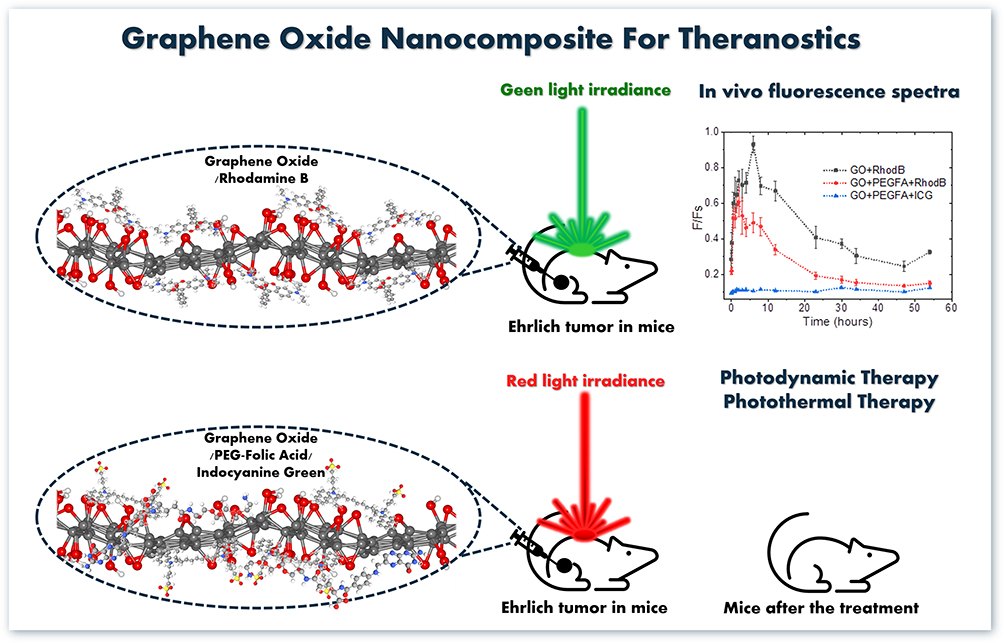 |
Figure 1 In vivo fluorescence spectra and treatment of tumor based on GO-nanocomposites. |
Various drug delivery approaches are capable of dispersing hydrophobic PS in an aqueous solution such as liposomes, polymeric micelles, gold and silica nanoparticles and carbon-based materials have been used to overcome the barrier in clinical use.6,7 Carbon-based materials combined with PS have shown an extraordinarily enhanced anticancer effect in a single platform upon light irradiation owing to the photothermal effect of graphene and synergist effect of PS.5 Some studies show results of the covalent or non-covalent functionalization of some PS used in Photodynamic Therapy on the surface of Graphene Oxide (GO) and nano-GO obtained PDT/PTT effects con IR irradiation.8,9. Light-activated PDT and PTT using NIR (around 850 nm) have been shown as a great promise for efficient tumor elimination in nanomedicine. The literature reports the use of NIR based on nanoparticles for tumor elimination.10–14.
The design of Nanoparticle-Based Drug Delivery Systems (DDS) for cancer treatment has included a tumor-targeting ligand unit, which can specifically recognize cancer receptors on the cell surface. This strategy induces endocytosis mediated by the receptor, intending to minimize systemic toxicity and the side effects of conventional chemotherapy. Currently, targeted ligands such as arginine-glycine-aspartic acid, folic acid (FA), biotin and antibodies have been inserted into Carbon-based DDS and shown to improve therapeutic responses both in vitro and in vivo.15 Folic acid receptor (FR) has been demonstrated overexpressed on the cell membrane of a series of solid tumor cells, including breast, ovarian, and non-small cell lung cancers. Thus, the conjugation of FA in nanoparticles can be an excellent approach for the selective drug delivery in tissues that express FR.
Due to the potential use of Graphene in Photothermal Therapy (PTT), which converts NIR light into heat,16,17 a large number of papers have used PEGylated GO as a carrier for anti-cancer treatment and have shown promising results in vitro and in vivo.18–22 Kalluru et al developed a bio-compatible GO-PEG-folate nanomaterial-mediated photodynamic therapeutic (NmPDT). It was reported in vitro and in vivo experiments, which showed that NmPDT could sensitize singlet oxygen formation to perform PDT and PTT, using NIR light (980nm 0.36W/cm2).22 In vivo studies have shown features of PEGylate GO such as highly efficient passive tumor targeting and relatively low retention in reticuloendothelial system.18,23
Indocyanine Green (ICG) is a widely used NIR-sensitive photothermal and photodynamic agent and is a water-soluble tricarbocyanin dye that also offers diagnostic features by biological staining. It is clinically approved but has a low plasma half-life (t1/2=3–4 min), weak aqueous stability, lack of target-specific and concentration-dependent aggregation.24 The covalent functionalization of ICG over GO can avoid some of these indicated limitations. These NIR-absorbing hybrid nanomaterials have shown a remarkably improved in vitro cancer cell-targeted photothermal destruction compared to free ICG.24
All studies based on graphene oxide present in the literature show promising results in vivo, especially when focused on PTT against cancer. However, there is little literature on in-depth image-based studies and cancer treatment based on PS-functionalized PEG+GO nanocomposites with a ligand to achieve efficiency in both fluorescence diagnosis and cancer treatment, using photothermal and photodynamic therapies. This study aims to design biocompatible nanocomposites, GO+PEG with targeted ligand Folic Acid (FA) and Rhodamine B as fluorescence image agent, and GO+PEG-FA and Indocyanine Green (ICG) as treatment cancer agent, which allow the study of synergism between PTT and PDT effects.
Materials and Methods
Syntheses of Graphene Oxide (GO)
GO was prepared and characterized following preview report.25–27 The oxidation time of graphite was increased, in order to obtain GO sheets with smaller lateral dimensions. Briefly, approximately 1 g of graphite (Sigma-Aldrich, 98.4% of the flakes with a particle size of 100 mm) and 0.76 g of sodium nitrate (Merck, 99.9% purity) were added in a reaction flask and dispersed them in 35.0 mL of concentrated sulfuric acid (Synth, 98.0% purity), leaving the mixture under stirring for 15 minutes in an ice bath. After this period, small portions of potassium permanganate (Synth, 99.0% purity) were added to completed 4.50 g, for a period of 1 hour, keeping the mixture under stirring and low temperature (ice bath). Then the reaction was at rest of 7 days. After this period, 100 mL of 0.28% of sulfuric acid aqueous solution was added slowly, for 1 hour and the mixture was kept under stirring for another 2 hours. Forthwith, 3.00 mL of 30% hydrogen peroxide (Sigma-Aldrich) was added slowly and the mixture was stirred for another 2 hours. To finish the GO preparation, the final dispersion was washed three times with aqueous 10% hydrochloric acid aqueous solution (Synth, 37% purity), neutralized and purified by repeated dialysis (MWCO 15 kDa) in ultrapure water. The final concentration of the purified GO dispersion was 3 mg/mL
Synthesis of nc-GO
Synthesis of CDI-Activated PEG-4000 (PEG-CDI)
The PEG-CDI synthesis was performed by modifications described in the literature.28 Poly (ethylene glycol) 4000 (Sigma Aldrich – 2.0 g, 0.5 mmol) was dissolved in 10 mL of dry acetonitrile and added to an excess of N,N-Carbonyldiimidazole (CDI Sigma Aldrich – 0.257 g, 5 mmol) in dry acetonitrile (10 mL). The mixture was allowed to stir under a nitrogen atmosphere and at room temperature for 2 hours. After that, the synthesis was kept under stirring for another 4 hours. The solution was concentrated and purified in the presence of ethyl ether, repeating the process three times for the withdrawal of unreacted CDI. The PEG-CDI was dried in a desiccator and the white powder resulting from the synthesis was carried out 1H-NMR (1H-NMR 500 MHz Agilent Technologies - 500/54 Premium Shielded) and FTIR (Spectrometer Nicolet 6700/GRAMS Suite, 4 cm−1 resolution) analysis.
Synthesis of Amino-Terminated PEG (PEG-NH2)
2.0 g of PEG-CDI was dissolved in 10 mL of dry acetonitrile and 1.5 mL of 1,2-ethylenediamine was added dropwise to the solution. The reaction was kept overnight. The unreacted ethylenediamine was removed by rotary evaporation and the product was mixed with ether. The process was repeated three times and the PEG-NH2, dried in a desiccator and the white powder was carried out 1H-NMR (1H-NMR 500 MHz Agilent Technologies - 500/54 Premium Shielded) and FTIR (Spectrometer Nicolet 6700/GRAMS Suite, 4 cm−1 resolution).28
Synthesis of Folate-Conjugated PEG-NH2 (PEGFA)
The polyethyleneglycol amine (PEG-NH2 - 0.3 g; 7.5x10⁻⁵ mol), folic acid (FA - 30 mg; 0.068 mmol), N-Hydroxysuccinimide (NHS −17 mg; 0.148 mmol) and 1-Ethyl-3-(3-dimethylaminopropyl) carbodiimide (EDC - 31 mg; 0.148 mmol) were mixed in 10 mL DMSO (dimethyl sulfoxide) with 0.034 mL Et3N (triethylamine). The mixture was stirred overnight under nitrogen atmosphere. The mixture was centrifuged with 20 mL of deionized water to separated EDU and the supernatant was purified by dialysis with further lyophilization.28
Preparation of GO+RhodB, GO+PEGFA-RhodB and GO+PEGFA+ICG Nanocomposites
Firstly, PEG-FA was linked into GO surfaces, where 10 mg GO was dispersed in 10 mL of deionized water, and 60 mg PEG-FA, 20 mg EDC and 20 mg NHS were added.28 The reaction was maintained for 24 hours in shaking and at room temperature. To remove the unreacted polymer on the GO surface, the GO-PEGFA was centrifuged at 8000 rpm for 45 minutes. The synthesis product was dispersed in water for the dye insertion. The adsorption of RhodB in both samples (GO+RhodB and GO+PEGFA+RhodB) was performed following the protocol established by Estevão et al with some modifications.29 For this case, 10 mg of GO+PEGFA or GO was dispersed in deionized water, and the RhodB stock solution was diluted in DMSO. For 1% (w/w), 0.1 mg of RHB was added in the GO+PEGFA and GO and kept under stirring for 24 hours, protected from light. In the end, the GO+PEGFA+RhodB and GO+RhodB nanocomposites were centrifuged at 8000 rpm for 45 minutes and the supernatant was collected for quantification in UV–Vis. GO+PEGFA+ICG was performed in a similar process, but the ICG encapsulation was about 5% (w/w). For this, 0.5 mg of indocyanine green was added in the GO+PEGFA and kept under stirring for 24 hours, protected from light. The GO+PEGFA+ICG were centrifuged at 8000 rpm for 45 minutes and the supernatant was collected for quantification in UV–Vis.
All nc-GO were characterized by Atomic Force Microscopy (Bruker Dimension Icon AFM) with tapping-mode, silicon tip spring constant 40 N/m and, oscillation frequency of 320 kHz. Dynamic Light Scattering (DLS) and zeta potential measurements were performed at 25°C with nanoparticles dispersed in aqueous solution using a Malvern Zetasizer Nano-ZS90, which uses a 4 mW He-Ne laser operating at 633 nm at an angle of detection of 173°. The photoluminescence measurements were performed at room temperature on a Cary Eclipse, Agilent technology spectrofluorometer and a Varian Cary® 50 UV–VIS system spectrophotometer.
Other techniques, including Infrared Spectroscopy FTIR (Spectrometer Nicolet 6700/GRAMS Suite, 4 cm-1 resolution), UV-Vis (Shimadzu UV3600 spectrophotometer), fluorescence emission (SpectraMax M3) and Raman spectroscopy (Renishaw RM2000, laser HeNe and 632.8 nm wavelength) were adopted to characterize the nc-GO.
DPBF Quenching Experiment
1.3-Diphenylisobenzofuran (DPBF) was utilized as a singlet oxygen trapping agent with a strong absorption of light, around 410–420 nm and emission of blue fluorescence. DPBF reacts with 1O2 to form o-dibenzoylbenzene, which does not absorb visible light. The decrease in DPBF absorbance reflects the amount of 1O2 generated.30
5 μM DPBF and 25 μg/mL of nc-GO were mixed in Tween 80 solution and irradiated with an 808 nm laser (1.8 W/cm2) at different time intervals, and the DPBF absorbance at 418 nm was measured using a UV-VIS spectrophotometer (Cary Eclipse, Agilent technology spectrofluorometer and a Varian Cary® 50 UV-VIS system spectrophotometer).31 All the measurements were performed in air-saturated solutions and temperature control of light irradiation.
Subcutaneous Tumor – Ehrlich Model
All in vivo study was performed in agreement with the Brazilian laws and the Ethics Committee on Animal Use (CEUA) of the Institute of Physics of São Carlos, USP- Brazil (protocol number 2,540,100,717 with an amendment approved on Feb 28, 2018).
Tumor-bearing mice (4.5-weeks old, 20 e 25 g, male) were prepared by injecting 100 µL of Ehrlich tumor cells (106 cells) subcutaneously into the left leg of mice.32 The growth was followed until the tumors reached approximately 150 ±50 mm3 in volume.
In vivo Fluorescence Spectra Study Using Rhodamine B
The nanocomposites GO+RhodB, GO-PEGFA-RhodB and GO-PEGFA-ICG were dispersed in mechanical agitator, vortex, and then placed at 37°C all night before the treatments. Solutions of GO+RhodB, GO-PEGFA-RhodB and GO-PEGFA-ICG were injected intraperitoneally (1.5 mL volume) in the animals within the tumor-induced. To determine the time of maximum GO+RhodB, and GO-PEGFA-RhodB concentration in the tumor, the emission spectrum of the RhodB was obtained with its maximum band emission range of 578 nm (excitation of 520 nm). For the GO-PEG-ICG nanocomposite and ICG free molecule, the emission spectrum of ICG was obtained exciting with 780nm laser a 60 mW/cm2. A prototype developed by the Laboratory of Technological Support of Institute of Physics of Sao Carlos of University of Sao Paulo was used to obtain the spectrums. This prototype consists of a laser coupled to a “Y” type fiber that delivers and collects light from the tissue, taking it to a spectrophotometer (USB2000, Ocean Optics®, USA). Three animals per group were used, and the emission spectra were obtained every time interval during the 72h after injection. In each animal, the emission spectrum was collected in several points on the tumor area.
When obtaining the spectra, a variable intensity of skin autofluorescence was observed in the mice, so the ratio between the signal of each molecule (RhodB and ICG) intensity and the skin autofluorescence band was obtained (F/Fs). The F/Fs value was plotted as a function of time to determine the best drug-light interval.
In vivo Photothermal and Photodynamic Therapy
Tumor mice models were prepared identically, as described above, to observe the in vivo PTT-PDT effects of GO+RhodB, GO-PEGFA-RhodB and GO+PEGFA+ICG under illumination. The diameters of each tumor were measured using a caliper and the volume was calculated considering a cube. The procedures were performed when the tumors reached an average initial volume of 0.15 cm3 (range between 0.11 and 0.18 cm3). Five animals were used in each group, and the control groups were analyzed: only saline, only light, only GO and only ICG. The nanocomposites GO+RhodB, GO+PEGFA+RhodB and GO+PEGFA+ICG were dispersed in mechanical agitator, vortex, and then placed at 37°C all night before the treatments.
The animals were anesthetized with an intraperitoneal injection of ketamine (30 mg/kg) and xylazine (13 mg/kg) solution and the tumor region was trichotomized. When the concentration of each GO solution in the tumor was maximum (obtained as described in the section in vivo fluorescence spectra study), the tumor area was irradiated with the 808 nm laser (1.8 W/cm2) for 5 min. The thermographic FLK-Ti400 camera (Fluke®, Everett, EUA) was used to acquire surface temperature information during irradiation time at 0, 1, 2, 3, 4, and 5 min. The evaluation of intratumoral temperature was performed using a needle thermocouple (29 gauge, T-type; Physitemp Instruments) inserted in the tumor and the acquisition was performed every second during all irradiation time. The average temperatures were plotted as a function of NIR irradiation time.
The follow-up of the tumors varied between 13 and 40 days depending on the clinical condition presented by the animals. The animals were euthanized when the treated tissues were completely healed or when the tumor reached sufficient volume to cause suffering to the animal. Euthanasia was performed by an overdose of anesthesia with intraperitoneal injection of ketamine (90 mg/kg) and xylazine (39 mg/kg) solution. The ratios between the variation of treated and initial tumor volumes (V-V0/V0) were calculated and, then, normalized by the number of follow-up days, which was named as R values ((V-V0/V0) days). Figure 1 shows a self-explanatory graphical summary of the present study.
Results and Discussion
Synthesis and Characterization of GO and nc-GO
The nc-GO composites were characterized by atomic force microscopy (AFM) (Figure 2). As displays in Figure 2A for GO sheet, the height profile along the small lines indicated that the thickness of the GO is about 2.5 nm, suggesting the sheet is multi-layered. The GO lateral size was approximately 1.2 µm. In Figure 2B–D the GO+RhodB, GO+PEGFA-RhodB and GO+PEGFA+ICG nanocomposites were obtained with a thickness of around 16.0; 16.0; 20.0 nm, respectively, and a lateral size of around 600 μm for the three nanocomposites. The result was expected because the AFM image of GO there was no distortion and its thickness (3.2 nm) showed only the presence of GO sheet. On the other hand, in the GO+RhodB nanocomposite, where a uniform thickness value was obtained, only the presence of GO and RhodB were found, in comparison with the presence of PEG-4000 and the RhodB fluorescent marker and ICG photosensitizer, found in the GO+PEGFA-RhodB and GO+PEGFA-ICG nanocomposites, which allowed non-uniform thickness. In PEG-composites is evident a kind of distortion of the AFM images of each of the nanocomposites.
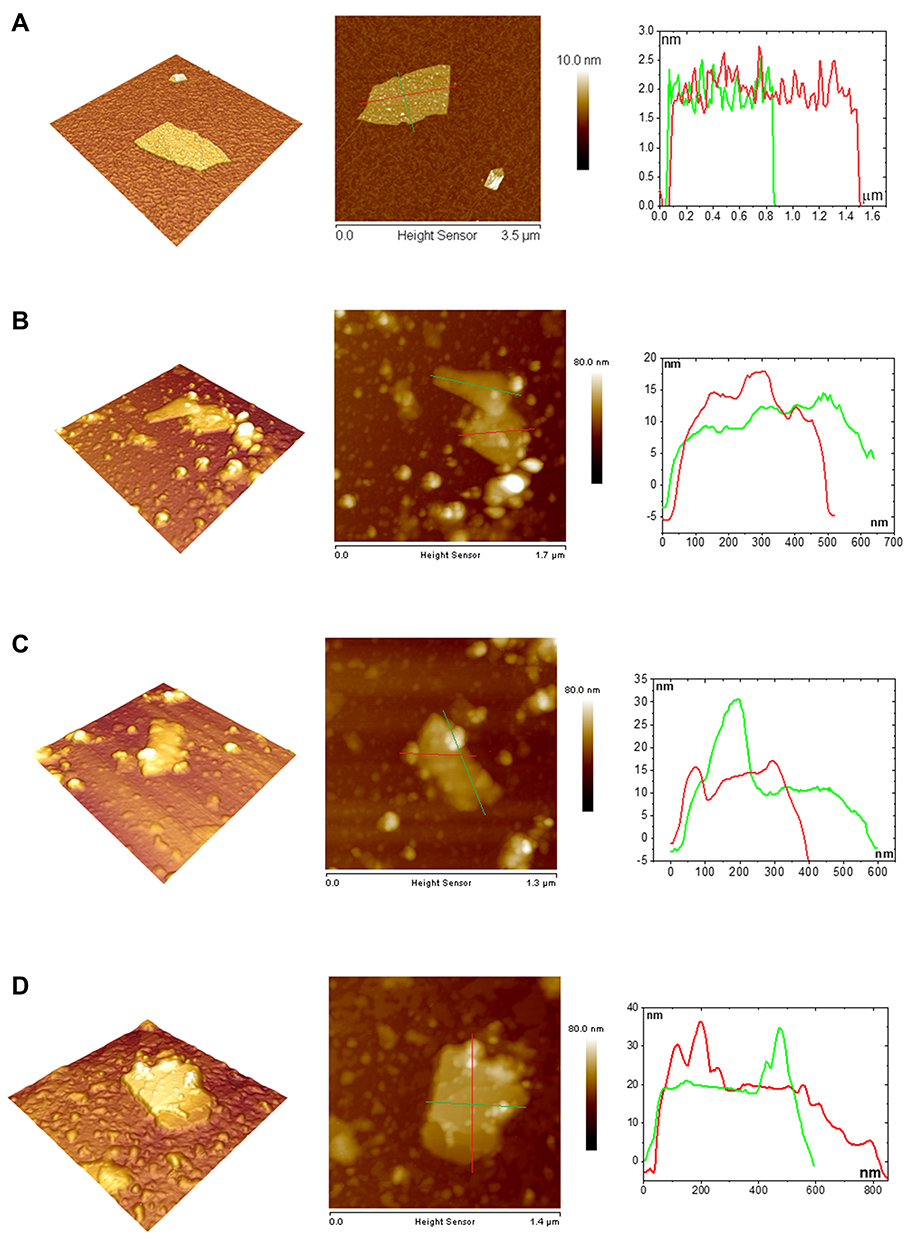 |
Figure 2 Characterization of nc-GO nanocomposites by AFM image and height profiles along the panel lines. (A) GO. (B) GO+RhodB. (C) GO+PEGFA+RhodB and (D) GO+PEGFA+ICG. |
The lateral size and zeta potential measurements were important when it came to nanoparticles and surface modifications. As can be seen in Table 2 and Figure S4, GO sheet showed a wide range of lateral sizes of 200 nm with an apparent aggregation around 1170 nm according to the AFM image (Figure 2A). The low uniformity of the lateral size of the GO sheets is a characteristic of the synthesis, no technique was used to separate the sheets by the lateral sizes. When RhodB was adsorbed, an increase of size nanocomposite could be observed, with a notable decrease in the percentage of nanocomposite in aggregation. When adding the PEGFA (PEG-4000 anchored folate molecules), the RhodB and ICG, there was an increase of the nanocomposite evidencing the modification of GO sheet (according to the AFM image Figure 2B–D).
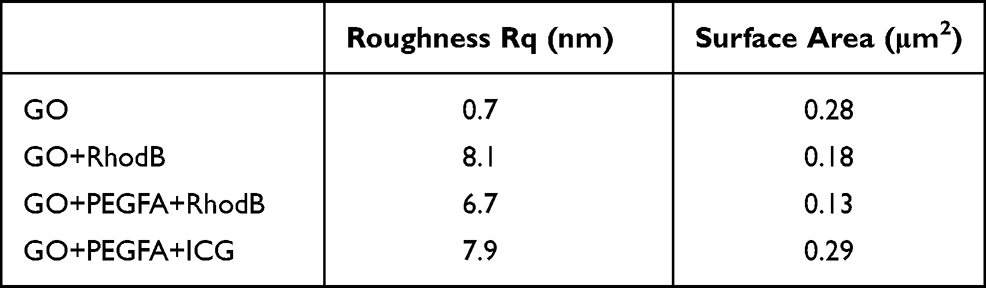 |
Table 1 Roughness Data for nc-GO. Rq: (RMS Roughness) is the Root Mean Square Average of the Profile Heights Over the Evaluation Length |
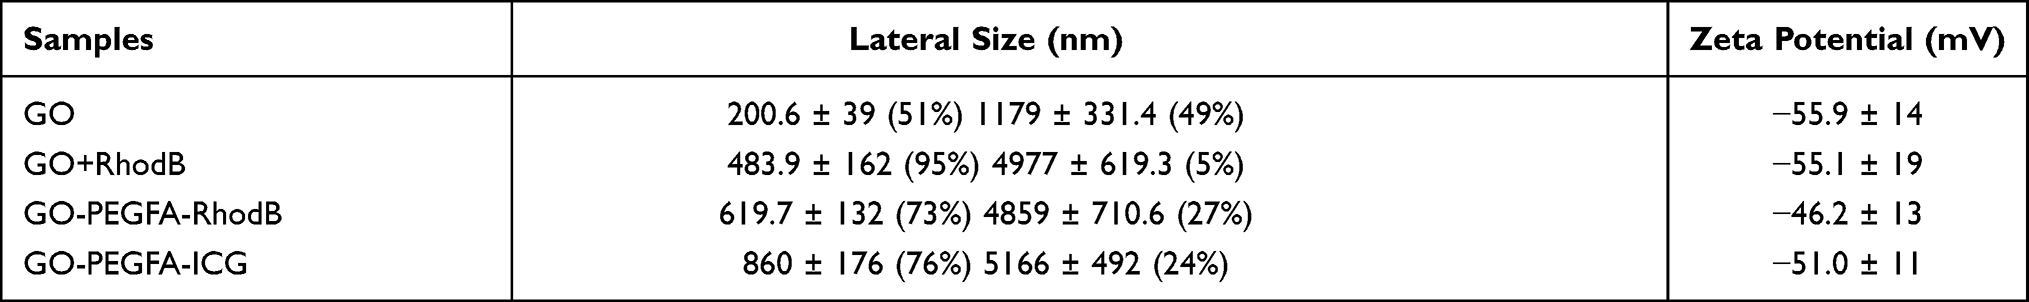 |
Table 2 Particle Size and Zeta Potential of nc-GO |
An analysis of surface roughness allowed a study of PEGFA, ICG and RhoB on the surface of GO sheets compared to the pure GO sheet. The surface roughness values of GO, GO+RhodB, GO+PEGFA+RhodB and GO+PEGFA+ICG were obtained and shown in Table 1. As expected, the roughness of the nc-GO was between 6.73 and 8.1 nm, which confirms the presence of PEGFA, RhodB and ICG on the GO surface. Pure GO presented a roughness of 0.688 nm.
We analyzed the zeta potential (Table 2) and noted that the GO sheets presented negative charge due to the carboxylic groups on the surface and that there was only a small drop in the potential when the surface was modified, which may show that there was modification at superficial. Imani et al also found changes in size of the rGOs when surface polymers were added, in addition, a small drop in zeta potential was also observed when PEG was added.33
The PEGFA was obtained by 3 synthetic routes. The products of all steps were characterized by 1H NMR and FTIR and the precursor PEG for comparison. The 1H spectrum of PEG (Figure S1A- supplementary information) showed the typical displacements at δ 3.72 ppm of the CH2 hydrogens most external to the polymer structure, δ 3.37 ppm of the CH2 external to the PEG and δ 3.54 ppm referent to CH2 more internal to the polymer. The F127-CDI revealed characteristic low-field signals 6.98 ppm and 7.63 ppm related to the aromatic hydrogens of the structure, as can be seen in Figure S1B. The second step resulted in F127-NH2, as seen in Figure S1C. In addition to the PEG peaks, the characteristic peaks of ethylenediamine appeared in δ 1.70 ppm of the external CH2, δ 3.09 ppm of the internal CH2, δ 1.50 ppm of the NH2 and a discrete signal δ 3.92 ppm of the NH internal. After AF insertion (Figure S1D), the characteristic peaks of the aromatic rings appeared at 6.65, 7.51 and 8.59 ppm; in addition to the disappearance of the NH2 peak (1.50 ppm), thus confirming the folic acid presence.28 The FTIR analyzes (Figure S2) showed, as well as in 1H NMR, that the PEG structure was maintained at all steps, however, because the structural modification was only at the ends of the polymer, FTIR was not sensitive to discern the modification peaks. Functionalization of GO with folic acid-modified PEG was carried out by EDC/NHS coupling agents in which the carbonyl is activated to carry out the peptide bond. Then, the molecules of interest (RhodB and ICG) were adsorbed and all nc-GO and were characterized by UV-Vis, fluorescence, FTIR, size and zeta potential. The adsorption efficiencies of the interest molecules were calculated by the molar absorptivity, as can be seen in Table 3. Encapsulation efficiency was performed by evaluating the difference between the absorptivity of the supernatant of the resulting solution after centrifugation and the standard absorptivity of the RhodB or ICG molecule.
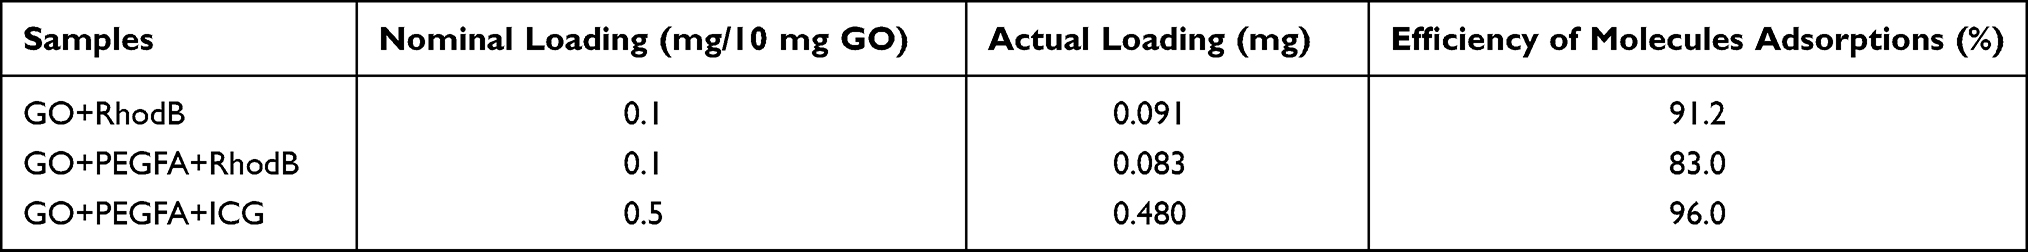 |
Table 3 RhodB and ICG Loadings Used During the Adsorption (Nominal) and After Washing Procedures (Actual) |
RhodB and ICG were loaded onto GO and GO+PEGFA by simply mixing dye solutions in DMSO and protected from light. After removing the non-adsorbed molecules by centrifuge, GO+RhodB, GO+PEGFA+RhodB and GO+PEGFA+ICG, high absorption of the RhodB and ICG was evidenced. A high Doxorubicin adsorption on the surface of the NGO-PEG was also observed by Zhang et al evidencing this nc-GO as good carriers of drugs.28
nc-GO Optical Properties
Fundamental optical properties of GO and nc-GO were characterized by UV-Vis absorption and fluorescence emission spectra (Figure 3). Two absorption peaks were observed in the GO, one in 246 nm and another in 293 nm that correspond to the π-π* transitions of the aromatic C-C carbons and n-π* transitions of the C-O bonds, respectively.34 Graphene was satisfactorily oxidized and the peaks were maintained in the nc-GO, but with less intensity, which indicates binding/adsorption related to the insertion of PEGFA and the dyes. As can be seen in Figure 3A, RhodB showed a characteristic peak at 553 nm, when in aqueous solution and low concentrations. After adsorption of RhodB on the GO sheets and GO-PEGFA nanocomposite, there was a bathochromic shift at 561 nm and 556 nm, respectively. This red shift may be related to interaction of the aromatic rings plane with GO surface or PEG entanglement on the surface, which can explain different displacements.35 In addition, Estevão et al reported the same bathochromic shift when inserted in MCM41, as well as the possible aggregate formation.29 These aggregates may be present due to decreased fluorescence emission intensity when RhodB was adsorbed on GO and GO+PEGFA, as can be observed in Figure 3C. When ICG was analyzed, we can observe through UV-Vis (Figure 3B) and fluorescence spectra (Figure 3D) that the dye was not available as monomers in the nanocomposites. It can be seen from the studies of Rotermund et al that ICG can form J-type aggregates, shifting the peak to near infrared (900 nm), outside the UV-Vis detection field used, but may still be available for use in treatments.36
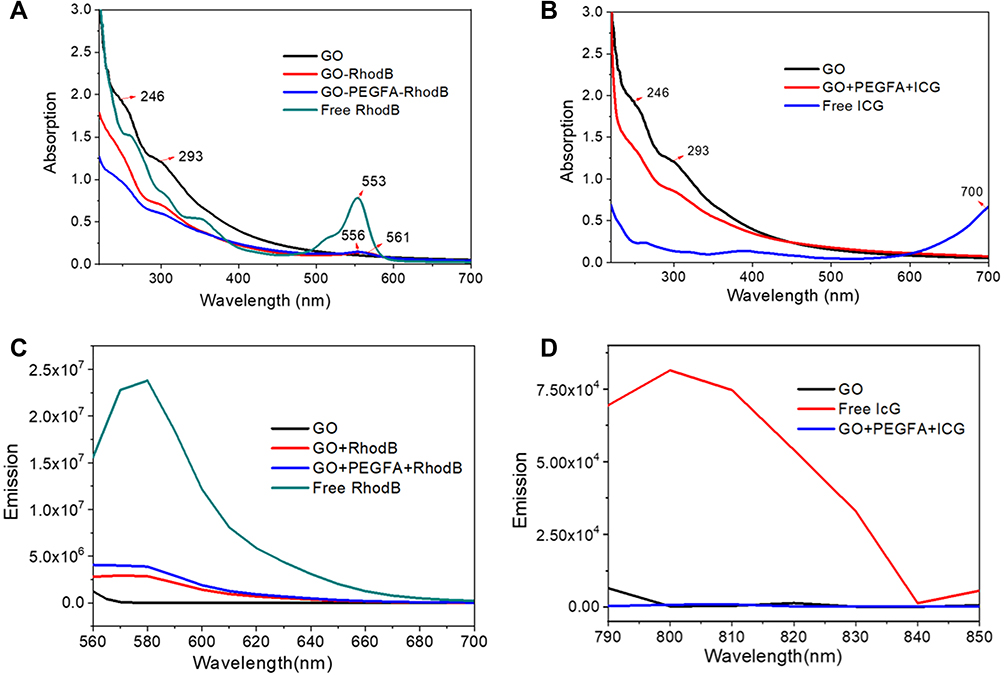 |
Figure 3 (A and B) absorption and (C and D) emission spectra of the respective nanoparticles. All spectra were performed at the same concentration, 0.05 mg GO/mL. |
The photoluminescence spectra of nc-GO are showed in Figure 4. The photoluminescence of GO (Figure 4A) was obtained at different excitations and display fluorescence under several wavelength irradiations. Redshift is present, depending on the excitation. Jin et al observed that under specific critical limit sizes, GO can show permanent photoluminescence arising from quantum confinement effects.37 Figure 4B and C show a strong emission of RhodB (578 nm) that can be observed in the emission spectra of the nanocomposite GO+RhodB and GO+PEGFA+RhodB where a low-intensity band was observed around 625nm produced by the presence of the GO. For the GO+PEGFA+ICG nanocomposite, no photoluminescence spectrum was observed when excited at various wavelengths, in agreement with found in Figure 3D (emission absorption).
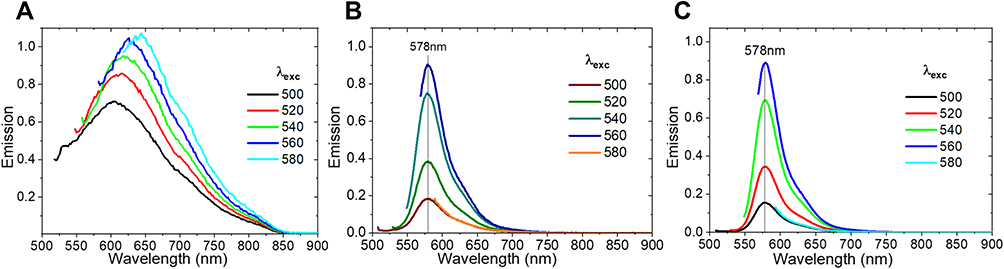 |
Figure 4 Photoluminescence of nc-GO. (A) GO. (B) GO+RHB. (C) GO+PEGFA+RhB. |
Characterization of GO and nGO Composition and Structure
FTIR spectra were also performed when PEG and dyes were added. As showed in Figures S2 and S3, the changes in pure GO were subtle but perceptible. The GO FTIR indicated the presence of OH (3437 cm−1) and C = C (1626 cm−1) functional groups.38 When RhodB was absorbed, these signals were less intense due to the adsorption of this molecule on the GO surface. PEGFA was added for the nc-GO on the GO surface through the EDC/NHS coupling agents. The appearance of signal in 1650 cm−1 was observed, referring to the NH-CO group, as well as the decrease of intensity relative to the GO functional groups. In addition, the subtle presence of peaks related to the PEG functional groups (C-H, C-O, O-H) between 1250 and 900 cm−1 was noted.28,38
The nc-GO structures were examined by using the Raman spectrum (Figure 5), in which there were two bands, D and G at 1329 and 1606 cm−1, respectively. The typical features in Raman spectra are the G and D band, the G band is usually assigned to the E2g phonon of C sp2 atoms, while the prominent D band is an indication of disorder corresponding to defects associated with vacancies, grain boundaries and amorphous carbon species.39 In Figure 5, the intensity ratio (ID/IG) of D band to G band of GO, GO+PEGFA+ICG, GO+PEGFA+RhodB and GO+RhodB were about 1.04, 1.15, 1.23 and 1.4, respectively. Chen et al founded that both carboxylation and PEGylation did not destroy the aromatic structure of nGO,40 but, as can be observed, the presence of PEG and FA allows an increase in the ID/IG ratio. This increase was more considerable with the presence of RhodB, fluorescent marker, although RhodB is adsorbed not covalently on the surface of Graphene. There was no significant difference in the ID/IG ratio of the GO+PEGFA+RhodB, GO+PEGFA+ICG, according to Lv et al.41
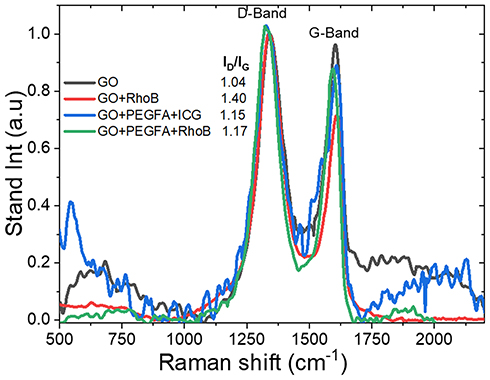 |
Figure 5 Raman spectrum for nc-GO nanocomposites. |
DPBF Quenching Experiment
Quenching of 1.3-Diphenylisobenzofuran (DPBF) in the presence of nc-GO nanocomposites was used to evaluate whether nc-GO mediated PDT effects can effectively eliminate tumor in mouse using 808nm laser (1.8 W/cm2). In Figure 6, it was observed the DPBF photooxidation from nc-GO nanocomposites for similar concentrations nc-GO nanocomposites and the monoexponential curve A = Ao exp (x/τ) fitting the decay data the time constants τ [min] for DPBF photobleaching.31 The generation of 1O2 by nc-GO nanocomposites was confirmed by DPBF quenching studies, where the optical absorbance of DPBF at 418 nm decays continuously upon 808 nm irradiation of the solution in the presence of nc-GO nanocomposites. There was a faster photo-oxidation (13.60±0.5 and 12.96±1.1 min) in GO and GO+RhodB concerning nanocomposites GO+PEGAFA+ICG, GO+PEGFA+RhodB (18.72±1.2 and 17.64±0.9 min). In the absence of GO, the DPBF solution did not exhibit any noticeable decay in absorbance. Romero et al performed a sodium azide pre-treatment and found that the quenching of DPBF is mostly GO mediated PDT effects.26
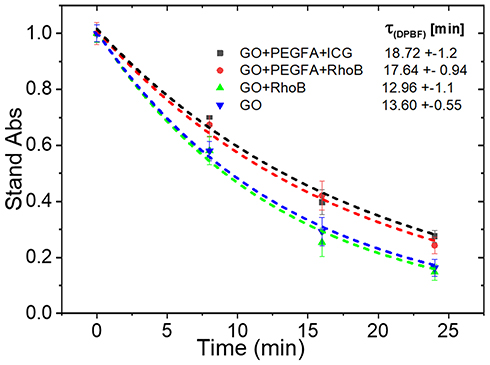 |
Figure 6 DPBF absorbance (418nm) monoexponential decay curves for nc-GO nanocomposites: GO+PEGFA+ICG, GO+PEGFA+RhodB, GO+RhodB and GO, using 808 nm light 1.8 W/cm2 and 5 μM DPBF, [nc-GO]= 25 μg/mL. |
The presence of PEGFA could prevent a better interaction between the nc-GO and the DPBF molecules, generating a longer decay time of the nc-GO with PEGFA compared to the nc-GO without PEGFA. No significant difference in the decay time of the nc-GO formed by photosensitizer ICG and RhodB dye was observed, possibly because there is a poor interaction between DPBF and ICG due to their hydrophobicity.
In vivo Fluorescence Spectra Study
In the present study, GO presented low intrinsic emission intensity of fluorescence and, therefore, the fluorescent emitted by RhodB adsorbed on the surface of the GO was used in the GO+PEGFA+RhodB and GO+RhodB nanocomposites to detect their fluorescence (F). RhodB presents a maximum band of 578 nm (wavelength excitation 500 nm, 60 mW/cm2).
The F/Fs ratio was obtained, relating Fs to the skin autofluorescence band and Figure 7A shows the F/Fs values for GO+RhodB, GO+PEGFA+RhodB and GO+PEGFA+ICG. GO+RhodB obtained the maximum value of the F/Fs ratio on the tumor at the 5th hour after injection via peritoneal into the mice, which indicated the maximum concentration of nanocomposites in the tumor. For GO+PEGFA+RhodB nanocomposite, the time of maximum fluorescence was about 3 hours, 2 hours shorter that GO+RhodB without PEG. The PEG has higher tumor targeting and the nanocomposite accumulation in the tumor showed to be faster.23 Folate moieties can recognize the target at tumor sites and Ehrlich cells are a derivative of breast cancer, which is well known to have overexpression of folate receptors on the cell membrane.42 The maximum value of the F/Fs ratio intensity, as expected, was observed in the GO+RhodB nanocomposite, since the presence of PEG, forming the GO+PEGFA+RhodB nanocomposite. It was possibly due to the lateral size because 27% of GO+ PEGFA+RhodB has a size of around 5 μm in relation to 5% of GO+RhodB that has the same lateral size (reference Table 2). Those, as mentioned earlier, can influence the concentration of nc-GO in the tumor.
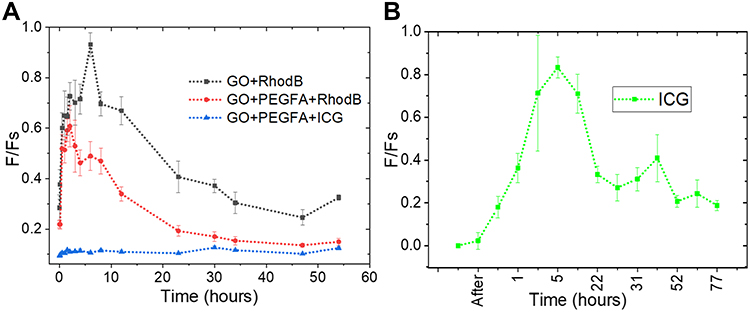 |
Figure 7 In vivo fluorescence spectra. (A) nc-GO nanocomposites. (B) ICG. The curves were obtained by averaging the results of the fluorescence measurements in tumors in mice (n = 3). In each tumor were obtained 3 different measurements. |
In addition, we observed fewer fluorescence signal in the GO+PEGFA+RhodB nanocomposite due to the possibility of aggregation. For these two nanocomposites, the animals were monitored by the maximum time of 55 hours. The F/Fs rates observed in Figure 7A were directly related to the presence of GO in the tumor, and the fluorescence emission measurements were obtained directly at some points on the tumor.
No significant fluorescence emission was observed in the GO+PEG+ICG nanocomposite (Figure 7A), but the emission spectrum of free ICG was observed and showed the maximum accumulation in the tumor after around 5 hours (Figure 7B). To perform nc-GO-mediated PDT/PTT experiments in vivo, the same dynamics were considered in all RhodB-based nanocomposites, since GO is predominant in tumor distribution.
GO intrinsic fluorescence emission was not used for in vivo fluorescence spectra study due to the low emission intensity. However, several authors have done it, for example, Li et al showed that graphene oxide could exhibit two-photon excitation induced luminescence and act as an in vitro fluorescent marker upon photoexcitation by a femtosecond laser.43 Kalluru et al demonstrated that GO-PEG-folate could act as a single photon excitation induced in vitro fluorescent cellular marker. However, the fluorescence emission quantum yields are meager under such ultra-low laser power excitation (the excitation power intensities of 488 nm and 533 nm are 2 mW/cm2).22 Some authors have found it difficult to quantify the intrinsic fluorescence of GO due to light absorption and scattering by biological tissues, varied in size, and possible photobleaching.44,45 For in vivo fluorescence spectra study, it was possible to visualize the fluorescence emission using an ultralow led irradiance (500 nm 60 mW/cm2), which is simpler and low cost compared to a laser source.
In vivo nc-GO Mediated PDT/PTT Experiments
nc-GO nanocomposites were injected by intraperitoneal route in mice, and the illumination was performed using an 808 nm laser (1.8 W/cm2) for 5 minutes to evaluate the effectiveness of destruction of tumors mediated by PDT/PTT. Although not visualized in Figure 3A, Graphene has the ultrabroad absorption spectrum in all visible spectra,46 and for this reason, a light source of around 800nm was used for GO excitation.
Upon laser irradiation, the “only light” group already showed a thermal effect, with a temperature increase of about 20°C. However, with the introduction of the molecules, a significant increase in temperature in relation to the light effect was observed. Tumor with GO+PEGFA+ICG under illumination exhibited the highest intratumoral temperature elevation with ΔT of 40°C (t = 5 min of irradiation), compared to the GO+PEGFA+RhodB, ICG and GO+RhodB nanocomposites, where ΔT obtained were 35, 31 and 30°C respectively (Figure 8A, measures with the thermocouple). Therefore, although the temperature variation was primarily due to the presence of GO+PEGFA+RhodB, the ICG photosensitizer also caused a massive temperature increase with this irradiance. However, when the molecule was conjugated (GO+PEGFA+ICG), the temperature increase was much higher, which means that the quantity of ICG molecules adsorbed on GO sheets was high, due to the high surface area of GO. This can be observed in Table 3 where it is observed that the efficiency of adsorption molecules (ICG) was 96% causing more significant thermal damage for the treated tissue of GO+ PEGFA+ICG.
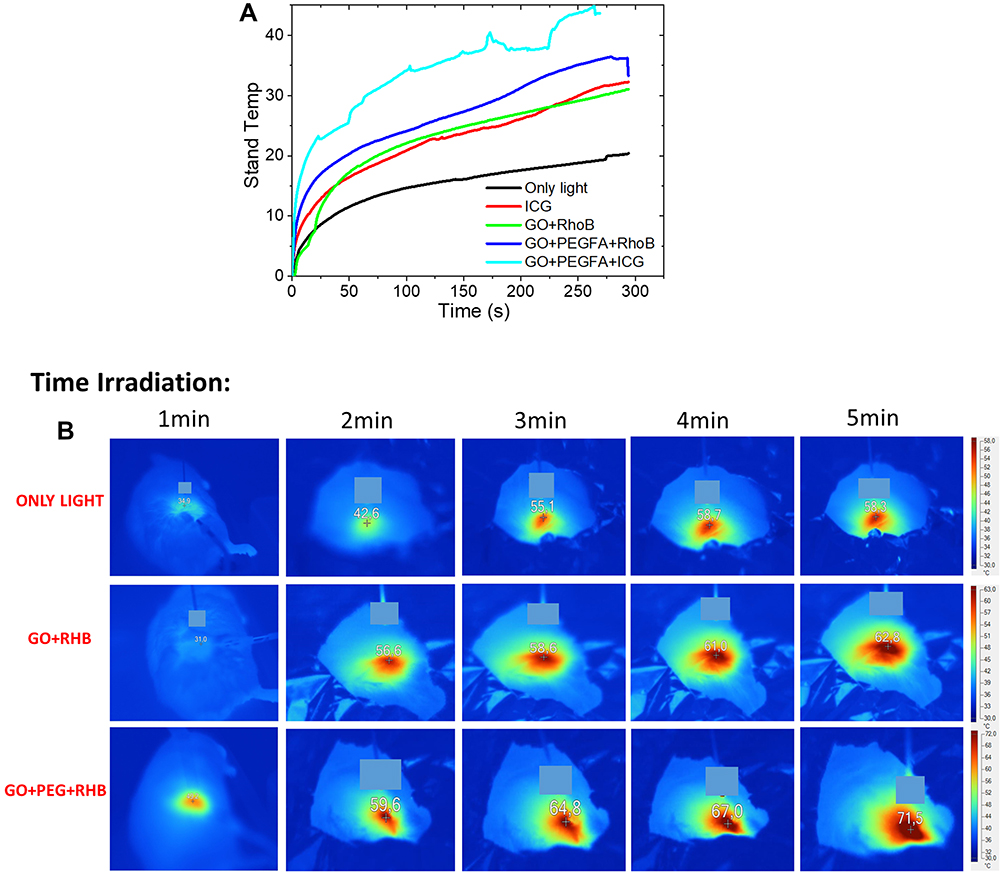 |
Figure 8 (A) Intratumoral temperature rise profiles as a function of irradiation time for ICG+LIGHT, GO+RhodB, GO+PEGFA+RhodB and GO+PEGFA+ICG nanocomposites. (B) Photothermal images of mice under different time irradiations (1–5 min) for ONLY LIGHT, GO+RhodB, GO+PEG+RHB systems. In 1 min the complete image of the mouse is observed, in 2–5 min it is observed that the mice were covered with aluminum foil and only the tumor to be irradiated is exhibited. nc-GO dose= 20mg/kg. |
Figure 8B shows examples of thermographic images of Ehrlich tumors during the application of only light (light control group) or the treatments mediates by GO+PEGFA+ RhodB and GO+RhodB nanocomposites, all with 5 minutes of illumination. The tumor with GO+PEGFA+RhodB nanocomposite showed a higher temperature rise compared to tumors containing GO+RHB and light only.
Although a lower fluorescence emission had been observed in the PEGFA-based (GO+PEGFA+RhodB) if compared to the GO+RhodB nanocomposite, GO+PEGFA+RhodB presented a higher increase in temperature. This enables us to conclude that, although the lower fluorescence signal due to aggregation, the presence of PEGFA showed a higher concentration of GO in the tumor such that, when irradiated with IR light, there was a greater increase in temperature.
All tumors were followed during different days after each treatment, depending on the healing process and suffering of the animal. This follow-up time is an important parameter, since the longer the time for the animal’s euthanasia, the slower was the tumor growth and the more efficient was the treatment, even when there was a recurrence. The control groups (only saline, only light, only GO and only ICG) were observed and presented similar results with the continuous growth of the tumor.
The mice image examples (Figure 9) show the follow-up of mice treated using the PDT/PTT techniques based on the ICG, GO+PEGFA+RhodB, GO+PEGFA+ICG nanocomposites. The groups GO+PEGFA+RhodB and GO+PEGFA+ICG under illumination caused the most significant damage in the tumor due to the thermal effect, as these tumors presented larger and thicker crusts 5 days after procedures. In addition, all tumors showed almost complete tissue healing and hair regrowth on the day of euthanasia (between 18 and 20 days after treatments).
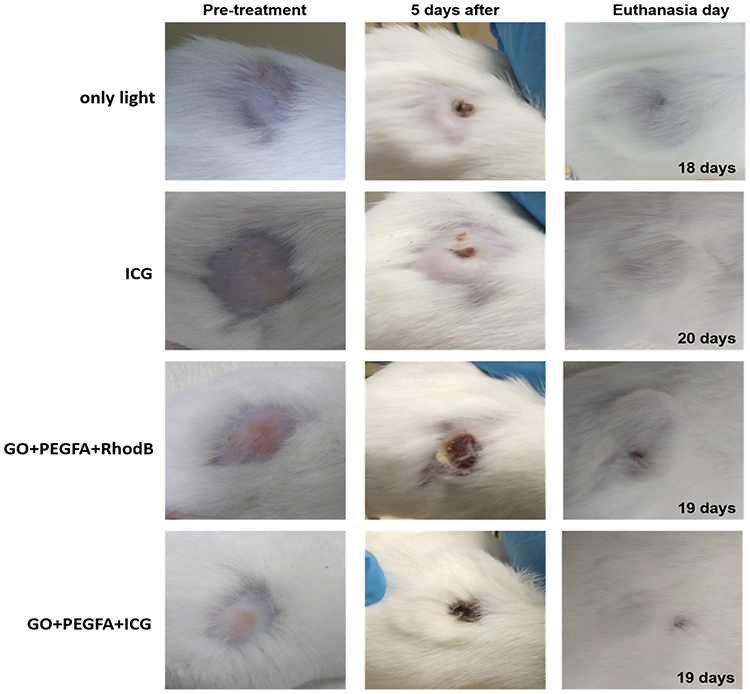 |
Figure 9 The representative mice images showing the sizes of tumors at pre-treatment day, 5th, and euthanasia day under 808 nm, 1.8 W/cm2 for: light, ICG, GO+PEGFA+RhodB and GO+PEGFA+ICG mice groups. |
The ratio between the variation of final volume and the initial volume (V-Vo/Vo) was normalized by day´s number of follow-up “R”. The higher the R value, the shorter was the time until the tumor reaches a large volume. The comparison was made among the groups: ONLY LIGHT (as a control) and treatment with ICG, GO+RhodB, GO+PEGFA+RhodB and GO+PEGFA+ICG nanocomposites under illumination (5 animals per group). The values for R were 1.03, 0.48, 0.42, 0.32 and 0.19, respectively. These values and the tumor volumes are summarized in Table 4.
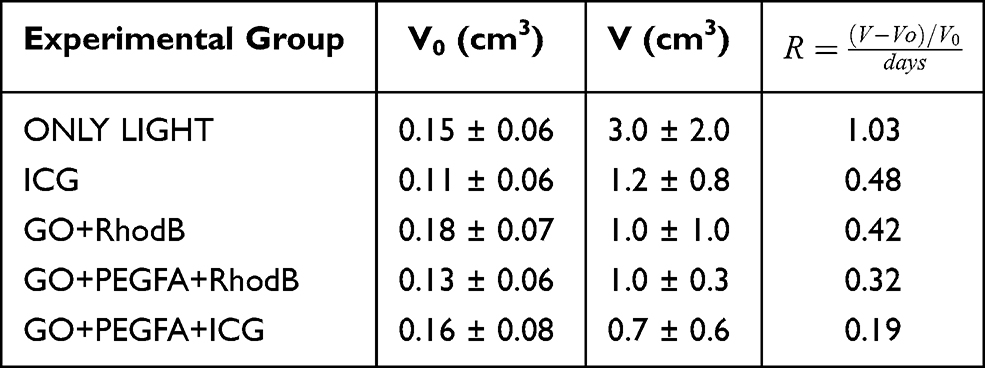 |
Table 4 Tumor Volumes of Only Light, GO+RhodB, GO+PEGFA+RhodB and GO+PEGFA+ICG Groups |
Table 4 - R parameter for comparing all groups: ONLY LIGHT, ICG, GO+RhodB, GO+PEGFA+RhodB and GO+PEGFA+ICG nanocomposites.
The control group “only light”, due to its high power, already caused an increase in temperature and could cause damage to the tumor. With long follow-up, incomplete treatments were analyzed based on the size of the tumor, at least 13 days until 42 days after treatment. Meanwhile, tumor regrowth was analyzed. With the value of R, it is clear that the use of ICG or GO for PTT and PDT showed an individual effect similar, with a greater result GO+PEGFA+RhodB, since preferential accumulation in the tumor region was expected. The combination of therapies (GO+PEGFA+ICG) presented the best result, showing a reduction and impediment of tumor growth including total treatment in 20% of animals.
Despite almost all animals showed residual tumor, there was a clear delay in the tumor growth of the treated groups compared to the controls and, mainly, that this residual tumor was located outside the illuminated region. Thus, although there was no complete treatment with just one session, increasing the treated area or performing multiple sessions could lead to complete treatment of the animals. The combination of therapies showed greater efficiency in the treatment of tumors, showing further reducing and preventing tumor growth.
This increase in the therapeutic effect using GO + PEGFA + ICG was due to both the photodynamic and photothermal effects, which act together in biological tissue. When light interacts with this compound that accumulates more in the tumor due to the presence of PEGFA, it achieved both effects of the two compounds simultaneously. One of the possibilities is that the photothermal effect was enhanced due to the photodynamic effect that preceded it, whose two molecules present at the beginning of the radiation, when the doses of light promoted changes in the energy state. From the photodynamic effect, with the high absorption of molecules, there was an increase in the local temperature, which would already happen with the presence of one or another molecule, but it was increased in these conditions (as shown in Figure 7). In another direction, the gradual increase in temperature dilates the tumor microvessels, increasing tissue oxygenation and, therefore, improving the photodynamic effect in the region. Thus, a joint reaction occurred, where the photothermal effect amplified the photodynamic effect, which in turn amplified the photothermal effect, resulting in the best therapeutic response found.
Conclusions
Herein, a simple non-covalent approach was taken to immobilize the ICG hydrophobic photosensitizer by π-π stacking in graphene oxide covalently linked with Polyethylene Glycol-Folate (PEGFA) to produce GO+PEGFA+ICG. Taking advantage of the broad near-infrared absorption (600–1200 nm) of Graphene and the ICG photosensitizer (808 nm), it was facilitated the induction of PTT/PDT with a single excitation wavelength. GO+PEGFA was linked with the fluorescent label Rhodamine B (RhodB), to obtain in vivo fluorescence imaging with 500 nm wavelength excitation. We used the strong optical absorbance of GO+PEGFA+RhodB and GO+PEGFA+ICG (nc-GO nanocomposites) as the theranostic agent, achieving tumor ablation after intraperitoneal administration and 1.8 W/cm2 intensity NIR laser irradiation on the tumor. The fluorescence images of RhodB were performed in the tumor in order to obtain the highest concentration of nc-GO as a function of time (after intraperitoneal injection). The time obtained was used for the efficient treatment of the tumor by PDT/PTT. The present study evidences the successful use of nc-GO nanocomposites as a theranostic nanomedicine to simultaneously exercise the diagnosis of fluorescence in vivo through the combined PDT-PTT effects using an infrared light of 1.8 W/cm2 for future clinical treatments against cancer. Efficiently localized nc-GO improves retention at tumor sites and selective effect, opening a new avenue for the search for nc-GO-based antitumor agents that comprise a wide range of possibilities regarding the future of the medical field.
Ethics Statement
Consolidated Opinion of the Ethics Committee on the Use of Animals IFSC (attached document “emenda certificado”).
The Ethics Committee on the Use of Animals of the São Carlos Institute of Physics – University of São Paulo, in carrying out its duties, analyzed and approved the Amendment (version of 28/February/2018) of the proposal referred to above. Summary presented by the researcher:
“From the synthesis of graphene, the result of a post doc project by our Research group and, considering that this nanoparticle has the same photothermal properties as the substances previously described in this project, experimental groups will be included for the same tests with this new substance, with two different formulations: graphene and nanographene and with the graphene + fluorescein complex, which will allow fluorescence monitoring of the kinetics of this substance until the tumor, 6 new experimental groups will be included, with intraperitoneal injection: G1 - Control Group - only graphene G2- Control Group - only nanographene G3- Control Group - only graphene + fluorescein G4- TFT group graphene + light G5- TFT group - nanographene + light G6- Group TFT - (graphene + fluorescein) + light considering 3 animals per group, will be a total of 18 animals.
Acknowledgments
The authors thank the Buzza scholarship by Sao Paulo Research Foundation – FAPESP grant 2016/14033-6 and Estevao scholarship by Sao Paulo Research Foundation – FAPESP grant 2017/22056-9.
Funding
This work was supported by: Escuela Politécnica Nacional Quito- Ecuador; Instituto de Fisica de Sao Carlos - Universidade de Sao Paulo; National Council for Scientic and Technological Development CNPq 432828/2016-8 and CNPq 150983/2017-4; FAPESP 2016/14033-6; FAPESP 2013/07276-1; CNPq 465360/2014-9.
Disclosure
The authors declare no competing interests.
References
1. Aghebati‐Maleki A, Dolati S, Ahmadi M, et al. Nanoparticles and cancer therapy: perspectives for application of nanoparticles in the treatment of cancers. J Cell Physiol. 2020;235(3):1962–1972. doi:10.1002/jcp.29126
2. Syama S, Mohanan PV. Comprehensive application of graphene: emphasis on biomedical concerns. Nano-Micro Lett. 2019;11(1):1–31. doi:10.1007/s40820-019-0237-5
3. Syama S, Mohanan PV. Safety and biocompatibility of graphene: a new generation nanomaterial for biomedical application. Int J Biol Macromol. 2016;86:546–555. doi:10.1016/j.ijbiomac.2016.01.116
4. Karahan HE, Wang Y, Li W, et al. Antimicrobial graphene materials: the interplay of complex materials characteristics and competing mechanisms. Biomater Sci. 2018;6(4):766–773. doi:10.1039/c7bm00987a
5. Lu D, Tao R, Wang Z. Carbon-based materials for photodynamic therapy: a mini-review. Front Chem Sci Eng. 2019;13(2):310–323. doi:10.1007/s11705-018-1750-7
6. Lombardo D, Kiselev MA, Caccamo MT. Smart nanoparticles for drug delivery application: development of versatile nanocarrier platforms in biotechnology and nanomedicine. J Nanomater. 2019;2019:1–26. doi:10.1155/2019/3702518
7. Chenthamara D, Subramaniam S, Ramakrishnan SG, et al. Therapeutic efficacy of nanoparticles and routes of administration. Biomater Res. 2019;23(1):1–29. doi:10.1186/s40824-019-0166-x
8. Tian B, Wang C, Zhang S, Feng L, Liu Z. Photothermally enhanced photodynamic therapy delivered by nano-graphene oxide. ACS Nano. 2011;5(9):7000–7009. doi:10.1021/nn201560b
9. Su S, Wang J, Wei J, Martínez-Zaguilán R, Qiu J, Wang S. Efficient photothermal therapy of brain cancer through porphyrin functionalized graphene oxide. New J Chem. 2015;39(7):5743–5749. doi:10.1039/c5nj00122f
10. Wang C, Dai C, Hu Z, et al. Photonic cancer nanomedicine using the near infrared-II biowindow enabled by biocompatible titanium nitride nanoplatforms. Nanoscale Horizons. 2019;4(2):258–272. doi:10.1039/c8nh00299a
11. Zhen W, Liu Y, Jia X, Wu L, Wang C, Jiang X. Reductive surfactant-assisted one-step fabrication of a BiOI/BiOIO3 heterojunction biophotocatalyst for enhanced photodynamic theranostics overcoming tumor hypoxia. Nanoscale Horizons. 2019;4(3):720–726. doi:10.1039/c8nh00440d
12. Chen H, Liu T, Su Z, Shang L, Wei G. 2D transition metal dichalcogenide nanosheets for photo/thermo-based tumor imaging and therapy. Nanoscale Horizons. 2018;3(2):74–89. doi:10.1039/c7nh00158d
13. Zhang J, Zhang D, Li Q, et al. Task-specific design of immune-augmented nanoplatform to enable high-efficiency tumor immunotherapy. ACS Appl Mater Interfaces. 2019;11(46):42904–42916. doi:10.1021/acsami.9b13556
14. Zhang D, Zhang J, Li Q, Song A, Li Z, Luan Y. Cold to hot: rational design of a minimalist multifunctional photo-immunotherapy nanoplatform toward boosting immunotherapy capability. ACS Appl Mater Interfaces. 2019;11(36):32633–32646. doi:10.1021/acsami.9b09568
15. Chen J, Chen S, Zhao X, Kuznetsova LV, Wong SS, Ojima I. Functionalized single-walled carbon nanotubes as rationally designed vehicles for tumor-targeted drug delivery. J Am Chem Soc. 2008;130(49):16778–16785. doi:10.1021/ja805570f
16. Cao J, An H, Huang X, et al. Monitoring of the tumor response to nano-graphene oxide-mediated photothermal/photodynamic therapy by diffusion-weighted and BOLD MRI. Nanoscale. 2016;8(19):10152–10159. doi:10.1039/c6nr02012g
17. Yang K, Wan J, Zhang S, Tian B, Zhang Y, Liu Z. The influence of surface chemistry and size of nanoscale graphene oxide on photothermal therapy of cancer using ultra-low laser power. Biomaterials. 2012;33(7):2206–2214. doi:10.1007/s12274-012-0200-y
18. Pei X, Zhu Z, Gan Z, et al. PEGylated nano-graphene oxide as a nanocarrier for delivering mixed anticancer drugs to improve anticancer activity. Sci Rep. 2020;10(1):1–15. doi:10.1038/s41598-020-59624-w
19. Jang S-C, Kang S-M, Lee JY, et al. Nano-graphene oxide composite for in vivo imaging. Int J Nanomed. 2018;13:221–234. doi:10.2147/IJN.S148211
20. Motlagh NSH, Parvin P, Mirzaie ZH, Karimi R, Sanderson JH, Atyabi F. Synergistic performance of triggered drug release and photothermal therapy of MCF7 cells based on laser activated PEGylated GO + DOX. Biomed Opt Express. 2020;11(7):3783. doi:10.1364/boe.389261
21. Liu J, Yuan X, Deng L, et al. Graphene oxide activated by 980 nm laser for cascading two-photon photodynamic therapy and photothermal therapy against breast cancer. Appl Mater Today. 2020;20:100665. doi:10.1016/j.apmt.2020.100665
22. Kalluru P, Vankayala R, Chiang CS, Hwang KC. Nano-graphene oxide-mediated In vivo fluorescence imaging and bimodal photodynamic and photothermal destruction of tumors. Biomaterials. 2016;95:1–10. doi:10.1016/j.biomaterials.2016.04.006
23. Yang K, Zhang S, Zhang G, Sun X, Lee ST, Liu Z. Graphene in mice: ultrahigh in vivo tumor uptake and efficient photothermal therapy. Nano Lett. 2010;10(9):3318–3323. doi:10.1021/nl100996u
24. Sharker SM, Lee JE, Kim SH, et al. pH triggered in vivo photothermal therapy and fluorescence nanoplatform of cancer based on responsive polymer-indocyanine green integrated reduced graphene oxide. Biomaterials. 2015;61:229–238. doi:10.1016/j.biomaterials.2015.05.040
25. Marangoni VS, Germano LD, Silva CCC, De Souza EA, Maroneze CM. Engineering two-dimensional gold nanostructures using graphene oxide nanosheets as a template. Nanoscale. 2018;10(28):13315–13319. doi:10.1039/c8nr02855a
26. Romero MP, Marangoni VS, de Faria CG, et al. Graphene oxide mediated broad-spectrum antibacterial based on bimodal action of photodynamic and photothermal effects. Front Microbiol. 2020;10:2995. doi:10.3389/fmicb.2019.02995
27. Santos MA, Marques L, Silva CDCC. Purification of graphene oxide dispersions by using a fluidic cell. Anal Methods. 2020;12(28):3575–3581. doi:10.1039/d0ay00600a
28. Zhang W, Shi Y, Chen Y, Ye J, Sha X, Fang X. Multifunctional Pluronic P123/F127 mixed polymeric micelles loaded with paclitaxel for the treatment of multidrug resistant tumors. Biomaterials. 2011;32(11):2894–2906. doi:10.1016/j.biomaterials.2010.12.039
29. Estevão MB, Miletto I, Marchese L, Gianotti E. Optimized Rhodamine B labeled mesoporous silica nanoparticles as fluorescent scaffolds for the immobilization of photosensitizers: a theranostic platform for optical imaging and photodynamic therapy. Phys Chem Chem Phys. 2016;18(13):9042–9052. doi:10.1039/c6cp00906a
30. Liu JJ, Chen ZT, Tang DS, Wang YB, Kang LT, Yao JN. Graphene quantum dots-based fluorescent probe for turn-on sensing of ascorbic acid. Sensors Actuators, B Chem. 2015;212:214–219. doi:10.1016/j.snb.2015.02.019
31. Romero MP, Gobo NRS, De Oliveira KT, Iamamoto Y, Serra OA, Louro SRW. Photophysical properties and photodynamic activity of a novel menthol-zinc phthalocyanine conjugate incorporated in micelles. J Photochem Photobiol a Chem. 2013;253:22–29. doi:10.1016/j.jphotochem.2012.12.009
32. Tomayko MM, Reynolds CP. Determination of subcutaneous tumor size in athymic (nude) mice. Cancer Chemother Pharmacol. 1989;24(3):148–154. doi:10.1007/BF00300234
33. Imani R, Shao W, Emami SH, Faghihi S, Prakash S. Improved dispersibility of nano-graphene oxide by amphiphilic polymer coatings for biomedical applications. RSC Adv. 2016;6(81):77818–77829. doi:10.1039/c6ra15531f
34. Wazir AH, Kundi IW. Synthesis of graphene nano sheets by the rapid reduction of electrochemically exfoliated graphene oxide induced by microwaves. J Chem Soc Pak. 2016;38(01):11–16.
35. Liu K, Li H, Wang Y, Gou X, Duan Y. Adsorption and removal of rhodamine B from aqueous solution by tannic acid functionalized graphene. Colloids Surfaces a Physicochem Eng Asp. 2015;477:35–41. doi:10.1016/j.colsurfa.2015.03.048
36. Rotermund F, Weigand R, Penzkofer A. J-aggregation and disaggregation of indocyanine green in water. Chem Phys. 1997;220(3):385–392. doi:10.1016/S0301-0104(97)00151-1
37. Jin SH, Kim DH, Jun GH, Hong SH, Jeon S. Tuning the photoluminescence of graphene quantum dots through the charge transfer effect of functional groups. ACS Nano. 2013;7(2):1239–1245. doi:10.1021/nn304675g
38. Li B, Zhang X, Yang J, et al. Influence of polyethylene glycol coating on biodistribution and toxicity of nanoscale graphene oxide in mice after intravenous injection. Int J Nanomedicine. 2014;9(1):4697. doi:10.2147/IJN.S66591
39. Ferrari AC, Meyer JC, Scardaci V, et al. Raman spectrum of graphene and graphene layers. Phys Rev Lett. 2006;97(18):187401. doi:10.1103/PhysRevLett.97.187401
40. Chen J, Wang X, Chen T. Facile and green reduction of covalently PEGylated nanographene oxide via a ‘water-only’ route for high-efficiency photothermal therapy. Nanoscale Res Lett. 2014;9(1):86. doi:10.1186/1556-276X-9-86
41. Lv R, Li Q, Botello-Méndez AR, et al. Nitrogen-doped graphene: beyond single substitution and enhanced molecular sensing. Sci Rep. 2012;2(1):1–8. doi:10.1038/srep00586
42. Shan L, Zhuo X, Zhang F, et al. A paclitaxel prodrug with bifunctional folate and albumin binding moieties for both passive and active targeted cancer therapy. Theranostics. 2018;8(7):2018–2030. doi:10.7150/thno.24382
43. Li J‐L, Bao H‐C, Hou X‐L, Sun L, Wang X‐G, Gu M. Graphene Oxide Nanoparticles as a Nonbleaching Optical Probe for Two‐Photon Luminescence Imaging and Cell Therapy. Angew Chem Int Ed. 2012;51(8):1830–1834. doi:10.1002/anie.201106102
44. Yang K, Wan J, Zhang S, Zhang Y, Lee ST, Liu Z. In vivo pharmacokinetics, long-term biodistribution, and toxicology of pegylated graphene in mice. ACS Nano. 2011;5(1):516–522. doi:10.1021/nn1024303
45. Sun X, Liu Z, Welsher K, et al. Nano-graphene oxide for cellular imaging and drug delivery. Nano Res. 2008;1(3):203–212. doi:10.1007/s12274-008-8021-8
46. Xia FN, Wang H, Xiao D, Dubey M, Ramasubramaniam A. Two-dimensional material nanophotonics. Nat Photonics. 2014;8:899–907. doi:10.1038/nphoton.2014.271.
 © 2021 The Author(s). This work is published and licensed by Dove Medical Press Limited. The full terms of this license are available at https://www.dovepress.com/terms.php and incorporate the Creative Commons Attribution - Non Commercial (unported, v3.0) License.
By accessing the work you hereby accept the Terms. Non-commercial uses of the work are permitted without any further permission from Dove Medical Press Limited, provided the work is properly attributed. For permission for commercial use of this work, please see paragraphs 4.2 and 5 of our Terms.
© 2021 The Author(s). This work is published and licensed by Dove Medical Press Limited. The full terms of this license are available at https://www.dovepress.com/terms.php and incorporate the Creative Commons Attribution - Non Commercial (unported, v3.0) License.
By accessing the work you hereby accept the Terms. Non-commercial uses of the work are permitted without any further permission from Dove Medical Press Limited, provided the work is properly attributed. For permission for commercial use of this work, please see paragraphs 4.2 and 5 of our Terms.