")
Back to Journals » International Journal of Nanomedicine » Volume 17
Graphene Oxide Enhances Biogenesis and Release of Exosomes in Human Ovarian Cancer Cells
Authors Gurunathan S , Kim JH
Received 5 August 2022
Accepted for publication 4 November 2022
Published 28 November 2022 Volume 2022:17 Pages 5697—5731
DOI https://doi.org/10.2147/IJN.S385113
Checked for plagiarism Yes
Review by Single anonymous peer review
Peer reviewer comments 2
Editor who approved publication: Dr Yan Shen
Sangiliyandi Gurunathan, Jin Hoi Kim
Department of Stem Cell and Regenerative Biotechnology, Konkuk University, Seoul, 05029, Korea
Correspondence: Jin Hoi Kim, Department of Stem Cell and Regenerative Biotechnology, Konkuk University, Seoul, 05029, Korea, Tel +82 2 450 3687, Fax +82 2 544 4645, Email [email protected]
Background: Exosomes, which are nanovesicles secreted by almost all the cells, mediate intercellular communication and are involved in various physiological and pathological processes. We aimed to investigate the effects of graphene oxide (GO) on the biogenesis and release of exosomes in human ovarian cancer (SKOV3) cells.
Methods: Exosomes were isolated using ultracentrifugation and ExoQuick and characterized by various analytical techniques. The expression levels of exosome markers were analyzed via quantitative reverse transcription-polymerase chain reaction and enzyme-linked immunosorbent assay.
Results: Graphene oxide (10– 50 μg/mL), cisplatin (2– 10 μg/mL), and C6-ceramide (5– 25 μM) inhibited the cell viability, proliferation, and cytotoxicity in a dose-dependent manner. We observed that graphene oxide (GO), cisplatin (CIS), and C6-Ceramide (C6-Cer) stimulated acetylcholine esterase and neutral sphingomyelinase activity, total exosome protein concentration, and exosome counts associated with increased level of apoptosis, oxidative stress and endoplasmic reticulum stress. In contrast, GW4869 treatment inhibits biogenesis and release of exosomes. We observed that the human ovarian cancer cells secreted exosomes with typical cup-shaped morphology and surface protein biomarkers. The expression levels of TSG101, CD9, CD63, and CD81 were significantly higher in GO-treated cells than in control cells. Further, cytokine and chemokine levels were significantly higher in exosomes isolated from GO-treated SKOV3 cells than in those isolated from control cells. SKOV3 cells pre-treated with N-acetylcysteine or GW4869 displayed a significant reduction in GO-induced exosome biogenesis and release. Furthermore, endocytic inhibitors decrease exosome biogenesis and release by impairing endocytic pathways.
Conclusion: This study identifies GO as a potential tool for targeting the exosome pathway and stimulating exosome biogenesis and release. We believe that the knowledge acquired in this study can be potentially extended to other exosome-dominated pathologies and model systems. Furthermore, these nanoparticles can provide a promising means to enhance exosome production in SKOV3 cells.
Keywords: graphene, exosome, oxidative stress, endoplasmic reticulum stress, endocytic pathways, human ovarian cancer cells
Introduction
Extracellular vesicles (EVs) are nanosized membranous vesicles released from almost all cell types.1 The EVs can be classified into exosomes, microvesicles (MVs), and apoptotic bodies based on their biogenesis.2 They were originally believed to be a source of cellular clearance of waste materials, such as apoptotic bodies.2 However, EVs can carry various biological constituents, such as lipids, proteins, and nucleic acids, and are considered cargo delivery systems for long-distance communication between cells.2 Exosomes are nano-sized vesicles (30–100 nm) secreted by all cell types derived from the endomembrane system, containing intraluminal vesicles, fusing with the plasma membrane, releasing the intraluminal vesicles as exosomes for various types of signaling.3 These are formed by inward budding of the limiting membrane of multivesicular bodies (MVBs), leading to the generation of intraluminal vesicles (ILVs). Merging the multivesicular endosome and the plasma membrane involves Rab and SNARE proteins, similar to the membrane fusion events in exocytosis.4 EVs are critical mediators of intercellular communication and thus play significant roles in physiological and pathological processes, namely, stem cell maintenance, tissue repair, immune modulation, and tumor growth.5–8 The biogenesis of EVs is a sophisticated regulation process governed by a set of signaling molecules, also discussed in several other reviews.3,9–12 Moreover, EVs play a pivotal role in intercellular communication by carrying bio-functional molecules, such as proteins, mRNAs, and miRNAs. EVs regulate various normal physiological activities, as well as participate in the initiation and progression of tumors. Ceramide, generated from sphingomyelin hydrolysis by neutral sphingomyelinase 2 (nSMase2), induces negative membrane curvature via its cone-shaped structure, leading to ILV budding into MVBs.13 Hence, the ceramide-dependent mechanism plays a critical role in exosome biogenesis.14 Gurunathan et al15 reported that dynamin and clathrin are required for the biogenesis of a distinct class of secretory vesicles in yeast.
The endosomal sorting complex required for transport (ESCRT) machinery is required for MVB biogenesis, which is responsible for sorting ubiquitinated proteins into ILVs.16 This process is initiated by ESCRT-0, which recognizes and retains ubiquitinated proteins in the late endosomal membrane. After the initial involution of the limiting membrane into the MVB lumen triggered by ESCRT-I/II, ESCRT-III forms a spiral-shaped structure that constricts the budding neck and the ATPase vacuolar protein sorting-associated protein 4 (VPS4) drives membrane scission. The ESCRT mechanism is initiated by the recognition and sequestration of ubiquitinated proteins to specific domains of the endosomal membrane via ubiquitin binding subunits of ESCRT-0. The formation of ILVs is regulated by ESCRT complexes (0–III). Exosomal protein Alix is involved in endosomal membrane budding, abscission, and exosomal cargo selection via interaction with syndecan.17 In contrast, biogenesis and release of exosomes are regulated in an ESCRT-independent manner, which seems to depend on raft-based microdomains, highly enriched in sphingomyelinases, from which ceramides are formed.18 Besides lipid molecules, exosomal proteins such as tetraspanins are involved in exosome biogenesis and protein loading. Tetraspanin-enriched microdomains (TEMs) are involved in compartmentalizing receptors and signaling proteins in the plasma membrane.19
EV biogenesis and release are regulated by various factors such as cholesterol,20 cell detachment,21 cell type,22 serum,23 Ca2+ ionophores,24 hypoxia,25 and oxidative stress.26 Oxidative stress-induced autophagy promotes exosome release.27 Recent studies suggest that platinum and palladium nanoparticles induce biogenesis and release of exosomes through stimulation of oxidative stress in human adenocarcinoma and leukemia monocytic cells, respectively.28,29 Several factors are involved in controlling biogenesis and release of extracellular vesicles and exosomes, such as intracellular calcium concentration- and oxidative stress-induced Hb-oxidation.30 In cancer cells exposed to liposomes, such as neutral, cationic-bare, or PEGylated liposomes, the level of exosomes was significantly increased.31 Cellular stress alters EV number, activity, and composition, as well as the surface and intra-vesicular proteins.32–34 Serum withdrawal improves exosome activity and alters the lipid and protein compositions of mesenchymal stem cells.35 Stress factors such as thermal, oxidative, and hypoxic conditions enhance exosome secretion from leukemia/lymphoma T-/ B-cell lines.36,37 Melphalan and/ or bortezomib increase exosome release in multiple myeloma cells.38,39 Chemotherapeutic agents such as 5-fluorouracil, cisplatin, and doxorubicin enhance the amount of HSP70+ exosomes secreted from melanoma and colon cancer cell lines.40 Generally, nanoparticles induces oxidative stress, and endoplasmic reticulum stress and eventually leads to increases secretion of exosomes. For example, Silver nanoparticles (AgNPs) induce cytotoxicity, oxidative stress, and apoptosis in cancer and non-cancer cells. Park et al,41 reported that the iron oxide-based nanoparticles increase stem cell‑derived exosomes by clathrin-mediated endocytosis. Furthermore, nanoparticles stimulated autophagy-related factors to release exosomes from the mesenchymal stem cells (MSCs). As a result of cytotoxic and oxidative stresses, exosome release were significantly facilitated in AgNPs-treated cells, which is strongly correlated with the AgNPs-induced oxidative stress.42
Ovarian cancer is a leading malignancy and the deadliest disease in women. Conventionally, ovarian cancer can be treated using different therapies such as radiation, immunotherapy, chemotherapy, and surgery. Exosome-mediated treatment of ovarian cancer has recently gained increased interest. Exosomes from ovarian cancer consist of bioactive molecules involved in tumor progression and invasion. Nanoparticles have dominated several applications, including drug delivery, bio-imaging, cell labeling, gene delivery, and targeted therapy. The biomedical applications of graphene and graphene-derived materials have generated significant interest over the last decade.43 Graphene is a two-dimensional atomic crystal. Owing to its unique properties, it has been used as an essential component in various biomedical components, including sensors, batteries, fuel cells, supercapacitors, transistors, components of high-strength machinery, as well as display screens in mobile devices. Furthermore, graphene reportedly exhibits antibacterial, antiplatelet, and anticancer activities.43 The prominent availability of OH and COOH functional groups in the GO is easily cross-linked to various materials, such as quantum dots, DNA, protein, biomolecules, or polymers, which prevent aggregation in salt and other biological solutions and improve biocompatibility.44 GO functionalized with PEG exhibited high thermal stability, improved biocompatibility, and significant photothermal influence. These potential characters increased interleukin‐4‐induced M2 polarization of macrophages and regulated their antitumor potentials in human osteosarcoma. Chitosan‐functionalized GO nanoplatforms were conjugated with folic acid potentially destroyed tumors under laser irradiation and other potential applications of GO were summarised in several reviews.43,44
Owing to its excellent biocompatibility, solubility, and selectivity, graphene and its derivatives have presented great potential applications in nanomedicine. Moreover, the unique physicochemical properties of graphene and its derivatives, such as large surface area, high purity, good bio-functional ability, easy solubility, and high drug loading capacity, conferred easy cell membrane penetration and exhibited anti-cancer effects in various types of cancer cells by inducing oxidative stress, increased level of lactate dehydrogenase, malondialdehyde, caspase-3 activation, DNA fragmentation, increased level of pro-oxidants, and decreased level of anti-oxidants.43,45–48 All these factors are responsible for increased biogenesis and release of exosomes. Thus, the focus of this study was to assess the effect of graphene oxide on biogenesis and release of exosome in human ovarian cancer cells.
Materials and Methods
Synthesis of Graphene Oxide
Graphene oxide (GO) were synthesized using Hummers’ method with slight modification.49,50 To obtain ultra-small uniform GO sheets, low-speed centrifugation at 5000 rpm was first used to remove the thick multilayer flakes until all visible particles were removed (15 min). The supernatant was further centrifuged at 8000 rpm for 10 min to obtain the GO sheets. To prepare size-controlled GO, 500 mg of as-synthesized GO powders were dissolved in 50 mL of deionized (DI) water and divided into two 20-mL vials. Each GO suspension (10 mg/mL in DI water) was subjected to ultrasonication using a probe-type sonicator (Vibra-Cell VCX-500, 500 W, 20 kHz, Sonics & Materials, Inc., Newtown, CT, USA) at 25% amplitude for 10 and 60 min to yield GO sheets with different small sizes. An ice bath was used to avoid increasing the temperature during probe sonication.
Cell Culture and Treatment
SKOV3 cell lines were maintained in Dulbecco’s Modified Eagle Medium (DMEM) supplemented with 10% fetal bovine serum (FBS), 100 U/mL penicillin, and 100 μg/mL streptomycin and were maintained in a humidified incubator at 37 °C at 5% CO2. Cells were routinely grown in 100-mm plastic tissue culture dishes (Nunc, Roskilde, Denmark) and harvested in a solution of trypsin-EDTA while in a logarithmic growth phase. Experiments were performed in 96-, 24-, and 12-well plates, and 100-mm cell culture dishes, following the protocol. Cells were treated with the required doses of GO, CIS, C6-Cer, or GW4869.
Cell Viability and Cell Proliferation
Cell viability was computed using a Cell Counting Kit-8 (CCK-8; CK04-01, Dojindo Laboratories, Kumamoto, Japan). Cell proliferation was determined according to the manufacturer’s instructions (Roche). Briefly, SKOV3 cells were plated in 96-well flat-bottom culture plates containing GO (25 µg/mL), CIS (6 µg/mL), C6-Cer (15 µg/mL), or GW4869 (25 µM). After a 24 h culture at 37 °C and 5% CO2 in a humidified incubator, CCK-8 solution (10 μL) was added to each well. The plate was incubated for another 2 h at 37 °C. Absorbance was measured at 450 nm using a microplate reader (Multiskan FC; Thermo Fisher Scientific Inc., Waltham, MA, USA).
Membrane Integrity and Assessment of Dead-Cell Protease Activity
Membrane integrity of SKOV3 cells was evaluated using an LDH Cytotoxicity Detection Kit. Dead-cell protease activity was assessed as previously described.51
Trypan Blue Assay and Measurement of ATP
Cell mortality was evaluated using the trypan blue assay, as described previously.45 ATP level was measured in SKOV3 cells according to the manufacturer’s instructions (Sigma-Aldrich Catalog Number MAK135, St. Louis, MO, USA). The cells were exposed to various concentrations of GO for 24 h, and the ATP level was measured.
Determining ROS, MDA, Nitric Oxide (NO), Carbonylated Protein Levels, Lipid Hydroperoxide, and 8-Isoprostane
ROS was estimated as described previously.52 MDA levels were determined using a previously described thiobarbituric acid-reactive substances assay with suitable modifications. NO production was quantified spectrophotometrically using Griess reagent (Sigma-Aldrich). Absorbance was measured at 540 nm, and nitrite concentration was determined using a calibration curve prepared with sodium nitrite as the standard.53,54 Carbonylated protein content was determined according to a previously described method.55 Lipid hydroperoxide and 8-isoprostane levels were also measured as previously described.52,56
Measurement of Anti-Oxidative Marker Levels
The expression levels of anti-oxidant markers such as glutathione (GSH), thioredoxin reductase (TRX), catalase (CAT), superoxide dismutase (SOD), glutathione peroxidase (GPx), and glutathione S-transferase (GST) were determined as described previously57 and per the manufacturer’s instructions.
JC-1 Assay and Measurement of Caspase-9/3 Activity
The change in mitochondrial transmembrane potential (MTP) was determined using the cationic fluorescent dye JC-1 (Molecular Probes, Eugene, OR). Measurement of caspase-9/3 activity was performed according to a method described earlier.58
Measuring 4-Hydroxynonenal (HNE), 8-Oxo-7,8-Dihydro-2′-Deoxyguanosine (8-Oxo-dG), and 8-Oxo-G Levels
SKOV3 cells were treated with GO (25 µg/mL), CIS (6 µg/mL), C6-Cer (15 µg/mL), or GW4869 (25 µM) and incubated for 24 h. Subsequently, 4-hydroxynonenal (HNE), 8-OHDG, and 8-OHG levels were determined as previously described59 following the manufacturer’s instructions (Trevigen, Gaithersburg, MD, USA).
Isolation, Characterization, Concentration, Quantification of Exosomes
Exosomes were isolated and purified using ExoQuick (EXOQ5TM-1, System Biosciences, Palo Alto, CA, USA) following the manufacturer’s instructions. SEM analysis was performed according to a previously described method.60 Sample preparation for TEM and analysis were performed according to a previously described method.60 The total protein concentration of exosomes was determined using the bicinchoninic acid (BCA) assay kit (Thermo Scientific, Waltham, MA, USA) following the manufacturer’s instructions. Exosome concentration was estimated using the EXOCETTM assay (System Biosciences), performed as described previously.28 Quantification of exosomes by fluorescence polarization (FP) was performed as described previously.61
RNA Isolation and mRNA Expression Analysis Using Quantitative Reverse Transcription-Polymerase Chain Reaction (qRT-PCR)
Exosomes were prepared from culture supernatants of SKOV3 cells either by differential centrifugation or ExoQuick kit. mRNA expression of exosome biomarkers was determined using quantitative reverse transcription-polymerase chain reaction (qRT-PCR).62 The sequences of the PCR primers are presented Supplementary Table 1.
Measurement of Acetylcholinesterase (AChE) Activity and Sphingomyelinase Activity Assay
AchE activity was determined according to a previously described method.63 The sphingomyelinase activity assay was performed as previously described64 following the manufacturer’s protocol. The Amplex Red sphingomyelinase assay kit (Molecular Probes Inc, Eugene, OR, USA) was used to quantify neutral sphingomyelinase activity.
Measurements of Cytokines and Chemokines
SKOV3 cells were treated with GO (25 µg/mL), CIS (6 µg/mL), C6-Cer (15 µg/mL), and GW4869 (25 µM) for 24 h in cell culture medium supplemented with 1% FCS for 24 h. Cytokine and chemokine contents of the exosomes were determined by ELISA.
Effect of Endocytosis Inhibitors on GO Enhanced Biogenesis and Release
The inhibitors were 30 µM chlorpromazine, 20 µM methyl-b-cyclodextrin, 4 µM cytochalasin D, 10 µM nocodazole, and 10 µM dynasore. Each inhibitor dose was selected according to a previous study.65 SKOV3 cells were incubated with these inhibitors for 2 h, the culture medium was removed, and fresh medium containing GO (15 µg/mL) was added to the cells. These were maintained for 2 h, and exosomes were isolated and counted.
Results and Discussion
Synthesis and Characterization of Graphene Oxide
GO was prepared following Hummers’ method,66 oxidizing with strong oxidants and acids for a prolonged time. In this study, we prepared 100 nm-sized GO particles by mild oxidation and a two-step centrifugation approach.50 The prepared GO particles exhibited an absorption peak at 233 nm. These peaks correspond to π→π* transitions for C = C bonding, which is similar to that reported recently. A similar peak was also observed around 300 nm for GO, which is attributed to the n→π* transition of carbonyl groups (C = O) (Figure 1A).46,67 Consequently, we performed Fourier-transform infrared spectroscopy (FTIR), which can determine the GO functional groups. In the FTIR spectrum of GO, because of extensive oxidation, GO has a strong and broad O–H stretching vibration band at 3400 cm−1, carboxyl C=O stretching band at 1560 and 1624 cm−1, O–H deformation vibration band at 1370 cm−1, C–O–C stretching at 1200 cm−1 and C–O stretching vibration at 1020 cm−1. The FTIR peaks corresponding to 2400 cm−1 and 2300 cm−1 are due the asymmetric and symmetric CH2 stretching of GO respectively. The FTIR spectra of GO indicated that characteristic features of bands were observed for the sonicated GO sample at 1624 cm−1 corresponding to C = O stretching vibrations of COOH groups and at 3400 cm−1 corresponding to C – O stretching vibrations of epoxy groups, arising from -OH stretching vibrations. Notably, GO exhibits the characteristic features of the stretching vibrations of C = O and OH groups. Other oxygen-containing functional groups in GO were also observed (Figure 1B).
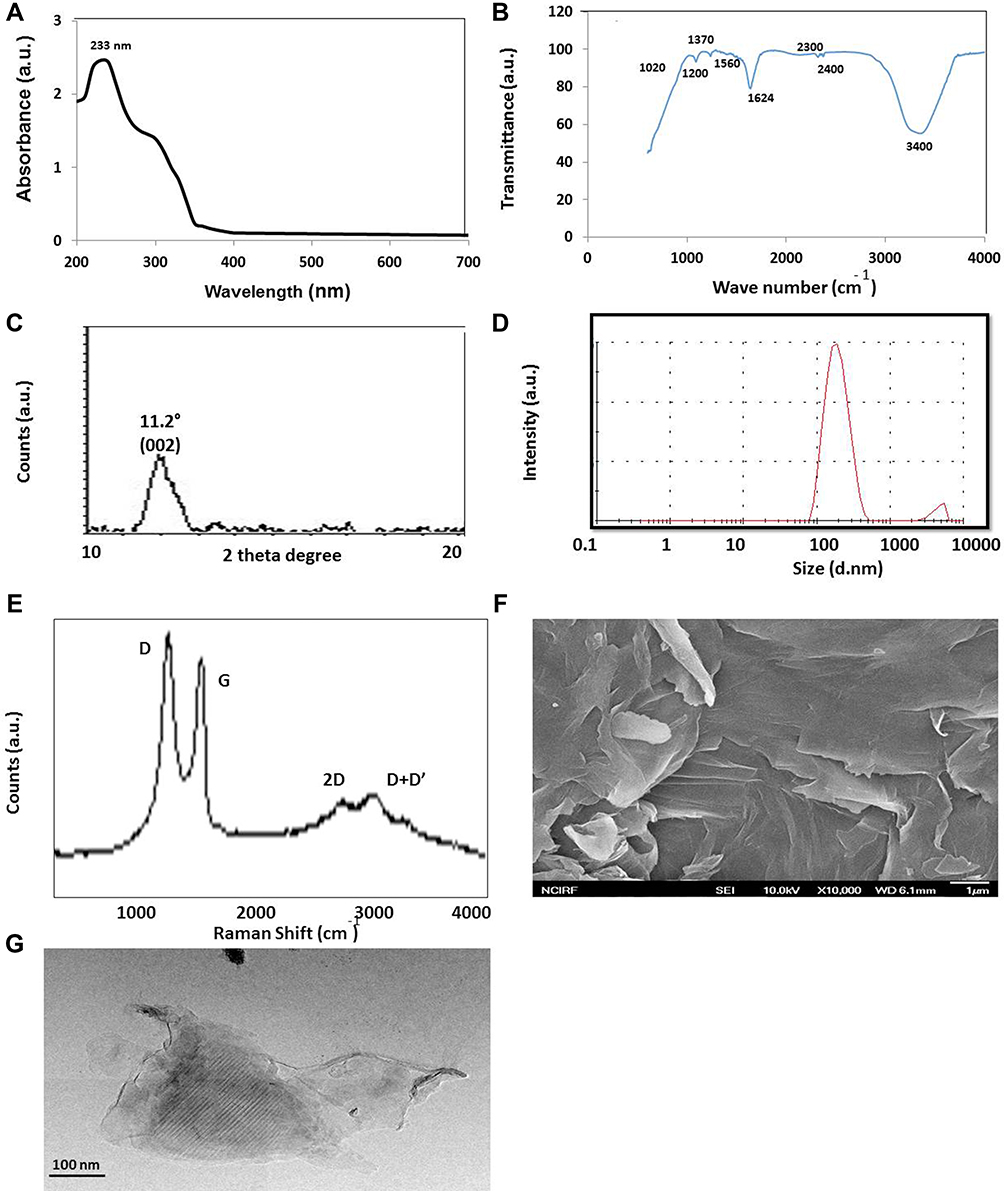 |
Figure 1 Synthesis and characterization of graphene oxide. (A) Ultraviolet-visible spectroscopy of graphene oxide (GO) (B and C) FTIR images of GO (C) x-ray diffraction (XRD) images of GO (D) dynamic light-scattering (DLS) spectra of GO (E) Raman spectroscopy images of GO (F) scanning electron microscope (SEM) images of GO (G) transmission electron microscope (TEM) images of GO. At least three independent experiments were performed for each sample and reproducible results were obtained. The data present the results of a representative experiment. |
X-ray powder diffraction (XRD) analysis was used to characterize the crystalline nature and phase purity of GO. The characteristic peak of sonicated GO was measured, and a strong peak appeared at 2θ = 11.2°, corresponding to an interlayer distance of 7.6 Å (d002). GO displayed peaks at 11.2° (Figure 1C), completely different from graphite which shows a diffraction peak at 2 h = 26.3°, corresponding to an interlayer spacing of approximately 0.34 nm.68 GO showed a broad peak that can be fitted using a Lorentzian function into single and sharp peaks centered at 2θ = 11.2°, corresponding to interlayer distances of 7.6 Å. These XRD results strongly suggest that graphite exfoliated significantly and converted into GO.67 The results exhibited that the appearance of a new peak at a lower diffraction angle starts to grow with increasing oxidation levels, corresponding to the diffraction pattern of GO.
DLS is a valuable alternative technique suited for estimating the size of spherical particles. Size distribution analysis is crucial to determine the cytotoxicity or biocompatibility of nanoparticles in aqueous solutions. Therefore, we determined the GO size using DLS, with a concentration of 250 μg/mL. The average hydrodynamic diameter of GO was 100 nm (Figure 1D). Graphene nanosheets synthesized by an ultrasound-assisted method indicate an average size of 450 ± 14 nm.69 Size can be influenced by pH and temperature. For example, in the graphene oxide sample at pH 7, the size distribution varied between 250–570 nm. In contrast, the population was between 300–500 nm when the sample was titrated with NaOH to a higher pH. The stability of GO was influenced by NaOH, which acts as a hydrogenating agent for graphene oxide.70 Titration with HCl resulted in a large sheet size and poor stability. This can be attributed to the increase in H+ ions in the solution, which gradually increases the sheet size and reduces stability.71
Further characterization was carried out using Raman spectroscopy, a valuable technique for characterizing sp2 and sp3 hybridized carbon atoms, including those in graphite, fullerenes, carbon nanotubes, and graphene. As presented in Figure 1E, the classic Raman spectra of GO exhibited the D-mode and G-mode at approximately 1355 cm−1 and 1580 cm−1, respectively. The other Raman modes were at 2720 cm−1 (2D-mode). The spectra consists of D, G, 2D and D + D bands located at 1355, ∼1580, 2720 and 2920 cm −1, respectively. Raman spectra depicted that I D /I G ratio of GO is 1.1. The G-mode of approximately 1580 cm−1 was due to the E2g mode at the Γ-point. G-band arises from stretching the C – C bond in graphitic materials and is common to all sp2 carbon systems. The G-band is highly sensitive to strain effects in the sp2 system and can be used to probe modifications on the flat surface of graphene.72–74 The D-mode is caused by the disordered structure of graphene. Raman spectroscopy is one of the most sensitive techniques to determine the disorder in sp2-hybridized carbon systems. The D- and G-peaks are ascribed to structural imperfections of GO and the in-plane bond-stretching motion of sp2-hybridized carbon atoms, respectively, in the graphene/graphite lattice. In contrast, the 2D peak can be used to estimate the number of layers in the obtained graphene. Our findings are in significant agreement with previously prepared graphene by the process of oxidation49,75,76 and graphene oxide (GO) by ultrasonic-assisted electrochemical exfoliation of graphite rods.77
Figure 1F presents the FESEM micrographs of the GO that exhibit edge-corrugated sheet structures, which have a lateral dimension in the range of 100 nm to 1 μm. GO displays relatively thick, and the exfoliated sheets exhibited an increment in their domain size with larger platelets and irregular structures. The FESEM images of the GO samples clearly suggest that they are randomly arranged in crumpled nanosheets. The observed morphology of GO consists of randomly aggregated, transparent, flake-like sheets with wrinkles and folds on the surface, along with face-to-face stacking.51,78,79 Further characterization of graphene oxide was performed using transmission electron microscopy.The morphology and characteristic features of GO was illustrated in Figure 1G. GO with consisting of thin stacked flakes of shapes and having well defined multilayered structure at the edge. GO has the tendency to scroll and wrinkle.
Effect of Serum Concentration on Cell Viability, Cell Proliferation, Exosome Protein, and AchE Activity of SKOV3
Fetal bovine serum is one of the most commonly used supplements in eukaryotic cell culture media.80 Serum is a critical factor in maintaining cell viability, whereas high serum concentration leads to inconsistent or opposing results during bioassays.81,82 Removal of known factors in the serum can reduce analytical interference and provide reproducible experimental conditions.83 Serum starvation, or “environmental stress”,84 reduces basal cellular activity.85 Hence we examined the effects of high and low serum concentrations, 10 and 1%, respectively, on cell viability and proliferation of SKOV3 cells. The viability of the cells growing in the 1% serum was significantly low throughout the experiment compared to those grown in DMEM with 10% serum, from 24–120 h (Figure 2A and B). Serum starvation causes apoptosis‐induced cell death in different human cell lines.29,86–89 This results in the arrest of A549 cells in the G1 phase without inducing apoptosis.90 These results suggest that serum concentration plays a vital role in cell survival regardless of the media. While the cells grown on 10% and 1% sera presented different trends, the cells grown on DMEM with 10% serum exhibited no viability loss. Additionally, the cells grown on DMEM with 1% serum demonstrated 50% viability loss at 120 h. Cell viability reduced significantly in a low-serum condition and continued to decrease until 120 h, whereas no significant effect was observed in cells grown in a high-serum condition. Similarly, the rate of cell proliferation was significantly affected in cells grown in a low-serum medium. The rate of loss of cell proliferation was 50% in 1% serum (Figure 2B). The proliferation of Neuro-2a cells grown in a low-serum medium was significantly affected compared to that of the medium containing 10% serum.91 Low-serum concentration influences the expression of HSP45 in A549 cells.92 The cell viability and morphology of human adenocarcinoma cells were also significantly affected in a low serum-containing medium; the cellular protein levels of chloride intracellular channel protein 1, proteasome subunit alpha type 2, and heat shock 70 kDa protein 5 were dysregulated in A549 cells.29,52,92 Collectively, these data suggest that serum has a significant effect on the viability and proliferation of SKOV3 cells. Cell viability and proliferation decreased in a time-dependent manner after the cells were grown in serum-reduced media.
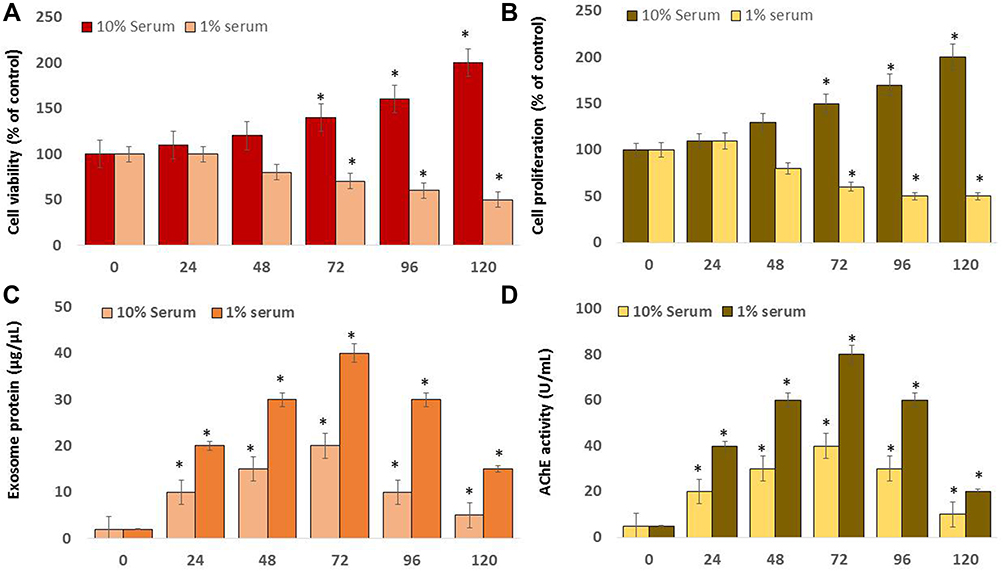 |
Figure 2 Effect of serum concentration on cell viability, cell proliferation, exosome protein, and AChE activity of SKOV3. SKOV3 cells were grown on 10% serum and 1% serum over a 120 h. (A) Cell viability was determined using CCK-8. (B) Cell proliferation was determined using BrdU. (C) The total protein concentration of exosomes was determined using the bicinchoninic acid (BCA) assay kit. (D) AChE activity was determined from isolated exosomes using a colorimetric method. The results are expressed as the mean ± standard deviation of three independent experiments. The treated groups showed statistically significant differences from the control group by the Student’s t-test; *p <0.05 was considered significant. |
Subsequently, to determine the effect of serum concentration in the media, SKOV3 cells were grown in both media containing 1% and 10% sera for 120 h, followed by exosome isolation and protein quantification of exosomes. Concordantly, a low-serum concentration produced a significantly higher amount of exosomal protein compared to that produced by a high serum concentration. The exosomal protein concentration was time-dependent (Figure 2C). Our findings, consistent with previously published reports, suggest that the number of exosomes was significantly higher in cells grown on low-serum media than in cells grown on high-serum media in different types of cells, namely, Neuro-2a 9,93 A549,52,92 and THP-1 cells.28 Consistent with the previous findings, we discovered that the total protein concentration of exosomes was higher in low serum-containing media than in media containing high serum. This indicated that the protein concentration was higher at 72 h and subsequently declined. Therefore, these studies suggest that low serum concentration in a medium is optimal for producing a high amount of exosomes in SKOV3 cells.
Further, we investigated the correlation between the protein concentration and AchE activity of exosomes in SKOV3 cells. The cells were grown in 10 and 1% serum concentrations, and AchE activity was determined. AchE activity indirectly determines the number of exosomes because AchEs are localized to the exosome membranes.63,94 Our results demonstrated that the activity of AchE is dependent on time and serum concentration, suggesting that media containing 1% serum exhibited high levels of AchE activity compared with media containing 10% serum (Figure 2D). Macrophages treated with endotoxins, such as lipopolysaccharides (LPS), exhibited higher AchE activity than that in untreated groups.63 Increasing cell proliferation was directly associated with AchE activity and was also associated with the downregulation of p27 and cyclins in hepatocellular carcinoma cells.95 Therefore, these findings indicate that low serum concentration-induced decreased cell proliferation increases exosome biogenesis and AchE activity.
Dose-Dependent Effect of GO on Cell Viability and Proliferation
The dose-dependent effects of GO on cell viability and cell proliferation were tested in SKOV3 cancer cells using the CCK-8 assay and BrdU assay. Cells were treated with GO (10, 20, 30, 40, 50 µg/mL) for 24 h. The results revealed that GO was cytotoxic and inhibited cell viability, which agreed with findings reported in different types of cancer cells, namely, human breast cancer,46 ovarian cancer,47 cervical cancer,51 human neuroblastoma,48 human ovarian cancer stem cells,96 prostate cancer,97 and human germ cells such as Leydig (TM3) and Sertoli (TM4) cells.50 As presented in Figure 3A, GO displayed cytotoxicity in a concentration-dependent manner. These findings also suggest that GO inhibited the growth of SKOV3 cells in a dose-dependent manner. The IC50 value of GO was 25 µg/ mL. Similarly, cell proliferation was significantly inhibited in a dose-dependent manner (Figure 3B). Mukherjee et al98 reported that GO enters neutrophils and interacts with the plasma membrane of the cells. We previously reported that GO could inhibit cell viability in a dose-dependent manner in MCF-7 cells. GO exerts significant cytotoxicity at a dose > 60 μg/mL.45 Zhou et al99 evaluated the toxicity of GO in different cancer cell lines, such as mouse melanoma B16F10, prostate cancer PC3, and breast cancer MDA-MB-231 cells. The results exhibited that GO was cytotoxic to these cancer cells in a dose-dependent manner. GO and rGO exhibit dose-dependent toxicity in glioma cells.100 Therefore, our study revealed the toxic effects of GO on SKOV3 cells.
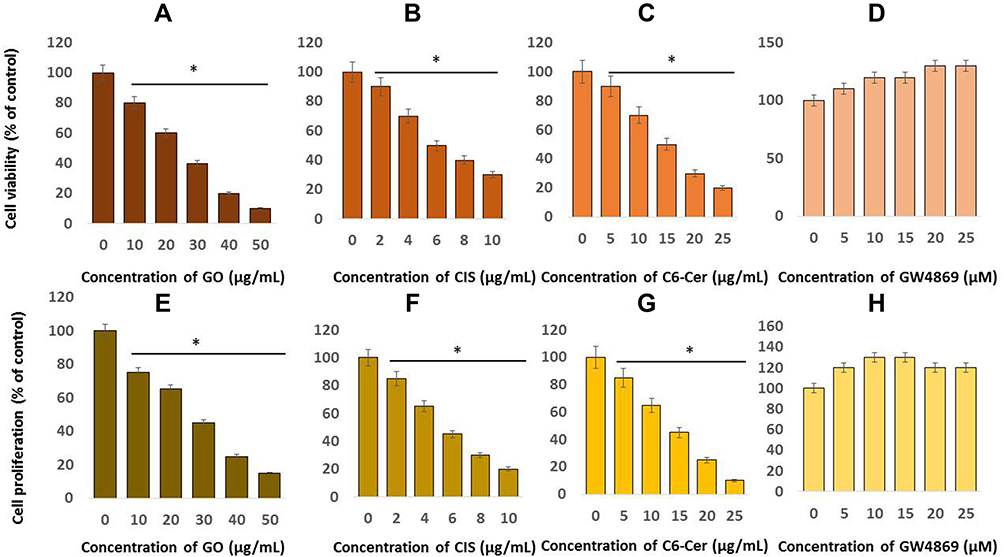 |
Figure 3 Dose-dependent effects of GO, CIS, C6-Cer and GW4869 on the viability and proliferation of SKOV3 cells. Cell viability was determined using CCK-8 in SKOV3 cells were exposed to various concentrations of (A) GO (10–50 µg/mL), (B) CIS (2–10 µg/mL), (C) C6-Cer (5–25 µg/mL) and (D) GW4869 (5–25 µM) in cell culture medium supplemented with 1% FCS for 24 h. Cell proliferation was determined by BrdU in SKOV3 cells were exposed to various concentrations of (E) GO (10–50 µg/mL), (F) CIS (2–10 µg/mL), (G) C6-Cer (5–25 µg/mL) and (H) GW4869 (5–25 µM). The results are expressed as the mean ± standard deviation of three independent experiments. The treated groups showed statistically significant differences from the control group by the Student’s t-test; *p <0.05 was considered significant. |
The dose-dependent effects of CIS on cell viability were tested in SKOV3 cancer cells using the CCK-8 assay. Cells were treated with CIS (2, 4, 6, 8, 10 µg/ mL) for 24 h. The results identified that CIS was cytotoxic and inhibited cell viability, which agreed with findings reported in different types of cancer cells. As presented in Figure 3B, CIS displayed cytotoxicity in a concentration-dependent manner. These findings suggested that CIS inhibited the growth of SKOV3 cells in a dose-dependent manner. The IC50 value of CIS was 6 µg/ mL. Increasing cisplatin doses significantly inhibited both cisplatin-sensitive SKOV3 and cisplatin-resistant SKOV3/DDP cells. Among these two cell lines, viability was significantly inhibited in SKOV3 cells compared with cisplatin-resistant SKOV3/DDP cells. These results indicated that the cytotoxicity of cisplatin is more apparent in SKOV3 cells than in SKOV3/DDP cells. As presented in Figure 3B, cell proliferation is significantly affected in a dose-dependent manner. These results indicate that the cytotoxicity of CIS is more apparent in both cell viability and cell proliferation.
The dose-dependent effect of C6-Cer on cell viability was tested in SKOV3 cancer cells using the CCK-8 assay. Cells were treated with C6-Cer (5, 10, 15, 20, 25 µg/ mL) for 24 h. The results identified that C6-Cer was cytotoxic and inhibited cell viability, which agreed with findings reported in different types of cancer cells. C6-ceramide had a significant effect on SKOV3 cell viability and markedly enhanced C6-Cer induced cell death in a dose-dependent manner. These findings suggest that C6-Cer inhibited the growth of SKOV3 cells in a dose-dependent manner. The IC50 value of C6-Cer was 15 µg/ mL (Figure 3C). Zhu et al101 reported that when cells are cultured in 10% FBS, either C6-ceramide or TSA had moderate effects on tumor cell death even at high doses. However, combination treatment strongly induced CaOV3 and L3.6 cancer cell death. Increasing the concentration of C6-Cer decreased the percentage of cell proliferation in a dose-dependent manner in SKOV3 cells (Figure 3C). Cheng et al102 reported that C6 ceramide in a dose-dependent manner inhibited cell proliferation and promoted apoptosis in the human multiple myeloma (MM) OPM2 cell line, which was associated with elevated caspase 3/9 and PARP cleavage.
The effects of GW4869 on the viability of SKOV3 cells were assessed using the CCK-8 assay. Cells were treated with GW4869 at increasing concentrations (5, 10, 15, 20, 25 µM) for 24 h. As presented in Figure 3D, no effect on cell viability of GW4869 was observed at 25 µmol/L. Increasing the GW4869 concentration slightly increased the cell viability rate, although this change was not significant. A similar trend was observed in cell proliferation after GW4869 treatment in SKOV3 cells (Figure 3D). GW4869 significantly decreased exosome generation and increased the proliferation of human hepatocellular cancer cells.63,103 Cheng et al102 observed that C6-Cer in a dose-dependent (1.25–40 μM) manner inhibited MM cell proliferation (5–80%), whereas GW4869 promoted proliferation (1- to 2-fold) in the same concentration range. The similar trend was observed in cell proliferation when cells were exposed to various concentration of GO, CIS, C6-Cer, and GW4869 (Figure 3E–H). Therefore, our findings are consistent with previous reports demonstrating the effects of C6-Cer and GW4869 on the proliferation of ovarian cancer, breast cancer, human lung epithelial adenocarcinoma, and THP-1 cells.28,29,104
Effect of GO on Cytotoxicity
To determine the effect of GO, CIS, C6-Cer, and GW4869 on the cytotoxicity of SKOV3 cells, the cells were incubated with GO (25 µg/mL), CIS (6 µg/mL), C6-Cer (15 µg/mL), and GW4869 (25 µM) for 24 h. We subsequently measured various parameters, including cell viability, cell proliferation, LDH leakage, cell mortality, cytotoxicity, and ATP levels. The results depicted that GO, CIS, and C6-Cer inhibit 50% of cell viability and proliferation, whereas GW4869 promoted both cell viability and proliferation (Figure 4A and B). GO potentially inhibited both cell viability and proliferation of various types of cancer cells, including human breast cancer,46 ovarian cancer,47 cervical cancer,51 human neuroblastoma,48 human ovarian cancer stem cells,96 prostate cancer cells,97 and human germ cells such as Leydig (TM3) and Sertoli (TM4) cells.50 Lactate dehydrogenase (LDH) leakage is a cell death indicator in vitro and in vivo. The release of LDH into the tissue culture medium accurately reflects cell viability in vitro. SKOV3 cells treated with GO, CIS, and C6-Cer significantly increased LDH leakage (Figure 4C). Trypan blue measurement indicates that GO increases the death rate and decreases the viability of SKOV3 cells (Figure 4D). Furthermore, dead cell protease activity confirmed that GO induces cytotoxicity (Figure 4E).97 CIS induces cytotoxicity by inhibiting cell viability and proliferation through induction of oxidative stress and altering intracellular Ca²⁺ concentration, including cytosolic and mitochondrial Ca2+ in cisplatin-sensitive SKOV3 cells, but not in cisplatin-resistant SKOV3/DDP cells.105 CIS and C6-Cer induce cytotoxicity by decreasing cell viability and increasing death rate, indicated by trypan blue and dead cell protease activity, respectively. CaOV3 and L3.6 cancer cells were cultured in 10% FBS, where either C6-Cer or TSA alone inhibited cell viability.101 Notably, GW4869-treated SKOV3 cells promoted both cell viability and proliferation.
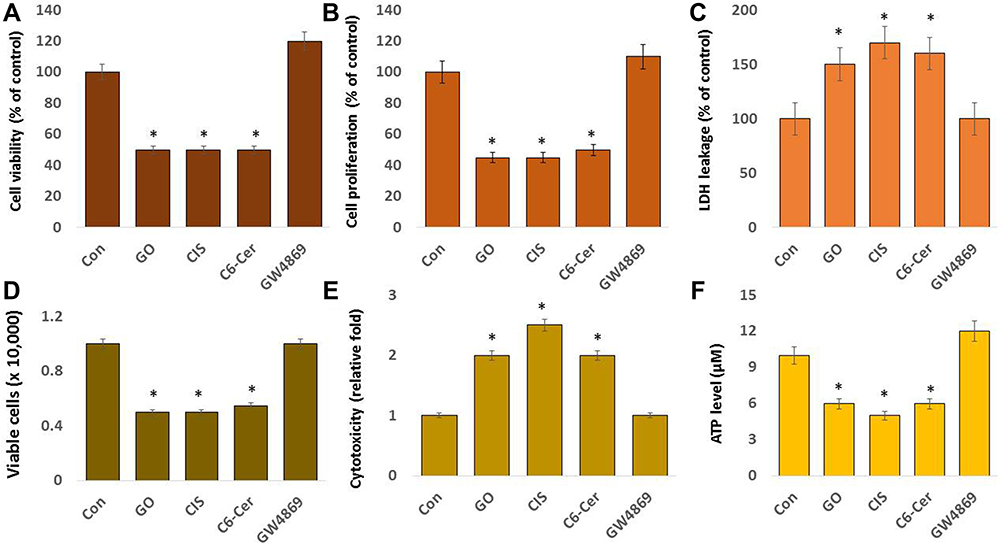 |
Figure 4 Effect of GO on the cell viability, cell proliferation, LDH leakage, cell death, cytotoxicity and ATP levels on SKOV3 cells. SKOV3 cells were treated with GO (25 µg/mL), CIS (6 µg/mL), C6-Cer (15 µg/mL), and GW4869 (25 µM) for 24 h in cell culture medium supplemented with 1% FCS for 24 h. (A) Cell viability was determined using CCK-8 (B) cell proliferation was determined by BrdU. (C) Membrane integrity was measured at 490 nm using the LDH cytotoxicity kit. (D) Cell death rate was determined using trypan blue. (E) Cytotoxicity was determined using dead cell protease activity. (F) ATP levels. The results are expressed as the mean ± standard deviation of three independent experiments. The treated groups showed statistically significant differences from the control group by the Student’s t-test; *p <0.05 was considered significant. |
Mitochondria are the primary source of ATP essential for cellular metabolic activities, including cell survival. Hence, we investigated the impact of GO, CIS, C6-Cer, and GW4869 on ATP levels in SKOV3 cells. The results indicate that GO, CIS, and C6-Cer remarkably decreased the level of ATP, whereas GW4869 did not show any significant effects (Figure 4F). The findings of these studies agreed with findings reported in different types of cancer cells. For example, graphene oxide quantum caused significant toxicity in human lymphocytes due to mitochondrial dysfunction.106 Graphene oxide directly inhibited electron transport chain (ETC) complexes I, II, III, and IV, and eventually caused mitochondrial depolarization and impaired ATP production in MDA-MB-231 human breast cancer, PC3 human prostate cancer, B16F10 mouse melanoma cells, and human embryonic kidney cells.99,107 GO significantly decreased the proliferation of MDA-MB-231, MDA-MB-436, and SK-BR-3 breast cancer cells via down-regulation of oxidative phosphorylation (OXPHOS) activity without any alterations in glycolysis.99 Disrupted OXPHOS significantly reduces ATP production and cytoskeletal function, consequently affecting the migratory and invasive activity of cancer cells.108 Graphene oxide downregulates the mRNA expression of nuclear genes and mitochondrial oxidative phosphorylation (OXPHOS) of complexes I, III, IV, and V.109 Therefore, these findings suggest that GO potentially inhibits ATP production, which is essential for cellular metabolic activity.
Effects of GO on Oxidative Stress Markers
Oxidative stress is an imbalance between oxidants and antioxidants and causes disruption of redox signaling and control. The presence of excessive oxidants causes damage to biomolecules. Therefore, we evaluated the effects of GO on oxidative stress in SKOV3 cells. SKOV3 cells were treated with GO (25 µg/mL), CIS (6 µg/mL), C6-Cer (15 µg/mL), and GW4869 (25 µM) for 24 h. Subsequently, we measured various oxidative stress markers, including ROS generation, malondialdehyde, lipid hydroperoxide, nitric oxide, protein carbonyl content, and isoprostanes.
Generally, GO induces cytotoxicity by generating oxidative stress and causes damage to cellular structures. It alters the normal physiological functions of cells by attacking various biomolecules, namely, carbohydrates, nucleic acids, unsaturated fatty acids, and proteins, both in prokaryotic and eukaryotic cells.49,76,110 To determine the influence of GO on oxidative stress in SKOV3 cells, the cells were incubated with GO (25 µg/mL), CIS (6 µg/mL), C6-Cer (15 µg/mL), and GW4869 (25 µM) for 24 h. The level of ROS was measured. The treatment of SKOV3 cells with GO, CIS, and C6-Cer increased the production of ROS (Figure 5A), whereas GW4869-treated cells exhibited no change compared with untreated cells. SKOV3 cells treated with GO, CIS, C6-Cer, and GW4869 produced 25, 30, 25, and 10 µmol of ROS, respectively, whereas that in untreated cells was 10 µmol. ROS production by microscopic analysis using H2DCFDA staining shown in Supplementary Figure 1. Similarly, GO induces oxidative stress and, in turn, produces a higher level of ROS in various cells, namely, human breast cancer,46 ovarian cancer,47 cervical cancer,51 human neuroblastoma,48 human ovarian cancer stem cells,96 prostate cancer,97 and human germ cells, such as Leydig (TM3) and Sertoli (TM4) cells.50 GO causes imbalance of mitochondrial homeostasis, the released cytochrome c (CytC) induces caspase-dependent cell apoptosis and it also leads to mitochondrial-dependent apoptosis by activating ROS-p53 pathway in cancer cells.51,52
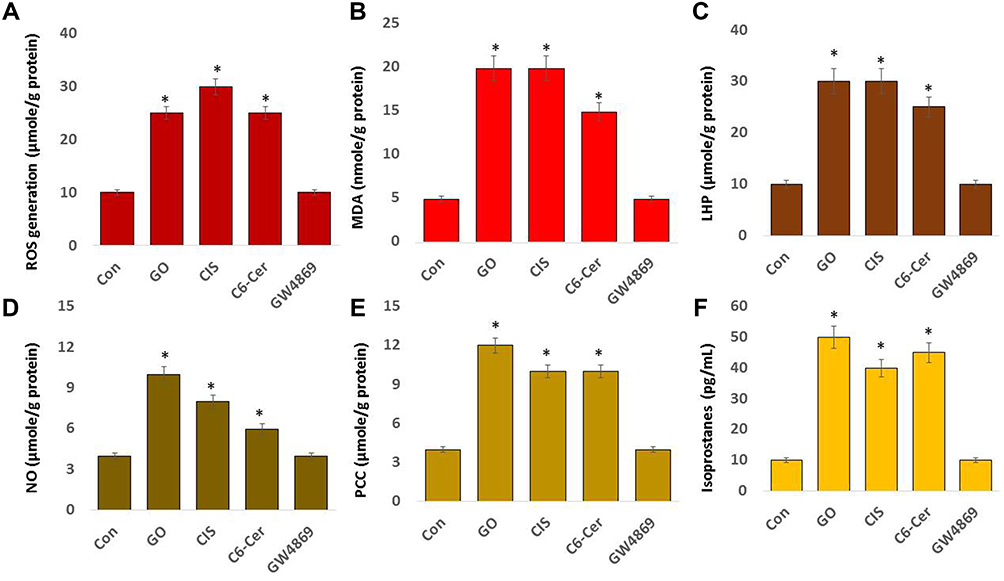 |
Figure 5 Effect of GO on oxidative stress markers. SKOV3 cells were treated with GO (25 µg/mL), CIS (6 µg/mL), C6-Cer (15 µg/mL), and GW4869 (25 µM) for 24 h in cell culture medium supplemented with 1% FCS for 24 h. (A) Spectrophotometric analysis of ROS was performed using 2’,7’-dichlorodihydrofluorescein diacetate (DCFH-DA). (B). Malondialdehyde concentration was measured using a thiobarbituric-acid-reactive substances assay and expressed as nanomoles per gram of protein. (C) Lipid hydroperoxides were extracted and quantified as indicated using the Lipid Hydroperoxide Assay Kit. (D) Nitric oxide production was quantified spectrophotometrically using Griess reagent and expressed as micromoles per gram of protein. (E) Protein carbonylation content was determined and expressed as micromoles per gram of protein. (F) 8-Isoprostane was quantified using the protocol described in the EIA Kit. The results are expressed as the mean ± standard deviation of three independent experiments. The treated groups showed statistically significant differences from the control group by the Student’s t-test; *p <0.05 was considered significant. |
Subsequently, we examined another oxidative stress marker, malondialdehyde (MDA a biomarker of widely studied lipid peroxidation products. MDA is the most frequently used biomarker of oxidative stress in various diseases. Lipid peroxidation plays a significant role as a key secondary messenger in the adaptation/commitment to apoptosis.111 Lipid peroxidation products regulate pathways responsible for the antioxidant protection system. The most commonly studied secondary lipid peroxidation products include MDA, propanal, hexanal, and 4-hydroxynonenal (4-HNE). SKOV3 cells were incubated with GO (25 µg/mL), CIS (6 µg/mL), C6-Cer (15 µg/mL), and GW4869 (25 µM) for 24 h. The level of MDA was measured. The treatment of SKOV3 cells with GO, CIS, and C6-Cer increased the production of MDA, whereas GW4869-treated cells exhibited no change compared with the untreated cells. SKOV3 cells treated with GO, CIS, C6-Cer, and GW4869 produced 20, 20, 15, and 5 µmol of MDA, respectively (Figure 5B). GO causes cytotoxicity in human fibroblasts and lung epithelial cells at concentrations >20 μg/mL after 24 h and eventually induces ROS, malondialdehyde (MDA), and LDH.112,113 Graphene family nanomaterials cause toxicity through lipid peroxidation and oxidative stress. GO treatment significantly increases ROS levels, decreases SOD activity, and induces MDA production in HeLa cells.114 GO and rGO can induce oxidative stress by increasing the production of ROS in HepG2, which may be the major cause of cytotoxicity.115
Lipid hydroperoxides (LHP) are prominent non-radical intermediates of lipid peroxidation. LOOHs perturb membrane structure/function and can be deleterious to cells.116 Measurement of lipid hydroperoxides (LHP) is a valuable method widely used to evaluate oxidative catabolism of lipid membranes. To measure the level of LHP, SKOV3 cells were incubated with GO (25 µg/mL), CIS (6 µg/mL), C6-Cer (15 µg/mL), and GW4869 (25 µM) for 24 h, and the LHP levels were measured. The treatment of SKOV3 cells with GO, CIS, and C6-Cer increased LHP production, whereas GW4869-treated cells exhibited no change compared to that in the untreated cells. SKOV3 cells treated with GO, CIS, C6-Cer, and GW4869 produced 30, 30, 25, and 10 µmol of LHP, respectively (Figure 5C). GO significantly alters the composition of plasma membrane lipids, including a decrease in cholesterol and an increase in the oxidized cholesterol species levels.117 GO causes a disruption of lipid raft domains in the plasma membrane of neutrophils, thus eliciting pronounced alterations of plasma membrane lipids, including cholesterol.117
Lipopolysaccharide (LPS) triggers an increased generation of nitric oxide (NO) and subsequently induces the release of exosomes from platelets during sepsis. These LPS-induced platelet-derived exosomes contain higher levels of NADPH oxidase, nitric oxide synthases (NOS), and protein disulfide isomerase (PDI) than healthy exosomes.118 Therefore, we determined whether GO can induce nitric oxide. SKOV3 cells were incubated with GO (25 µg/mL), CIS (6 µg/mL), C6-Cer (15 µg/mL), and GW4869 (25 µM) for 24 h, and the NO levels were measured. Our results indicated that SKOV3 cells treated with GO, CIS, C6-Cer, and GW4869 produced 10, 8, 6, and 4 µmol of NO, respectively (Figure 5D). Increased ROS and RNS levels promote DNA breakage and impair the antioxidant potential.119 Combination of silver nanoparticles and histone deacetylase inhibitors increased the NO level in adenocarcinoma cells.120
Protein carbonylation, the oxidation of amino acids by ROS, is a major hallmark for oxidative damage to proteins. Detection and quantification of protein carbonyls are commonly performed to identify the level of oxidative stress in cellular damage, aging, and several age-related disorders.121 SKOV3 cells were incubated with GO (25 µg/mL), CIS (6 µg/mL), C6-Cer (15 µg/mL), and GW4869 (25 µM) for 24 h. The level of NO was measured. Our results demonstrated that SKOV3 cells treated with GO, CIS, C6-Cer, and GW4869 produced 12, 10, 10, and 4 µmol of PCC, respectively (Figure 5E). The degree of GO oxidation increases the interaction with the changes in the protein. Thus, the interaction of the protein with GO can be modulated by tuning the degree of oxidation.122 The binding of GO with biomolecules may involve electrostatic, hydrophobic, covalent and non-covalent, hydrogen bonding, and π–π stacking interactions depending upon the surface charge, energy, and hydrophobicity of the interacting groups.123 The toxicity of graphene oxide depends upon the type of functional groups at the surface and the extent of the degree of oxidation.124
A biomarker of oxidative stress is 8-Isoprostane and its increasing concentration. We measured the level of 8-isoprostane in SKOV3 cells by exposing them to GO (25 µg/mL), CIS (6 µg/mL), C6-Cer (15 µg/mL), and GW4869 (25 µM) for 24 h. The level of 8-isoprostane was measured. Our results indicated that SKOV3 cells treated with GO, CIS, C6-Cer, and GW4869 produced 50, 40, 45, and 10 µmol of 8-isoprostane, respectively (Figure 5F). Rats exposed to silica nanoparticles (SiNPs) doped with Cd (SiNPs-Cd, 1 mg/rat), soluble CdCl2 (400 μg/rat), or SiNPs (600 μg/rat). Pulmonary total F2-isoprostane was increased by 56 and 43% in CdCl2 and SiNPs-Cd groups, respectively, compared to that in the controls.125 Therefore, GO potentially induces various oxidative stress markers in SKOV3 cells.
Effect of GO on Antioxidants Markers
Since antioxidants regulate the level of reactive oxygen species production, we measured various antioxidant systems, such as glutathione (GSH), thioredoxin (TRX), catalase (CAT), superoxide dismutase (SOD), glutathione peroxidase (GPx), and glutathione S-transferases (GST) in THP-1 cells treated with GO (25 µg/mL), CIS (6 µg/mL), C6-Cer (15 µg/mL), and GW4869 (25 µM) for 24 h. These are indispensable molecules for anti-oxidative defense. GSH is a vital intracellular molecule responsible for maintaining the pro and antioxidant buffer system and is the most abundant cellular thiol compound.126 Our results revealed that SKOV3 cells treated with GO, CIS, C6-Cer, and GW4869 produced 60, 50, 40, and 110 µmol of GSH, respectively (Figure 6A). GW4869-treated cells exhibited slightly increased levels of GSH (110 μmol) compared to that in the control (100 μmol). GO increased cytotoxicity and inhibited cell proliferation by inducing intracellular oxidative stress. Glutathione (GSH) is one of the main reductive intracellular substances, which regulate oxidative stress levels to maintain normal cellular functions. GO induced cellular toxicity in human embryonic kidney cells and acute monocytic leukemia cell line (THP-1) by increasing the level of LDH leakage and ROS generation, decreasing levels of reduced glutathione (GSH), and increasing levels of oxidized glutathione.54,127 Ma et al128 demonstrated that oxidation of GSH to GSSG by GO led to the formation of reduced graphene oxide. GSH depletion influenced the intracellular reductive oxidative balance and increased ROS concentration. Thus, increased ROS levels consequently inhibit cell viability and proliferation. Hence, the reaction between GO and GSH could be a possible mechanism of cytotoxicity that eventually leads to biogenesis and release of exosomes.
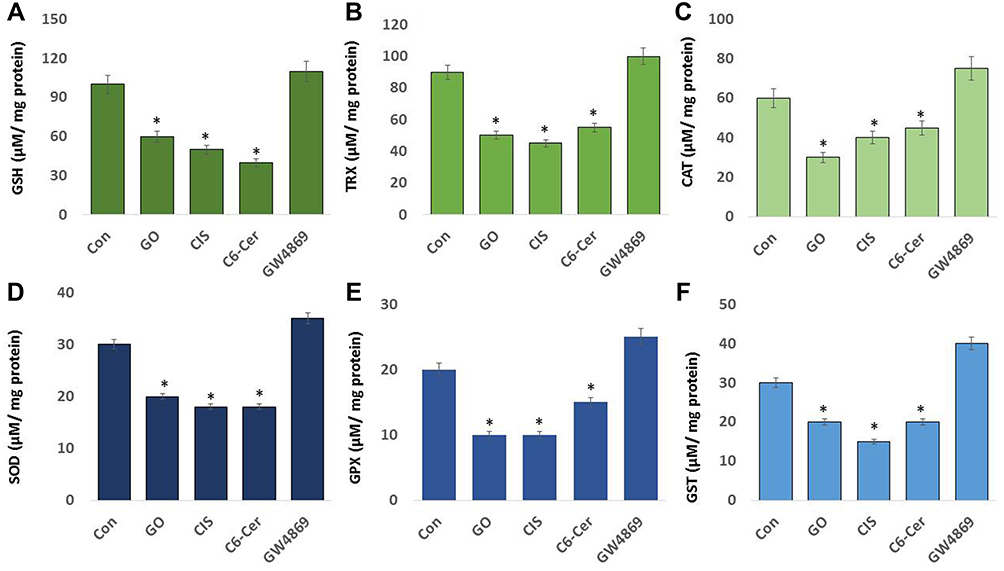 |
Figure 6 Effect of GO on antioxidants. SKOV3 cells were treated with GO (25 µg/mL), CIS (6 µg/mL), C6-Cer (15 µg/mL), and GW4869 (25 µM) for 24 h in cell culture medium supplemented with 1% FCS for 24 h. (A). GSH, (B) TRX, (C) CAT, (D) SOD, (E) GPX, and (F) GST concentrations are expressed as micromoles per milligram of protein. The results are expressed as the mean ± standard deviation of three independent experiments. The treated groups showed statistically significant differences from the control group by the Student’s t-test; *p <0.05 was considered significant. |
SKOV3 cells were exposed to GO (25 µg/mL), CIS (6 µg/mL), C6-Cer (15 µg/mL), and GW4869 (25 µM) for 24 h. Our results demonstrated that SKOV3 cells treated with GO, CIS, C6-Cer, and GW4869 produced 50, 45, 55, and 100 µmol of GSH, respectively (Figure 6B). GW4869-treated cells exhibited slightly increased levels of GSH (100 μmol) compared to that in the control (90 μmol). TRXs are ubiquitous antioxidant enzymes that play crucial roles in maintaining cellular redox balance in cancer cells.29 Retinoic acid and platinum nanoparticles decreased the level of TRX in F9 teratocarcinoma stem cells and human monocytic THP-1 cells.127,129 TRX and GSH are major thiol-dependent antioxidants involved in maintaining cell homeostasis and DNA synthesis and repair.130
To determine the levels of CAT and SOD, SKOV3 cells were treated with GO (25 µg/mL), CIS (6 µg/mL), C6-Cer (15 µg/mL), and GW4869 (25 µM) for 24 h. Our results indicated that SKOV3 cells treated with GO, CIS, C6-Cer, and GW4869 produced 30, 40, 45, and 75 µmol of CAT, respectively (Figure 6C). GW4869-treated cells presented slightly increased levels of CAT (75 μmol) compared to that in the control (60 μmol). The influence of GO in the response of biomarkers of oxidative stress was assessed through the expression and activities of the antioxidant enzymes superoxide dismutase (SOD). The results suggested that SKOV3 cells treated with GO, CIS, C6-Cer, and GW4869 produced 20, 18, 18, and 35 µmol of SOD, respectively (Figure 6D). GW4869-treated cells presented slightly increased levels of SOD (35 μmol) compared to that in the control (30 μmol). Gurunathan et al131 reported that vanillin-functionalized GO decreased the level of CAT and SOD in THP-1 cells. Human cervical cancer cells exposed to graphene oxide-silver nanocomposite decreased the level of SOD.51 Zhang et al132 reported that both GO and rGO increased the contents of MDA and ROS, decreased the activities of SOD, CAT, and GSH-Px, and lowered the mitochondrial membrane potential in H9C2 cells.
Glutathione peroxidase (GPX) is one of the critical antioxidant enzymes involved in maintaining ROS homeostasis in the cellular system, which regulates intracellular H2O2 levels, maintains GSH/GSSG balance, and promotes antioxidant enzyme activity. We examined the levels of GPX in SKOV3 cells treated with GO (25 µg/mL), CIS (6 µg/mL), C6-Cer (15 µg/mL), and GW4869 (25 µM) for 24 h. Our results indicated that SKOV3 cells treated with GO, CIS, C6-Cer, and GW4869 produced 10, 10, 15, and 25 µmol of GPX, respectively (Figure 6E). GW4869-treated cells presented slightly increased levels of GPX (25 μmol) compared to that in the control (20 μmol). Retinoic acid and platinum nanoparticles decreased the level of GPX in F9 teratocarcinoma stem cells and human monocytic THP-1 cells.127,129
Glutathione S-transferases (GSTs) protect cells from oxidative stress cell damage by quenching reactive molecules by adding glutathione (GSH). GST is an isozyme and detoxifying enzyme known to catalyze the conjugation of GSH to the miscellany of electrophilic and hydrophobic substrates. To determine the effects of GO on GST, SKOV3 cells were treated with GO (25 µg/mL), CIS (6 µg/mL), C6-Cer (15 µg/mL), and GW4869 (25 µM) for 24 h. Our results presented that SKOV3 cells treated with GO, CIS, C6-Cer, and GW4869 produced 20, 15, 20, and 40 µmol of GST, respectively (Figure 6F). GW4869-treated cells displayed slightly increased levels of GST (40 μmol) compared to that in the control (30 μmol). These findings are in significant agreement with previous reports such as retinoic acid and platinum nanoparticles and decreased the level of GST in F9 teratocarcinoma stem cells and human monocytic THP-1 cells.127,129 High-level ROS generations can influence the stability of DNA and RNA, decrease the activities of SOD, CAT, and GSH-Px, and increase MDA content, thereby resulting in cell oxidative damage.133 Chitosan-glutathione nanoparticles induced a significant decrease in glutathione peroxidase activity in MDA-MB-231 cells after treatment with doxorubicin.134
GO Induces the Expression of ER Stress Genes
The endoplasmic reticulum (ER) plays a significant role in the nucleation site for translation and cargo sorting into exosomes and endosomes. Accumulating evidence suggests that GO plays a pivotal role in the treatment of cancers.45,135–137 Moreover, evidence showing the relationship between GO and endoplasmic reticulum stress and the pathogenesis of ovarian cancer is lacking. To evaluate the effects of GO on the endoplasmic reticulum, SKOV3 cells treated with GO (25 µg/mL), CIS (6 µg/mL), C6-Cer (15 µg/mL), and GW4869 (25 µM) for 24 h. The mRNA expression of IRE, PERK, ATF6, ATF4, GRP78, and CHOP were analyzed by quantitative real-time PCR. As shown in Figure 7A–F, compared to that in the control group, the cells treated with GO, CIS, and C6-Cer increased several folds of expression of IRE, PERK, ATF6, ATF4, GRP78, and CHOP. Xiao et al138 reported that cells in the GO-administrated group increased the mRNA expression of GRP78 and LC3B in the nasopharyngeal carcinoma cells. ER stress is due to the accumulation of newly synthesized, unfolded, or misfolded proteins in the ER and leads to various dysfunctions. ER stress could mediate the expression of PERK and IRE1/X-box binding protein-1 and, subsequently, activate transcription factor-6 (ATF6) signaling pathways. However, excessive or abnormal ER stress can result in cell injury or death by activating apoptotic pathways.139–141 GRP78 is associated with the occurrence and development of ER stress. Our results demonstrated that GO significantly promoted the expression of GRP78 in SKOV3 cells. Thus, GO promoted the apoptosis of SKOV3 cells through ER stress. Chemotherapeutic agents such as cisplatin and doxorubicin-induced ER stress impair the UPR. The onset of ER stress leads to increased expression of CHOP, a marker for ER stress induced during apoptosis.142,143 Pandey et al144 engineered ER-targeted self-assembled 3D spherical graphene oxide (ER-GO-NPs) and induced ER stress and apoptosis in cervical cancer cells. These ER-GO-NPs alone and in combination with chloroquine (CQ) exhibited remarkable cell-killing efficacy in breast, lung, and drug-resistant triple-negative breast cancer cells. Different types of NPs, including silver, gold, silica, and graphene, have been used to enhance cytotoxicity by promoting ER stress-mediated cell death.145 The redox-state of ER is closely linked with its protein-folding homeostasis. Oxidizing and reducing reagents disrupt the protein folding by disrupting disulfide bond formation within the ER lumen.146 The possible mechanism of GO-induced ER stress is redox imbalance by the generation of oxidative stress.
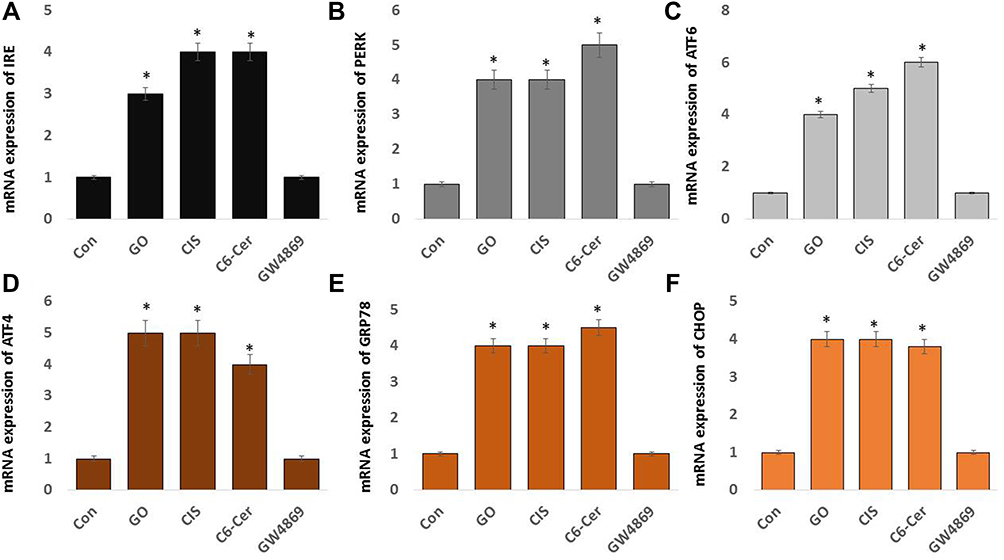 |
Figure 7 Effect of GO on ER stress. SKOV3 cells were treated with GO (25 µg/mL), CIS (6 µg/mL), C6-Cer (15 µg/mL), and GW4869 (25 µM) for 24 h in cell culture medium supplemented with 1% FCS for 24 h. The mRNA expression of ER stress markers including IRE (A), PERK (B), ATF-6 (C), ATF-4 (D), GRP78 (E), and CHOP (F) were estimated via qRT-PCR. The results are expressed as the mean ± standard deviation of three independent experiments. The treated groups showed statistically significant differences from the control group by the Student’s t-test; *p <0.05 was considered significant. |
A consequence of ER stress is mitochondrial dysfunctions and increasing ROS levels, ultimately leading to the interference of cellular functions and activating pro-apoptotic signaling.147 IREIα can promote cell death by activating c-Jun N-terminal kinase (JNK). The IRE1α kinase domain binds with the adapter molecule TRAF2, which leads to the activation of apoptosis signal, regulating kinase (ASK1) that phosphorylates and activates JNK. The activation of JNK triggers cell death in response to UV irradiation or TNFα receptor activation.148,149 Studies on mice suggest that silver nanoparticles activate ER stress sensor proteins, including PERK, IRE1, and CHOP, suggesting the possible induction of apoptosis.150 GOPs loaded with doxycycline (DOX) and cisplatin are internalized within the ER, which increased the CHOP expression many-fold and activated the expression of GRP78, indicating the onset of ER stress.151,152 The pro-apoptotic transcription factor CHOP/GADD153 can suppress the transcription level of Bcl-2 induced by the joint ATF6 and PERK/ATF4 pathways.153,154 Therefore, these results demonstrate that GO can modulate ER stress signaling for apoptosis.
Effect of GO on Mitochondrial Dysfunction, Caspases Activation, and DNA Damage
In various diseases, oxidative stress and mitochondrial damage are interrelated physiological processes. A consequence of increased ROS is redox imbalance, which causes apoptosis.97 Oxidative stress and ER are known to induce damage to the mitochondrial respiratory chain, altering membrane permeability, and influencing Ca2+ homeostasis and the mitochondrial defense systems. Therefore, the mitochondrial membrane potential was used to evaluate mitochondrial damage and measure the effects of oxidative stress and increased levels of ROS on mitochondrial dysfunctions. SKOV3 cells treated with GO (25 µg/mL), CIS (6 µg/mL), C6-Cer (15 µg/mL), and GW4869 (25 µM) for 24 h. The loss of mitochondrial membrane potential was assessed using the JC-1 assay. The cells treated with GO, CIS, and C6-Cer exhibited a significant reduction in MMP activity up to 50, 60, and 60%, respectively, compared to that in the control. In contrast, cells treated with GW4869 did not affect MMP activity (Figure 8A). Mitochondrial activity is an essential property of GO that induces cell apoptosis or necrosis.155 Our previous results demonstrate that graphene can destroy the mitochondrial membrane potential and increase intracellular ROS, thereby triggering cell apoptosis through the mitochondrial pathway in human breast cancer,46 ovarian cancer,47 cervical cancer,51 human neuroblastoma,48 human ovarian cancer stem cells,96 prostate cancer,97 and human germ cells, such as Leydig (TM3) and Sertoli (TM4) cells.50 Similarly, graphene-silver nanocomposites induce mitochondrial dysfunctions in human neuroblastoma cancer48 and human ovarian cancer stem cells,96 and graphene-platinum nanocomposites cause mitochondrial dysfunctions in human prostate cancer cells (LNCaP).97 Thus, GO treatment increased the ROS concentration and reduced the mitochondrial membrane potential in SKOV3 cells.
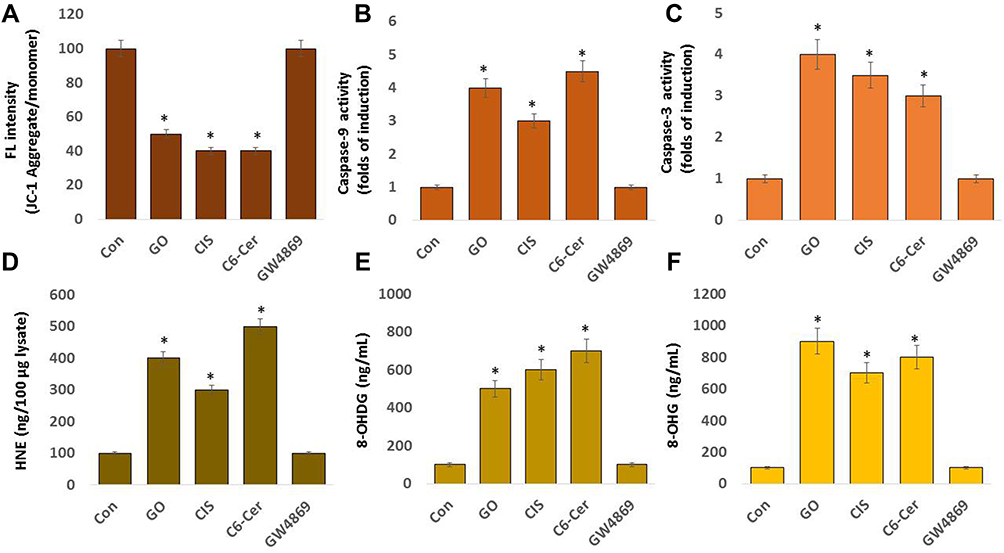 |
Figure 8 Effect of GO on JC-1, caspase 9, caspase-3, HNE, 8-OHDG, and 8-OHG in THP-1 cells. SKOV3 cells were treated with GO (25 µg/mL), CIS (6 µg/mL), C6-Cer (15 µg/mL), and GW4869 (25 µM) for 24 h in cell culture medium supplemented with 1% FCS for 24 h. Levels of (A) JC-1, (B) caspase-9, (C) caspase-3, (D) HNE, (E) 8-Oxo-dG, and (F) 8-Oxo-G were determined. The results are expressed as the mean ± standard deviation of three independent experiments. The treated groups showed statistically significant differences from the control group by the Student’s t-test; *p <0.05 was considered significant. |
Caspases are involved in cellular apoptosis. Caspase-9 is required to activate mammalian intrinsic apoptosis, which cleaves and activates the effector caspases to execute cell killing.156 Caspases consist of upstream initiators such as caspases-8, −10, −2, and −9 and downstream effectors such as caspases-3, −6, and −7. The activation of caspase-3 mediated by activated caspase-9 entails a single proteolytic cleavage between the large and small subunits of caspase-3.157 To determine the effect of caspase-9, SKOV3 cells were exposed to GO (25 µg/mL), CIS (6 µg/mL), C6-Cer (15 µg/mL), and GW4869 (25 µM) for 24 h. The cells treated with GO, CIS, and C6-Cer exhibited significant activation of caspase-9 up to 4.0-, 3.0-, and 4.5-folds, respectively, compared to those in the control. Conversely, cells treated with GW4869 did not affect both caspase-9 and caspase-3 (Figure 8B). Caspase-3 plays a significant role in apoptosis by activating both intrinsic and extrinsic apoptosis pathways. Therefore, caspase-3 is the most common target to detect apoptosis.158,159 Caspase-3 is one of the indispensable executioner caspases; PARP is activated by mitochondrial pathways that initiate pristine graphene-mediated apoptosis.160,161 To evaluate the effect of GO on caspase-3, SKOV3 cells were treated with GO (25 µg/mL), CIS (6 µg/mL), C6-Cer (15 µg/mL), and GW4869 (25 µM) for 24 h and caspase-3 activity was assessed. The cells treated with GO, CIS, and C6-Cer exhibited significant increments in caspase-3 activity up to 4.0-, 3.5-, and 3.0-fold, respectively, compared to that in the control (Figure 8C). Graphene layers induced apoptosis by activating caspase-3 in a time-dependent manner.162 Both in vitro and in vivo studies demonstrated that the injection of GO and rGO decreased the mass and volume of tumors and induced apoptosis by the up-regulation of caspase-3 and membrane leakage.67,100 Ceramide activates pro-apoptotic isoforms of Bcl-x and caspase-9.163,164 Our previous studies have demonstrated that GO induces caspase activity in various cancer cells, including human ovarian cancer cells.165 Our previous studies have indicated that graphene increase caspase activation in human breast cancer,46 human embryonic kidney,99,107 and THP-1 cells.127 Similarly, graphene-silver nanocomposites induce mitochondrial dysfunctions in human neuroblastoma cancer48 and human ovarian cancer stem cells,96 and graphene-platinum nanocomposites cause mitochondrial dysfunctions in human prostate cancer cells (LNCaP).97 Wang et al166 reported that polyethylene glycol (PEG) and polyethylenimine (PEI), co-conjugated with ultra-small nano-GO (NGO-PEG-PEI) and loaded with C6-ceramide (NGO-PEG-PEI/Cer), significantly increased the activation of caspases-3, −8, and −9, and increased PARP cleavage in NGO-PEG-PEI/Cer-treated cells during apoptosis. Thus, GO treatment increased caspase-9/3 activity and eventually induced apoptosis in SKOV3 cells.
4-hydroxynonenal (4-HNE) is a product of lipid peroxidation and the second messenger of oxidative/electrophilic stress. HNE affects major signaling pathways and the life and death of cells, particularly during oxidative and ER stress.167 To determine whether GO induces elevated 4-HNE levels, we first measured the production of 4-HNE in SKOV3 cells treated with GO (25 µg/mL), CIS (6 µg/mL), C6-Cer (15 µg/mL), and GW4869 (25 µM) for 24 h. The cells treated with GO, CIS, and C6-Cer displayed significant increments in HNE up to 400, 300, and 500 ng/100 µg lysate, respectively, compared to that in the control (Figure 8D). Conversely, the cells treated with GW4869 for 24 h did not exhibit a significant difference in 4-HNE relative to that in control. HepG2 cell line treated with silver nanoparticles increases the level of 4-HNE through oxidative stress and affects the metabolic state of the cell.168 Increasing the lipid peroxidation levels is inversely related to cell proliferation in various types of cells.169 HNE reduced the proliferative capacity of K562 human erythroleukemic and HL-60 human promyelocytic cells.170 These findings suggest that the generation of 4-HNE mediates signaling and can largely influence the fate of the cell by modulating the major cellular processes, such as autophagy, inhibition of proliferation, and apoptosis.
Oxidative damage is suggested to play a crucial role in the pathogenesis of various diseases. The by-products of nucleoside oxidation, 8-OHdG and 8-OHG, are two of the most prominently characterized forms of DNA and RNA oxidation.171 Therefore, we evaluated the effects of GO on 8-OHdG and 8-OHG in SKOV3 cells when exposed to GO (25 µg/mL), CIS (6 µg/mL), C6-Cer (15 µg/mL), and GW4869 (25 µM) for 24 h. The cells treated with GO, CIS, and C6-Cer significantly increased the level of 8-OHdG up to 500, 600, and 700 ng/mL, respectively, compared to that in the control (Figure 8E). The levels of 8-OHG attained were 900, 700, and 800 ng/mL, respectively (Figure 8F). Consistent with our results, a majority of in vitro and in vivo studies have indicated increased levels of 8-OHdG and 8-OHG in various types of nanoparticle treatments, such as TiO2, NiO, ZnO, and CeO2.172 We demonstrated that silver nanoparticles treated mouse embryonic fibroblast cells produced high levels of 8-OHdG and 8-OHG.54 Combination of melatonin and palladium-nanoparticle-induces high levels of 8-OhdG and 8-OHG in human lung epithelial adenocarcinoma cells, A549 and H1229. The combination of platinum nanoparticles and retinoic acid increases the level of 8-OHdG and 8-OHG in human neuroblastoma cancer cells.52 Therefore, these findings suggest that GO potentially induces mitochondrial dysfunction, caspase9/3 activation, increases 4-HNE levels, and increases the level of OHdG and 8-OHG accumulation, eventually leading to cell death.
Effect of GO on AChE Activity, n-Sphingomyelinase, Exosome Protein, and Exosome Numbers
Neurons and red blood cells produce an enormous amount of AChE. AChE and butyrylcholinesterase (BChE) hydrolyze the neurotransmitter acetylcholine (ACh) into acetic acid and choline.173 AChE is predominantly associated with exosomes. AChE activity was first identified in exosomes released from reticulocytes, localized in the membranes of exosomes, which are markers of exosome release.174 Oxidative stress plays a crucial role in various cellular functions, including the production of AChE activity. AChE activity was developed as a marker for extracellular vesicles for easy, rapid, and economical assay.175 To evaluate the expression of AChE activity in SKOV3 cells, the cells were exposed to GO (25 µg/mL), CIS (6 µg/mL), C6-Cer (15 µg/mL), and GW4869 (25 µM) for 24 h. The cells treated with GO, CIS, and C6-Cer significantly increased the AChE activity up to 40, 40, and 45 U/mL, respectively, compared to that in the control (Figure 9A). Similarly, the AChE activity was more in low concentrations of carbon nanoparticles than in high concentrations of carbon nanoparticles.176 We demonstrated that platinum and palladium nanoparticles-induced oxidative stress inhibits cell viability and proliferation and increases AChE activity in human adenocarcinoma and THP-1 cells, respectively.28 Cell proliferation inhibition is directly proportional to the increased AChE activity, which was associated with the down-regulation of p27 and cyclins, indicating that AChE has a tumor suppressor role in the hepatocellular carcinoma cell line.95 AChE can induce apoptosis through the termination of cell cycle progression by facilitating apoptosome assembly and eventually induce apoptosis.177–179 Our findings suggest that platinum nanoparticles (PtNPs) and palladium nanoparticles (PdNPs) increase AChE activity through oxidative stress-induced apoptosis. Therefore, these studies suggest that the increasing levels of AChE activity are due to oxidative stress and apoptosis induced by GO.
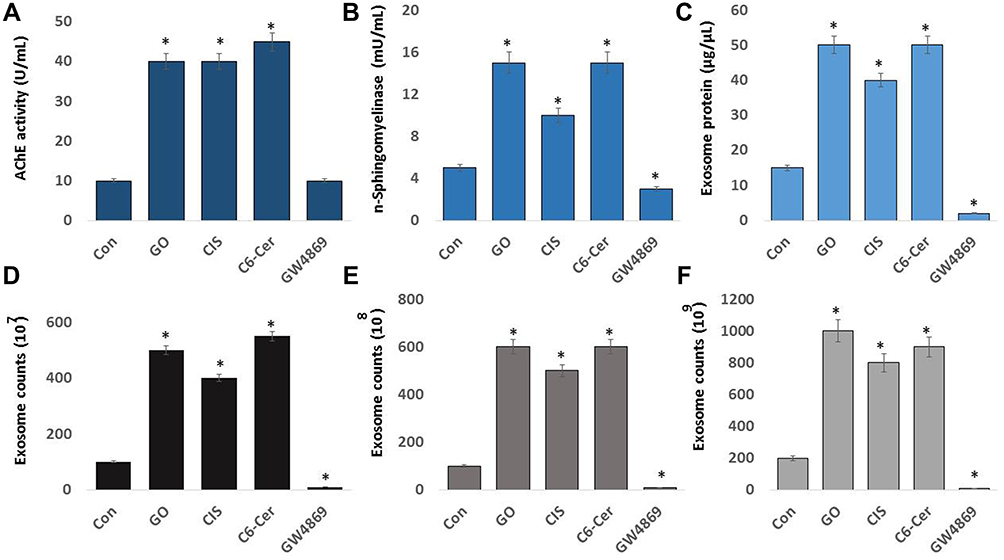 |
Figure 9 Effect of GO on AChE activity, neutral sphingomyelinase activity, exosomal protein level, and exosome count. SKOV3 cells were treated with GO (25 µg/mL), CIS (6 µg/mL), C6-Cer (15 µg/mL), and GW4869 (25 µM) for 24 h in cell culture medium supplemented with 1% FCS for 24 h. (A) AChE activity was determined from isolated exosomes using a colorimetric method. (B) Neutral sphingomyelinase activity was estimated using the Amplex Red sphingomyelinase assay kit. (C) Total protein concentration of exosomes was determined using BCA. (D) Exosome counts were determined via fluorescence polarization. (E) Exosomes counts were determined by NTA and (F) by EXOCET. The results are expressed as the mean ± standard deviation of three independent experiments. The treated groups showed statistically significant differences from the control group by the Student’s t-test; *p <0.05 was considered significant. |
Sphingomyelinases hydrolyze sphingomyelin into phosphorylcholine and ceramide. Ceramide regulates various physiological processes such as growth, proliferation, apoptosis, and EV biogenesis. Sphingomyelinase inhibitor, GW4869, inhibits biogenesis and secretion of EVs by blocking the ceramide-dependent budding of ILVs into the lumen of MVBs.13 Neutral sphingomyelinase pathway plays a significant role in the synthesis and packaging of the cargo protein into exosomes. For example, Guo et al180 reported the role of the nSMase pathway in exosome biogenesis and packaging of PrP into these vesicles. They confirmed that inhibition of the nSMase pathway using GW4869 revealed a role for the nSMase pathway in both exosome formation and PrP packaging. However, the effect of GO on the involvement of n-sphingomyelinases in the biogenesis and the release of exosomes in SKOV3 cells has not yet been explored. Hence, we determined the effects of GO on neutral sphingomyelinase activity in SKOV3 cells. The cells were treated with GO (25 µg/mL), CIS (6 µg/mL), C6-Cer (15 µg/mL), and GW4869 (25 µM) for 24 h. The neutral sphingomyelinase activity was measured. The cells treated with GO, CIS, and C6-Cer significantly increased the level of sphingomyelinase activity up to 15, 10, and 15 U/mL, respectively, compared to that in the control. The cells treated with GW4869 remarkably decreased the level of neutral sphingomyelinase activity (Figure 9B). These findings suggest that GO-induced oxidative stress-mediated activation of sphingomyelinase is likely involved in exosome release via the control of exosome budding into multivesicular endosomes.13,181 Claus et al182 reported that oxidative stress increases the activity of sphingomyelinases through post-translational modification. Additionally, sphingomyelinases play a critical role in the development of apoptosis and organ failure during sepsis. Increased levels of peroxide activate n-sphingomyelinase activity in mice liver and brain tissues.183 Consistent with previous reports, GO generates various peroxide products such as MDA, LHP, and 4 HNE. All these products could facilitate the activation of n-sphingomyelinase activity. Further, several studies have demonstrated that various cellular stresses play critical roles in EV production, number, activity, composition, surface, and intra-vesicular proteins. Hence, GO-induced oxidative stress activates n-sphingomyelinases, which are involved in the biogenesis and release of vesicles.
To correlate the AChE and neutral sphingomyelinase activity, we determined the protein concentration of isolated exosomes by the BCA method. This is a simple, easy, dependable, and probably the most frequently used method for total protein determination. Wiśniewski and Gaugaz184 compared the sensitivity and reproducibility of the BCA method with other assays. They observed that the sensitivity and reproducibility of protein determination by the BCA method were similar to that of other methods. Moreover, the main advantage of these assays is the ability to measure the EV proteins in a simple, reliable, and high-throughput manner using a plate reader.185 To evaluate the effects of GO on the protein concentration of exosomes, SKOV3 cells were treated with GO (25 µg/mL), CIS (6 µg/mL), C6-Cer (15 µg/mL), and GW4869 (25 µM) for 24 h. The protein concentration of exosomes was measured. The cells treated with GO, CIS, and C6-Cer significantly increased the level of AChE activity up to 50, 40, and 50 µg/µL, respectively, compared to that in the control. However, GW4869-treated SKOV3 cells presented a significant reduction in protein concentration (Figure 9C). Our studies demonstrated that PtNPs and PdNPs increase protein concentration in isolated exosomes from human adenocarcinoma and THP-1 cells through oxidative stress-induced apoptosis.
To further validate these results, exosomes isolated from SKOV3 cells were treated with GO (25 µg/mL), CIS (6 µg/mL), C6-Cer(15 µg/mL) and GW4869 (25 µM) for 24 h using ExoQuick. The concentration of exosomes was determined using various methods, including fluorescence polarization (Figure 9D), NanoTrack (Figure 9E), and EXOCET (Figure 9F). Computation of exosome data suggests that the number of exosomes was significantly higher in cells treated with GO, CIS, and C6-Cer than in the control. These findings indicated a significant increase in the number of exosomes in the GO-treated cells compared to that in the control cells. In contrast, cells treated with GW4869 presented a significant decrease in the number of exosomes compared to that in the control. Among the various test methods for quantification of exosomes, including fluorescence polarization, NanoTrack, and EXOCET, EXOCET displayed more sensitivity and dependability. Furthermore, it could quantify a high number of exosomes and appeared to be a better technique. The increased level of exosome concentration is due to GO-induced oxidative stress and other stress-induced factors. Various factors are involved in promoting exosome release, including hypoxia,25 cytoskeletal regulatory protein cortactin,186 acidosis,187 thermal and oxidative stress,36 cytotoxic drugs,188 cisplatin,189 platinum,29 and palladium nanoparticles.28 Furthermore, oxidative stress increases exosome secretion from retinal pigment epithelial cells, whereas adipocytes exposed to lipotoxic stress exhibit enhanced release of extracellular vesicles.190 Therefore, GO-induced oxidative and endoplasmic reticulum stress could be a possible mechanism for the increased number and release of exosomes in SKOV3 cells.
Size and Morphology Measurement of Exosomes by DLS, SEM, and TEM
Dynamic light scattering is now widely used to characterize isolated exosomes, which are membrane vesicles with cell diameters of approximately 20–150 nm. Therefore, we first utilized DLS to measure the size of exosomes. The exosomes derived from the SKOV3 cells were treated with GO (25 µg/mL), CIS (6 µg/mL), C6-Cer (15 µg/mL), and GW4869 (25 µM) for 24 h. The cells treated with GO, CIS, C6-Cer, and GW4869 exhibited a size of 100 ± 10.0, 50 ± 5.3, 80 ± 7.0, and 120 ± 12.0 nm, respectively, compared to that of the control (130 ± 15.0 nm). NTA measurements revealed that the cells treated with GO, CIS, C6-Cer, and GW4869 exhibited a size of 120 ± 20.0, 70 ± 8.0, 100 ± 10.0, and 140 ± 12.0 nm, respectively, compared to that of the control 150 ± 10.0 nm (Figure 10A). The size of all the tested samples matched with SEM and TEM. Our findings are consistent with that of Sokolova et al,191 which suggests that the size of the exosomes measured by NTA was approximately 120 nm, 110 nm, and 110 nm for exosomes derived from HEK, ECFC, and MSC, respectively. As shown in Figure 10B, exosomes derived from GO-, CIS-, C6-Cer-, and GW4869-treated samples had a spherical shape with a diameter of approximately 100, 50, 80, and 120 nm, respectively. The control group showed an average size of 130 nm. Notably, no agglomeration was observed in all the tested samples. The size of the samples treated with GO, CIS, C6-Cer, and GW4869 was similar when measured with DLS and NTA.
Figure 10 Continued. Figure 10 Size, size distribution, and morphological analyses of exosomes. SKOV3 cells were treated with GO (25 µg/mL), CIS (6 µg/mL), C6-Cer (15 µg/mL), and GW4869 (25 µM) for 24 h in cell culture medium supplemented with 1% FCS for 24 h. (A) Size distribution of exosomes was determined using DLS and NTA. (B) SEM images of exosomes. (C) TEM images of exosomes. At least three independent experiments were performed for each sample, and reproducible results were obtained.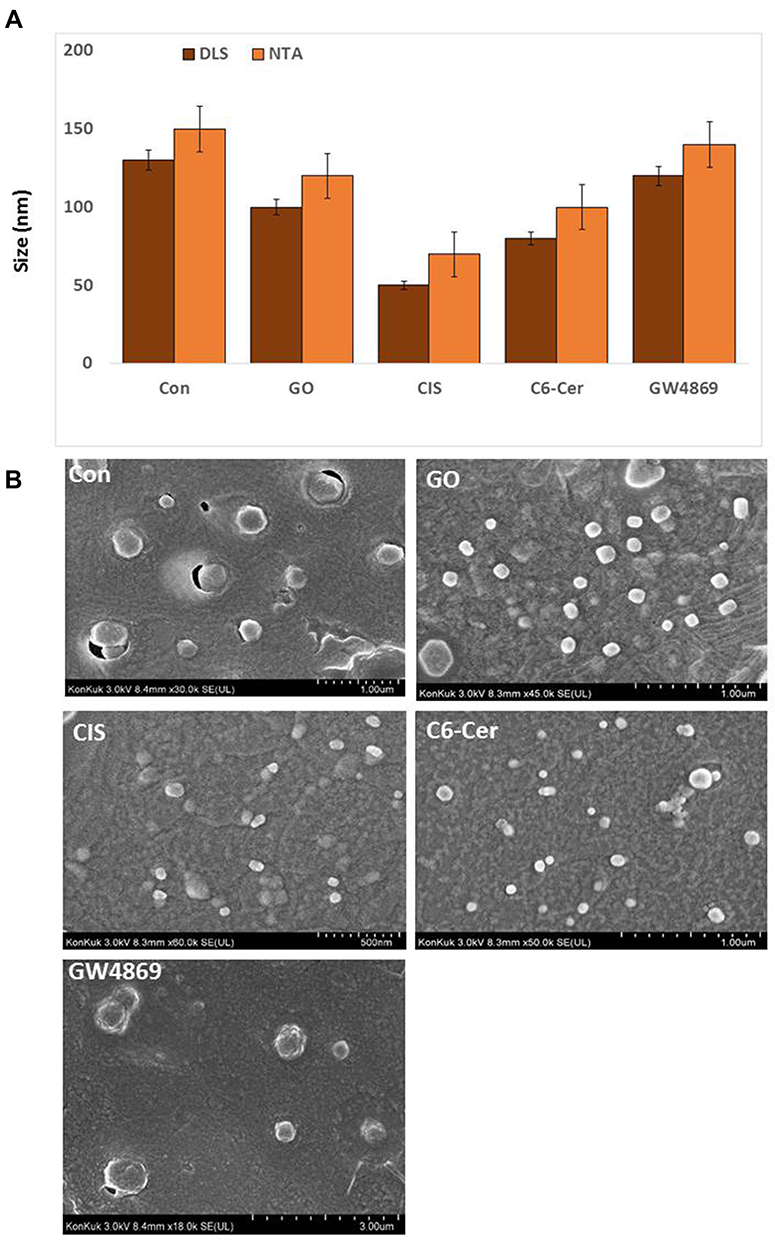
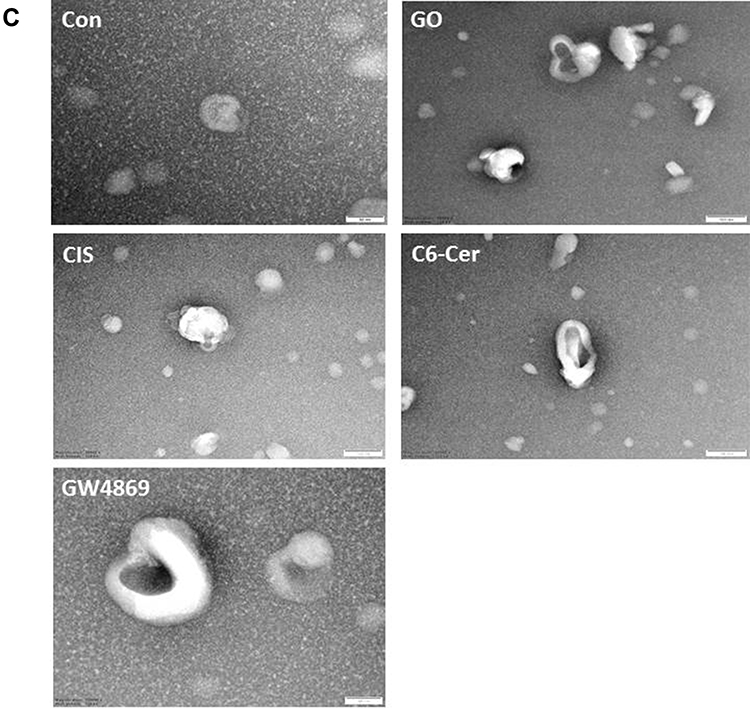
Transmission electron microscopy (TEM) is a valuable technique used to visualize the morphology and general size of the vesicles. TEM was performed to further confirm the results obtained from DLS and NTA. While observing all micrographs, exosomes were surrounded by a single lipid bilayer. The diameter of the exosomes ranged from 50–120 nm. TEM microscopic images of exosomes displayed cup-shaped structures. Exosomes showed round-shaped structures.1 To elucidate the more natural structure of exosomes from GO-, CIS-, C6-Cer- and GW4869-treated samples showed typical cup-shaped structures. They were uniformly distributed and occasionally formed aggregations or existed in the form of single vesicles. In most of the tested samples, the exosomes were spherical. TEM microscopic images of all treated samples exhibited a high number of exosomes compared to that in the control cells, which shed a low number of EVs (Figure 10C), consistent with previous reports that control cells do not shed EVs in high proportions as compared to that by the treated cell types.192 The results indicated the vesicles were circular, consistent with the morphology of exosomes.12 In contrast, SKOV3 cells released exosomes in approximately 5–6 folds. Cytostatic-, heat-, and oxidative stress-induced alterations have been reported in B16F1 mouse melanoma cell-derived small EVs.193 Ag-TiO2 nanoparticles increased the number of exosomes in B16F1 mouse melanoma cells through oxidative stress. Chemo or radiotherapy also increases the amount of circulating tumor-derived EVs.194,195 Additionally, chemotherapeutic agents such as paclitaxel and doxorubicin enhance the production of pro-metastatic breast cancer-derived EVs.196 Therefore, GO-induced oxidative stress plays a critical role in enhancing the level of exosome biogenesis and release. The increased possibility of exosome release suggests that cells might communicate with neighboring cells during intracellular stress.
GO Induces mRNA and Protein Expression TSG101, CD9, CD63, and CD81
GO-induced oxidative stress and ER stresses are associated with an increased level of exosome biogenesis and release. Therefore, we examined inter-relationships between oxidative stress and expression of exosome markers, such as TSG101, CD9, CD63, and CD81 in SKOV3 cells, using qRT-PCR and ELISA. SKOV3 cells treated with GO (25 µg/mL), CIS (6 µg/mL), C6-Cer (15 µg/mL), and GW4869 (25 µM) for 24 h. The cells treated with GO, CIS, and C6-Cer exhibited significantly increased expression levels of exosome markers, including TSG101, CD9, CD63, and C81, compared to that in the control cells. The expression of corresponding markers in the GO, CIS, and C6-cer-treated cells increased by 3-, 3-, and 3.5-fold, respectively. Conversely, GW4869-treated cells exhibited low mRNA expression levels compared to that in the control cells (Figure 11A–D). These results suggest that the exosomes released from SKOV3 cells also carry information at the mRNA level, which can be helpful in cancer prevention and therapy.197
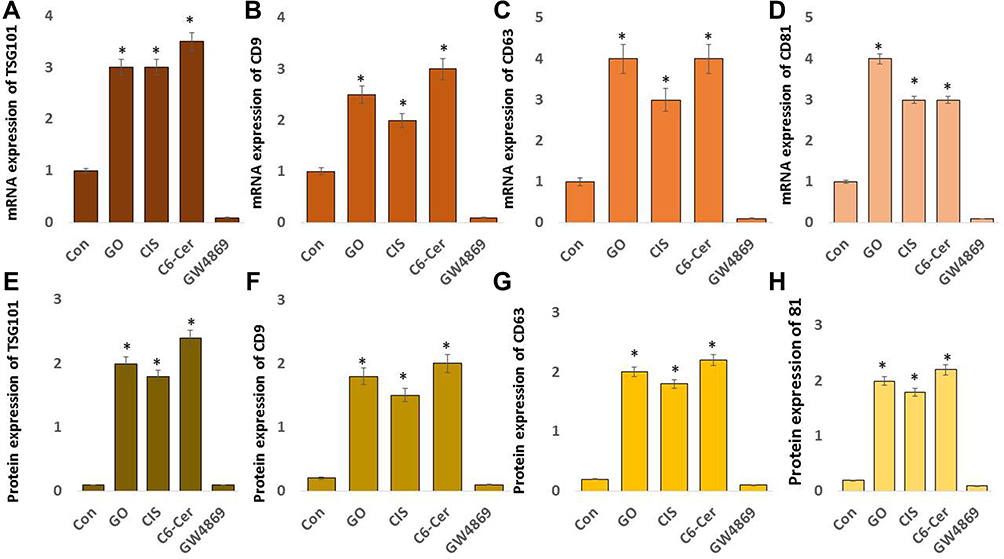 |
Figure 11 Effect of GO on mRNA and protein expression levels of exosomal markers TSG101, CD81, CD63, and CD9. SKOV3 cells were treated with GO (25 µg/mL), CIS (6 µg/mL), C6-Cer (15 µg/mL), and GW4869 (25 µM) for 24 h in cell culture medium supplemented with 1% FCS for 24 h. (A) The mRNA expression levels of TSG101 (A), CD9 (B), CD63 (C) and CD81 (D) were analyzed quantitative reverse transcription-polymerase chain reaction. The protein expression levels of TSG101 (E), CD9 (F), CD63 (G) and CD81 (H) were analyzed using ELISA.The results are expressed as the mean fold change ± standard deviation from three independent experiments. The treated groups showed statistically significant differences from the control group by the Student’s t-test; *p <0.05 was considered significant. |
The expression of the tetraspanin family of proteins such as CD9, CD63, and CD81 is significant. These are predominantly located on the surface of exosomes, thereby serving as a potential marker. We measured the expression levels of TSG101 and tetraspanins (CD9, CD63, and CD81) in SKOV3 cells exposed to GO (25 µg/mL), CIS (6 µg/mL), C6-Cer (15 µg/mL), and GW4869 (25 µM) for 24 h using ELISA. Our results indicated that the expression of TSG101, CD9, CD63, and CD81 increased in the exosomes released from GO-, CIS-, and C6-Cer-treated cells compared to that in the control cells. Exosome markers were significantly increased, and the expression of these exosomal proteins confirmed the release of exosomes from cells. These observations support that GO potentially induces exosome secretion. The expression levels of TSG101, CD9, CD63, and CD81 in GO-treated cells increased several-fold. However, GW4869-treated SKOV3 cells exhibited low protein levels compared to that in the control (Figure 11E–H). Stress factors induce the expression of exosomal marker proteins. Li et al23 reported that low-serum condition-induced cytotoxic stress enhances the expression of PDC6I/Alix, CD9, and TSG101 compared to the induction by high serum condition. Results from qRT-PCR and ELISA demonstrated that the expression levels of exosome markers were higher and more significant in the GO-treated group compared with the control group. The mRNA and protein levels of TSG101, CD63, CD81, and CD9 were upregulated in the GO-treated group compared to that in the other groups. These data suggest that SKOV3 cells can release exosomes carrying TSG101, CD63, CD81, and CD9 in the presence of GO.
NAC and GW4869 Decrease GO-Induced AChE, n-Sphingomyelinase Activity, Expression of Exosomes Protein, and Exosomes Numbers
Oxidative stress is a condition where the imbalance between pro-oxidants and antioxidants occurs due to abnormally high levels of free radicals or a decline in antioxidant defense mechanisms.198 Oxidative stress is strongly associated with increased ROS and free radical formation leading to cell cytotoxicity, damage, and death.199,200 Therefore, excessive oxidative stress should be treated with antioxidants to achieve an anti-inflammatory response. N-Acetyl Cysteine (NAC) is a glutathione (GSH) precursor. NAC exhibits anti-inflammatory activity by moderating the synthesis of inflammatory and pro-inflammatory cytokines. It reduces cellular oxidative stress response by scavenging free radicals, thus restoring cell viability and protecting cells from apoptosis.201,202 GW4869, an n-sphingomyelinase inhibitor, inhibits exosome generation. It blocks ceramide-mediated inward budding of multivesicular bodies (MVBs) and the release of mature exosomes from MVBs. Therefore, we investigated the effects of NAC and GW4869 on GO-induced AChE, nSMase activity, expression of exosome proteins, and exosomes numbers exposed to GO (25 µg/mL), CIS (6 µg/mL), C6-Cer (15 µg/mL), and GW4869 (25 µM) for 24 h, in SKOV3 cells. The results revealed that AChE activity was significantly increased in cells exposed to GO, CIS, and C6-Cer and reached a 6-, 5-, and 6-fold activity, respectively, compared to that in the control. In contrast, SKOV3 cells pre-treated with NAC or GW4869 significantly decreased GO-induced activity of AChE, which was equal to that observed in the control. Studies revealed that NAC potentially decreased AChE activity in mouse brain tissue.203 Similarly, GW4869 decreased the GO-induced activity of AChE (Figure 12A). Our findings, consistent with previous reports, indicate that lipopolysaccharide increases AChE activity by several folds, which could be associated with the exosome membrane.63 Metal nanoparticles, such as silver nanoparticles, dose-dependently inhibited AChE activity in Zebra Fish larvae,204 and carbon nanoparticles increased AChE activity.176
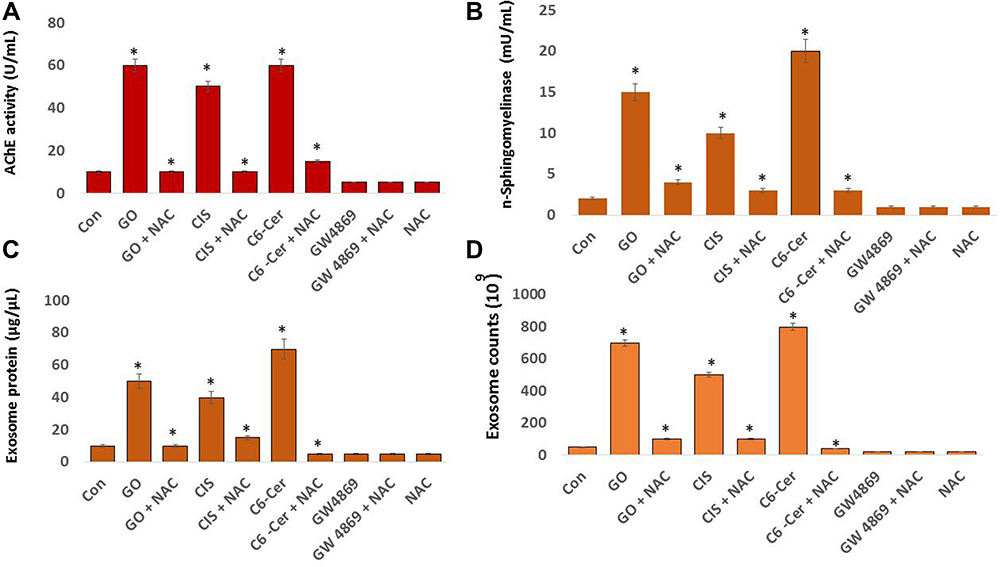 |
Figure 12 Effects of NAC and GW4869 on the influence of GO on AChE and n- sphingomyelinase activities, exosomal protein level, and exosome counts. SKOV3 cells were treated with GO (25 µg/mL), CIS (6 µg/mL), C6-Cer (15 µg/mL), and GW4869 (25 µM) for 24 h in cell culture medium supplemented with 1% FCS for 24 h. The cells were pre-treated with either NAC or GW4869. (A) AChE activity was determined in exosomes using a colorimetric method. (B) Neutral sphingomyelinase activity was estimated using the Amplex Red sphingomyelinase assay kit. (C) Total protein concentration of exosomes was determined using BCA. (D) Exosome counts were determined by EXOCET. The results are expressed as the mean fold change ± standard deviation from three independent experiments. The treated groups showed statistically significant differences from the control group by the Student’s t-test; *p <0.05 was considered significant. |
We examined the impact of NAC and GW4869 on nSMase activity. GO, CIS, and C6-Cer treatment resulted in a 7-, 5-, and a 10-fold increase in nSMase activity, respectively. In contrast, SKOV3 cells pre-treated with NAC or GW4869 exhibited a decrease in the activity of nSMase. This decrease was equal to that observed in the control. Moreover, GW4869-treated cells showed no significant effects, similar to the control cells (Figure 12B). GSH and NAC dose-dependently inhibited n-sphingomyelinase activity.205 Ceramide is involved in multivesicular endosome production and release of exosomes.13 N-sphingomyelinase activity is critically involved in exosome biogenesis and packaging prions into vesicles. GW4869 inhibits n-sphingomyelinase-mediated exosome formation and PrP packaging. Further, studies demonstrated that the knockdown of nSMase1 and nSMase2 in mouse neurons decreased exosome release.180 Treatment of cells with GW4869 could block the promotion of apoptosis in cancer cells.206 Stress factors play an important role in the activation of n-sphingomyelinase. Starvation activates nSMase 2, regulates autophagy, and increases ceramide formation in the Golgi apparatus.207 NSMase and Rab GTPase pathways play a significant role in increased exosome biogenesis and release from mesenchymal stem cells (MSCs) by ion products of bioglass.208 Our findings suggest that GO could activate n-sphingomyelinases either by oxidative stress, apoptosis, or serum starvation and that these pathways regulate the biogenesis and release of exosomes.
To correlate the inter-relationship between AChE and n-sphingomyelinase activities and the total protein concentration of exosomes and exosome numbers, SKOV3 cells were treated with GO (25 µg/mL), CIS (6 µg/mL), and C6-Cer (15 µg/mL). Both total protein concentration and exosome count increased, whereas this was significantly decreased in cells treated with either NAC or GW4869. Furthermore, a significant difference was observed in exosome protein concentration and number between the control and the GW4869- or NAC-treated SKOV3 cells. Similarly, SKOV3 cells pre-treated with NAC or GW4869 showed decreased total protein concentration and exosome counts (Figures 12C and D). These results indicate that NAC and GW4869 are critically involved in the biogenesis and release of exosomes via the suppression of oxidative stress induced by GO and n-sphingomyelinase activity by GW4869. Reductions in both exosome protein concentration and numbers were possibly due to the decreased levels of n-sphingomyelinase activity and oxidative stress. Previous studies reported that GW4869, a sphingomyelinase inhibitor, reduced ceramide generation and inhibited small extracellular vesicles (sEV) formation.209 Therefore, these findings suggest that GO induces exosome biogenesis and release through the induction of oxidative stress and simultaneous activation of n-sphingomyelinase activity. This has significant importance in ceramide formation, triggering the budding of exosome vesicles into multivesicular bodies.13 In vitro and in vivo models demonstrated that simvastatin, an HMG-CoA inhibitor, can alter exosome formation and secretion.210 Silver nanoparticles enhance the biogenesis and secretion of exosomes in SHSY5Y cells growing on a serum-free medium.211 Platinum nanoparticles and palladium nanoparticles increase biogenesis and release of exosomes in A549 and THP-1 cells, respectively, by the increased level of oxidative stress and ceramide pathways.28,29
GO Induces Pro-Inflammatory Cytokines in Secreted Exosomes of SKOV3 Cells
Pro-inflammatory cytokines play a significant role in cellular signaling and inflammatory responses. Cytokines may be packed into EVs. The packaging of cytokines into EVs regulates various inflammatory responses. To examine the cytokines level in exosomes, SKOV3 cells were treated with GO (25 µg/mL), CIS (6 µg/mL), and C6-Cer (15 µg/mL) for 24 h. Subsequently, cytokine levels were determined using the 13-plex human suspension cyto/chemokine assay kit multiplex ELISA.28 We observed that the expression levels of cytokines were significantly elevated in exosomes isolated from GO, CIS, and C6-Cer treated cells. In contrast, GW4869-treated cells exhibited significantly lower cytokine expression levels than that in the control cells. This indicates that low levels of cytokines result from the blockade of biogenesis and release of exosomes by GW4869. In general, the levels of all tested pro-inflammatory cytokines in the treated groups were higher than those in the control group. The relative concentrations of interleukin (IL)-1β, tumor necrosis factor (TNF)-α, granulocyte-macrophage colony-stimulating factor (GM-CSF), IL-8, IL-6, and monocyte chemoattractant protein-1 (MCP-1) were 400, 500, 300, 600, 1000, and 500 pg/mL, respectively, in GO-exposed cells. In contrast, in the CIS-treated cells, the concentrations of IL-1β, TNF-α, GM-CSF, IL-8, IL-6, and MCP-1 were 350, 400, 350, 500, 1100, and 400 pg/mL, respectively. In the C6-Cer-treated cells, concentrations of IL-1β, TNF-α, GM-CSF, IL-8, IL-6, and MCP-1 were 400, 450, 400, 500, 1200, and 600 pg/mL, respectively. In GW4869-treated cells, the relative concentrations of IL-1β, TNF-α, GM-CSF, IL-8, IL-6, and MCP-1 released were 50, 50, 40, 25, 50, and 50 pg/mL, respectively (Figure 13A–F). Breast cancer cell-derived exosomes stimulate the activation of tumor-associated macrophages (TAMs), resulting in NF-kB activation and secretion of pro-inflammatory cytokines.212 Exosomes derived from the body fluids promote the secretion of inflammatory cytokines such as IL1 β, TNF-α, and IL-6 in monocytic cells via Toll-like receptor signaling.213 Tumor-derived exosomes trigger the release of cytokines, including IL-6, TNF-α, and TGF-β, in human blood monocytes.214 LPS stimulates various types of cytokines in exosomes derived from RAW 264.7 mouse macrophages.215 IL-6 is a critical cytokine involved in ovarian cancer and the tumor microenvironment.216 IL-6 increases anchorage-independent growth, proliferation, adhesion, and invasion.217 IL-6 released from tumor-associated macrophages (TAMs) stimulated the expression of PD-L1 at the surface of HO8910 and SKOV3 ovarian cancer cells suggesting a potential mechanism involved in immune cell evasion.218 Exosomes isolated from patients with ovarian cancer and ovarian cancer cells induced pro-inflammatory cytokines, such as IL-1β.219 Exosomes from ovarian cancer cells consist of bioactive molecules, which are significantly involved in tumor progressions, such as immune regulation-related molecules, miRNA involved in tumor invasion, and drug resistance-related molecules.220 Therefore, these findings suggest that GO enhances the release of pro-inflammatory cytokines from exosomes. Additionally, these cytokines could act as extracellular ligands for specific membrane receptors on responsive target cells.
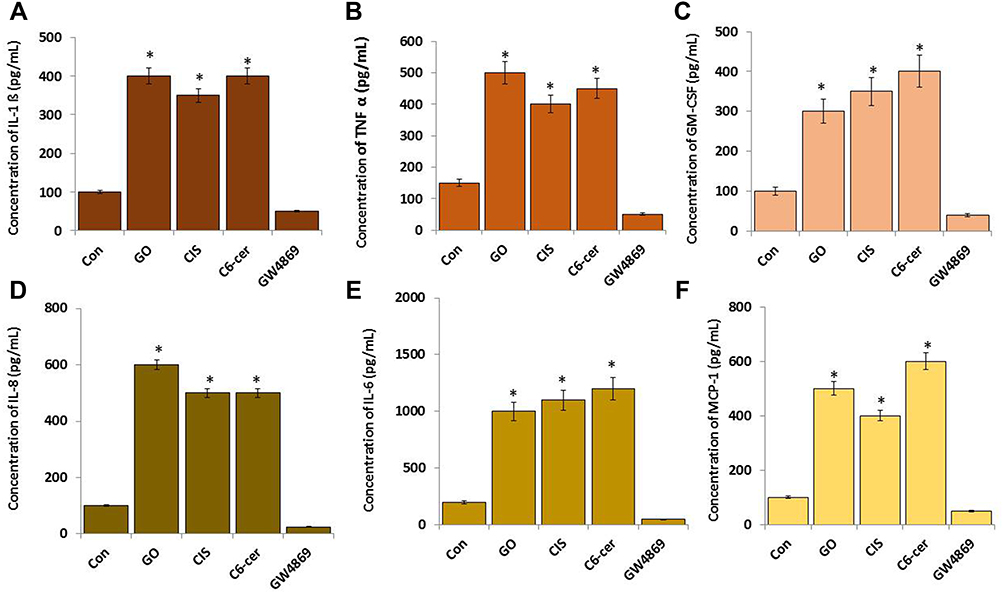 |
Figure 13 Effects of GO on pro-inflammatory cytokines and chemokines. SKOV3 cells were treated with GO (25 µg/mL), CIS (6 µg/mL), C6-Cer (15 µg/mL), and GW4869 (25 µM) for 24 h in cell culture medium supplemented with 1% FCS for 24 h. The expression levels of IL-1β (A), TNF-α (B), GM-CSF (C), IL-8 (D), IL-6 (E), and MCP-1 (F) were measured using ELISA. The results are expressed as the mean ± standard deviation of three independent experiments. The treated groups showed statistically significant differences from the control group by the Student’s t-test; *p <0.05 was considered significant. |
Effect of Endocytic Inhibitors on GO-Induced Exosomes in SKOV3 Cells
To investigate the effect of endocytic inhibitors on biogenesis and the release of exosomes on SKOV3 cells, we examined the effect of endocytic inhibitors on the viability of SKOV3 cells. The cells were treated with various types of inhibitors, including chlorpromazine (30 µM), methyl-beta-cyclodextrin (20 µM), cytochalasin (4 µM) D, nocodazole (10 µM), and dynasore (10 µM) for 2 h. The culture medium was removed, and fresh medium containing GO (15 µg/mL) was added to the cells, which were maintained for another 24 h. Cell viability was determined using the CCK-8 assay. The results indicated that cells exposed to GO inhibited 50% of cell viability compared to that in the control. No evident reduction in viability was observed after incubation with the endocytic inhibitors (Figure 14A).
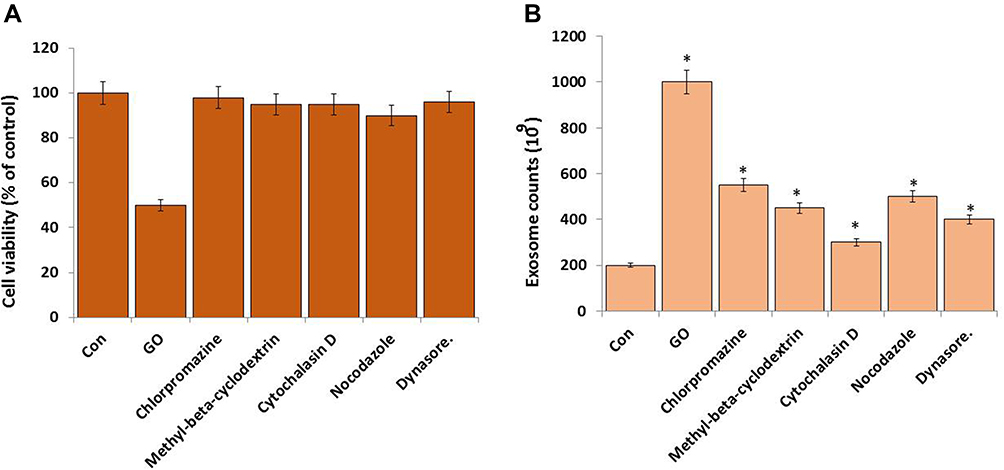 |
Figure 14 Effect of endocytosis inhibitors on GO enhanced biogenesis and release. (A) Cell viability was measured in SKOV3 cells were incubated with chlorpromazine (30 µM), methyl-b-cyclodextrin (20 µM), cytochalasin D (4 µM), nocodazole (10 µM), and dynasore (10 µM) for 2 h, then the culture medium was removed, and fresh medium was added supplemented with 1% FCS containing GO (25 µg/mL). (B) Exosomes were isolated and measured in SKOV3 cells were incubated with chlorpromazine (30 µM), methyl-b-cyclodextrin (20 µM), cytochalasin D (4 µM), nocodazole (10 µM), and dynasore (10 µM) for 2 h, then the culture medium was removed, and fresh medium was added supplemented with 1% FCS containing GO (25 µg/mL). The results are expressed as the mean ± standard deviation of three independent experiments. The treated groups showed statistically significant differences from the control group by the Student’s t-test; *p <0.05 was considered significant. |
To elucidate the involvement of endocytic mechanisms on exosome biogenesis and release, endocytosis inhibitors were added to the culture medium before and after the GO treatment. Exosomes were isolated and counted using EXOCET. The results indicated that the cells treated with GO, chlorpromazine, methyl-beta-cyclodextrin, cytochalasin D, nocodazole, and dynasore released 1000, 550, 450, 300, 500, and 400×109 exosomes (Figure 14B). The five inhibitors could block exosome biogenesis and release by blocking the endocytic mechanism. These results indicated that these inhibitors inhibit endocytic pathways by regulating microfilament action, microtubule function, caveolin-mediated endocytosis, and fission of vesicles.65 Different MVs inhibitors, such as BAPTA, cytochalasin D, and Y27632, reportedly inhibited the formation of microvesicles. Cytochalasin D can bind the edges of actin filaments preventing subunit association or dissociation, thus, inhibiting and avoiding actin polymerization. Eventually, it is involved in blocking and release of budding MVs or MVB trafficking towards the cell membrane. Salma Khan et al221 reported that Cytochalasin D treatment reduced exosome release, reducing the amount of survivin present in the tumor environment. Methyl-beta-cyclodextrin treatment reduced the number of exosome-sized vesicles by 58% compared to that in the untreated control. Further, they reported that peptidylarginine deiminase (PAD) inhibition using Cl-amidine significantly reduced cellular EMV release, targeting both MVs as well as demonstrating a novel inhibitory effect on exosome release.222 Manumycin-A (MA) reportedly inhibited small extracellular vesicles (sEV) biogenesis and secretion via the Ras/Raf/ERK1/2 signaling in castration-resistant prostate cancer cells but not in normal prostate epithelial cells.223 Nocodazole binds to tubulin, blocking microtubule polymerizations, which is essential in clathrin-mediated endocytosis.224,225 Dynasore is commonly used to block dynamin, a key protein for vesicle fission.226,227 Dynamin reportedly regulates clathrin-mediated endocytosis in yeast;15 thus, we expected dynasore to reduce the biogenesis and release of exosomes. We observed that dynasore inhibits biogenesis and release of exosomes. Therefore, these inhibitors can alter endocytic signals to form and release ILV and MVBs.
Conclusion
Exosomes can mediate long-distance communication between cells by delivering various types of cargo molecules such as lipids, proteins, and nucleic acids. They play a vital role in a wide variety of processes within the human body. We demonstrated that GO-stimulated exosome secretion in SKOV3 cells is associated with loss of cell viability and proliferation, increased cytotoxic, oxidative, and ER stress, immunomodulatory effects, and a decrease in the mitochondrial membrane potential and ATP levels. Also, the variation in exosome biogenesis and release by modulating the expression levels of acetylcholine esterase, neutral sphingomyelinase activity, total exosome protein concentration, and exosome numbers were demonstrated. The expression levels of TSG101, CD9, CD63, and CD81 significantly increased in GO-treated cells. Therefore, our findings suggested that GO has significant effects on exosome biogenesis and composition. To the best of our knowledge, this is the first study to demonstrate that GO stimulates exosome biogenesis through the modulation of oxidative and ER stress, cytotoxicity, and immunomodulatory effects. Cytotoxic stress leads to the activation of acetylcholine esterase, neutral sphingomyelinase activity, total exosome protein concentration, and exosome numbers. In addition, endocytic inhibitors decrease GO-induced biogenesis and release of exosomes. However, further investigation is warranted to explore the specific underlying mechanism(s). Overall, we identified GO as novel molecular machinery that regulates the formation and release of exosomes. We believe that our findings will contribute to future developments of a graphene-based technology to increase the yields of exosomes released from human cancer cells.
Data availability
See the Supplementary Materials and methods section for further materials and methods information.
Acknowledgment
This paper was supported and funded by Konkuk University in 2018.
Disclosure
The authors declare no conflicts of interest for this work.
References
1. Raposo G, Stoorvogel W. Extracellular vesicles: exosomes, microvesicles, and friends. J Cell Biol. 2013;200(4):373–383. doi:10.1083/jcb.201211138
2. Kalluri R, LeBleu VS. The biology, function, and biomedical applications of exosomes. Science. 2020;367(6478). doi:10.1126/science.aau6977
3. van Niel G, D’Angelo G, Raposo G. Shedding light on the cell biology of extracellular vesicles. Nat Rev Mol Cell Biol. 2018;19(4):213–228. doi:10.1038/nrm.2017.125
4. Pegtel DM, Gould SJ. Exosomes. Annu Rev Biochem. 2019;88(1):487–514. doi:10.1146/annurev-biochem-013118-111902
5. Valadi H, Ekstrom K, Bossios A, et al. Exosome-mediated transfer of mRNAs and microRNAs is a novel mechanism of genetic exchange between cells. Nat Cell Biol. 2007;9(6):654–659. doi:10.1038/ncb1596
6. Thakur BK, Zhang H, Becker A, et al. Double-stranded DNA in exosomes: a novel biomarker in cancer detection. Cell Res. 2014;24(6):766–769. doi:10.1038/cr.2014.44
7. Cheng G, Li W, Ha L, et al. Self-assembly of extracellular vesicle-like metal-organic framework nanoparticles for protection and intracellular delivery of biofunctional proteins. J Am Chem Soc. 2018;140(23):7282–7291. doi:10.1021/jacs.8b03584
8. Lin MC, Chen SY, He PL, et al. PGE2 /EP4 antaGOism enhances tumor chemosensitivity by inducing extracellular vesicle-mediated clearance of cancer stem cells. Int J Cancer. 2018;143(6):1440–1455. doi:10.1002/ijc.31523
9. Alderton GK. Metastasis. Exosomes drive premetastatic niche formation. Nat Rev Cancer. 2012;12(7):447. doi:10.1038/nrc3304
10. Ruivo CF, Adem B, Silva M, et al. The biology of cancer exosomes: insights and new perspectives. Cancer Res. 2017;77(23):6480–6488. doi:10.1158/0008-5472.CAN-17-0994
11. Gurunathan S, Kang MH, Jeyaraj M, et al. Review of the isolation, characterization, biological function, and multifarious therapeutic approaches of exosomes. Cells. 2019;8(4):307. doi:10.3390/cells8040307
12. Gurunathan S, Kang MH, Qasim M, et al. Biogenesis, membrane trafficking, functions, and next generation nanotherapeutics medicine of extracellular vesicles. Int J Nanomedicine. 2021;16:3357–3383. doi:10.2147/IJN.S310357
13. Trajkovic K, Hsu C, Chiantia S, et al. Ceramide triggers budding of exosome vesicles into multivesicular endosomes. Science. 2008;319(5867):1244–1247. doi:10.1126/science.1153124
14. Castro LR, Guiot E, Polito M, et al. Decoding spatial and temporal features of neuronal cAMP/PKA signaling with FRET biosensors. Biotechnol J. 2014;9(2):192–202. doi:10.1002/biot.201300202
15. Gurunathan S, David D, Gerst JE. Dynamin and clathrin are required for the biogenesis of a distinct class of secretory vesicles in yeast. EMBO J. 2002;21(4):602–614. doi:10.1093/emboj/21.4.602
16. Henne WM, Buchkovich NJ, Emr SD. The ESCRT pathway. Dev Cell. 2011;21(1):77–91. doi:10.1016/j.devcel.2011.05.015
17. Villarroya-Beltri C, Baixauli F, Gutierrez-Vazquez C, et al. Sorting it out: regulation of exosome loading. Semin Cancer Biol. 2014;28:3–13. doi:10.1016/j.semcancer.2014.04.009
18. Airola MV, Hannun YA. Sphingolipid metabolism and neutral sphingomyelinases. Handb Exp Pharmacol. 2013;2013(215):57–76.
19. Perez-Hernandez D, Gutierrez-Vazquez C, Jorge I, et al. The intracellular interactome of tetraspanin-enriched microdomains reveals their function as sorting machineries toward exosomes. J Biol Chem. 2013;288(17):11649–11661. doi:10.1074/jbc.M112.445304
20. Llorente A, van Deurs B, Sandvig K. Cholesterol regulates prostasome release from secretory lysosomes in PC-3 human prostate cancer cells. Eur J Cell Biol. 2007;86(7):405–415. doi:10.1016/j.ejcb.2007.05.001
21. Koumangoye RB, Sakwe AM, Goodwin JS, et al. Detachment of breast tumor cells induces rapid secretion of exosomes which subsequently mediate cellular adhesion and spreading. PLoS One. 2011;6(9):e24234. doi:10.1371/journal.pone.0024234
22. Phuyal S, Hessvik NP, Skotland T, et al. Regulation of exosome release by glycosphingolipids and flotillins. FEBS J. 2014;281(9):2214–2227. doi:10.1111/febs.12775
23. Li J, Lee Y, Johansson HJ, et al. Serum-free culture alters the quantity and protein composition of neuroblastoma-derived extracellular vesicles. J Extracell Vesicles. 2015;4(1):26883. doi:10.3402/jev.v4.26883
24. Savina A, Furlan M, Vidal M, et al. Exosome release is regulated by a calcium-dependent mechanism in K562 cells. J Biol Chem. 2003;278(22):20083–20090. doi:10.1074/jbc.M301642200
25. King HW, Michael MZ, Gleadle JM. Hypoxic enhancement of exosome release by breast cancer cells. BMC Cancer. 2012;12(1):421. doi:10.1186/1471-2407-12-421
26. Atienzar-Aroca S, Flores-Bellver M, Serrano-Heras G, et al. Oxidative stress in retinal pigment epithelium cells increases exosome secretion and promotes angiogenesis in endothelial cells. J Cell Mol Med. 2016;20(8):1457–1466. doi:10.1111/jcmm.12834
27. Zhu L, Zang J, Liu B, et al. Oxidative stress-induced RAC autophagy can improve the HUVEC functions by releasing exosomes. J Cell Physiol. 2020;235(10):7392–7409. doi:10.1002/jcp.29641
28. Gurunathan S, Kang MH, Jeyaraj M, et al. Palladium nanoparticle-induced oxidative stress, endoplasmic reticulum stress, apoptosis, and immunomodulation enhance the biogenesis and release of exosome in human leukemia monocytic cells (THP-1). Int J Nanomedicine. 2021;16:2849–2877. doi:10.2147/IJN.S305269
29. Gurunathan S, Kang MH, Jeyaraj M, et al. Platinum nanoparticles enhance exosome release in human lung epithelial adenocarcinoma cancer cells (A549): oxidative stress and the ceramide pathway are key players. Int J Nanomedicine. 2021;16:515–538. doi:10.2147/IJN.S291138
30. Pollet H, Conrard L, Cloos AS, et al. Plasma membrane lipid domains as platforms for vesicle biogenesis and shedding? Biomolecules. 2018;8(3):94. doi:10.3390/biom8030094
31. Emam SE, Ando H, Abu LA, et al. A novel strategy to increase the yield of exosomes (extracellular vesicles) for an expansion of basic research. Biol Pharm Bull. 2018;41(5):733–742. doi:10.1248/bpb.b17-00919
32. Oskowitz A, McFerrin H, Gutschow M, et al. Serum-deprived human multipotent mesenchymal stromal cells (MSCs) are highly angiogenic. Stem Cell Res. 2011;6(3):215–225. doi:10.1016/j.scr.2011.01.004
33. Aubertin K, Silva AK, Luciani N, et al. Massive release of extracellular vesicles from cancer cells after photodynamic treatment or chemotherapy. Sci Rep. 2016;6(1):35376. doi:10.1038/srep35376
34. Taverna S, Ghersi G, Ginestra A, et al. Shedding of membrane vesicles mediates fibroblast growth factor-2 release from cells. J Biol Chem. 2003;278(51):51911–51919. doi:10.1074/jbc.M304192200
35. Haraszti RA, Miller R, Dubuke ML, et al. Serum deprivation of mesenchymal stem cells improves exosome activity and alters lipid and protein composition. iScience. 2019;16:230–241. doi:10.1016/j.isci.2019.05.029
36. Hedlund M, Nagaeva O, Kargl D, et al. Thermal- and oxidative stress causes enhanced release of NKG2D ligand-bearing immunosuppressive exosomes in leukemia/lymphoma T and B cells. PLoS One. 2011;6(2):e16899. doi:10.1371/journal.pone.0016899
37. Wang J, Hendrix A, Hernot S, et al. Bone marrow stromal cell-derived exosomes as communicators in drug resistance in multiple myeloma cells. Blood. 2014;124(4):555–566. doi:10.1182/blood-2014-03-562439
38. Vulpis E, Cecere F, Molfetta R, et al. Genotoxic stress modulates the release of exosomes from multiple myeloma cells capable of activating NK cell cytokine production: role of HSP70/TLR2/NF-kB axis. Oncoimmunology. 2017;6(3):e1279372. doi:10.1080/2162402X.2017.1279372
39. Bandari SK, Purushothaman A, Ramani VC, et al. Chemotherapy induces secretion of exosomes loaded with heparanase that degrades extracellular matrix and impacts tumor and host cell behavior. Matrix Biol. 2018;65:104–118. doi:10.1016/j.matbio.2017.09.001
40. Gobbo J, Marcion G, Cordonnier M, et al. Restoring anticancer immune response by targeting tumor-derived exosomes with a HSP70 peptide aptamer. J Natl Cancer Inst. 2016;108(3):djv330. doi:10.1093/jnci/djv330
41. Park BG, Kim YJ, Min JH, et al. Assessment of cellular uptake efficiency according to multiple inhibitors of Fe3O4-Au core-shell nanoparticles: possibility to control specific endocytosis in colorectal cancer cells. Nanoscale Res Lett. 2020;15(1):165. doi:10.1186/s11671-020-03395-w
42. Gurunathan S, Kang M-H, Kim J-H. Silver nanoparticle enhances secretion of exosomes in SH-SY5Y cells: potential therapeutic strategy for human neuroblastoma cancer. Curr Nanosci. 2022;18(5):623–645. doi:10.2174/1573413717666210920095311
43. Gurunathan S, Kim JH. Synthesis, toxicity, biocompatibility, and biomedical applications of graphene and graphene-related materials. Int J Nanomedicine. 2016;11:1927–1945. doi:10.2147/IJN.S105264
44. Kim JH, Chung HH, Jeong MS, et al. One-step detection of circulating tumor cells in ovarian cancer using enhanced fluorescent silica nanoparticles. Int J Nanomedicine. 2013;8:2247–2257. doi:10.2147/IJN.S45059
45. Gurunathan S, Han JW, Eppakayala V, et al. Green synthesis of graphene and its cytotoxic effects in human breast cancer cells. Int J Nanomedicine. 2013;8:1015–1027. doi:10.2147/IJN.S42047
46. Gurunathan S, Han J, Park JH, et al. An in vitro evaluation of graphene oxide reduced by Ganoderma spp. in human breast cancer cells (MDA-MB-231). Int J Nanomedicine. 2014;9:1783–1797. doi:10.2147/IJN.S57735
47. Gurunathan S, Han JW, Park JH, et al. Reduced graphene oxide-silver nanoparticle nanocomposite: a potential anticancer nanotherapy. Int J Nanomedicine. 2015;10:6257–6276. doi:10.2147/IJN.S92449
48. Gurunathan S, Kim JH. Graphene oxide-silver nanoparticles nanocomposite stimulates differentiation in human neuroblastoma cancer cells (SH-SY5Y). Int J Mol Sci. 2017;18(12). doi:10.3390/ijms18122549
49. Gurunathan S, Han JW, Dayem AA, et al. Oxidative stress-mediated antibacterial activity of graphene oxide and reduced graphene oxide in Pseudomonas aeruginosa. Int J Nanomedicine. 2012;7:5901–5914. doi:10.2147/IJN.S37397
50. Gurunathan S, Kang MH, Jeyaraj M, et al. Differential cytotoxicity of different sizes of graphene oxide in Leydig (TM3) and Sertoli (TM4) cells. Nanomaterials. 2019;9(2):139. doi:10.3390/nano9020139
51. Yuan YG, Gurunathan S. Combination of graphene oxide-silver nanoparticle nanocomposites and cisplatin enhances apoptosis and autophagy in human cervical cancer cells. Int J Nanomedicine. 2017;12:6537–6558. doi:10.2147/IJN.S125281
52. Gurunathan S, Jeyaraj M, Kang MH, et al. Melatonin enhances palladium-nanoparticle-induced cytotoxicity and apoptosis in human lung epithelial adenocarcinoma cells A549 and H1229. Antioxidants. 2020;9(4). doi:10.3390/antiox9040357
53. Chen Y, Rosazza JP. Purification and characterization of nitric oxide synthase (NOSNoc) from a Nocardia species. J Bacteriol. 1995;177(17):5122–5128. doi:10.1128/jb.177.17.5122-5128.1995
54. Gurunathan S, Qasim M, Park CH, et al. Cytotoxicity and transcriptomic analyses of biogenic palladium nanoparticles in human ovarian cancer cells (SKOV3). Nanomaterials. 2019;9(5):787. doi:10.3390/nano9050787
55. Maisonneuve E, Fraysse L, Lignon S, et al. Carbonylated proteins are detectable only in a degradation-resistant aggregate state in Escherichia coli. J Bacteriol. 2008;190(20):6609–6614. doi:10.1128/JB.00588-08
56. Sousa L, Garcia IJ, Costa TG, et al. Effects of iron overload on the activity of Na,K-ATPase and lipid profile of the human erythrocyte membrane. PLoS One. 2015;10(7):e132852. doi:10.1371/journal.pone.0132852
57. Gurunathan S, Jeyaraj M, La H, et al. Anisotropic platinum nanoparticle-induced cytotoxicity, apoptosis, inflammatory response, and transcriptomic and molecular pathways in human acute monocytic leukemia cells. Int J Mol Sci. 2020;21(2):440. doi:10.3390/ijms21020440
58. Gurunathan S, Kang MH, Kim JH. Combination effect of silver nanoparticles and histone deacetylases inhibitor in human alveolar basal epithelial cells. Molecules. 2018;23(8):2046. doi:10.3390/molecules23082046
59. Gurunathan S, Jeyaraj M, Kang MH, et al. Anticancer properties of platinum nanoparticles and retinoic acid: combination therapy for the treatment of human neuroblastoma cancer. Int J Mol Sci. 2020;21(18):6792. doi:10.3390/ijms21186792
60. Gurunathan S, Kang MH, Jeyaraj M, et al. Palladium nanoparticle-induced oxidative stress, endoplasmic reticulum stress, apoptosis, and immunomodulation enhance the biogenesis and release of exosome in human leukemia monocytic cells (THP-1). Int J Nanomedicine. 2021;16:2849–2877.
61. Kalimuthu K, Kwon WY, Park KS. A simple approach for rapid and cost-effective quantification of extracellular vesicles using a fluorescence polarization technique. J Biol Eng. 2019;13(1):31. doi:10.1186/s13036-019-0160-9
62. Genneback N, Hellman U, Malm L, et al. Growth factor stimulation of cardiomyocytes induces changes in the transcriptional contents of secreted exosomes. J Extracell Vesicles. 2013;2(1):20167. doi:10.3402/jev.v2i0.20167
63. Essandoh K, Yang L, Wang X, et al. Blockade of exosome generation with GW4869 dampens the sepsis-induced inflammation and cardiac dysfunction. Biochim Biophys Acta. 2015;1852(11):2362–2371. doi:10.1016/j.bbadis.2015.08.010
64. Tabatadze N, Savonenko A, Song H, et al. Inhibition of neutral sphingomyelinase-2 perturbs brain sphingolipid balance and spatial memory in mice. J Neurosci Res. 2010;88(13):2940–2951. doi:10.1002/jnr.22438
65. Chen K, Li X, Zhu H, et al. Endocytosis of nanoscale systems for cancer treatments. Curr Med Chem. 2018;25(25):3017–3035. doi:10.2174/0929867324666170428153056
66. Hummers WS. Preparation of graphitic oxide. J Am Chem Soc. 1958;6(80):1339. doi:10.1021/ja01539a017
67. Gurunathan S, Han JW, Kim ES, et al. Reduction of graphene oxide by resveratrol: a novel and simple biological method for the synthesis of an effective anticancer nanotherapeutic molecule. Int J Nanomedicine. 2015;10:2951–2969. doi:10.2147/IJN.S79879
68. Venugopal G, Kim S. Observation of nonvolatile resistive memory switching characteristics in Ag/graphene-oxide/Ag devices. J Nanosci Nanotechnol. 2012;12(11):8522–8525. doi:10.1166/jnn.2012.6675
69. Amaro-Gahete J, Benitez A, Otero R, et al. A comparative study of particle size distribution of graphene nanosheets synthesized by an ultrasound-assisted method. Nanomaterials. 2019;9(2):152. doi:10.3390/nano9020152
70. Kuila T, Khanra P, Kim NH, et al. One-step electrochemical synthesis of 6-amino-4-hydroxy-2-napthalene-sulfonic acid functionalized graphene for green energy storage electrode materials. Nanotechnology. 2013;24(36):365706. doi:10.1088/0957-4484/24/36/365706
71. Kashyap S, Mishra S, Behera SK. Aqueous colloidal stability of graphene oxide and chemically converted graphene. J Nanoparticles. 2014;2014:1–6. doi:10.1155/2014/640281
72. Chen PC, Joyner CC. Vibrational and vibronic processes in coherent 2D resonance Raman spectroscopy. J Phys Chem A. 2006;110(26):7989–7993. doi:10.1021/jp061983a
73. Ferrari AC, Meyer JC, Scardaci V, et al. Raman spectrum of graphene and graphene layers. Phys Rev Lett. 2006;97(18):187401. doi:10.1103/PhysRevLett.97.187401
74. Pimenta MA, Dresselhaus G, Dresselhaus MS, et al. Studying disorder in graphite-based systems by Raman spectroscopy. Phys Chem Chem Phys. 2007;9(11):1276–1291. doi:10.1039/B613962K
75. Gurunathan S, Han JW, Eppakayala V, et al. An environmentally friendly approach to the reduction of graphene oxide by Escherichia fergusoni. J Nanosci Nanotechnol. 2013;13(3):2091–2098. doi:10.1166/jnn.2013.6738
76. Gurunathan S, Han JW, Park JH, et al. Ginkgo biloba: a natural reducing agent for the synthesis of cytocompatible graphene. Int J Nanomedicine. 2014;9:363–377.
77. Canser A, Duygu A. Synthesis of graphene oxide through ultrasonic assisted electrochemical exfoliation. Open Chem. 2019;17(1):581–586.
78. Sangiliyandi G, Jung HP, Yun-Jung C, et al. Synthesis of graphene oxide-silver nanoparticle nanocomposites: an efficient novel antibacterial agent. Curr Nanosci. 2016;12(6):762–773.
79. Zhang JL, Xing LB, Liu TZ, et al. Three-dimensional reduced graphene hydrogels using various carbohydrates for high performance supercapacitors. J Nanosci Nanotechnol. 2017;17(2):1099–1107. doi:10.1166/jnn.2017.12621
80. Zheng X, Baker H, Hancock WS, et al. Proteomic analysis for the assessment of different lots of fetal bovine serum as a raw material for cell culture. Part IV. Application of proteomics to the manufacture of biological drugs. Biotechnol Prog. 2006;22(5):1294–1300. doi:10.1021/bp060121o
81. Kramer J, Hegert C, Hargus G, et al. Mouse ES cell lines show a variable degree of chondrogenic differentiation in vitro. Cell Biol Int. 2005;29(2):139–146. doi:10.1016/j.cellbi.2004.10.003
82. Mannello F, Tonti GA. Gelatinase concentrations and zymographic profiles in human breast cancer: matrix metalloproteinases circulating in plasma are better markers for the subclassification and early prediction of cancer: the coagulation/fibrinolysis pathways alter the release, activation and recovery of different gelatinases in serum. Int J Cancer. 2007;121(1):216–218, 219–223. doi:10.1002/ijc.22652
83. Colzani M, Waridel P, Laurent J, et al. Metabolic labeling and protein linearization technology allow the study of proteins secreted by cultured cells in serum-containing media. J Proteome Res. 2009;8(10):4779–4788. doi:10.1021/pr900476b
84. Liu HB, Lv PR, He RG, et al. Cloned Guangxi Bama minipig (Sus scrofa) and its offspring have normal reproductive performance. Cell Reprogram. 2010;12(5):543–550. doi:10.1089/cell.2009.0094
85. Codeluppi S, Gregory EN, Kjell J, et al. Influence of rat substrain and growth conditions on the characteristics of primary cultures of adult rat spinal cord astrocytes. J Neurosci Methods. 2011;197(1):118–127. doi:10.1016/j.jneumeth.2011.02.011
86. Braun F, Bertin-Ciftci J, Gallouet AS, et al. Serum-nutrient starvation induces cell death mediated by Bax and Puma that is counteracted by p21 and unmasked by Bcl-x(L) inhibition. PLoS One. 2011;6(8):e23577. doi:10.1371/journal.pone.0023577
87. Goyeneche AA, Harmon JM, Telleria CM. Cell death induced by serum deprivation in luteal cells involves the intrinsic pathway of apoptosis. Reproduction. 2006;131(1):103–111. doi:10.1530/rep.1.00751
88. Huang Y, Fu Z, Dong W, et al. Serum starvation-induces down-regulation of Bcl-2/Bax confers apoptosis in tongue coating-related cells in vitro. Mol Med Rep. 2018;17(4):5057–5064. doi:10.3892/mmr.2018.8512
89. Kulkarni GV, McCulloch CA. Serum deprivation induces apoptotic cell death in a subset of Balb/c 3T3 fibroblasts. J Cell Sci. 1994;107(Pt 5):1169–1179. doi:10.1242/jcs.107.5.1169
90. Nakhjavani M, Nikounezhad N, Ashtarinezhad A, et al. Human lung carcinoma reaction against metabolic serum deficiency stress. Iran J Pharm Res. 2016;15(4):817–823.
91. Li W, Liu J, Hammond SL, et al. Angiotensin II regulates brain (pro)renin receptor expression through activation of cAMP response element-binding protein. Am J Physiol Regul Integr Comp Physiol. 2015;309(2):R138–R147. doi:10.1152/ajpregu.00319.2014
92. Rashid MU, Coombs KM. Serum-reduced media impacts on cell viability and protein expression in human lung epithelial cells. J Cell Physiol. 2019;234(6):7718–7724. doi:10.1002/jcp.27890
93. Li W, Jiang M, Zhao S, et al. Folic acid inhibits amyloid beta-peptide production through modulating DNA methyltransferase activity in N2a-APP cells. Int J Mol Sci. 2015;16(10):25002–25013. doi:10.3390/ijms161025002
94. Savina A, Vidal M, Colombo MI. The exosome pathway in K562 cells is regulated by Rab11. J Cell Sci. 2002;115(Pt 12):2505–2515. doi:10.1242/jcs.115.12.2505
95. Perez-Aguilar B, Vidal CJ, Palomec G, et al. Acetylcholinesterase is associated with a decrease in cell proliferation of hepatocellular carcinoma cells. Biochim Biophys Acta. 2015;1852(7):1380–1387. doi:10.1016/j.bbadis.2015.04.003
96. Choi YJ, Gurunathan S, Kim JH. Graphene oxide-silver nanocomposite enhances cytotoxic and apoptotic potential of salinomycin in human ovarian cancer stem cells (OvCSCs): a novel approach for cancer therapy. Int J Mol Sci. 2018;19(3):710. doi:10.3390/ijms19030710
97. Gurunathan S, Jeyaraj M, Kang MH, et al. Graphene oxide(-)platinum nanoparticle nanocomposites: a suitable biocompatible therapeutic agent for prostate cancer. Polymers. 2019;11(4). doi:10.3390/polym11040733
98. Mukherjee SP, Gliga AR, Lazzaretto B, et al. Graphene oxide is degraded by neutrophils and the degradation products are non-genotoxic. Nanoscale. 2018;10(3):1180–1188. doi:10.1039/C7NR03552G
99. Zhou T, Zhang B, Wei P, et al. Energy metabolism analysis reveals the mechanism of inhibition of breast cancer cell metastasis by PEG-modified graphene oxide nanosheets. Biomaterials. 2014;35(37):9833–9843. doi:10.1016/j.biomaterials.2014.08.033
100. Jaworski S, Sawosz E, Kutwin M, et al. In vitro and in vivo effects of graphene oxide and reduced graphene oxide on glioblastoma. Int J Nanomedicine. 2015;10:1585–1596. doi:10.2147/IJN.S77591
101. Zhu QY, Wang Z, Ji C, et al. C6-ceramide synergistically potentiates the anti-tumor effects of histone deacetylase inhibitors via AKT dephosphorylation and alpha-tubulin hyperacetylation both in vitro and in vivo. Cell Death Dis. 2011;2(1):e117. doi:10.1038/cddis.2010.96
102. Cheng Q, Li X, Wang Y, et al. The ceramide pathway is involved in the survival, apoptosis and exosome functions of human multiple myeloma cells in vitro. Acta Pharmacol Sin. 2018;39(4):561–568. doi:10.1038/aps.2017.118
103. Iguchi Y, Eid L, Parent M, et al. Exosome secretion is a key pathway for clearance of pathological TDP-43. Brain. 2016;139(Pt 12):3187–3201. doi:10.1093/brain/aww237
104. Wu M, Harvey KA, Ruzmetov N, et al. Omega-3 polyunsaturated fatty acids attenuate breast cancer growth through activation of a neutral sphingomyelinase-mediated pathway. Int J Cancer. 2005;117(3):340–348. doi:10.1002/ijc.21238
105. Ma YY, Wu WQ, Liu ZC, et al. The CDH1-160C/A polymorphism is associated with breast cancer: evidence from a meta-analysis. World J Surg Oncol. 2016;14(1):169. doi:10.1186/s12957-016-0927-0
106. Ayoubi M, Naserzadeh P, Hashemi MT, et al. Biochemical mechanisms of dose-dependent cytotoxicity and ROS-mediated apoptosis induced by lead sulfide/graphene oxide quantum dots for potential bioimaging applications. Sci Rep. 2017;7(1):12896. doi:10.1038/s41598-017-13396-y
107. Gurunathan S, Arsalan IM, Qasim M, et al. Evaluation of graphene oxide induced cellular toxicity and transcriptome analysis in human embryonic kidney cells. Nanomaterials. 2019;9(7):969. doi:10.3390/nano9070969
108. Zhou Y, Huang D, Xin Z, et al. Evolution of oxidative phosphorylation (OXPHOS) genes reflecting the evolutionary and life histories of fig wasps (hymenoptera, chalcidoidea). Genes. 2020;11(11):1353. doi:10.3390/genes11111353
109. Szmidt M, Stankiewicz A, Urbanska K, et al. Graphene oxide down-regulates genes of the oxidative phosphorylation complexes in a glioblastoma. BMC Mol Biol. 2019;20(1):2. doi:10.1186/s12867-018-0119-2
110. Yu CH, Chen GY, Xia MY, et al. Understanding the sheet size-antibacterial activity relationship of graphene oxide and the nano-bio interaction-based physical mechanisms. Colloids Surf B Biointerfaces. 2020;191:111009. doi:10.1016/j.colsurfb.2020.111009
111. Chapple SJ, Cheng X, Mann GE. Effects of 4-hydroxynonenal on vascular endothelial and smooth muscle cell redox signaling and function in health and disease. Redox Biol. 2013;1(1):319–331. doi:10.1016/j.redox.2013.04.001
112. Meibian Z, Yezhen L, Xiaoxue L, et al. Studying the cytotoxicity and oxidative stress induced by two kinds of bentonite particles on human B lymphoblast cells in vitro. Chem Biol Interact. 2010;183(3):390–396.
113. Zhang X, He X, Li Y, et al. A cytotoxicity study of fluorescent carbon nanodots using human bronchial epithelial cells. J Nanosci Nanotechnol. 2013;13(8):5254–5259. doi:10.1166/jnn.2013.7528
114. Yuan X, Zhang B, Chen N, et al. Isoliquiritigenin treatment induces apoptosis by increasing intracellular ROS levels in HeLa cells. J Asian Nat Prod Res. 2012;14(8):789–798. doi:10.1080/10286020.2012.694873
115. Chatterjee N, Eom HJ, Choi J. A systems toxicology approach to the surface functionality control of graphene-cell interactions. Biomaterials. 2014;35(4):1109–1127. doi:10.1016/j.biomaterials.2013.09.108
116. Girotti AW. Lipid hydroperoxide generation, turnover, and effector action in biological systems. J Lipid Res. 1998;39(8):1529–1542. doi:10.1016/S0022-2275(20)32182-9
117. Mukherjee SP, Kostarelos K, Fadeel B. Cytokine profiling of primary human macrophages exposed to endotoxin-free graphene oxide: size-independent NLRP3 inflammasome activation. Adv Healthc Mater. 2018;7(4):1700815. doi:10.1002/adhm.201700815
118. Azevedo LC, Janiszewski M, Pontieri V, et al. Platelet-derived exosomes from septic shock patients induce myocardial dysfunction. Crit Care. 2007;11(6):R120. doi:10.1186/cc6176
119. Wiseman A. Therapeutic proteins and enzymes from genetically engineered yeasts. Endeavour. 1996;20(3):130–132. doi:10.1016/0160-9327(96)10025-9
120. Yuan YG, Zhang S, Hwang JY, et al. Silver nanoparticles potentiates cytotoxicity and apoptotic potential of camptothecin in human cervical cancer cells. Oxid Med Cell Longev. 2018;2018:6121328. doi:10.1155/2018/6121328
121. Akagawa M. Protein carbonylation: molecular mechanisms, biological implications, and analytical approaches. Free Radic Res. 2021;55(4):307–320. doi:10.1080/10715762.2020.1851027
122. Shahid AM, Zinia M, Chandan S, et al. Modulation of protein-graphene oxide interactions with varying degrees of oxidation. Nanoscale Adv. 2020;2(5):1904–1912.
123. Liu Q, Xu X, Zhang L, et al. Assembly of single-stranded polydeoxyadenylic acid and beta-glucan probed by the sensing platform of graphene oxide based on the fluorescence resonance energy transfer and fluorescence anisotropy. Analyst. 2013;138(9):2661–2668. doi:10.1039/c3an36400c
124. Sydlik SA, Jhunjhunwala S, Webber MJ, et al. In vivo compatibility of graphene oxide with differing oxidation states. ACS Nano. 2015;9(4):3866–3874. doi:10.1021/acsnano.5b01290
125. Coccini T, Roda E, Barni S, et al. Long-lasting oxidative pulmonary insult in rat after intratracheal instillation of silica nanoparticles doped with cadmium. Toxicology. 2012;302(2–3):203–211. doi:10.1016/j.tox.2012.07.019
126. Traverso N, Ricciarelli R, Nitti M, et al. Role of glutathione in cancer progression and chemoresistance. Oxid Med Cell Longev. 2013;2013:972913. doi:10.1155/2013/972913
127. Gurunathan S, Jeyaraj M, Kang MH, et al. The effects of apigenin-biosynthesized ultra-small platinum nanoparticles on the human monocytic THP-1 cell line. Cells. 2019;8(5):444. doi:10.3390/cells8050444
128. Ma B, Guo S, Nishina Y, et al. Reaction between graphene oxide and intracellular glutathione affects cell viability and proliferation. ACS Appl Mater Interfaces. 2021;13(3):3528–3535. doi:10.1021/acsami.0c17523
129. Gurunathan S, Kim JH. Biocompatible gold nanoparticles ameliorate retinoic acid-induced cell death and induce differentiation in F9 teratocarcinoma stem cells. Nanomaterials. 2018;8(6):396. doi:10.3390/nano8060396
130. Sengupta R, Holmgren A. The role of thioredoxin in the regulation of cellular processes by S-nitrosylation. Biochim Biophys Acta. 2012;1820(6):689–700. doi:10.1016/j.bbagen.2011.08.012
131. Gurunathan S, Kang MH, Jeyaraj M, et al. Differential immunomodulatory effect of graphene oxide and vanillin-functionalized graphene oxide in human acute monocytic leukemia cell line (THP-1). Int J Mol Sci. 2019;20(2):247. doi:10.3390/ijms20020247
132. Zhang J, Cao HY, Wang JQ, et al. Graphene oxide and reduced graphene oxide exhibit cardiotoxicity through the regulation of lipid peroxidation, oxidative stress, and mitochondrial dysfunction. Front Cell Dev Biol. 2021;9:616888. doi:10.3389/fcell.2021.616888
133. Schieber M, Chandel NS. ROS function in redox signaling and oxidative stress. Curr Biol. 2014;24(10):R453–R462. doi:10.1016/j.cub.2014.03.034
134. Martinez-Rosas JR, Diaz-Torres R, Ramirez-Noguera P, et al. PLGA nanoparticles of a new cinnamic acid derivative inhibits cellular proliferation on breast cancer cell line MCF-7 in a PPARgamma dependent way. Pharmazie. 2020;75(7):324–328. doi:10.1691/ph.2020.0450
135. Ma X, Qu Q, Zhao Y, et al. Graphene oxide wrapped gold nanoparticles for intracellular Raman imaging and drug delivery. J Mater Chem B. 2013;1(47):6495–6500. doi:10.1039/c3tb21385d
136. Arya BD, Mittal S, Joshi P, et al. Graphene oxide-chloroquine nanoconjugate induce necroptotic death in A549 cancer cells through autophagy modulation. Nanomedicine. 2018;13(18):2261–2282. doi:10.2217/nnm-2018-0086
137. Assali A, Akhavan O, Mottaghitalab F, et al. Cationic graphene oxide nanoplatform mediates miR-101 delivery to promote apoptosis by regulating autophagy and stress. Int J Nanomedicine. 2018;13:5865–5886. doi:10.2147/IJN.S162647
138. Xiao H, Yang X, Luo LH, et al. Graphene oxide regulates endoplasmic reticulum stress: autophagic pathways in nasopharyngeal carcinoma cells. Int J Clin Exp Pathol. 2018;11(12):5801–5808.
139. Bhat TA, Chaudhary AK, Kumar S, et al. Endoplasmic reticulum-mediated unfolded protein response and mitochondrial apoptosis in cancer. Biochim Biophys Acta Rev Cancer. 2017;1867(1):58–66. doi:10.1016/j.bbcan.2016.12.002
140. Oakes SA. Endoplasmic reticulum proteostasis: a key checkpoint in cancer. Am J Physiol Cell Physiol. 2017;312(2):C93–C102. doi:10.1152/ajpcell.00266.2016
141. Axten JM. Protein kinase R(PKR)-like endoplasmic reticulum kinase (PERK) inhibitors: a patent review (2010–2015). Expert Opin Ther Pat. 2017;27(1):37–48. doi:10.1080/13543776.2017.1238072
142. Oyadomari S, Mori M. Roles of CHOP/GADD153 in endoplasmic reticulum stress. Cell Death Differ. 2004;11(4):381–389. doi:10.1038/sj.cdd.4401373
143. Nishitoh H. CHOP is a multifunctional transcription factor in the ER stress response. J Biochem. 2012;151(3):217–219. doi:10.1093/jb/mvr143
144. Pandey S, Karakoti M, Chaudhary N, et al. Single step blending of PEDOT:PSS/SPGO nanocomposite via low temperature solid phase addition of graphene oxide for effective hole transport layer in organic solar cells. J Nanosci Nanotechnol. 2020;20(6):3888–3895. doi:10.1166/jnn.2020.17532
145. Khan AA, Allemailem KS, Almatroudi A, et al. Endoplasmic reticulum stress provocation by different nanoparticles: an innovative approach to manage the cancer and other common diseases. Molecules. 2020;25(22). doi:10.3390/molecules25225336
146. Malhotra JD, Kaufman RJ. Endoplasmic reticulum stress and oxidative stress: a vicious cycle or a double-edged sword? Antioxid Redox Signal. 2007;9(12):2277–2293. doi:10.1089/ars.2007.1782
147. Tse G, Yan BP, Chan YW, et al. Reactive oxygen species, endoplasmic reticulum stress and mitochondrial dysfunction: the link with cardiac arrhythmogenesis. Front Physiol. 2016;7:313. doi:10.3389/fphys.2016.00313
148. Saeki K, Kobayashi N, Inazawa Y, et al. Oxidation-triggered c-Jun N-terminal kinase (JNK) and p38 mitogen-activated protein (MAP) kinase pathways for apoptosis in human leukaemic cells stimulated by epigallocatechin-3-gallate (EGCG): a distinct pathway from those of chemically induced and receptor-mediated apoptosis. Biochem J. 2002;368(Pt 3):705–720. doi:10.1042/BJ20020101
149. Barr RK, Bogoyevitch MA. The c-Jun N-terminal protein kinase family of mitogen-activated protein kinases (JNK MAPKs). Int J Biochem Cell Biol. 2001;33(11):1047–1063. doi:10.1016/S1357-2725(01)00093-0
150. Hackenberg S, Scherzed A, Kessler M, et al. Silver nanoparticles: evaluation of DNA damage, toxicity and functional impairment in human mesenchymal stem cells. Toxicol Lett. 2011;201(1):27–33. doi:10.1016/j.toxlet.2010.12.001
151. Chen S, Du J, Liang Y, et al. Sulfur dioxide inhibits excessively activated endoplasmic reticulum stress in rats with myocardial injury. Heart Vessels. 2012;27(5):505–516. doi:10.1007/s00380-011-0192-7
152. Jin Y, Zhang S, Tao R, et al. Oral exposure of mice to cadmium (II), chromium (VI) and their mixture induce oxidative- and endoplasmic reticulum-stress mediated apoptosis in the livers. Environ Toxicol. 2016;31(6):693–705. doi:10.1002/tox.22082
153. Hetz C, Bernasconi P, Fisher J, et al. Proapoptotic BAX and BAK modulate the unfolded protein response by a direct interaction with IRE1alpha. Science. 2006;312(5773):572–576. doi:10.1126/science.1123480
154. Xu Z, Bu Y, Chitnis N, et al. miR-216b regulation of c-Jun mediates GADD153/CHOP-dependent apoptosis. Nat Commun. 2016;7(1):11422. doi:10.1038/ncomms11422
155. Lammel T, Boisseaux P, Fernandez-Cruz ML, et al. Internalization and cytotoxicity of graphene oxide and carboxyl graphene nanoplatelets in the human hepatocellular carcinoma cell line Hep G2. Part Fibre Toxicol. 2013;10(1):27. doi:10.1186/1743-8977-10-27
156. Li Y, Zhou M, Hu Q, et al. Mechanistic insights into caspase-9 activation by the structure of the apoptosome holoenzyme. Proc Natl Acad Sci U S A. 2017;114(7):1542–1547. doi:10.1073/pnas.1620626114
157. Riedl SJ, Shi Y. Molecular mechanisms of caspase regulation during apoptosis. Nat Rev Mol Cell Biol. 2004;5(11):897–907. doi:10.1038/nrm1496
158. Du J, Chen GG, Vlantis AC, et al. Resistance to apoptosis of HPV 16-infected laryngeal cancer cells is associated with decreased Bak and increased Bcl-2 expression. Cancer Lett. 2004;205(1):81–88. doi:10.1016/j.canlet.2003.09.035
159. Porter AG, Janicke RU. Emerging roles of caspase-3 in apoptosis. Cell Death Differ. 1999;6(2):99–104. doi:10.1038/sj.cdd.4400476
160. Ghavami S, Hashemi M, Ande SR, et al. Apoptosis and cancer: mutations within caspase genes. J Med Genet. 2009;46(8):497–510. doi:10.1136/jmg.2009.066944
161. Li CJ, Tsang SF, Tsai CH, et al. Momordica charantia extract induces apoptosis in human cancer cells through caspase- and mitochondria-dependent pathways. Evid Based Complement Alternat Med. 2012;2012:261971. doi:10.1155/2012/261971
162. Zhang Y, Ali SF, Dervishi E, et al. Cytotoxicity effects of graphene and single-wall carbon nanotubes in neural phaeochromocytoma-derived PC12 cells. ACS Nano. 2010;4(6):3181–3186. doi:10.1021/nn1007176
163. Chalfant CE, Rathman K, Pinkerman RL, et al. De novo ceramide regulates the alternative splicing of caspase 9 and Bcl-x in A549 lung adenocarcinoma cells. Dependence on protein phosphatase-1. J Biol Chem. 2002;277(15):12587–12595. doi:10.1074/jbc.M112010200
164. Massiello A, Chalfant CE. SRp30a (ASF/SF2) regulates the alternative splicing of caspase-9 pre-mRNA and is required for ceramide-responsiveness. J Lipid Res. 2006;47(5):892–897. doi:10.1194/jlr.C600003-JLR200
165. Choi YJ, Kim E, Han J, et al. A novel biomolecule-mediated reduction of graphene oxide: a multifunctional anti-cancer agent. Molecules. 2016;21(3):375. doi:10.3390/molecules21030375
166. Wang SB, Ma YY, Chen XY, et al. Ceramide-graphene oxide enhance cytotoxicity and decrease HCC xenograft development: a novel approach for targeted cancer therapy. Front Pharmacol. 2019;10:69. doi:10.3389/fphar.2019.00069
167. Csala M, Kardon T, Legeza B, et al. On the role of 4-hydroxynonenal in health and disease. Biochim Biophys Acta. 2015;1852(5):826–838. doi:10.1016/j.bbadis.2015.01.015
168. Paciorek P, Zuberek M, Grzelak A. Products of lipid peroxidation as a factor in the toxic effect of silver nanoparticles. Materials. 2020;13(11):2460. doi:10.3390/ma13112460
169. Dianzani MU. Lipid peroxidation and cancer. Crit Rev Oncol Hematol. 1993;15(2):125–147. doi:10.1016/1040-8428(93)90052-6
170. Barrera G, Brossa O, Fazio VM, et al. Effects of 4-hydroxynonenal, a product of lipid peroxidation, on cell proliferation and ornithine decarboxylase activity. Free Radic Res Commun. 1991;14(2):81–89. doi:10.3109/10715769109094120
171. Hofer T, Karlsson HL, Moller L. DNA oxidative damage and strand breaks in young healthy individuals: a gender difference and the role of life style factors. Free Radic Res. 2006;40(7):707–714. doi:10.1080/10715760500525807
172. Li YS, Ootsuyama Y, Kawasaki Y, et al. Oxidative DNA damage in the rat lung induced by intratracheal instillation and inhalation of nanoparticles. J Clin Biochem Nutr. 2018;62(3):238–241. doi:10.3164/jcbn.17-70
173. Massoulie J, Perrier N, Noureddine H, et al. Old and new questions about cholinesterases. Chem Biol Interact. 2008;175(1–3):30–44. doi:10.1016/j.cbi.2008.04.039
174. Johnstone RM, Adam M, Hammond JR, et al. Vesicle formation during reticulocyte maturation. Association of plasma membrane activities with released vesicles (exosomes). J Biol Chem. 1987;262(19):9412–9420. doi:10.1016/S0021-9258(18)48095-7
175. Gurunathan S, Kang MH, Kim JH. A comprehensive review on factors influences biogenesis, functions, therapeutic and clinical implications of exosomes. Int J Nanomedicine. 2021;16:1281–1312. doi:10.2147/IJN.S291956
176. Ibrahim F, Andre C, Iutzeler A, et al. Analysis of the activation of acetylcholinesterase by carbon nanoparticles using a monolithic immobilized enzyme microreactor: role of the water molecules in the active site gorge. J Enzyme Inhib Med Chem. 2013;28(5):1010–1014. doi:10.3109/14756366.2012.705835
177. Park SE, Jeong SH, Yee SB, et al. Interactions of acetylcholinesterase with caveolin-1 and subsequently with cytochrome c are required for apoptosome formation. Carcinogenesis. 2008;29(4):729–737. doi:10.1093/carcin/bgn036
178. Park SE, Kim ND, Yoo YH. Acetylcholinesterase plays a pivotal role in apoptosome formation. Cancer Res. 2004;64(8):2652–2655. doi:10.1158/0008-5472.CAN-04-0649
179. Zhang XJ, Greenberg DS. Acetylcholinesterase involvement in apoptosis. Front Mol Neurosci. 2012;5:40. doi:10.3389/fnmol.2012.00040
180. Guo BB, Bellingham SA, Hill AF. The neutral sphingomyelinase pathway regulates packaging of the prion protein into exosomes. J Biol Chem. 2015;290(6):3455–3467. doi:10.1074/jbc.M114.605253
181. Kosaka N, Iguchi H, Hagiwara K, et al. Neutral sphingomyelinase 2 (nSMase2)-dependent exosomal transfer of angiogenic microRNAs regulate cancer cell metastasis. J Biol Chem. 2013;288(15):10849–10859. doi:10.1074/jbc.M112.446831
182. Claus RA, Bunck AC, Bockmeyer CL, et al. Role of increased sphingomyelinase activity in apoptosis and organ failure of patients with severe sepsis. FASEB J. 2005;19(12):1719–1721. doi:10.1096/fj.04-2842fje
183. Alessenko AV, Shupik MA, Bugrova AE, et al. The relation between sphingomyelinase activity, lipid peroxide oxidation and NO-releasing in mice liver and brain. FEBS Lett. 2005;579(25):5571–5576. doi:10.1016/j.febslet.2005.08.085
184. Wisniewski JR, Gaugaz FZ. Fast and sensitive total protein and Peptide assays for proteomic analysis. Anal Chem. 2015;87(8):4110–4116. doi:10.1021/ac504689z
185. Gandham S, Su X, Wood J, et al. Technologies and standardization in research on extracellular vesicles. Trends Biotechnol. 2020;38(10):1066–1098. doi:10.1016/j.tibtech.2020.05.012
186. Sinha S, Hoshino D, Hong NH, et al. Cortactin promotes exosome secretion by controlling branched actin dynamics. J Cell Biol. 2016;214(2):197–213. doi:10.1083/jcb.201601025
187. Parolini I, Federici C, Raggi C, et al. Microenvironmental pH is a key factor for exosome traffic in tumor cells. J Biol Chem. 2009;284(49):34211–34222. doi:10.1074/jbc.M109.041152
188. Lv LH, Wan YL, Lin Y, et al. Anticancer drugs cause release of exosomes with heat shock proteins from human hepatocellular carcinoma cells that elicit effective natural killer cell antitumor responses in vitro. J Biol Chem. 2012;287(19):15874–15885. doi:10.1074/jbc.M112.340588
189. Samuel P, Mulcahy LA, Furlong F, et al. Cisplatin induces the release of extracellular vesicles from ovarian cancer cells that can induce invasiveness and drug resistance in bystander cells. Philos Trans R Soc Lond B Biol Sci. 2018;373(1737):20170065. doi:10.1098/rstb.2017.0065
190. Eguchi A, Yoshitomi T, Lazic M, et al. Redox nanoparticles as a novel treatment approach for inflammation and fibrosis associated with nonalcoholic steatohepatitis. Nanomedicine. 2015;10(17):2697–2708. doi:10.2217/nnm.15.87
191. Sokolova V, Ludwig AK, Hornung S, et al. Characterisation of exosomes derived from human cells by nanoparticle tracking analysis and scanning electron microscopy. Colloids Surf B Biointerfaces. 2011;87(1):146–150. doi:10.1016/j.colsurfb.2011.05.013
192. D’Souza-Schorey C, Clancy JW. Tumor-derived microvesicles: shedding light on novel microenvironment modulators and prospective cancer biomarkers. Genes Dev. 2012;26(12):1287–1299. doi:10.1101/gad.192351.112
193. Harmati M, Tarnai Z, Decsi G, et al. Stressors alter intercellular communication and exosome profile of nasopharyngeal carcinoma cells. J Oral Pathol Med. 2017;46(4):259–266. doi:10.1111/jop.12486
194. Konig L, Kasimir-Bauer S, Bittner AK, et al. Elevated levels of extracellular vesicles are associated with therapy failure and disease progression in breast cancer patients undergoing neoadjuvant chemotherapy. Oncoimmunology. 2017;7(1):e1376153. doi:10.1080/2162402X.2017.1376153
195. Osti D, Del BM, Rappa G, et al. Clinical significance of extracellular vesicles in plasma from glioblastoma patients. Clin Cancer Res. 2019;25(1):266–276. doi:10.1158/1078-0432.CCR-18-1941
196. Keklikoglou I, Cianciaruso C, Guc E, et al. Chemotherapy elicits pro-metastatic extracellular vesicles in breast cancer models. Nat Cell Biol. 2019;21(2):190–202. doi:10.1038/s41556-018-0256-3
197. Kumar D, Gupta D, Shankar S, et al. Biomolecular characterization of exosomes released from cancer stem cells: possible implications for biomarker and treatment of cancer. Oncotarget. 2015;6(5):3280–3291. doi:10.18632/oncotarget.2462
198. Rahal A, Kumar A, Singh V, et al. Oxidative stress, prooxidants, and antioxidants: the interplay. Biomed Res Int. 2014;2014:761264. doi:10.1155/2014/761264
199. Pizzino G, Irrera N, Cucinotta M, et al. Oxidative stress: harms and benefits for human health. Oxid Med Cell Longev. 2017;2017:8416763. doi:10.1155/2017/8416763
200. He L, He T, Farrar S, et al. Antioxidants maintain cellular redox homeostasis by elimination of reactive oxygen species. Cell Physiol Biochem. 2017;44(2):532–553. doi:10.1159/000485089
201. Palacio JR, Markert UR, Martinez P. Anti-inflammatory properties of N-acetylcysteine on lipopolysaccharide-activated macrophages. Inflamm Res. 2011;60(7):695–704. doi:10.1007/s00011-011-0323-8
202. Wang J, Li M, Zhang W, et al. Protective effect of N-acetylcysteine against oxidative stress induced by zearalenone via mitochondrial apoptosis pathway in SIEC02 cells. Toxins. 2018;10(10):407. doi:10.3390/toxins10100407
203. Costa LG, Pellacani C, Dao K, et al. The brominated flame retardant BDE-47 causes oxidative stress and apoptotic cell death in vitro and in vivo in mice. Neurotoxicology. 2015;48:68–76. doi:10.1016/j.neuro.2015.03.008
204. Myrzakhanova M, Gambardella C, Falugi C, et al. Effects of nanosilver exposure on cholinesterase activities, CD41, and CDF/LIF-like expression in zebrafish (Danio rerio) larvae. Biomed Res Int. 2013;2013:205183. doi:10.1155/2013/205183
205. Yoshimura S, Banno Y, Nakashima S, et al. Inhibition of neutral sphingomyelinase activation and ceramide formation by glutathione in hypoxic PC12 cell death. J Neurochem. 1999;73(2):675–683. doi:10.1046/j.1471-4159.1999.0730675.x
206. Luberto C, Hassler DF, Signorelli P, et al. Inhibition of tumor necrosis factor-induced cell death in MCF7 by a novel inhibitor of neutral sphingomyelinase. J Biol Chem. 2002;277(43):41128–41139. doi:10.1074/jbc.M206747200
207. Back MJ, Ha HC, Fu Z, et al. Activation of neutral sphingomyelinase 2 by starvation induces cell-protective autophagy via an increase in Golgi-localized ceramide. Cell Death Dis. 2018;9(6):670. doi:10.1038/s41419-018-0709-4
208. Wu Z, He D, Li H. Bioglass enhances the production of exosomes and improves their capability of promoting vascularization. Bioact Mater. 2021;6(3):823–835. doi:10.1016/j.bioactmat.2020.09.011
209. Middleton RC, Rogers RG, De Couto G, et al. Newt cells secrete extracellular vesicles with therapeutic bioactivity in mammalian cardiomyocytes. J Extracell Vesicles. 2018;7(1):1456888. doi:10.1080/20013078.2018.1456888
210. Kulshreshtha A, Singh S, Ahmad M, et al. Simvastatin mediates inhibition of exosome synthesis, localization and secretion via multicomponent interventions. Sci Rep. 2019;9(1):16373. doi:10.1038/s41598-019-52765-7
211. Gurunathan S, Jeyaraj M, Kang MH, et al. Mitochondrial peptide humanin protects silver nanoparticles-induced neurotoxicity in human neuroblastoma cancer cells (SH-SY5Y). Int J Mol Sci. 2019;20(18):4439. doi:10.3390/ijms20184439
212. Chow A, Zhou W, Liu L, et al. Macrophage immunomodulation by breast cancer-derived exosomes requires Toll-like receptor 2-mediated activation of NF-kappaB. Sci Rep. 2014;4:5750. doi:10.1038/srep05750
213. Bretz NP, Ridinger J, Rupp AK, et al. Body fluid exosomes promote secretion of inflammatory cytokines in monocytic cells via Toll-like receptor signaling. J Biol Chem. 2013;288(51):36691–36702. doi:10.1074/jbc.M113.512806
214. Valenti R, Huber V, Filipazzi P, et al. Human tumor-released microvesicles promote the differentiation of myeloid cells with transforming growth factor-beta-mediated suppressive activity on T lymphocytes. Cancer Res. 2006;66(18):9290–9298. doi:10.1158/0008-5472.CAN-06-1819
215. McDonald MK, Tian Y, Qureshi RA, et al. Functional significance of macrophage-derived exosomes in inflammation and pain. Pain. 2014;155(8):1527–1539. doi:10.1016/j.pain.2014.04.029
216. Isobe A, Sawada K, Kinose Y, et al. Interleukin 6 receptor is an independent prognostic factor and a potential therapeutic target of ovarian cancer. PLoS One. 2015;10(2):e118080. doi:10.1371/journal.pone.0118080
217. Wang XS, Williams LA, Krishnan S, et al. Serum sTNF-R1, IL-6, and the development of fatigue in patients with gastrointestinal cancer undergoing chemoradiation therapy. Brain Behav Immun. 2012;26(5):699–705. doi:10.1016/j.bbi.2011.12.007
218. Qu Y, Zhao G, Li H. Forward and reverse signaling mediated by transmembrane tumor necrosis factor-alpha and TNF receptor 2: potential roles in an immunosuppressive tumor microenvironment. Front Immunol. 2017;8:1675. doi:10.3389/fimmu.2017.01675
219. Atay S, Gercel-Taylor C, Taylor DD. Human trophoblast-derived exosomal fibronectin induces pro-inflammatory IL-1beta production by macrophages. Am J Reprod Immunol. 2011;66(4):259–269. doi:10.1111/j.1600-0897.2011.00995.x
220. Shen H, Shih J, Hollern DP, et al. Integrated molecular characterization of testicular germ cell tumors. Cell Rep. 2018;23(11):3392–3406. doi:10.1016/j.celrep.2018.05.039
221. Khan S, Jutzy JMS, Aspe JR, et al. Survivin is released from cancer cells via exosomes. Apoptosis. 2011;16(1):1–12. doi:10.1007/s10495-010-0534-4
222. Kosgodage US, Trindade RP, Thompson PR, et al. Chloramidine/bisindolylmaleimide-I-mediated inhibition of exosome and microvesicle release and enhanced efficacy of cancer chemotherapy. Int J Mol Sci. 2017;18(5):1007. doi:10.3390/ijms18051007
223. Datta A, Kim H, Lal M, et al. Manumycin A suppresses exosome biogenesis and secretion via targeted inhibition of Ras/Raf/ERK1/2 signaling and hnRNP H1 in castration-resistant prostate cancer cells. Cancer Lett. 2017;408:73–81. doi:10.1016/j.canlet.2017.08.020
224. Hoebeke J, Van Nijen G, De Brabander M. Interaction of oncodazole (R 17934), a new antitumoral drug, with rat brain tubulin. Biochem Biophys Res Commun. 1976;69(2):319–324. doi:10.1016/0006-291X(76)90524-6
225. Subtil A, Delepierre M, Dautry-Varsat A. An alpha-helical signal in the cytosolic domain of the interleukin 2 receptor beta chain mediates sorting towards degradation after endocytosis. J Cell Biol. 1997;136(3):583–595. doi:10.1083/jcb.136.3.583
226. Macia E, Ehrlich M, Massol R, et al. Dynasore, a cell-permeable inhibitor of dynamin. Dev Cell. 2006;10(6):839–850. doi:10.1016/j.devcel.2006.04.002
227. Kirchhausen T, Macia E, Pelish HE. Use of dynasore, the small molecule inhibitor of dynamin, in the regulation of endocytosis. Methods Enzymol. 2008;438:77–93.
 © 2022 The Author(s). This work is published and licensed by Dove Medical Press Limited. The full terms of this license are available at https://www.dovepress.com/terms.php and incorporate the Creative Commons Attribution - Non Commercial (unported, v3.0) License.
By accessing the work you hereby accept the Terms. Non-commercial uses of the work are permitted without any further permission from Dove Medical Press Limited, provided the work is properly attributed. For permission for commercial use of this work, please see paragraphs 4.2 and 5 of our Terms.
© 2022 The Author(s). This work is published and licensed by Dove Medical Press Limited. The full terms of this license are available at https://www.dovepress.com/terms.php and incorporate the Creative Commons Attribution - Non Commercial (unported, v3.0) License.
By accessing the work you hereby accept the Terms. Non-commercial uses of the work are permitted without any further permission from Dove Medical Press Limited, provided the work is properly attributed. For permission for commercial use of this work, please see paragraphs 4.2 and 5 of our Terms.