")
Back to Journals » International Journal of Nanomedicine » Volume 11
Gold nanoparticles enhance the effect of tyrosine kinase inhibitors in acute myeloid leukemia therapy
Authors Petrushev B, Boca S, Simon T, Berce C, Frinc I, Dima D, Selicean S, Gafencu GA, Tanase A, Zdrenghea M , Florea A, Suarasan S, Dima L, Stanciu R, Jurj A, Buzoianu A , Cucuianu A, Astilean S, Irimie A, Tomuleasa C, Sarpataki O
Received 9 August 2015
Accepted for publication 5 November 2015
Published 15 February 2016 Volume 2016:11 Pages 641—660
DOI https://doi.org/10.2147/IJN.S94064
Checked for plagiarism Yes
Review by Single anonymous peer review
Peer reviewer comments 4
Editor who approved publication: Dr Thomas Webster
Bobe Petrushev,1,* Sanda Boca,2,* Timea Simon,2 Cristian Berce,3 Ioana Frinc,4 Delia Dima,4 Sonia Selicean,3 Grigore-Aristide Gafencu,3 Alina Tanase,5 Mihnea Zdrenghea,4,6 Adrian Florea,7 Sorina Suarasan,2 Liana Dima,8 Raluca Stanciu,3 Ancuta Jurj,1 Anca Buzoianu,9 Andrei Cucuianu,4,6,† Simion Astilean,2,10 Alexandru Irimie,11,12 Ciprian Tomuleasa,1,4 Ioana Berindan-Neagoe1,13
1Research Center for Functional Genomics and Translational Medicine, Iuliu Hatieganu University of Medicine and Pharmacy, 2Nanobiophotonics and Laser Microscopy Center, Babes Bolyai University, 3Department of Medicine, Iuliu Hatieganu University of Medicine and Pharmacy, 4Department of Hematology, Ion Chiricuta Oncology Institute, Cluj-Napoca, 5Department of Stem Cell Transplantation, Fundeni Clinical Institute, Bucharest, 6Department of Hematology, 7Department of Cell and Molecular Biology, 8School of Dentistry, 9Department of Pharmacology, Iuliu Hatieganu University of Medicine and Pharmacy, 10Faculty of Physics, Babes Bolyai University, 11Department of Surgery, Ion Chiricuta Oncology Institute, 12Department of Surgery, Iuliu Hatieganu University of Medicine and Pharmacy, Cluj-Napoca, Romania; 13Department of Experimental Therapeutics, The University of Texas MD Anderson Cancer Center, Houston, TX, USA
*These authors contributed equally to this work
†This author passed away in February 2015
Background and aims: Every year, in Europe, acute myeloid leukemia (AML) is diagnosed in thousands of adults. For most subtypes of AML, the backbone of treatment was introduced nearly 40 years ago as a combination of cytosine arabinoside with an anthracycline. This therapy is still the worldwide standard of care. Two-thirds of patients achieve complete remission, although most of them ultimately relapse. Since the FLT3 mutation is the most frequent, it serves as a key molecular target for tyrosine kinase inhibitors (TKIs) that inhibit FLT3 kinase. In this study, we report the conjugation of TKIs onto spherical gold nanoparticles.
Materials and methods: The internalization of TKI-nanocarriers was proved by the strongly scattered light from gold nanoparticles and was correlated with the results obtained by transmission electron microscopy and dark-field microscopy. The therapeutic effect of the newly designed drugs was investigated by several methods including cell counting assay as well as the MTT assay.
Results: We report the newly described bioconjugates to be superior when compared with the drug alone, with data confirmed by state-of-the-art analyses of internalization, cell biology, gene analysis for FLT3-IDT gene, and Western blotting to assess degradation of the FLT3 protein.
Conclusion: The effective transmembrane delivery and increased efficacy validate its use as a potential therapeutic.
Keywords: tyrosine kinase inhibitors, gold nanoparticles, acute myeloid leukemia
Introduction
Every year, in Europe, acute myeloid leukemia (AML) is diagnosed in thousands of adults.1,2 For most subtypes of AML, the backbone of treatment was introduced nearly 40 years ago as a combination of cytosine arabinoside (ara-C) with an anthracycline. This therapy is still the worldwide standard of care. Two-thirds of patients achieve complete remission, although most of them ultimately relapse. Thus, the 5-year overall survival is only 45%. Almost half of the patients who have good performance status reach complete remission, although cure is reported in approximately 10% of cases, with a median survival of just 1 year.3–6 Clinical management in older AML patients did not change in the last 3 decades, and is even worse for those with unfavorable cytogenetics and poor performance status. Various genetic alterations linked to the development and progression of AML have been identified, most of which are possible targets for a more suitable approach in AML chemotherapy.7,8 The most frequent alteration is the FLT3 mutation, which induces the activation of FLT3 kinase. Since this is the most frequent mutation, it serves as a key molecular target for tyrosine kinase inhibitors (TKIs) that inhibit FLT3 kinase, such as sorafenib, lestaurtinib, midostaurin, or quizartinib.
Various FLT3 inhibitors were approved for clinical use, although primary or secondary resistance to TKI-based chemotherapy was also described.9,10 Primary resistance refers to failure to target mutations such as FLT3-ITD and FLT3-KDM and to lower the efficacy against leukemia stem-like cells. Secondary resistance refers to gaining resistant mutations and overexpression of the FLT3 protein. In a Phase II clinical trial for lestaurtinib in AML, the plasma concentration of FLT3 was increased during lestaurtinib treatment, and the high FLT3 concentration reduced the clinical efficacy. This observation was also reported for quizartinib.11 As several mutated residues structurally exist around the ATP-binding pocket and as the F691L mutation corresponds to the gatekeeper mutation (T315I) of the BCR-ABL gene, binding of quizartinib to a mutant FLT3 is blocked.12,13 The first-generation FLT3 inhibitors are diffuse, multikinase inhibitors that have both unimpressive clinical results as well as noticeable adverse effects. Quizartinib, the latest FLT3 inhibitor, was proven to have the best clinical efficacy among clinically developed FLT3 inhibitors. Still, it easily induces a resistant mutation that may cause patients to relapse and eventually die of the disease.14–16
The development of nanoderived pharmaceutics has grown rapidly during the last few years, and this is mostly due to the unique physical–chemical properties of nanoscaled materials used for their fabrication. For example, the strong absorption and scattering of light in the visible region by gold nanoparticles (GNPs) offer to such nanopharmaceutics the possibility of being detected in situ by noninvasive, microspectroscopic technologies such as dark-field microscopy or surface-enhanced Raman scattering (SERS) spectroscopy.17,18 The tailorable surface chemistry of nanoparticles and high surface-to-volume ratio represents an advantage in the design of such drug nanocarriers, which are capable of delivering a high amount of the drug at a specific targeted tumor and allowing it to cross cell and tissue barriers, thereby also altering the pharmacokinetics and pharmacodynamics of the therapeutic agent.19 Moreover, the therapeutic agent can be forced to be released from the conjugate due to the photophysical properties of the particles (eg, release by heating of the particles under laser irradiation at the appropriate frequency).20 As regard the nanoparticle material, the gold core is considered to be generally nontoxic. An attractive approach for such a hybrid therapy would be to utilize antibody-based cancer drugs such as Fms-like tyrosine kinase 3 (FLT3), which can function for both specific targeting and necrosis promotion through the patients’ own complement-dependent cytotoxicity system.21 Based on the current knowledge in the field and also on our obtained results, this paper presents a new approach in leukemia chemotherapy by the usage of gold nanoparticle as drug carriers for the enhancement of the effects of TKI on AML in vitro, on two different AML cell lines.
Materials and methods
Materials
Hydrogen tetrachloroaurate(III) hydrate (HAuCl4:3H2O, 99.99%), trisodium citrate (C6H5Na3O7), gelatin (Type A) from porcine skin, Pluronic F127 (powder, BioReagent, suitable for cell culture), and lestaurtinib hydrate (CEP-701, >98%) were purchased from Sigma-Aldrich, St Louis, MO, USA. Quizartinib (AC220, >99%) was obtained from Seleckchem and sorafenib (>99%) from Santa Cruz Biotechnology, Dallas, TX, USA.
Design of GNP-TKI
Citrate-capped spherical GNPs were synthesized as a result of the aqueous reduction of HAuCl4 with trisodium citrate, according to the Turkevich–Frens protocol, as previously described.22,23 Briefly, 100 mL of 1 mM HAuCl4:3H2O was boiled and a solution of 38.8 mM sodium citrate (10 mL) was quickly added with vigorous stirring. During boiling the solution had changed in color from yellow to an intense burgundy red. Then, the solution was removed from heat, whereas the stirring process continued for another 15 minutes.
GNP-FLT3 inhibitor nanoconjugates were prepared through two different conjugation strategies using two polymers, Pluronic and gelatin, which have the role of mediating the binding of the drug molecules onto the nanoparticle surface and providing stability in biological media. The goal was to find the optimal nanoplatform with maximum loading capacity and stability in biological medium. Specifically, pluronic-coated gold nanoparticles (GNP-Pluronic) were used as a nanoplatform for the loading of sorafenib, whereas gelatin-coated gold nanoparticles (GNP-gelatin) were used for the loading of lestaurtinib and quizartinib.
Characterization of the newly formed nanostructures
The optical response of the prepared nanoparticles was characterized by means of UV–Vis absorption spectroscopy. Absorption spectra were recorded using a Jasco V-670 UV–Vis–NIR spectrometer (Jasco, Easton, MD, USA) with a slit width of 2 and 1 nm spectral resolution. Particle size distribution and zeta potential were measured using a Zetasizer NanoZS90 instrument (Malvern Instruments, Malvern, UK). Analysis was performed at a scattering angle of 90° at 25°C (Figure S1).
Cell culture protocols
All cells were grown in a humidified atmosphere at 37°C with air, 95%; carbon dioxide (CO2), 5%. Cell passage and culture was carried out as previously described.24,25 Cell cultures were maintained in RPMI 1640 (Sigma-Aldrich), supplemented with 10% fetal bovine serum (FBS), 50 U/mL penicillin, and 50 μg/mL streptomycin (Invitrogen, Carlsbad, CA, USA). OCI-AML3 cell line was kindly gifted by Professor George Calin, MD, PhD (Department of Experimental Therapeutics, The University of Texas MD Anderson Cancer Center, Houston, TX, USA). These cells of hyperdiploid karyotype were isolated by the DSMZ-German Collection of Microorganisms and Cell Cultures (Braunschweig, Germany) from the peripheral blood of an AML (AML FAB M4) patient.26 The THP1 cell line was purchased by our university from the ATCC (American Type Culture Collection, Manassas, VA, USA), and this cell line was isolated from a 1-year-old Japanese AML patient.27 Permission for the use of cell lines was obtained from the Ethical Review Board of the Iuliu Hatieganu University of Medicine and Pharmacy in Cluj-Napoca, in accordance with all ethical and legal laws of Romania and of the European Union.
Dark-field microscopy
Dark-field figures of OCI-AML3 and THP1 cells incubated with GNP-TKI were acquired in Ibidi 30 μ-Dish (50 mm, ibidi GmbH, Planegg, Germany) using an inverted Zeiss Axio Observer Z1 microscope (Zeiss, Jena, Germany). A 100 W halogen lamp was used for illumination, which was focused on the sample using a high numerical immersion condenser (NA =1.4) and the scattered light was collected by an LD Plan-Neofluar 20× objective (NA =0.4, Zeiss).
Transmission electron microscopy
Characterization was also done according to our previously described protocol,28 using transmission electron microscopy (TEM). Slides were prepared for TEM according to the usual protocols.29 Prefixation was done for 2 hours in 2.7% glutaraldehyde (in 0.1 M phosphate buffer, pH 7.4), postfixation for 1.5 hours in 2% osmium tetroxide (in 0.15 M phosphate buffer, pH 7.4), dehydration with five solutions of acetone of increasing concentrations (between 50% and 100%, 15 minutes each), infiltration with solutions of Epon 812 (Shell Chemical Co., San Francisco, CA, USA) in acetone (1:2, 1:1, 2:1, 1 hour each, and in pure Epon overnight), and embedding in Epon 812 (72 hours at 600°C). The ultrathin sections of 70–80 nm thickness were obtained using an LKB 8800 Ultrotome® III ultramicrotome (LKB, Bromma, Sweden), using a DiATOME diamond knife (Diatome Ltd, Bienne, Switzerland), and then stained with uranyl acetate and lead citrate. Sections were examined in a JEOL JEM-100CX II transmission electron microscope (Jeol Ltd, Tokyo, Japan) at 100 kV acceleration voltage and magnification between ×3,600 and ×19,000. The most representative figures were photographed on 4489 Kodak electron microscope films (Carestream Health Inc., New York, NY, USA), and the films were scanned in an Imacon Flexitight X5 film scanner (Hasselblad Imacon, Copenhagen, Sweden), using the computer software Imacon FlexColor X5 (Hasselblad Imacon). For the in vitro internalization of the exosomes, we used the HCT-116 cell line (ATCC). Briefly, the exosome pellet was mixed with the cells in culture and then slides were observed in order to prove the internalization of the multivesicular bodies.
Cell counting
Approximately 1.5×10³ cells were plated in 24-well plates (day 0), treated with the various drug combinations after 24 hours and counted at days 1, 2, 4, 7, 10, and 14 by using both a hemocytometer and a Leica S80 inverted phase microscope (Leica Microsystems, Wetzlar, Germany), as well as the Countess Automated Cell Counter (Invitrogen).
MTT assay
Cell survival was assessed using the 3-(4,5-dimethylthiazol-2-yl)-2,5-diphenyltetrazolium bromide (MTT) assay, as previously described.30–35 Cells in monolayer culture were cultivated at subconfluence before being washed twice with phosphate-buffered saline (PBS). Cells were then resuspended in culture medium with FBS, counted, and plated in 100 μL media at 15×103 cells/well in 96-well microliter plates. After 24 hours, the cells were washed and treated with cytostatic drugs. The concentrations of TKI that were used in conjugation with GNPs was established after extensive pilot projects (data not shown in this paper) were completed and the best concentrations of drugs that should be used estimated. TKI-conjugated GNPs were compared with the corresponding conventional drug at identical concentrations. Absorbance of MTT was measured at 492 nm using a BioTek Synergy (BioTek, Winooski, VT, USA).
Statistical analysis
The statistical analysis was performed using R (R Development Core Team, College Station, TX, USA) and GraphPad Prism 5.0 (GraphPad Software Inc., San Diego, CA, USA). The obtained data was first examined for normality of distribution using the Shapiro–Wilk test. The distribution of all the obtained data was Gaussian, and these were thus analyzed using a parametric test (two-way ANOVA with Tukey posttest). The differences were considered significant when P<0.05.
Apoptosis assay by flow cytometry
Approximately 5×10⁵ leukemia cells treated with either GNP-TKI, TKI alone, GNP alone, or untreated with any drugs were cultured in a 96-well plate. Cells were double stained with propidium iodide (PI) and Annexin V (Vybrant Apoptosis Assay Kit, Invitrogen). Early apoptosis was evaluated after 4 hours, whereas late apoptosis was evaluated after 12 hours. Fluorescence intensity was measured using a flow cytometer (BD FACS Canto II, BD Biosciences, San Jose, CA, USA) to assess apoptotic or necrotic cells, defined as those staining only with Annexin V.
Autophagy assay
Approximately 5×10⁵ leukemia cells treated with either GNP-TKI, TKI alone, GNP alone, or not treated with any drugs were cultured in a 96-well plate. After 24 hours, cellular autophagy was evaluated using an autophagy assay kit (Sigma-Aldrich). Autophagy was measured using a proprietary fluorescent autophagosome marker (λex =333/λem =518 nm). Reading was carried out using a BioTek Synergy H1 microplate spectrophotometer (BioTek).
DNA and RNA extraction
Total RNA was isolated using TRIzol reagent (Invitrogen), as previously described.36–38
Quantitative RT-PCR for mRNA expression
Quantitative RT-PCR (qRT-PCR) was performed to confirm the expression of the Fms-like tyrosine kinase 3 (FLT-3) protooncogene expression, using TaqMan PCR technology.39,40 The forward primer used for FLT3 was 5′-CAATTTAGGTATGAAAGCC-3′ and reverse primer was 5′-CAAACTCTAATTTTTCT-3′. Cycle passing threshold (Ct) was recorded and normalized to human GAPDH (hGAPDH) expression. Relative expression was calculated as 2Ct_FLT3–Ct_GAPDH. As internal controls, we used hGAPDH forward, 5′-GTGGTCTCCCTGACTTTCAACAGC-3′, and hGAPDH reverse, 5′-ATGAGGTCCACCACCTGCTTGCTG-3′ (149-bp amplicon). Statistical significance was assessed by one-way ANOVA.
Western blotting
Cells were lysed in Laemmli sample buffer (Bio-Rad, Hercules, CA, USA) supplemented with a protease inhibitor complete EDTA-free (Roche, Basel, Switzerland). Cell lysates (50 μg) were electrophoresed on 10%–20% polyacrylamide gels (Bio-Rad) and transferred to Immobilon-PSQ membranes (Millipore, Bedford, MA, USA). The membranes were blocked with PBS containing 5% skim milk and 0.1% Tween-20 (Sigma-Aldrich), and afterward incubated with the primary antibody. Antibody to FLT3 was purchased from Abcam (Cambridge, UK). The membranes were incubated after washing with horseradish peroxidase (HRP)-conjugated goat anti-rabbit IgG (Calbiochem, Gibbstown, NJ, USA) and analyzed using enhanced chemiluminescence-plus reagent (GE Healthcare, Buckinghamshire, UK). Densitometry was performed on the Western blot figures by using the J-Figure software (http://rsbweb.nih.gov/ij/).
Results
Dynamic light scattering (DLS) and zeta-potential measurements provide information about the hydrodynamic diameter of the nanoparticles and their surface charge, respectively. The methods are ideal to assess the loading of the drugs onto colloidal nanoparticle surface. To ascertain the formation of FLT3 drug-GNP conjugates, we performed DLS and zeta-potential measurements of the nanoparticles before and after conjugation with drugs. It is worth mentioning that the diameters measured by DLS give fairly higher values as measured by TEM, since it includes also the surface coating of nanoparticles. For instance, bare GNPs have a physical diameter of ~12 nm as measured by TEM, while a hydrodynamic diameter of 17 nm is observed on DLS. After encapsulation in either Pluronic or gelatin, the hydrodynamic diameter of GNPs increased to several tens of nanometers. Consequently, compared to the drug-free nanoparticles, the drug nanoconjugates have significantly higher hydrodynamic diameters, which is consistent with the amount of the loaded drugs (Table 1). The surface charge of the nanoparticles also modifies after the interaction with the FLT3 inhibitors (Table 1).
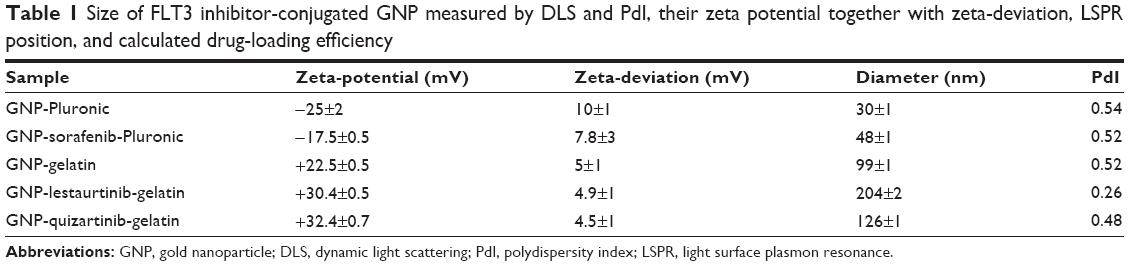 | Table 1 Size of FLT3 inhibitor-conjugated GNP measured by DLS and PdI, their zeta potential together with zeta-deviation, LSPR position, and calculated drug-loading efficiency |
Once the nanoparticles have been successfully conjugated with the TKI, the next step in our study was to assess the internalization of the newly described bioconjugate into the AML cell. Internalization was investigated using two different microscopy techniques: dark-field microscopy and TEM. Figure 1 shows representative dark-field microscopy figures for AML control cells and cells treated with the bioconjugates GNP-TKI. In the left quadrants, we have the figures for OCI-AML3 cell line and in the right one for THP1 cell line. The colored bright spots inside cells arise from the characteristic scattering of GNPs, which clearly demonstrate that the leukemia myeloid cells have successfully internalized the GNP-TKI bioconjugates. Our study confirmed each statement using two different assays. Thus, the internalization of the GNP-TKI bioconjugate is also confirmed using TEM. Figure 2A shows GNP-sorafenib particles inside leukemia cells. In the left quadrants, we have the OCI-AML 3 cell line, whereas in the right quadrant we have THP1 cells. In the upper figures, we have lower magnifications, showing the entire cell. In the lower figures, we show in detail the GNP-sorafenib bioconjugate. Using the same pattern, we prove that both GNP-lestaurtinib (Figure 2B) and GNP-quizartinib (Figure 2C) are internalized. The GNP-TKI nanostructures are internalized both in their current form, as well as using intracellular vesicles. Figure 2C clearly shows such a vesicle, carrying the newly formed GNP-TKI nanostructures inside the cell. The nanostructures have both round and triangular shapes, as shown in Figure 2D, even though most of them are round, forming clusters (Figure 2E).
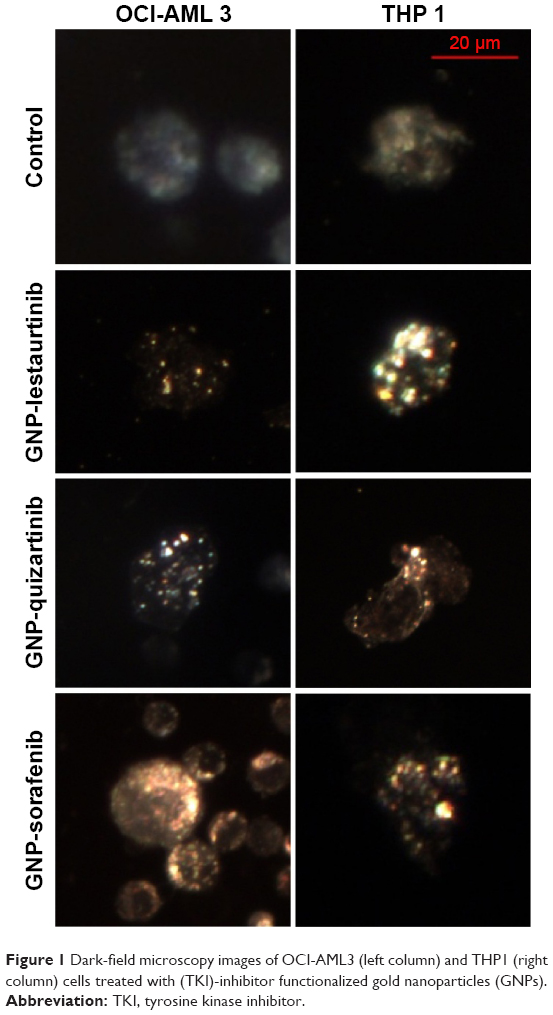 | Figure 1 Dark-field microscopy images of OCI-AML3 (left column) and THP1 (right column) cells treated with (TKI)-inhibitor functionalized gold nanoparticles (GNPs). |
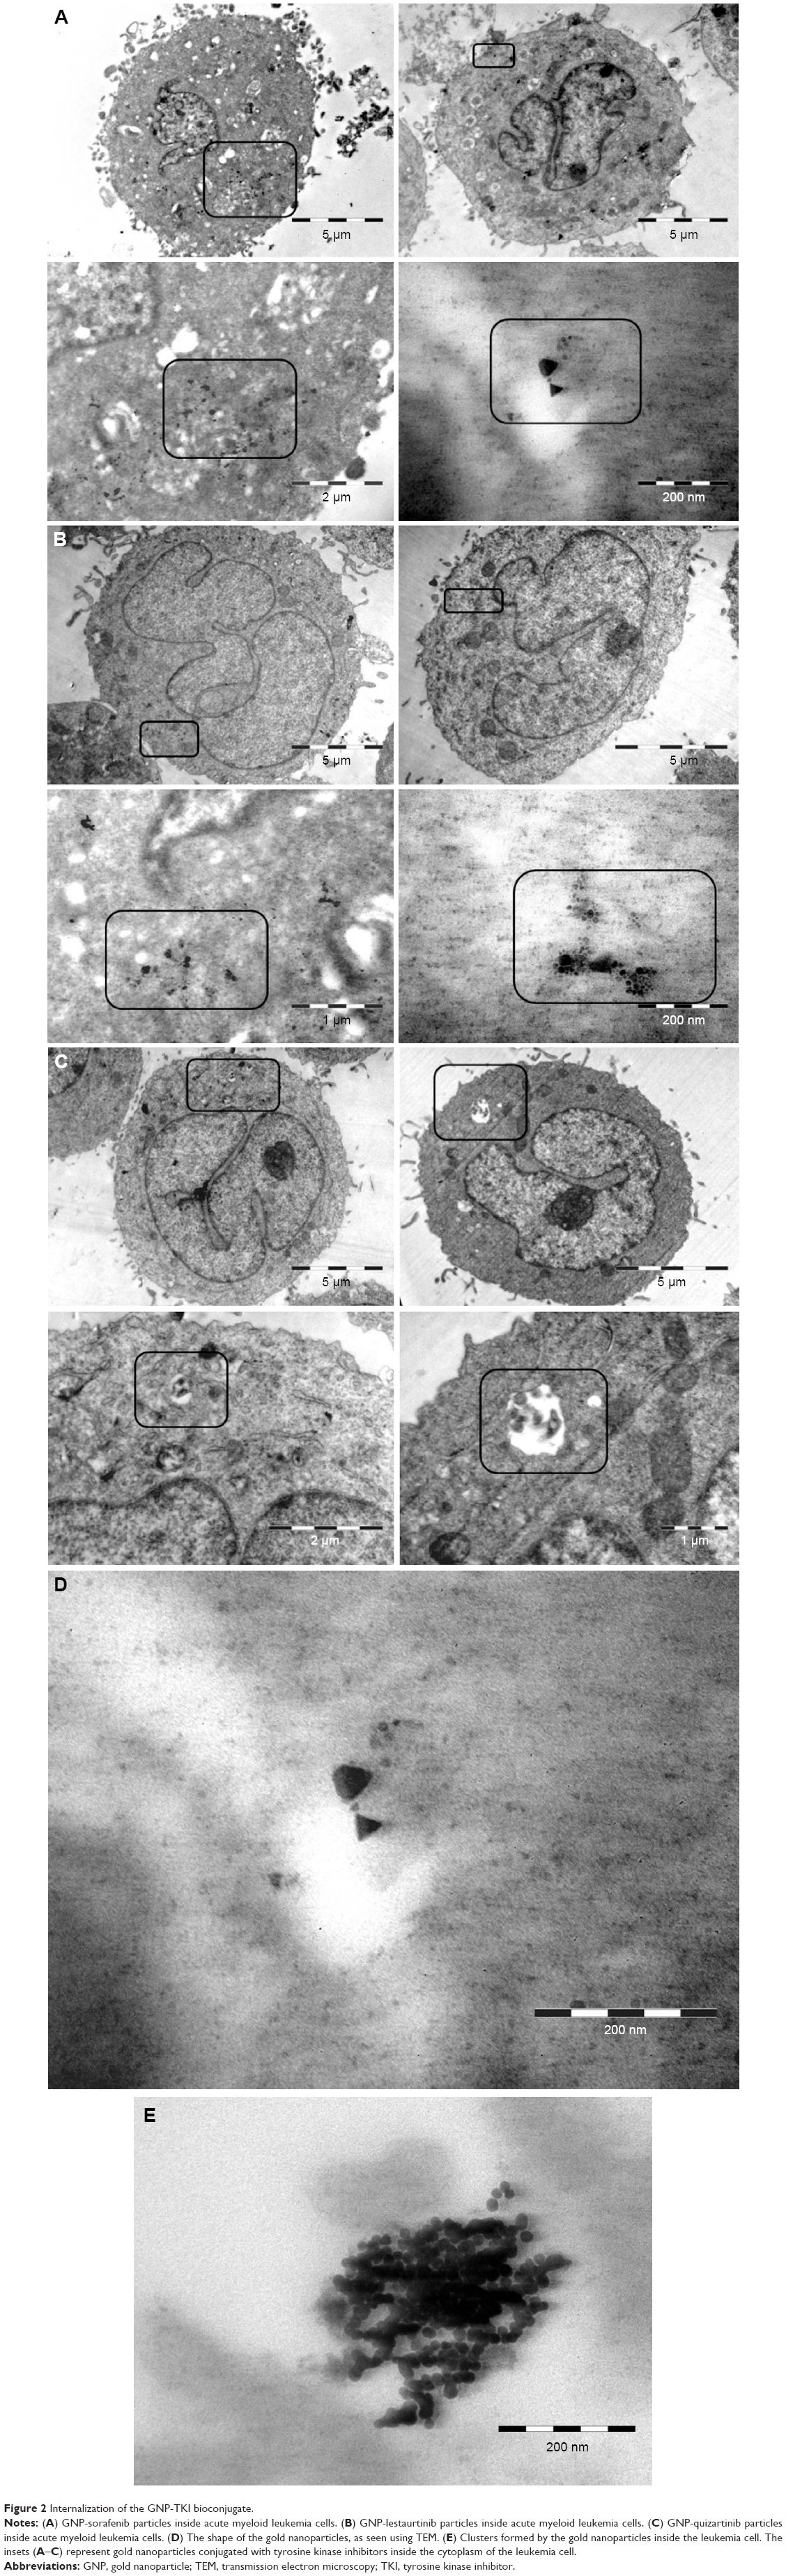 | Figure 2 Internalization of the GNP-TKI bioconjugate. |
After having proven that the newly synthesized nanoconjugates have entered the leukemia cell, the next step was to assess their effects in vitro. Thus, we have investigated their effect using both cell counting assay and the MTT assay. Figure 3A and B shows the MTT data for GNP-lestaurtinib, both for OCI-AML 3 cells (Figure 3A) and THP1 cells (Figure 3B). Figure 3C and D shows the MTT data for GNP-quizartinib, both for OCI-AML 3 (Figure 3C) and THP1 cells (Figure 3D). Figure 3E and F shows the MTT data for GNP-sorafenib, both for OCI-AML3 (Figure 3E) and THP1 cells (Figure 3F). Table 2 shows the MTT data for GNP-lestaurtinib, both for OCI-AML 3 and THP1 cells, the MTT data for GNP-quizartinib, both for OCI-AML 3 and THP1 cells, and the MTT data for GNP-sorafenib, both for OCI-AML 3 cells and THP1 cells. As shown in Table 2, the MTT data is highly statistically significant, with P<0.0001.
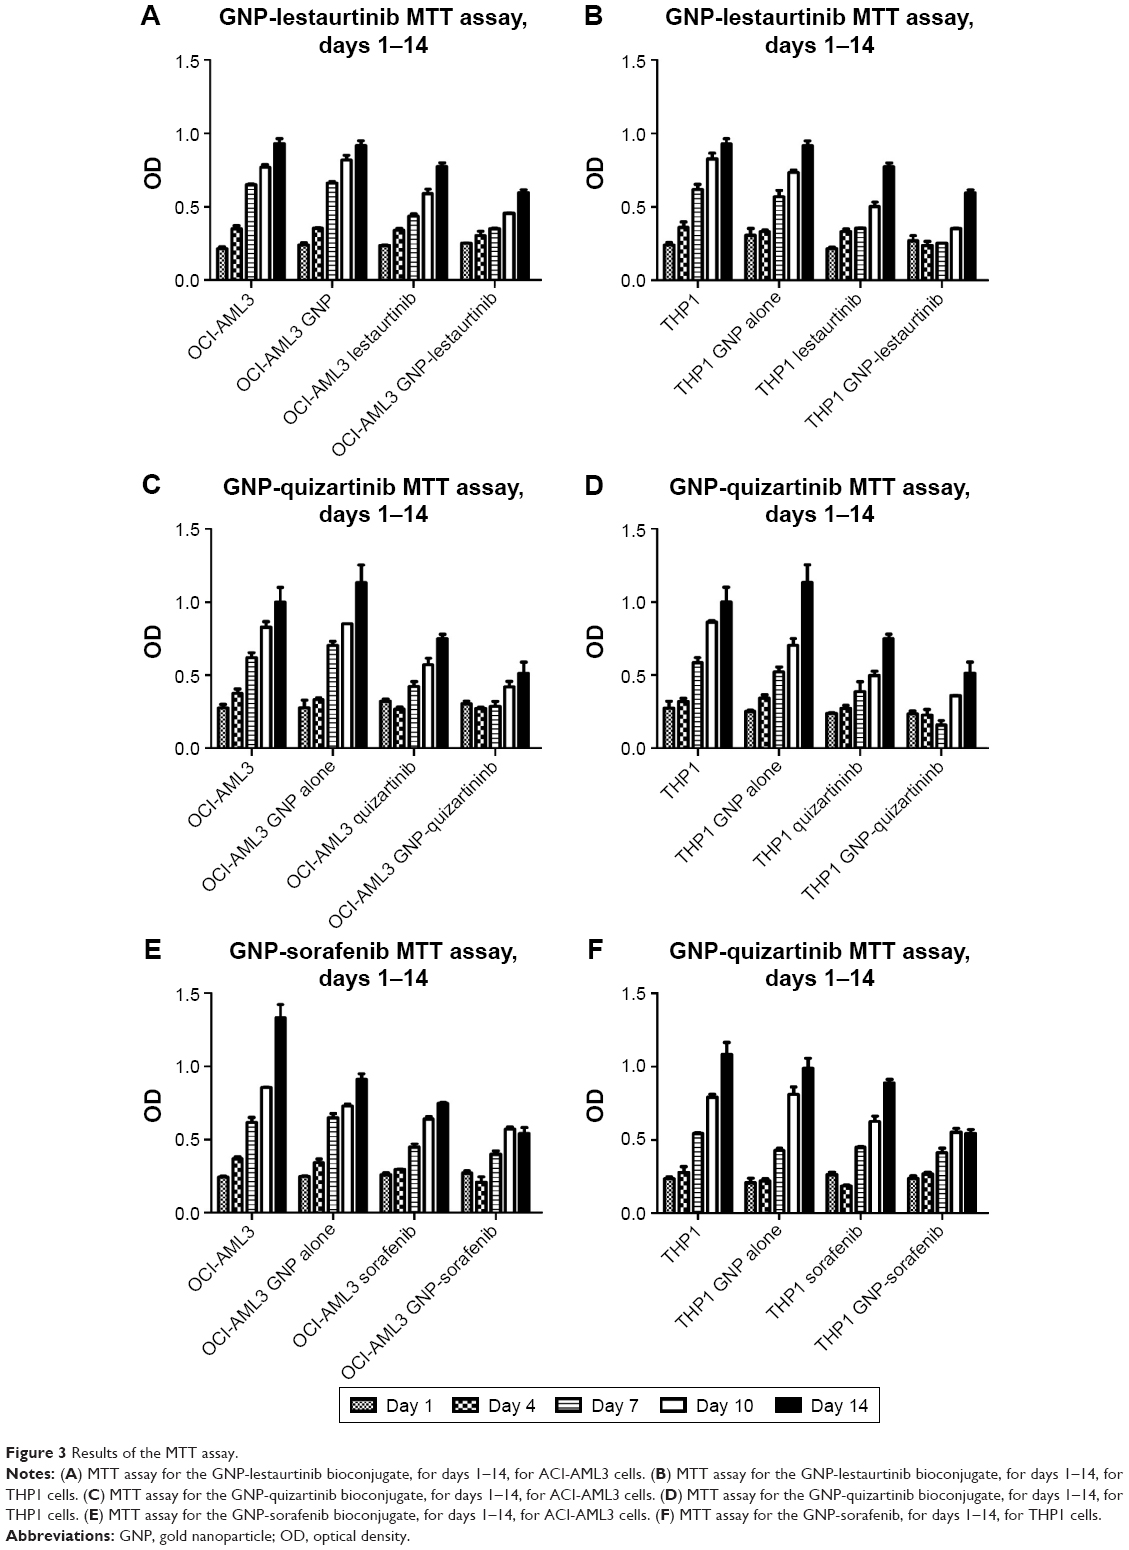 | Figure 3 Results of the MTT assay. |
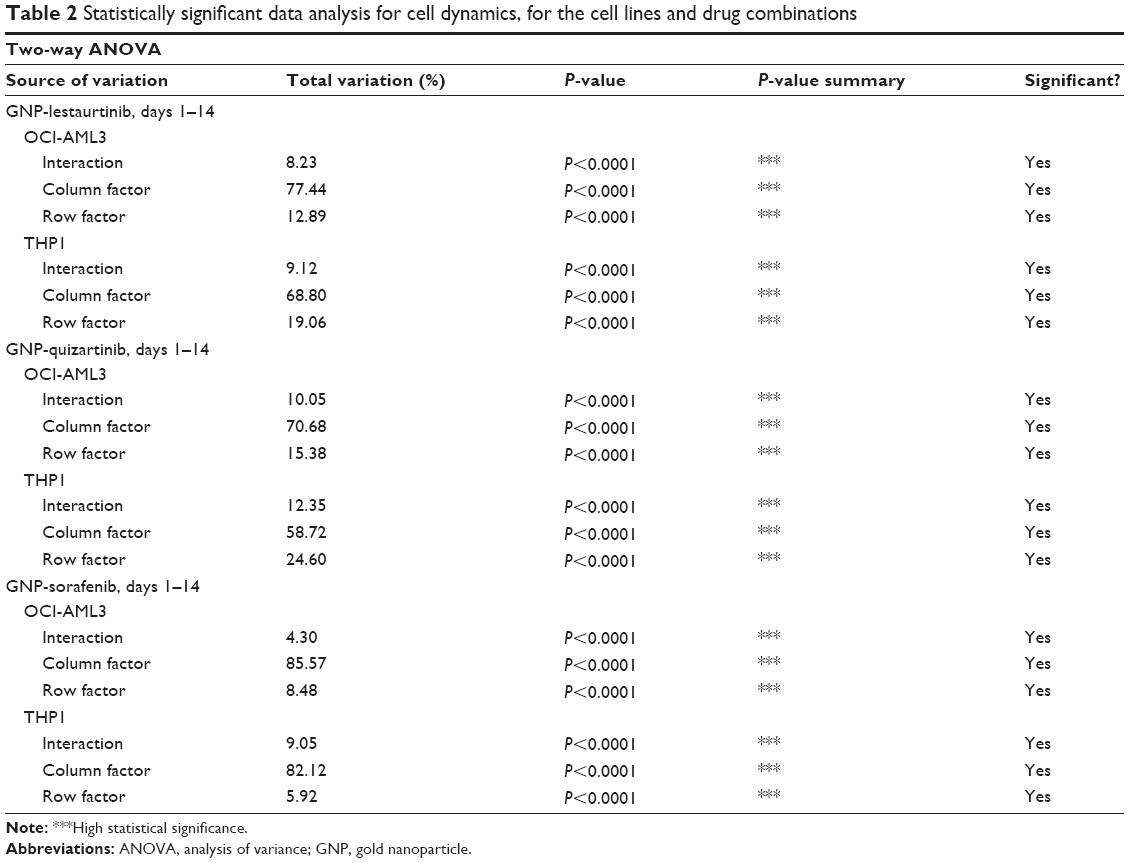 | Table 2 Statistically significant data analysis for cell dynamics, for the cell lines and drug combinations |
On day 4, the figure depicting the MTT assays may be slightly misleading, and the difference between leukemia cells treated with quizartinib alone and the one treated with GNP-quizartinib may not be relevant at day 4. Thus, we have analyzed these two groups using two-way ANOVA. The data analyses for OCI-AML3 and THP1 cells are presented in Table 3. As seen from the data presented in these two tables, the difference is actually highly statistically significant for both cell lines (P<0.0001), suggesting that starting from day 4, the newly synthesized drug has an increased efficacy against acute leukemia, in comparison with the drug alone. This has deep implications in the clinic, as sometimes AML presents to the referral physician with a high number of circulating peripheral blasts, often leading to patient death within days or even hours. These cases are treated with immediate leukapheresis, but results may suggest that induction chemotherapy may be of great help by relieving the tumor burden fast.
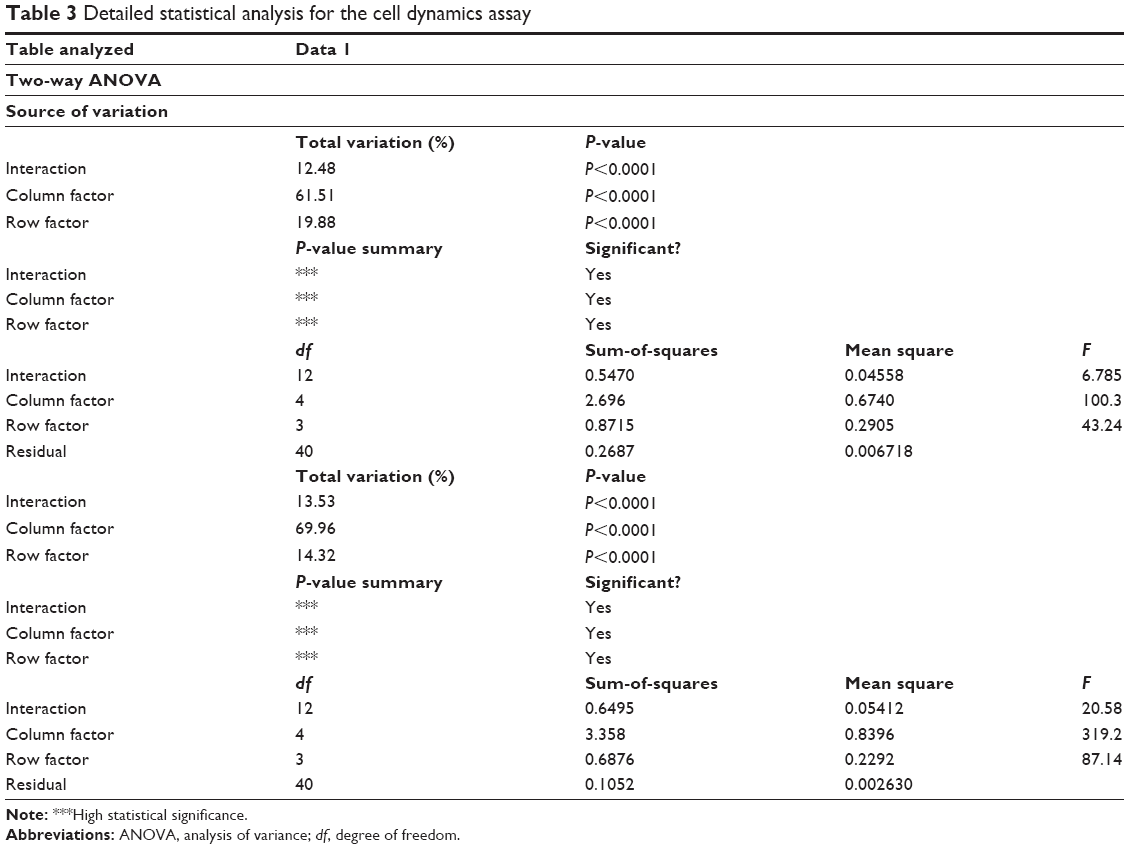 | Table 3 Detailed statistical analysis for the cell dynamics assay |
The MTT data was also confirmed by the cell counting assay. Figure 4A–F shows the cellular proliferation for days 1–14, for OCI-AML3 cells treated with GNP-lestaurtinib (Figure 4A), for THP1 cells treated with GNP-lestaurtinib (Figure 4B), for OCI-AML3 cells treated with GNP-quizartinib (Figure 4C), for THP1 cells treated with GNP-quizartinib (Figure 4D), for OCI-AML3 cells treated with GNP-sorafenib (Figure 4E), and for THP1 cells treated with GNP-sorafenib (Figure 4F). All experiments were carried out in triplicate. Table 4 shows the statistical analysis for OCI-AML3 cells treated with GNP-lestaurtinib, for THP1 cells treated with GNP-lestaurtinib, for OCI-AML3 cells treated with GNP-quizartinib, for THP1 cells treated with GNP-quizartinib, for OCI-AML3 cells treated with GNP-sorafenib, and for THP1 cells treated with GNP-sorafenib.
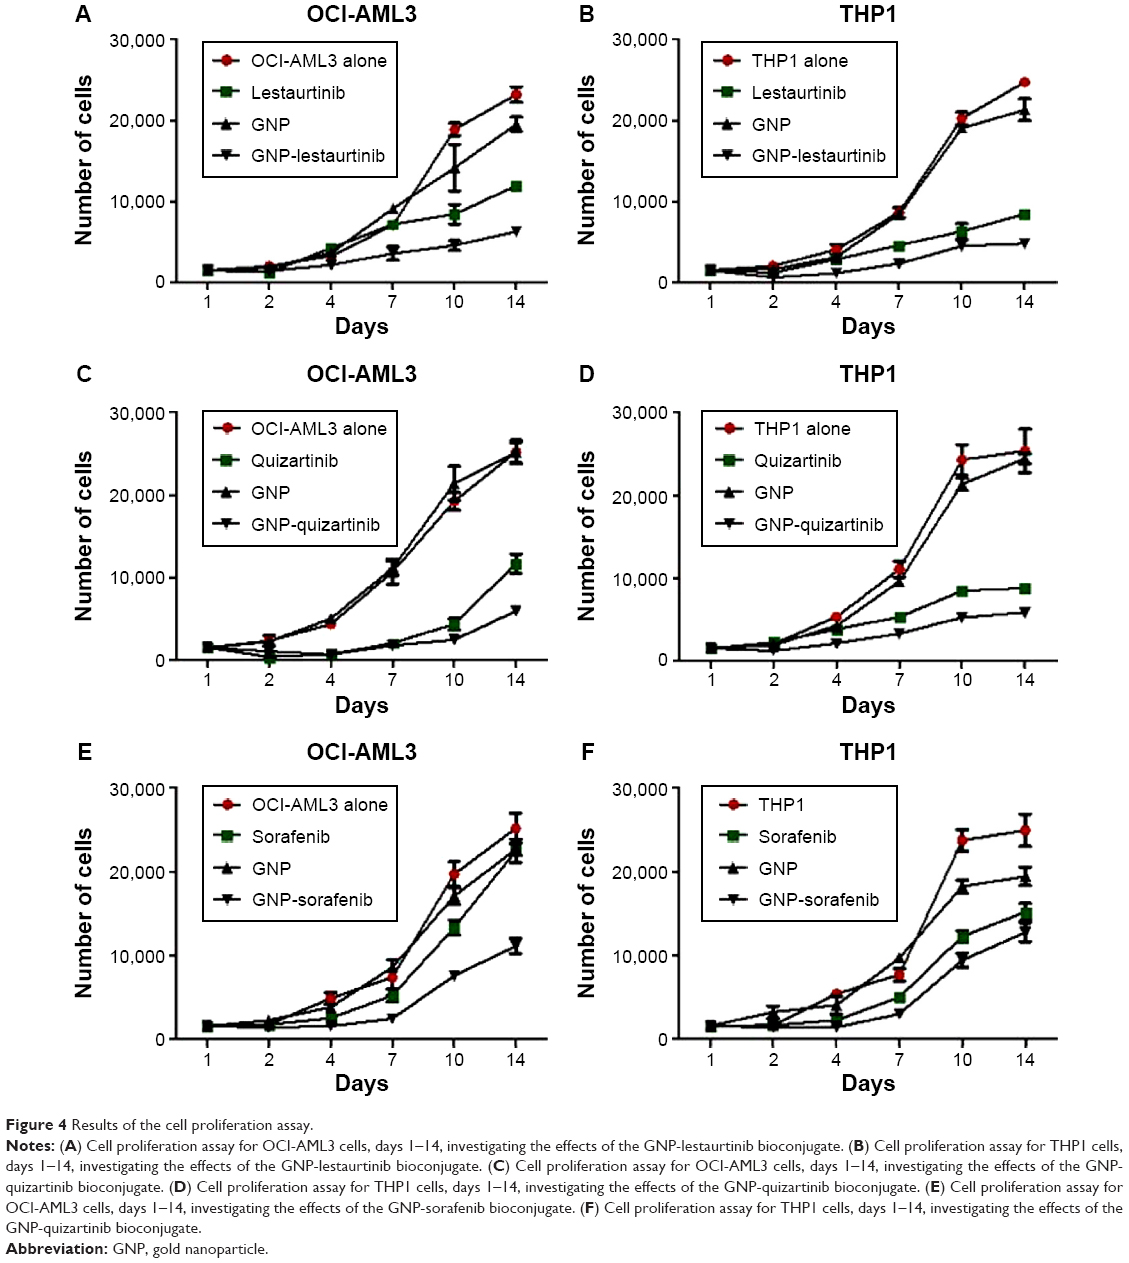 | Figure 4 Results of the cell proliferation assay. |
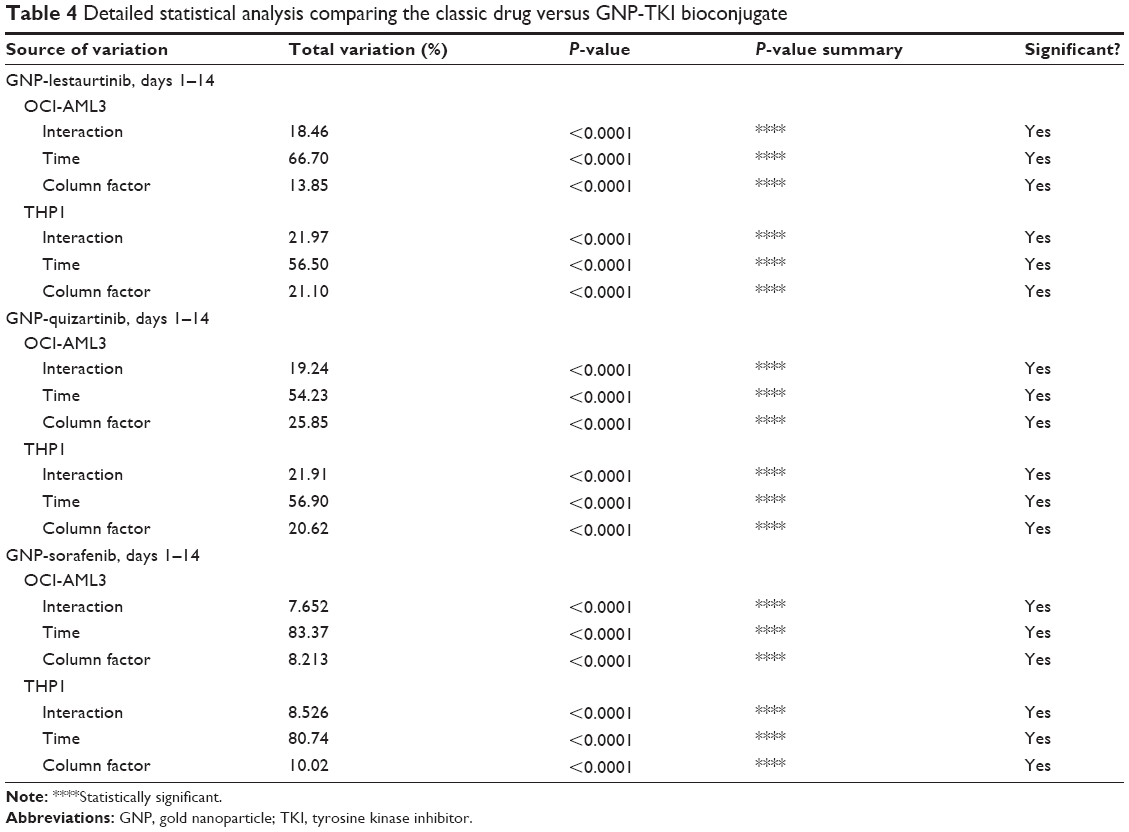 | Table 4 Detailed statistical analysis comparing the classic drug versus GNP-TKI bioconjugate |
So far, we have clearly proven that the GNP-TKI bioconjugates inhibit the growth of the leukemia cell population. The next step was to investigate further the cellular mechanisms by which our new drug works. The cell biology of leukemic clones treated with GNP-TKI was investigated using both the apoptosis assay and the autophagy assay. A cancer cell dies after chemotherapy usually due to apoptosis (either early apoptosis or late apoptosis). Apart from apoptosis, the cell may also be killed by necrosis or autophagy. Using flow cytometry, along with Annexin-V (AnV) and PI staining, we looked at both acute leukemia cell lines, treated with all possible combinations of GNP, TKI, and GNP-TKI. To study necrosis, as negative controls for our assays, we used cells cultured without any drugs in simple media, while cells treated with H2O2 were used as positive controls. After the treatment, cells underwent first early apoptosis (defined as AnV+/PI−) after 3–8 hours. In our experiments, we have measured the early apoptosis after 4 hours and proved that in neither OCI-AML 3 cells nor THP1 cells early apoptosis is the main mechanism of cell death, as seen in Figure 5A–C (for OCI-AML3 cells) and Figure 5D–F (for THP1 cells). The statistical analysis for OCI-AML3 cells and THP1 cells is shown in Table 5. The initial phase of apoptosis is defined as early apoptosis and involves the activation of Bcl-2 family proteins, as well as the depolarization of the mitochondria. This is a fast process, which happens within hours from the applied stimulus. Afterward, the changes in nuclear morphology, usually assessed by acridine orange and morphology follow later, as does cell shrinkage. This is analyzed by forward scatter (FS) versus side scatter (SS) on flow cytometry. Late apoptosis, as defined as AnV+/PI+, starts to appear later, at 5–6 hours after the treatment, but will peak at 12–16 hours. This happens after caspase activation, nuclear condensation, and formation of the apoptotic bodies.
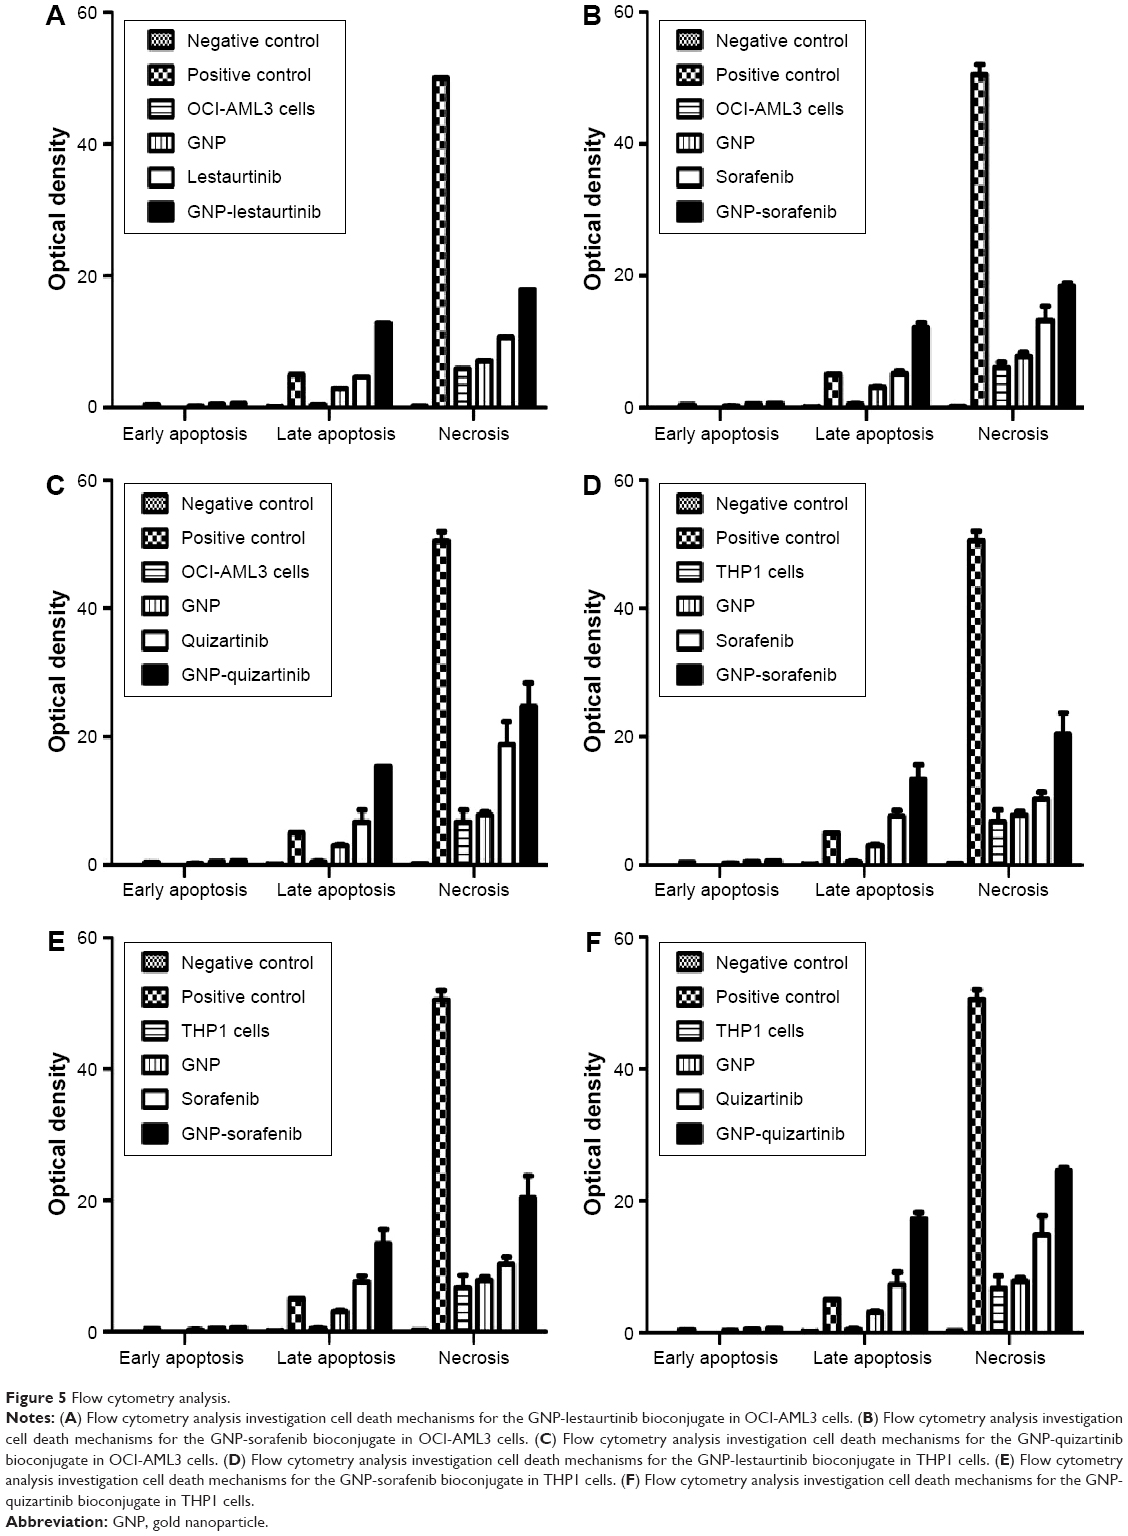 | Figure 5 Flow cytometry analysis. |
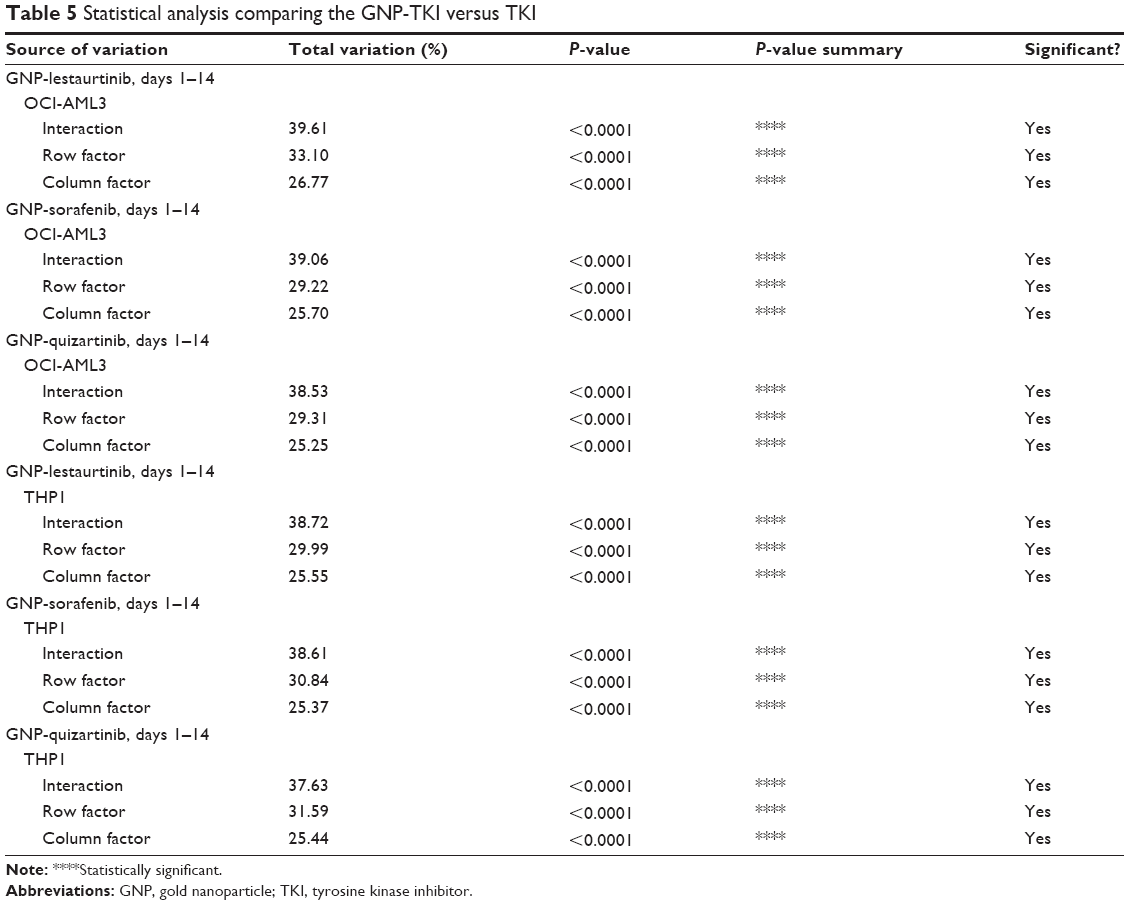 | Table 5 Statistical analysis comparing the GNP-TKI versus TKI |
We have measured late apoptosis after 12 hours and have proven that the GNP-TKI complex kills the leukemia cells mostly by late apoptosis, as shown by our data. If the cell is necrotic, membranes are broken and PI is detected, but phosphatidylserine can also be detected, which is usually found in the inner side of the membrane, except in apoptosis when it translocates to the external site. When membranes are broken in necrosis, PS from the inner site of the membrane can also be detected and it is visualized as An+/PI+, but instead of late apoptosis it is necrosis. In our analysis, cells also die because of necrosis, as seen when compared with the positive control, but the differentiation between late apoptosis and necrosis is rather difficult. This is not of utmost importance, as we have clearly established that the GNP-TKI complex starts to kill the leukemia cell after approximately 12 hours, in accordance with the mechanisms of action of small molecules, as is the case of TKIs. Autophagy does not play any significant role in the death of chronic lymphocytic leukemia cells, as proven by our experiments (data not shown, as there is no statistical significance between the samples).
After having looked at the cell biology mechanisms by which the GNP-TKI bioconjugate affects the proliferation of AML cells, we investigated the status of the FLT3 gene and protein, over which the newly described drug acts. Thus, we conducted a quantitative real-time polymerase chain reaction (RT-PCR) for FLT3-IDT. The RT-PCR data for our experiments proved that, in the case of cells treated with TKI, in comparison with the ones without any therapy, the expression levels of the gene responsible for the synthesis of the FLT3 protein are downregulated, as seen in Figure 6A (for OCI-AML 3 cells) and Figure 6B (for THP1 cells). The expression level is further decreased when comparing the cells treated with GNP-TKI versus the ones with classic TKI, the difference being statistically significant (P<0.01) when analyzed using Tukey’s multiple comparison test.
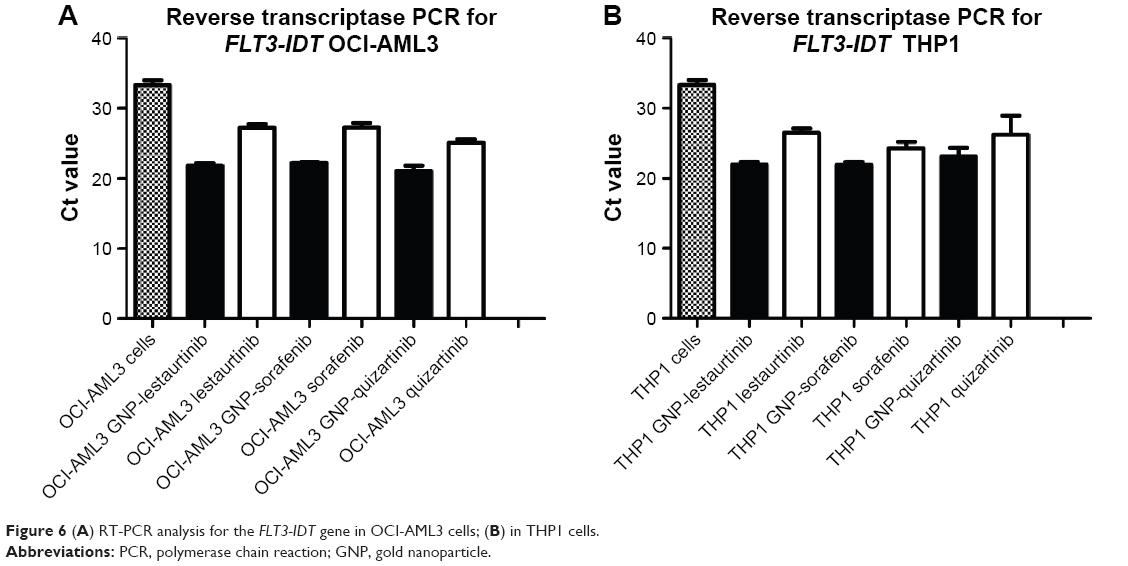 | Figure 6 (A) RT-PCR analysis for the FLT3-IDT gene in OCI-AML3 cells; (B) in THP1 cells. |
Once we showed that the GNP-TKI downregulated the expression of FLT3 IDT, the gene responsible for the cellular synthesis of the protein with the same name, we wanted to look at the protein expression. Proteomic assays included Western blotting for FLT3 protein. For the Western blotting, along with the already used TKIs (lestaurtinib, sorafenib, and quizartinib), we also investigated the potential of another TKI: midostaurin. We used midostaurin as a negative control as this drug has been shown to have a limited anti-FLT3 activity. When this receptor binds to FLT3L, a ternary complex is formed in which two FLT3 molecules are bridged by one FLT3L. Signaling through FLT3 plays a role in cell survival, proliferation, and differentiation of myeloid cells. Figure 7A and B shows the protein expression levels for FLT3 for the OCI-AML 3 cells (Figure 7A) and for THP1 cells (Figure 7B) when treated with the newly synthesized nanoconjugate. Figure 7C and D shows the effects of the classic TKI on the two cell lines, for the OCI-AML 3 cells (Figure 7C) and for THP1 cells (Figure 7D). We have added the quantifications for the blotting (using J-image software) as Figure 7E (OCI-AML3 cells treated with GNP-TKI), Figure 7F (THP1 cells treated with GNP-TKI), Figure 7G (OCI-AML3 cells treated with TKI), and Figure 7H (THP1 cells treated with TKI). We can clearly see that GNP-TKI degrades the target protein FLT3. In the lower figures, we show the controls for β-actin.
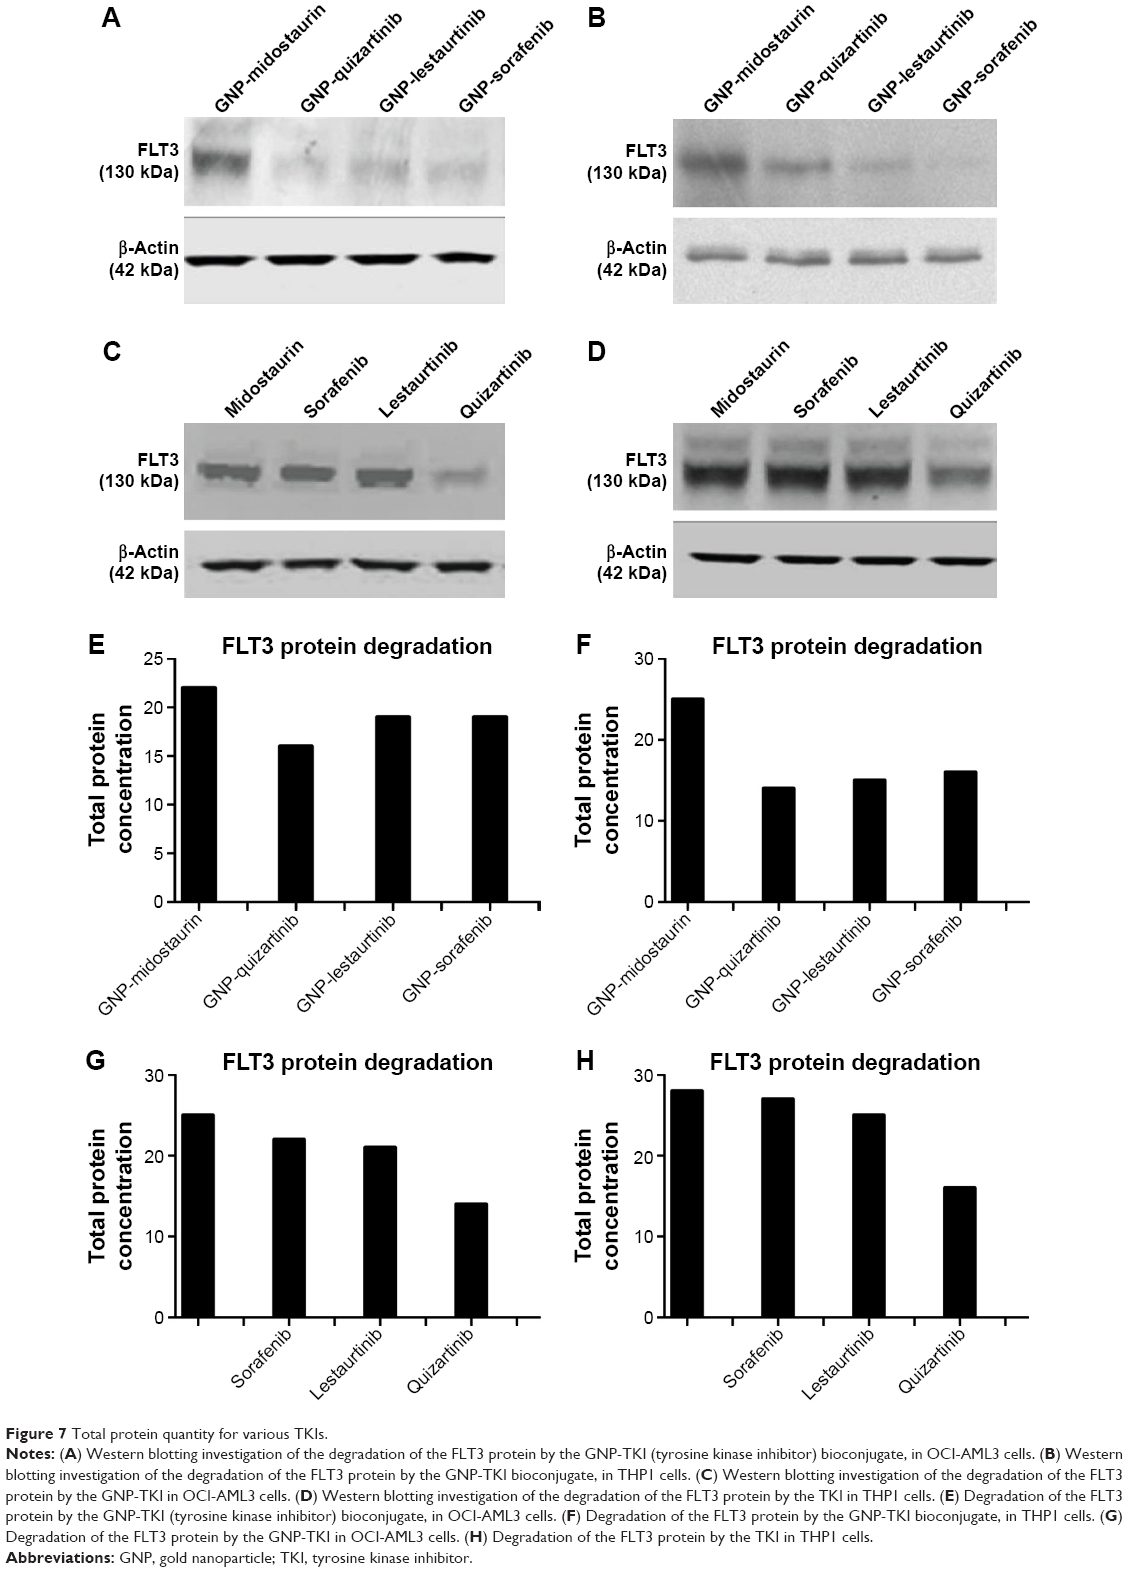 | Figure 7 Total protein quantity for various TKIs. |
Discussion
AML is a clonal disorder of the hematopoietic system characterized by a huge heterogeneity of acquired mutations in the undifferentiated stem-like precursor of myeloid cells, as well as impaired mechanisms of self-renewal, proliferation, and differentiation.41,42 More than 200 structural and cytogenetic abnormalities have been described so far in this type of leukemia, with incidences ranging from 0.2% to 10%.3,43 Kelly and Gilliland44 have postulated several years ago that at least two classes of mutations are necessary for the development of AML, with one affecting the cell growth pathway and the other blocking cellular differentiation. Using whole genome sequencing of AML, this hypothesis was later improved and, thus, an initiating driver mutation offers a survival advantage to a hematopoietic stem cell. These mutations include NPM1, IDH2, TET2, or DNMT3A. Later on, the first mutation is followed by a secondary one, responsible for the actual malignant transformation of the myeloid cell.45,46 The most common second, cooperative mutation is an internal tandem duplication of the Fms-like tyrosine kinase 3 gene (FLT3-ITD mutation), that constitutively activate the receptor tyrosine kinase activity, as well as all the downstream signaling pathways, thus resulting in dysregulation of cell proliferation.47,48
The success of small molecule inhibition of BCR-ABL in chronic myeloid leukemia (CML)49 was followed by the development of new TKIs for the clinical management of hematological malignancies. As the presence of FLT3-IDT mutation in AML is associated with a very poor prognosis (because only 22% of young patients maintain remission after 2 years, according to a Phase III cooperative group study),50 targeting this mutation was supposed to offer a potential improvement in the clinical evolution of such cases. Such small-molecule inhibitor drugs include lestaurtinib, quizartinib, or sorafenib. One of the first studies of such drugs is for lestaurtinib (CEP701) with a Phase I/II trial for relapsed or refractory AML patients with FLT3 mutations at the Johns Hopkins Hospital.51 The plasma level was enough to inhibit FLT3 autophosphorylation in a sustained fashion. Partial response was achieved in eight of 27 patients (three of five FLT3 ITD, five of 22 WT), and all eight responders had drug plasma levels sufficient to inhibit FLT3 phosphorylation to below 15% of baseline activity. A randomized trial of chemotherapy with or without sorafenib was studied in FLT3-ITD elderly patients. In the investigational arm, sorafenib was given at a dose of 400 mg twice daily continuously from day 3 until 3 days before the next cycle.15 Adverse events are associated with inclusion of sorafenib into chemotherapy and there was no significant improvement in event-free survival (EFS) or overall survival (OS). Quizartinib (AC220) is a novel bis-aryl urea and may well be the most potent and specific inhibitor of FLT3 currently in development.52,53 A Phase I study investigated the activity in both FLT3 wild-type (WT) and ITD relapsed and refractory AML. Seventy-six patients were treated on one of two schedules: intermittent (days 1–14) or continuous (days 1–28) dosing. Pharmacokinetic studies revealed a prolonged plasma half-life of 36 hours and excellent ex vivo target inhibition at dose levels above 12 mg per day. The dose-limiting toxicity was cardiac QT prolongation at 300 mg continuous dosing. The Phase II study of quizartinib was preliminarily reported, evaluating 90 mg per day in females and 135 mg per day in males in a continuous dosing strategy. The rate of CR with or without count recovery (CRc) was 44%. Thirty-four of the 44 responding patients were able to proceed to allogeneic transplant.54 The median duration of CRc was 11.3 weeks. In a Phase II single-institution study of newly diagnosed AML with or without FLT3 mutations at MD Anderson Cancer Center, sorafenib was administered for 7 days at 400 mg twice a day with cytarabine and idarubicin in induction and consolidation, followed by a year of maintenance sorafenib.55 The combination was tolerable, and the investigators reported a high CR rate in FLT3-mutated patients (14/15). Despite this high initial CR rate, 9/14 patients have gone on to relapse, with the other five in ongoing CR at the median follow-up of 62 weeks.
All our data from the two-cell proliferation assays show that the best chemotherapy option is quizartinib conjugated with GNPs. This conclusion is confirmed by recent data from various clinical trials. Such studies report quizartinib effective in patients with AML with FLT3 internal tandem duplication (ITD) mutations.56,57 The FLT3 IDT gene is the gene responsible for the synthesis of the FLT3 protein, the direct target of TKIs. This protein is also associated with increased resistance to chemotherapy and a higher risk for leukemia relapse.58,59 In patients with normal karyotype, FLT3 ITD is associated with poor prognosis.1 FLT3 ITD with t(8;21), inv(16), or t(16;16) may be associated with favorable prognosis, whereas patients with FLT3-ITD–positive AML experienced a 50% complete response rate in a Phase II trial of quizartinib, although blood count recoveries were typically incomplete. Patients with FLT3-ITD–positive AML treated with sorafenib experienced complete and near-complete remissions with insufficient hematologic recovery.
As the results are promising, but still far from efficient in the medical management of a FLT3-positive AML patient, in the current paper we report the increased efficacy of using TKI conjugated to GNPs, as shown by our data.
Conclusion
The current study reports the conjugation of TKI-based drug onto spherical GNPs, their effective transmembrane delivery inside AML cells, and in vitro evaluation as a therapeutic agent against two different AML cell lines: THP1 and OCI-AML3. The efficient formation of drug nanocarriers was proved by spectroscopic characterization of the particles. The internalization of rituximab nanocarriers was proved as a result of the strongly scattered light from GNPs and was correlated with the results obtained by TEM. The therapeutic effect of the newly designed drugs was investigated by several methods including cell counting assay as well as the MTT assay and was found to be superior when compared with the drug alone, data confirmed by state-of-the-art analyses of internalization, cell biology, as well as by assessing the degradation of the FLT3 protein and downregulation of the FLT3-IDT gene. The obtained results are promising for validating rituximab gold nanocarriers as potential clinical agents for the treatment of AML.
Acknowledgments
Bobe Petrushev and Sanda Boca contributed equally to the current paper. The research is supported by the international grant Romania–European Economical Space (Norway) 2014–2016, awarded to Ciprian Tomuleasa, Simion Astilean, and Andrei Cucuianu (Code: 14-SEE-PC-RO CLUJNAP03, Contract 1/16.01.2014), as well as by the international grant Romania–European Economical Space (Norway) 2015–2016, awarded to Ciprian Tomuleasa and Sanda Boca (Code: 15-SEE-PC-RO CLUJNAP03, Contract 1/25.06.2015). The entire academic community from Romania regrets the passing of Andrei Cucuianu, MD, in February 2015, a true mentor and physician.
Disclosure
The authors report no conflicts of interest in this work.
References
Döhner H, Estey EH, Amadori S, et al. Diagnosis and management of acute myeloid leukemia in adults: recommendations from an international expert panel, on behalf of the European LeukemiaNet. Blood. 2010;115(3):453–474. | ||
Schlenk RF, Döhner K, Krauter J, et al. Mutations and treatment outcome in cytogenetically normal acute myeloid leukemia. N Engl J Med. 2008;358(18):1909–1918. | ||
Marcucci G, Haferlach T, Döhner H. Molecular genetics of adult acute myeloid leukemia: prognostic and therapeutic implications. J Clin Oncol. 2011;29(5):475–486. | ||
Estey E, Döhner H. Acute myeloid leukaemia. Lancet. 2006;368(9550):1894–1907. | ||
Rubnitz JE, Gibson B, Smith FO. Acute myeloid leukemia. Pediatr Clin North Am. 2008;55(1):21–51. | ||
Ferrara F. Unanswered questions in acute myeloid leukaemia. Lancet Oncol. 2004;5(7):443–450. | ||
Ley TJ, Miller C, Ding L, et al; Cancer Genome Atlas Research Network. Genomic and epigenomic landscapes of adult de novo acute myeloid leukemia. N Engl J Med. 2013;368(22):2059–2074. | ||
Ishikawa Y, Kiyoi H, Tsujimura A, et al. Comprehensive analysis of cooperative gene mutations between class I and class II in de novo acute myeloid leukemia. Eur J Haematol. 2009;83(2):90–98. | ||
Kindler T, Lipka DB, Fischer T. FLT3 as a therapeutic target in AML: still challenging after all these years. Blood. 2010;116(24): 5089–5102. | ||
Weisberg E, Sattler M, Ray A, Griffin JD. Drug resistance in mutant FLT3-positive AML. Oncogene. 2010;29(37):5120–5134. | ||
Smith CC, Wang Q, Chin CS, et al. Validation of ITD mutations in FLT3 as a therapeutic target in human acute myeloid leukaemia. Nature. 2012;485(7397):260–263. | ||
Sato T, Yang X, Knapper S, et al. FLT3 ligand impedes the efficacy of FLT3 inhibitors in vitro and in vivo. Blood. 2011;117(12):3286–3293. | ||
Levis M, Ravandi F, Wang ES, et al. Results from a randomized trial of salvage chemotherapy followed by lestaurtinib for patients with FLT3 mutant AML in first relapse. Blood. 2011;117(12):3294–3301. | ||
Bhullar J, Natarajan K, Shukla S, et al. The FLT3 inhibitor quizartinib inhibits ABCG2 at pharmacologically relevant concentrations, with implications for both chemosensitization and adverse drug interactions. PLoS One. 2013;8(8):e71266. | ||
Serve H, Krug U, Wagner R, et al. Sorafenib in combination with intensive chemotherapy in elderly patients with acute myeloid leukemia: results from a randomized, placebo-controlled trial. J Clin Oncol. 2013;31(25):3110–3118. | ||
Widemann BC, Kim A, Fox E, et al. A phase I trial and pharmacokinetic study of sorafenib in children with refractory solid tumors or leukemias: a Children’s Oncology Group Phase I Consortium report. Clin Cancer Res. 2012;18(21):6011–6022. | ||
Hu R, Yong KT, Roy I, Ding H, He S, Prasad PN. Metallic nanostructures as localized plasmon resonance enhanced scattering probes for multiplex dark field targeted imaging of cancer cells. J Phys Chem C Nanomater Interfaces. 2009;113(7):2676–2684. | ||
Potara M, Boca S, Licarete E, et al. Chitosan-coated triangular silver nanoparticles as a novel class of biocompatible, highly sensitive plasmonic platforms for intracellular SERS sensing and imaging. Nanoscale. 2013;5(13):6013–6022. | ||
Boca-Farcau S, Potara M, Simon T, Juhem A, Baldeck P, Astilean S. Folic acid-conjugated, SERS-labeled silver nanotriangles for multimodal detection and targeted photothermal treatment on human ovarian cancer cells. Mol Pharm. 2014;11(2):391–399. | ||
Markman JL, Rekechenetskiy A, Holler E, Ljubimova JY. Nanomedicine therapeutic approaches to overcome cancer drug resistance. Adv Drug Deliv Rev. 2013;65:1866–1879. | ||
Bisker G, Yeheskely-Hayon D, Minai L, Yelin D. Controlled release of Rituximab from gold nanoparticles for phototherapy of malignant cells. J Control Release. 2012;162:303–309. | ||
Orza A, Soriţău O, Tomuleasa C, et al. Reversing chemoresistance of malignant glioma stem cells using gold nanoparticles. Int J Nanomedicine. 2013;8:689–702. | ||
Tomuleasa C, Soritau O, Orza A, et al. Gold nanoparticles conjugated with cisplatin/doxorubicin/capecitabine lower the chemoresistance of hepatocellular carcinoma-derived cancer cells. J Gastrointestin Liver Dis. 2012;21(2):187–196. | ||
Petrushev B, Tomuleasa C, Soritau O, et al. Metformin plus PIAF combination chemotherapy for hepatocellular carcinoma. Exp Oncol. 2012;34(1):17–24. | ||
Miklášová N, Fischer-Fodor E, Lönnecke P, et al. Antiproliferative effect of novel platinum(II) and palladium(II) complexes on hepatic tumor stem cells in vitro. Eur J Med Chem. 2012;49:41–47. | ||
Quentmeier H, Martelli MP, Dirks WG, et al. Cell line OCI/AML3 bears exon-12 NPM gene mutation-A and cytoplasmic expression of nucleophosmin. Leukemia. 2005;19(10):1760–1767. | ||
Tsuchiya S, Yamabe M, Yamaguchi Y, Kobayashi Y, Konno T, Tada K. Establishment and characterization of a human acute monocytic leukemia cell line (THP-1). Int J Cancer. 1980;26(2):171–176. | ||
Li L, Masica D, Ishida M, et al. Human bile contains microRNA-laden extracellular vesicles that can be used for cholangiocarcinoma diagnosis. Hepatology. 2014;60(3):896–907. | ||
Florea A, Craciun C. Bee venom induced in vivo ultrastructural reactions of cells involved in the bone marrow erythropoiesis and of circulating red blood cells. Microsc Microanal. 2013;19(2):393–405. | ||
Tomuleasa CI, Foris V, Soriţău O, et al. Effects of 60Co gamma-rays on human osteoprogenitor cells. Rom J Morphol Embryol. 2009;50(3):349–355. | ||
Soriţău O, Tomuleasa CI, Páll E, et al. Enhanced chemoresistance and tumor sphere formation as a laboratory model for peritoneal micrometastasis in epithelial ovarian cancer. Rom J Morphol Embryol. 2010; 51(2):259–264. | ||
Tomuleasa C, Soritau O, Brie I, et al. Mesenchymal stem cell irradiation in culture engages differential effect of hyper-fractionated radiotherapy for head and neck cancers. J BUON. 2010;15(2):348–356. | ||
Tomuleasa C, Soritau O, Kacso G, et al. Arsenic trioxide sensitizes cancer stem cells to chemoradiotherapy. A new approach in the treatment of inoperable glioblastoma multiforme. J BUON. 2010;15(4):58–762. | ||
Tomuleasa C, Soritau O, Fischer-Fodor E, et al. Arsenic trioxide plus cisplatin/interferon α-2b/doxorubicin/capecitabine combination chemotherapy for unresectable hepatocellular carcinoma. Hematol Oncol Stem Cell Ther. 2011;4(2):60–66. | ||
Soritau O, Tomuleasa C, Aldea M, et al. Metformin plus temozolomide-based chemotherapy as adjuvant treatment for WHO grade III and IV malignant gliomas. J BUON. 2011;16(2):282–289. | ||
Peng H, Ishida M, Li L, et al. Pseudogene INTS6P1 regulates its cognate gene INTS6 through competitive binding of miR-17-5p in hepatocellular carcinoma. Oncotarget. 2015;6(8):5666–5677. | ||
Li L, Zhou L, Li Y, Lin S, Tomuleasa C. MicroRNA-21 stimulates gastric cancer growth and invasion by inhibiting the tumor suppressor effects of programmed cell death protein 4 and phosphatase and tensin homolog. J BUON. 2014;19(1):228–236. | ||
Yamanaka S, Olaru AV, An F, et al. MicroRNA-21 inhibits Serpini1, a gene with novel tumour suppressive effects in gastric cancer. Dig Liver Dis. 2012;44(7):589–596. | ||
Verstraete K, Vandriessche G, Januar M, et al. Structural insights into the extracellular assembly of the hematopoietic Flt3 signaling complex. Blood. 2011;118(1):60–68. | ||
Zhang W, Konopleva M, Shi YX, et al. Mutant FLT3: a direct target of sorafenib in acute myelogenous leukemia. J Natl Cancer Inst. 2008;100(3):184–198. | ||
Cucuianu A. Dominant and opportunistic leukemic clones: proposal for a pathogenesis-oriented classification in acute myeloid leukemia. Med Hypotheses. 2005;65(1):107–113. | ||
Cucuianu A. Chaos in cancer? Nat Med. 1998;4(12):1342–1343. | ||
Opatz S, Polzer H, Herold T, et al. Exome sequencing identifies recurring FLT3 N676K mutations in core-binding factor leukemia. Blood. 2013;122(10):1761–1769. | ||
Kelly LM, Gilliland DG. Genetics of myeloid leukemias. Annu Rev Genomics Hum Genet. 2002;3:179–198. | ||
Welch JS, Ley TJ, Link DC, et al. The origin and evolution of mutations in acute myeloid leukemia. Cell. 2012;150(2):264–278. | ||
Ding L, Ley TJ, Larson DE, et al. Clonal evolution in relapsed acute myeloid leukaemia revealed by whole-genome sequencing. Nature. 2012;481(7382):506–510. | ||
Hayakawa F, Towatari M, Kiyoi H, et al. Tandem-duplicated Flt3 constitutively activates STAT5 and MAP kinase and introduces autonomous cell growth in IL-3-dependent cell lines. Oncogene. 2000;19(5):624–631. | ||
Mizuki M, Fenski R, Halfter H, et al. Flt3 mutations from patients with acute myeloid leukemia induce transformation of 32D cells mediated by the Ras and STAT5 pathways. Blood. 2000;96(12):3907–3914. | ||
Druker BJ, Talpaz M, Resta DJ, et al. Efficacy and safety of a specific inhibitor of the BCR-ABL tyrosine kinase in chronic myeloid leukemia. N Engl J Med. 2001;344(14):1031–1037. | ||
Fernandez HF, Sun Z, Yao X, et al. Anthracycline dose intensification in acute myeloid leukemia. N Engl J Med. 2009;361(13):1249–1259. | ||
Smith BD, Levis M, Beran M, et al. Single-agent CEP-701, a novel FLT3 inhibitor, shows biologic and clinical activity in patients with relapsed or refractory acute myeloid leukemia. Blood. 2004;103(10):3669–3676. | ||
Cortes JE, Kantarjian H, Foran JM, et al. Phase I study of quizartinib administered daily to patients with relapsed or refractory acute myeloid leukemia irrespective of FMS-like tyrosine kinase 3-internal tandem duplication status. J Clin Oncol. 2013;31(29):3681–3687. | ||
Zarrinkar PP, Gunawardane RN, Cramer MD, et al. AC220 is a uniquely potent and selective inhibitor of FLT3 for the treatment of acute myeloid leukemia (AML). Blood. 2009;114(14):2984–2992. | ||
De Zern AE, Sung A, Kim S, et al. Role of allogeneic transplantation for FLT3/ITD acute myeloid leukemia: outcomes from 133 consecutive newly diagnosed patients from a single institution. Biol Blood Marrow Transplant. 2011;17(9):1404–1409. | ||
Ravandi F, Cortes JE, Jones D, et al. Phase I/II study of combination therapy with sorafenib, idarubicin, and cytarabine in younger patients with acute myeloid leukemia. J Clin Oncol. 2010;28(11):1856–1862. | ||
Sasine JP, Schiller GJ. Emerging strategies for high-risk and relapsed/refractory acute myeloid leukemia: novel agents and approaches currently in clinical trials. Blood Rev. 2015;29(1):1–9. | ||
Smith CC, Shah NP. The role of kinase inhibitors in the treatment of patients with acute myeloid leukemia. Am Soc Clin Oncol Educ Book. 2013;313–318. | ||
Port M, Böttcher M, Thol F, et al. Prognostic significance of FLT3 internal tandem duplication, nucleophosmin 1, and CEBPA gene mutations for acute myeloid leukemia patients with normal karyotype and younger than 60 years: a systematic review and meta-analysis. Ann Hematol. 2014;93(8):1279–1286. | ||
Meyer SC, Levine RL. Translational implications of somatic genomics in acute myeloid leukaemia. Lancet Oncol. 2014;15(9):e382–e394. |
Supplementary material
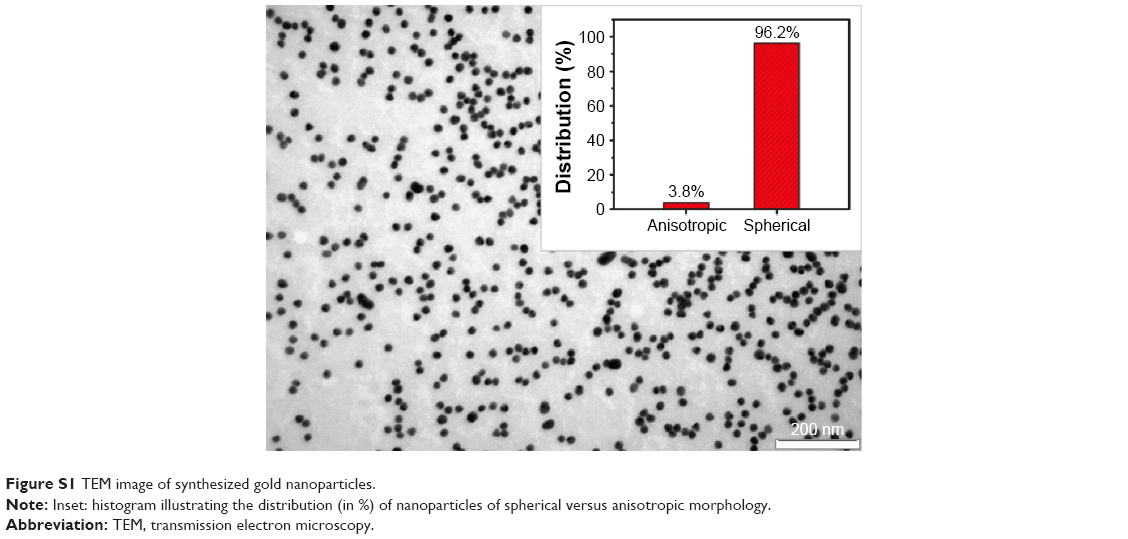 | Figure S1 TEM image of synthesized gold nanoparticles. |
 © 2016 The Author(s). This work is published and licensed by Dove Medical Press Limited. The full terms of this license are available at https://www.dovepress.com/terms.php and incorporate the Creative Commons Attribution - Non Commercial (unported, v3.0) License.
By accessing the work you hereby accept the Terms. Non-commercial uses of the work are permitted without any further permission from Dove Medical Press Limited, provided the work is properly attributed. For permission for commercial use of this work, please see paragraphs 4.2 and 5 of our Terms.
© 2016 The Author(s). This work is published and licensed by Dove Medical Press Limited. The full terms of this license are available at https://www.dovepress.com/terms.php and incorporate the Creative Commons Attribution - Non Commercial (unported, v3.0) License.
By accessing the work you hereby accept the Terms. Non-commercial uses of the work are permitted without any further permission from Dove Medical Press Limited, provided the work is properly attributed. For permission for commercial use of this work, please see paragraphs 4.2 and 5 of our Terms.