")
Back to Journals » International Journal of Nanomedicine » Volume 13
Gold nanoparticles – an optical biosensor for RNA quantification for cancer and neurologic disorders diagnosis
Authors Shawky SM , Awad AM , Abugable AA , El-Khamisy SF
Received 28 July 2018
Accepted for publication 11 September 2018
Published 29 November 2018 Volume 2018:13 Pages 8137—8151
DOI https://doi.org/10.2147/IJN.S181732
Checked for plagiarism Yes
Review by Single anonymous peer review
Peer reviewer comments 3
Editor who approved publication: Dr Thomas Webster
Sherif M Shawky,1–3,* Ahmed M Awad,1,4,* Arwa A Abugable,1,2,* Sherif F El-Khamisy1,2
1Center for Genomics, Helmy Institute for Medical Sciences, Zewail City of Science and Technology, Giza, Egypt; 2Krebs Institute, Department of Molecular Biology and Biotechnology, Firth Court, University of Sheffield, Sheffield, UK; 3Biochemistry Department, Faculty of Pharmacy, Misr University for Science and Technology, Giza, Egypt; 4Department of Molecular Biology, Genetic Engineering and Biotechnology Research Institute, University of Sadat City, Sadat City, Egypt
*These authors contributed equally to this work
Purpose: The objective of this study is to develop a facile tool for the absolute detection and quantification of nucleic acid transcripts, using a gold nanoparticle-based optical biosensor. Topoisomerase 1 (TOP1) and tyrosyl DNA phosphodiesterase 2 (TDP2) were among the nucleic acid transcripts of choice due to their role as genomic instability biomarkers and their implication in various cancers and neurologic disorders. This opens the door to develop a simple tool that can be used for diagnosing and monitoring treatment response for such diseases, overcoming the requirements for high cost, time, and complexity of the existing technologies for the absolute quantification of transcripts of interest.
Materials and methods: The TOP1 and TDP2 mRNA transcripts were first captured specifically using magnetic nanoparticles that were functionalized with TOP1- and TDP2-specific probes, respectively. The captured mRNA was then directly detected and quantified using the gold aggregating gold (GAG) assay, without the need for amplification as in existing technologies used for the quantification of transcripts.
Results: A linear correlation exists between the GAG assay and the qPCR for the quantification of the TOP1 and TDP2 mRNA transcripts (101–104 copies). The detection limit of the GAG assay in mRNA quantification was up to 10 copies per reaction. Wild-type and TDP2-deficient cell lines confirmed the assay specificity and reproducibility in distinguishing between different transcripts.
Conclusion: The GAG assay can be utilized as an inexpensive, rapid, simple, and sensitive tool for the absolute quantification of RNA for different applications, instead of the laborious, expensive, and sophisticated real-time PCR.
Keywords: gold aggregating gold, TOP1, TDP2, magnetic nanoparticles, RNA extraction, genomic instability, neurodegenerative diseases, tumor markers
Introduction
An efficient healthcare system is dependent on three main pillars: patients (disease), efficient and affordable diagnosis, as well as rapid and precise clinical decisions. Molecular diagnostics and particularly, nucleic acid testing, lay a solid foundation in effective disease management and modern healthcare strategies. In addition, advances in molecular diagnostic technologies have had a great impact on establishing the rapidly evolving pharmacogenomics field, resulting in the development of the era of personalized medicine and overall improvement in the healthcare system.1
DNA damage plays a significant role in cellular dysfunction and death. Defects in the DNA repair pathways result in genomic instability. In replicating cells, this could lead to cellular transformation, eventually leading to cancer development. On the other hand, in nonreplicating cells such as neuronal tissue, a consequence of loss of genomic integrity is apoptosis leading to neurodegenerative disorders such as Alzheimer’s disease and Parkinson’s disease.2,3 Topoisomerases (TOP) and tyrosyl DNA phosphodiesterases (TDP) are among the DNA repair players that play a fundamental role in regulating gene transcription, DNA replication, recombination, and repair through different mechanisms.4 Failure in the activities of these proteins results in protein-linked DNA breaks (PDBs), ultimately leading to neurodegenerative diseases and cancers.5,6
Patients with neurologic disorders such as intellectual disability, seizures, and ataxia have mutations in TDP2. As a result, TDP2 expression levels are affected, leading to abortive TOP2 activity and increased hypersensitivity to TOP2-induced double-stranded breaks.7 Moreover, TOP1 is inevitability required for proper synaptic function and regulates the levels of multiple synaptic proteins and, thereby, its dysfunction has a negative impact on the synaptic activity.8 In our recent publication, we have revealed that TOP1-mediated PDBs and R-loops lead to genomic instability in mice neurons, human cells, and in spinal cord tissues of patients suffering from amyotrophic lateral sclerosis and frontotemporal dementia.9 Furthermore, TDP1 expression was recently found to be decreased in spinocerebellar ataxia as a result of the downregulation UCHL3.10 Therefore, TOP1 and TDP2 transcripts level can be utilized as potential biomarkers for many neurodegenerative disorders.
On the other hand, TOP1 gene expression can be used as an early biomarker for predicting the response to TOP1-targeting chemotherapeutics.4 A significant correlation was found to exist in various colon and breast cancer cell lines between TOP1 expression and the sensitivity to SN-38, the active metabolite of the TOP1 poison, irinotecan.11–13 In addition, TDP2 is considered to be a potential biomarker of sensitivity to anticancer drugs such as etoposide, doxorubicin, and bicalutamide.14 TDP2 depletion in A549 and H460 lung cancer cell lines as well as chicken DT40 cells increased the sensitivity of the cells to etoposide.5,15,16 Moreover, mutant-p53-dependent overexpression of TDP2 has been implicated in cellular resistance to etoposide in lung cancer cells.17 Furthermore, we have recently shown that TDP1 expression is increased in rhabdomyosarcoma as a result of the upregulation of UCHL3.10 As a result, the expression levels of TOP1 and TDP2 can be measured and utilized as a potential biomarker in various cancers to predict and monitor patients’ response to different chemotherapeutics.
Sensitive and precise measurement of the mRNA transcripts expression level is of pivotal importance in enhancing our understanding to the cellular dogma, leading ultimately to accurate diagnosis and, hence, allowing physicians to make more informed clinical decisions. This opens the door for the development of more personalized therapeutic approaches, maximizing patients’ benefit and overcoming the side effects and drawbacks of the current conventional therapy.18
Among the tools used for relative and absolute quantification of mRNA are Northern blotting,19,20 RNA in situ hybridization,21,22 nuclease protection assays,23 and real-time PCR.24–26 Despite the high sensitivity and specificity of the aforementioned techniques, especially the latter, they are expensive, laborious, and require trained personnel and adequately equipped laboratories. In addition, mRNA absolute quantification is a multistep procedure that requires serially diluted standards to generate a standard curve. The standard could be double- or single-stranded DNA, or cRNA, which has the same sequence as the target RNA.27 Although DNA standards have the advantage of being more stable than RNA standards and exhibit a wider dynamic range, they cannot be used for one-step real-time PCR due to the lack of availability of a control that can measure the efficiency of the reverse transcriptase step. Therefore, this necessitates the need for alternative approaches for the absolute quantification of RNA with an acceptable sensitivity, specificity, and cost effectiveness.
In the last two decades, the unique physicochemical properties of gold nanoparticles (AuNPs) have been exploited considerably in the field of clinical diagnostics.28 The surface plasmon resonance (SPR) phenomenon of AuNPs is responsible for their intense colors, and large absorption and cross-sectional scattering properties.29 As a result, several colorimetric AuNPs-based detection methods have been developed.30–34 In our recent publication, we have developed a gold aggregating gold (GAG) biosensor to detect and quantify the hepatitis C virus RNA in clinical serum samples, as an alternative approach to the real-time PCR.35
Herein, we have exploited the optical properties of the AuNPs for the first time for the absolute quantification of unamplified mRNA transcripts using our developed GAG approach. TOP1 and TDP2 transcripts from cell lines have been extracted and quantified by copy number as well as confirmed and validated with qPCR and have demonstrated comparable sensitivity and specificity. Our data show that the GAG method (Figure 1) could be used efficiently in capturing and quantifying RNA of any origin with high specificity, sensitivity, and reproducibility.
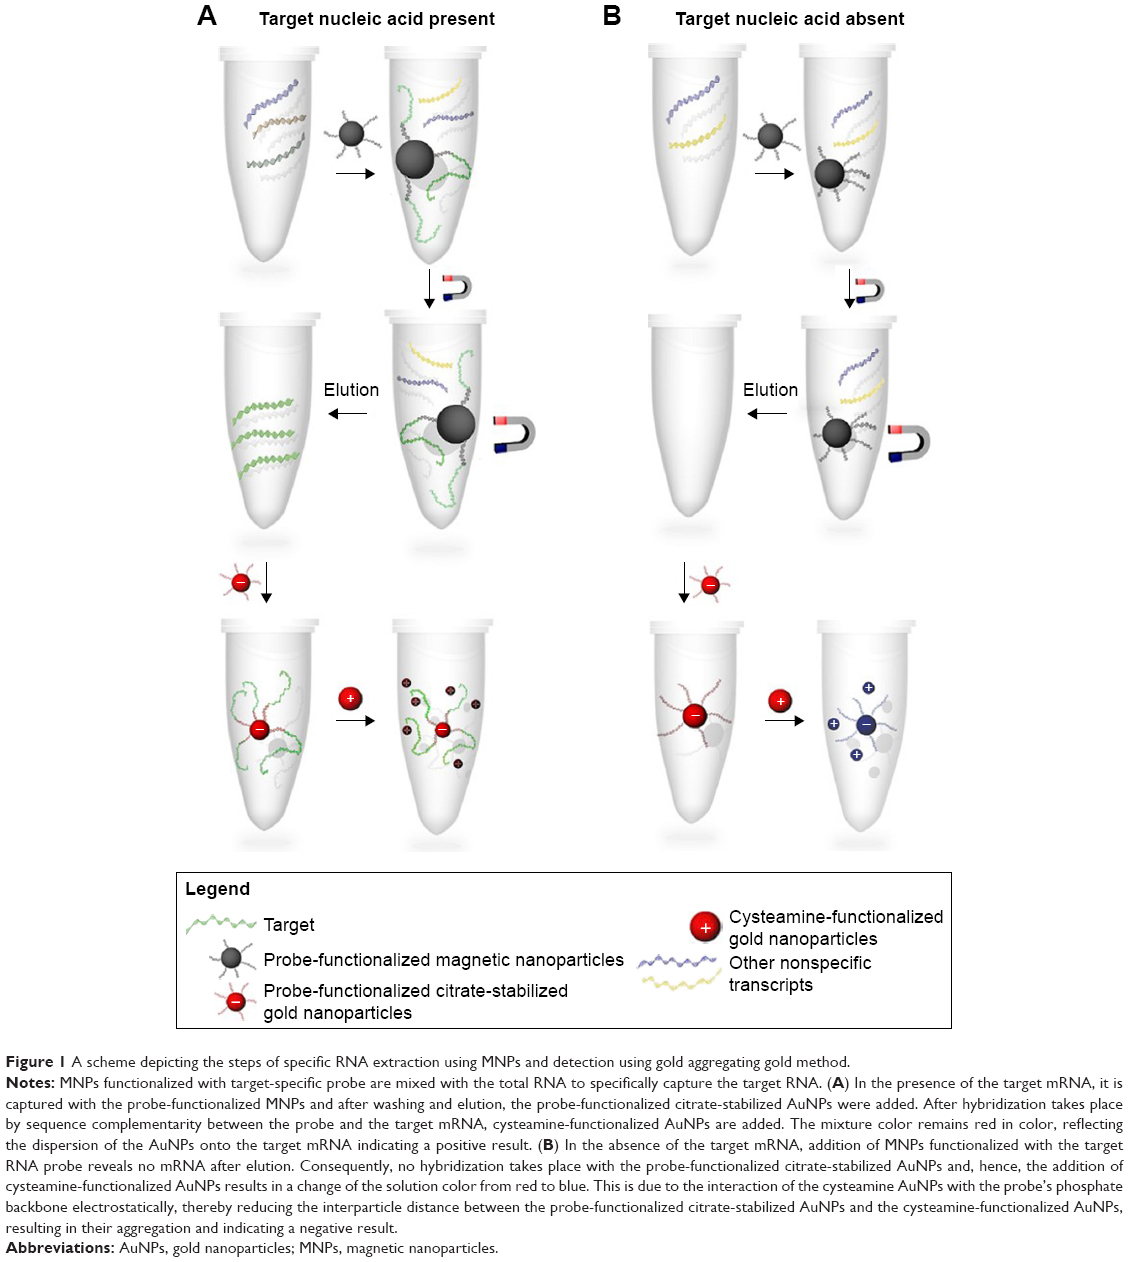 | Figure 1 A scheme depicting the steps of specific RNA extraction using MNPs and detection using gold aggregating gold method. |
Materials and methods
Synthesis and characterization of magnetic nanoparticles (MNPs)
MNPs were prepared by the chemical coprecipitation method as described previously with slight modifications.36,37 Briefly, ferrous and ferric chloride in a 1:2 molar ratio were mixed with deionized water purged with nitrogen gas for 30 minutes at 80°C. Then, 28% ammonium hydroxide solution was added dropwise to the above mixture under mechanical stirring. A black color developed, indicating the formation of the magnetite nanoparticles. Stirring and heating were continued till the pH was stable at 10. The resulting particles were washed thoroughly with 70% ethanol and deionized water at least thrice. The particles were then removed by magnetic decantation and dried in an oven overnight at 50°C. The MNPs were then characterized by high-resolution transmission electron microscopy (HR-TEM, JEOL-2100) and Fourier-transform infrared spectroscopy (Thermo Scientific Nicolet is-10).
Synthesis and characterization of amino-functionalized MNPs
Synthesized MNPs were functionalized with aminopropyl triethoxy silane (APTES) according to Liu et al38 with slight modifications. Briefly, 500 mg of MNPs was dispersed in 100 mL nitrogen-purged deionized water by sonication, and then 2 mL of APTES was added to the above mixture. The reaction mixture was heated to 80°C, and stirred mechanically for 24 hours. After the reaction was completed, the black powder was separated by magnetic decantation, washed thoroughly with 70% ethanol and deionized water thrice, and then dried in an oven overnight at 50°C. The MNPs-APTES were then characterized by HR-TEM (JEOL-2100) and Fourier-transform infrared spectroscopy (Thermo Scientific Nicolet is-10).
Functionalization of MNPs with target-specific probes
Conjugation of TOP1- and TDP2-specific probes to the amino-functionalized MNPs was performed using a hetero-bifunctional cross-linker, 3-maleimidobenzoic acid N-hydroxyl succinimide (MBS). MBS has an NHS ester at one end that reacts with the primary amine groups forming a stable amide bond and a maleimide group at the other end, which reacts with the sulfhydryl groups forming a stable thioether linkage. The MNPs-APTES were washed twice with dimethyl sulfoxide (DMSO), then MBS dissolved in DMSO was added to the nanoparticles and mixed on a roller shaker for 1 hour at room temperature. The nanoparticles were then washed twice with DMSO followed by coupling buffer (0.1 M phosphate buffer and 0.1 M NaCl, pH 7) twice, and collected by a magnet. The particles were resuspended in the coupling buffer and the thiol-modified probes were added to the suspended particles and allowed to react on a roller shaker overnight at room temperature. Finally, the solution was removed by magnetic decantation and the MNPs functionalized with target-specific probes were resuspended in storage buffer (0.01 M phosphate buffer, 0.1 M NaCl, pH 7.4).
Synthesis and characterization of citrate-capped AuNPs
Citrate-capped AuNPs were synthesized according to the well-established sodium citrate reduction method of gold (III) chloride.39–41 The AuNPs were characterized using HR-TEM (JEOL-2100), UV-Vis spectroscopy (Plate Reader, firm version 1.32, software version 3.00R2 and serial no 415-1587; BMG Labtech, Ortenberg, Germany), and dynamic light scattering (Zetasizer Nano ZS90; Malvern Instruments, Malvern UK).
Functionalization of the citrate-capped AuNPs with target-specific thiolated probes (nanoprobe)
TOP1- and TDP2-specific probes were alkanethiol modified at their 5′ terminus. The probe sequence was complementary to the target mRNA. The sequence for TOP1 probe was 5′AGTCTTCTCGATACTGGTTCCG′3, whereas for TDP2 probe it was 5′CTAAGTAGGAACACACCCCTC′3. Citrate AuNPs were functionalized with each alkanethiol-modified mRNA target-specific probe using the salt-aging process.42 Briefly, 5 nmol of the alkanethiol probe was first lyophilized, and then, the disulfide cleavage of the probe was achieved by resuspension in 100 μL of 0.1 M dithiothreitol (Sigma Aldrich), dissolved in 0.17M phosphate buffer (pH 8), for 2–3 hours with occasional vortexing, while being wrapped in foil. The cleaved probes were then purified using NAP-5 columns (GE Healthcare Illustra) according to the manufacturer’s instructions. The concentration of the probes after cleavage was measured using Beer–Lambert law from their absorbance at 260 nm. Freshly cleaved probes were then added to the AuNP solution with the ratio of ~1 OD/mL nanoparticles. After 20 minutes incubation at room temperature, phosphate buffer and sodium dodecyl sulfate were added to a final concentration of 0.01M and 0.1%, respectively. Then, salting process was done by adding three portions of sodium chloride solution at 30 minutes intervals to bring the final concentration of sodium chloride to 0.3M. The solution was incubated overnight with very gentle shaking. Centrifugation (14,000 rpm for 30 minutes) was performed five times to wash and remove the excess probes. The concentration of the unconjugated probes was measured in the supernatant to calculate their number. The gold pellet was resuspended in 3 mL of assay buffer (0.01M phosphate, 0.15M NaCl, and 0.1% SDS, pH 7.4). The color of the solution containing the functionalized AuNPs was not different from the original AuNPs and no aggregation was observed, indicating the efficiency of the conjugation process. The probe-functionalized AuNPs were characterized by UV-Vis spectroscopy (Plate Reader BMG Lab tech, firm version 1.32, software version 3.00R2 and serial no 415-1587).
Synthesis and characterization of cysteamine-functionalized AuNPs
Cysteamine AuNPs were prepared according to Kim et al43 with minor modifications. Four hundred microliters of 0.15M cysteamine solution was added to 30 mL of 0.001M HAuCl4·H2O and stirred for 20 minutes. Then 20 μL of freshly prepared 0.01M NaBH4 solution was added under dark conditions, with vigorous stirring, twice, with 20-minute intervals. The solution was left to stir vigorously in the dark for 6 hours until AuNPs were formed, which were then stored at 4°C. The formed nanoparticles were then characterized using HR-TEM (JEOL-2100), UV-Vis spectroscopy (Plate Reader BMG Lab tech, firm version 1.32, software version 3.00R2 and serial no 415-1587), and dynamic light scattering (Zetasizer Nano ZS90, Malvern Instrument Ltd. UK).
RKOs and mouse embryonic fibroblast (MEF) cell lines propagation
RKOs cancer cell lines (Homo sapiens, tissue: colon, carcinoma) were purchased from ATCC, LGC Standards, Middlesex, UK.44 They were cultured at 37°C and 5% CO2 in RPMI-1640 medium, supplemented with 10% FBS, 1% l-glutamine, and 1% penicillin/streptomycin. TDP2 knockout mice and MEF were generated, maintained, and genotyped as described previously in our works15,45,46 in an outbreed mixed 129 Ola and C57BL/6 background. The use of these cell lines was approved by the Institutional Review Board at the University of Sussex as per previous publications and subsequently by the Center of Genomics, Zewail City of Science and Technology Committee.
Total RNA and specific transcripts extraction
RNeasy mini kit (Qiagen, Cat No: 74106) was used for total RNA extraction following manufacturer’s instructions and then each transcript was further purified by each target-specific probe-functionalized MNPs. Approximately 100 ng of the extracted RNA was denatured by heating at 72°C for 2 minutes and then mixed with the functionalized MNPs at 1,000 rpm for 15–20 minutes at 60°C. The MNPs were then washed with assay buffer (0.01M phosphate buffer, 0.1 M NaCl, and 0.01% SDS, pH 7.4) which was preheated at 50°C and collected at the bottom of the tube by the action of a permanent external magnet. This washing step was repeated for three times. Elution of the desired target mRNA was done by adding deionized water, and heating at 72°C for 2 minutes then rapidly collecting the MNPs by an external magnet. The supernatant containing the target mRNA was collected and preserved at −80°C.
GAG assay for mRNA transcripts detection and quantification
The assay was performed by mixing 5 μL of the target-specific nanoprobe with 10 μL of the mRNA sample and heating at 95°C for 3 minutes followed by incubating at room temperature for 5 minutes. Ten microliters of 1 nM cysteamine-functionalized AuNPs was then added to the solution and mixed well. The solution color was developed immediately and observed by naked eye while mixing. The color was stable for ~30 minutes, depending on the RNA concentration. The solutions were scanned spectrophotometrically from 400 to 750 nm (Plate Reader BMG Lab tech, firm version 1.32, software version 3.00R2 and serial no 415-1587).
Quantification of TOP1 and TDP2 mRNA transcripts using real-time PCR
A standard curve was performed using serial dilutions of the amplicons generated from the mRNA extracted by the MNPs for each target. After mRNA extraction, 4 μL of the mRNA was taken for the cDNA reaction (total reaction volume 40 μL) using hexamer primer by iScript cDNA synthesis kit (Biorad, Cat No: 170–8891) according to the manufacturer’s instructions. Then, 2 μL of the cDNA reaction was taken for the qPCR reaction (QuantStudio Real-Time qPCR) for both TOP1 and TDP2 in two different reactions (10 μL total reaction volume). Sequences for the primers and details of the thermal cycler are described in the supporting information.
Quantification of TOP1 and TDP2 mRNA transcripts using GAG method
Quantification of the targets’ transcripts using the GAG method was performed by preparing serial dilutions of each transcript concentration (101–104 copies/reaction volume), and quantified using the GAG assay. The spectral absorbance for each concentration was scanned spectrophotometrically in duplicate, and the ratio of the nonaggregated nanoparticles at wavelength (λ) of 530 nm to the aggregated nanoparticles at λ of 620 nm (A530/A620) was recorded and used to generate the standard curve, in which the A530/A620 ratio was plotted against the log RNA concentration.
Results and discussion
Synthesis, functionalization, and characterization of MNPs
The MNPs were synthesized according to the coprecipitation method and were then functionalized with an amino functional group through silanization with 3-APTES. Functionalization of MNPs with amino groups was confirmed by their Fourier transform infrared spectra. The band at 1,050 cm−1 corresponds to the vibration of Si-O structure. The band at 2,900 cm−1 reveals the anchored propyl group of the APTES. The N-H bending and stretching vibration of the free amino groups is shown at 1,620 cm−1 and the characteristic fork-shaped band at 3,400 cm−1. In addition, the MNPs and MNPs-APTES were characterized by TEM, which showed that functionalization with APTES did not affect their average size and particles uniformity and homogeneity (Figure 2).
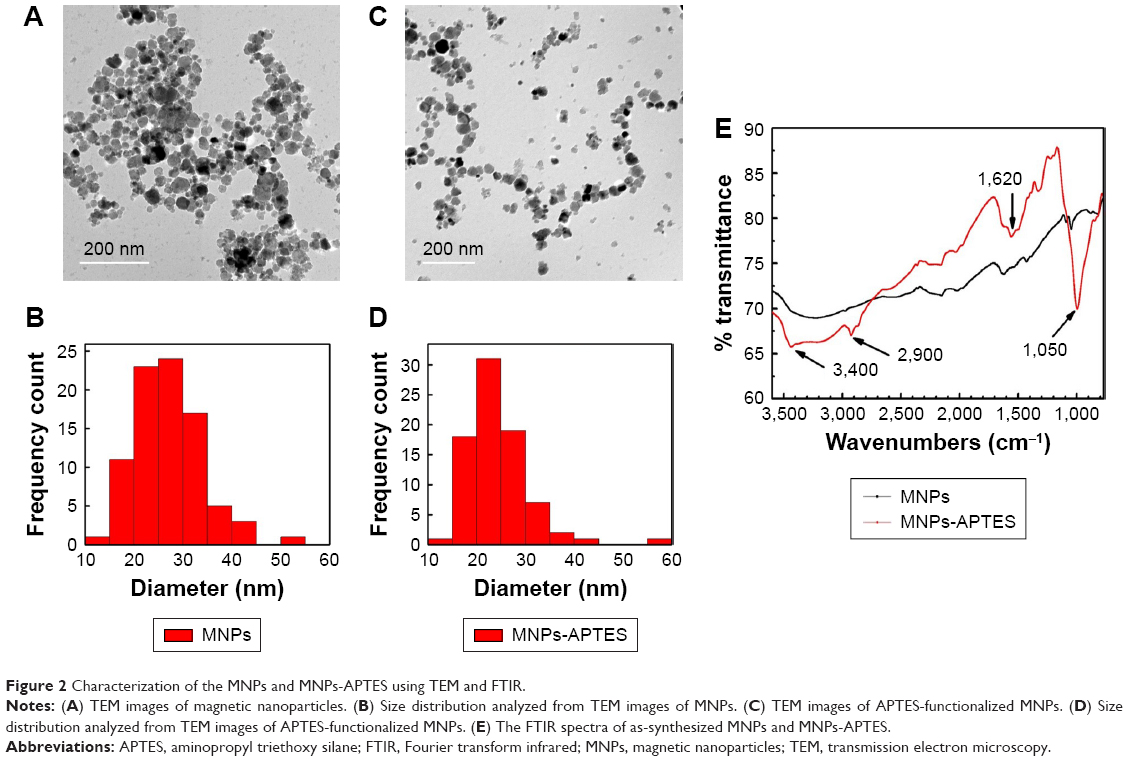 | Figure 2 Characterization of the MNPs and MNPs-APTES using TEM and FTIR. |
Synthesis, functionalization, and characterization of AuNPs
TEM analysis revealed that the citrate-capped and cysteamine-functionalized AuNPs were spherical in shape and uniformly distributed. The images were then analyzed using Image 1.41J software package (Wayne Rasband, National Institutes of Health USA. http://rsb.info.nih.gov/ij/Java1.6.0_05), to determine the size distribution of the particles. The citrate-capped and cysteamine-functionalized AuNPs had diameters of 12±2 and 40±5 nm, respectively (Figure 3). Zeta potential of the citrate-capped and the cysteamine-functionalized AuNPs were found to be −45.2 and +35.5 mV, respectively (Figure S1).
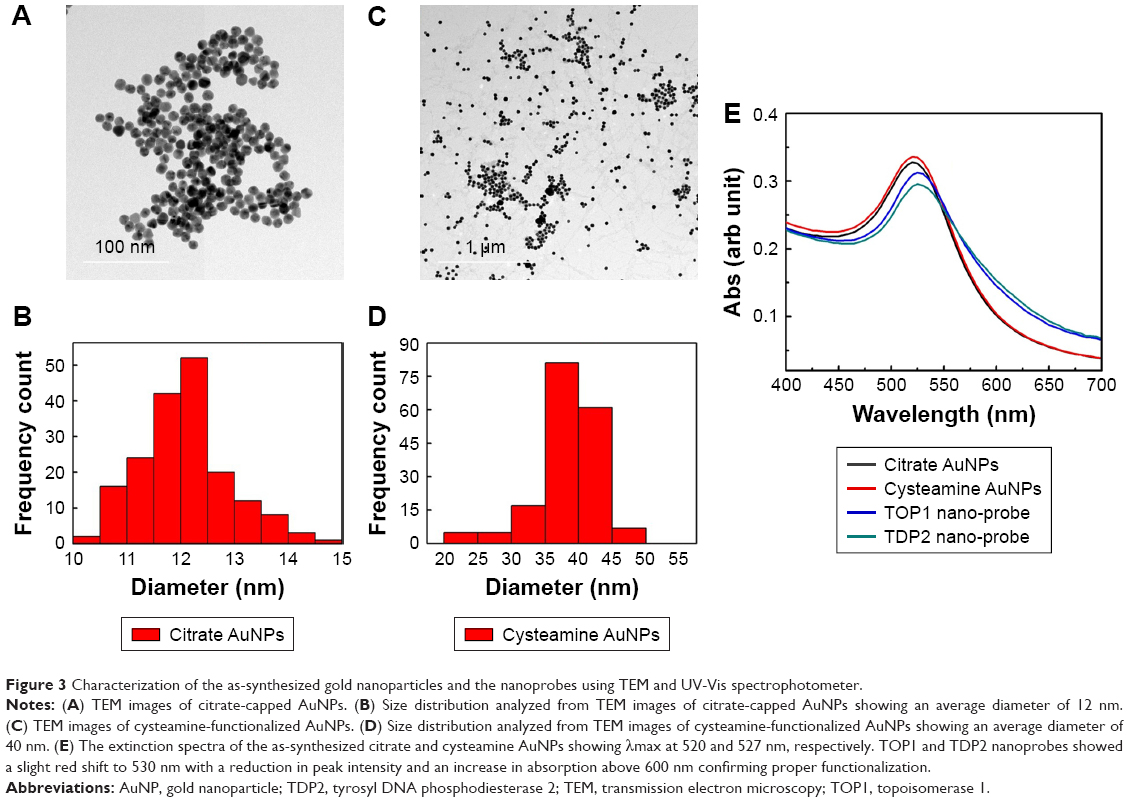 | Figure 3 Characterization of the as-synthesized gold nanoparticles and the nanoprobes using TEM and UV-Vis spectrophotometer. |
TOP1 and TDP2 transcript-specific nanoprobes were synthesized by functionalizing the citrate AuNPs with the alkanethiol-modified probes in two separate tubes, utilizing the advantage of the formation of a strong covalent bond between the thiol functional group and the gold surface.47 The synthesized nanoprobes were stable against low salt concentration and/or positively charged cysteamine-functionalized AuNPs induced aggregation. The UV-Vis spectrum of the as-synthesized citrate AuNPs revealed a λmax at 520 nm, which was red-shifted to 530 nm after being functionalized with the target-specific probes. Furthermore, the cysteamine AuNPs revealed a λmax at 527 nm (Figure 3E). Comparing the spectrum of the citrate and cysteamine AuNPs against the nanoprobes spectrum in Figure 3E, it is obvious that the aggregated populations of the AuNPs in the nanoprobes extinction spectra are slightly higher than the as-synthesized citrate AuNPs, confirming the increase in size of the citrate AuNPs after functionalization with the probes. The molar concentration of the citrate and cysteamine AuNPs was calculated according to Liu et al.48 to be about 3.5 and 1 nM, respectively. The amount of probes conjugated to the citrate AuNPs was calculated according to Hill and Mirkin39 and Hurst et al42 to be about 1.2 and 1.3 nmol for the TOP1 and TDP2 nanoprobes, respectively. Accordingly, about 130 and 115 probes of TDP2 and TOP1, respectively, were conjugated per nanoparticle. This slight difference between the two probes in terms of the conjugation amount has shown no significant effect on the assay procedures and quantification as discussed later.
Quantification using the GAG approach of endogenous transcripts is quite challenging, as the detection and quantification is based on a probe of 22 bases long, which may increase the probabilities of false positive results. Therefore, MNPs functionalized with a target-specific probe have been employed herein for enrichment of the RNA pool with the target mRNA to minimize false positives and ensure the accuracy and the precision of the assay. After magnetic extraction of TOP1 and TDP2 transcripts from the human colorectal cancer RKO cell lines, a portion of each transcript was quantified using the absolute standard curve generated by the real-time PCR. Then, serial dilutions of the RNA were conducted and measured using the GAG assay. Our data indicate a linear correlation between the ratio of absorbance at wavelength 530 nm/absorbance at wavelength 620 nm for the target’s concentrations between 101 and 104 copies per reaction for both TOP1 and TDP2 (Figure 4). These data have been produced blindly at least twice by two independent researchers. The data confirm the reproducibility, sensitivity, and specificity of the GAG assay in the detection and quantification of any RNA using specific probes. The detection limit of the assay has been found to be ten copies per reaction. Linear association has been found between the GAG method and the real-time PCR for TOP1 and TDP2 detection/quantification in the range of 101–104 copies (Figure 5).
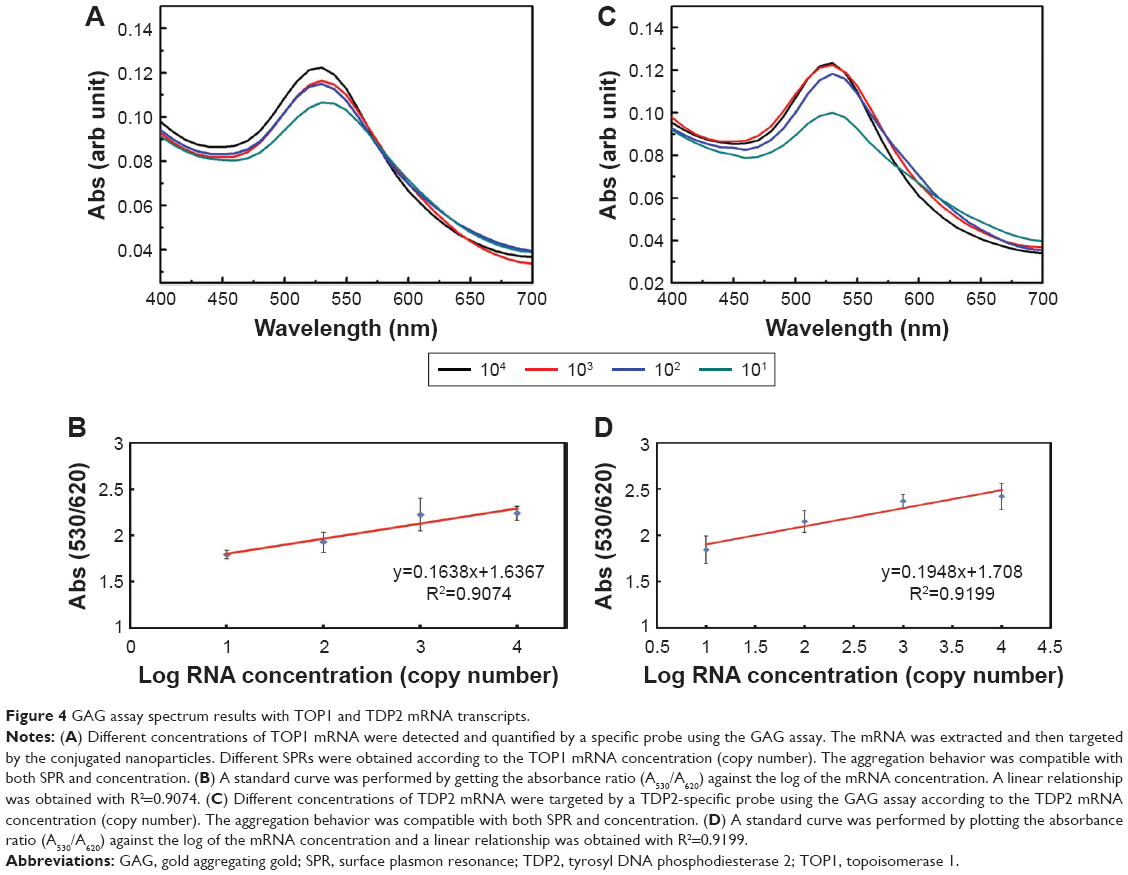 | Figure 4 GAG assay spectrum results with TOP1 and TDP2 mRNA transcripts. |
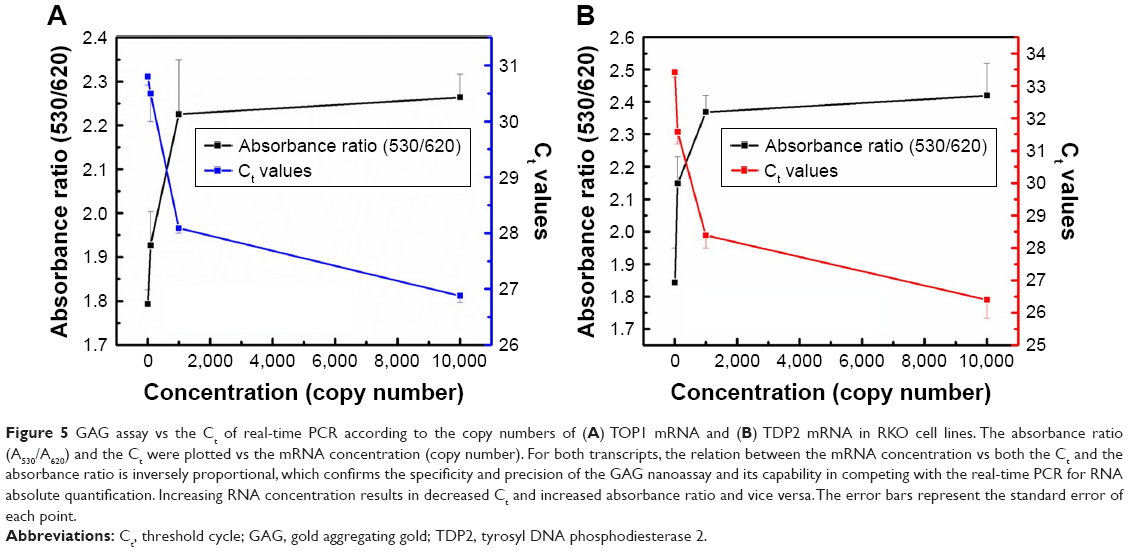 | Figure 5 GAG assay vs the Ct of real-time PCR according to the copy numbers of (A) TOP1 mRNA and (B) TDP2 mRNA in RKO cell lines. The absorbance ratio (A530/A620) and the Ct were plotted vs the mRNA concentration (copy number). For both transcripts, the relation between the mRNA concentration vs both the Ct and the absorbance ratio is inversely proportional, which confirms the specificity and precision of the GAG nanoassay and its capability in competing with the real-time PCR for RNA absolute quantification. Increasing RNA concentration results in decreased Ct and increased absorbance ratio and vice versa. The error bars represent the standard error of each point. |
The melting curves confirming the efficiency and specificity at amplification and the standard curves generated for the TOP1 and TDP2 transcripts are shown in Figures S2–S4.
Absorption performance of MNPs toward targeted mRNA transcripts
The total RNA extract from the cell lines was subjected to MNPs-based extraction and the transcript of interest was enriched through utilizing the MNPs functionalized with the target-specific probe. To investigate the capacity of the MNPs in capturing the mRNA of interest, the absorbance at 260 nm of the total RNA extract, as well as that found in the supernatant, washes, and the final elution after subjection to the MNPs was measured. The total amount of RNA that was found in the final elution was ten times lower than that in the starting total RNA extract. This is expected because the MNPs functionalized with the target-specific probe selectively capture the transcript of interest mainly.
Furthermore, RT-PCR was also conducted on the aforementioned total RNA, supernatant, washes, and the final elute for four mRNA transcripts: TOP1 and TDP2 as well as TOP2 and TDP1, which are structurally and functionally related to both TOP1 and TDP2. Although the final elute contains all the four transcripts, the transcript of interest captured by the MNPs functionalized with the target-specific probe was present in the highest amount. This confirms that the extraction using the MNPs functionalized with the target-specific probe enriches the presence of the target in the final elution. Moreover, the loss of the transcript of interest starts from the first supernatant (after incubation of the MNPs with the total RNA) to the final elute and is for about 20%. This confirms that most of the targeted mRNA transcripts captured by the MNPs are retained until elution.
GAG assay specificity and reproducibility validation
To confirm the specificity and reproducibility of the GAG assay in distinguishing between different transcripts, the assay has been performed on two MEF cell lines, the wild-type and TDP2 knockout cells (Tdp2−/− MEF). Total RNA was extracted from the two cell lines in parallel, and then extracted using MNPs functionalized with TDP2-specific probe. The assay was conducted on the magnetic extracted RNA. Positive results were revealed by the GAG method for the wild-type MEF cell lines and negative for the Tdp2−/− MEF cell lines. The extinction spectra and the assay colors of the wild-type and Tdp2−/− MEFs are shown in Figure 6. Further confirmation was obtained by repeating the assay at three different passages using three independent biologic replicates.
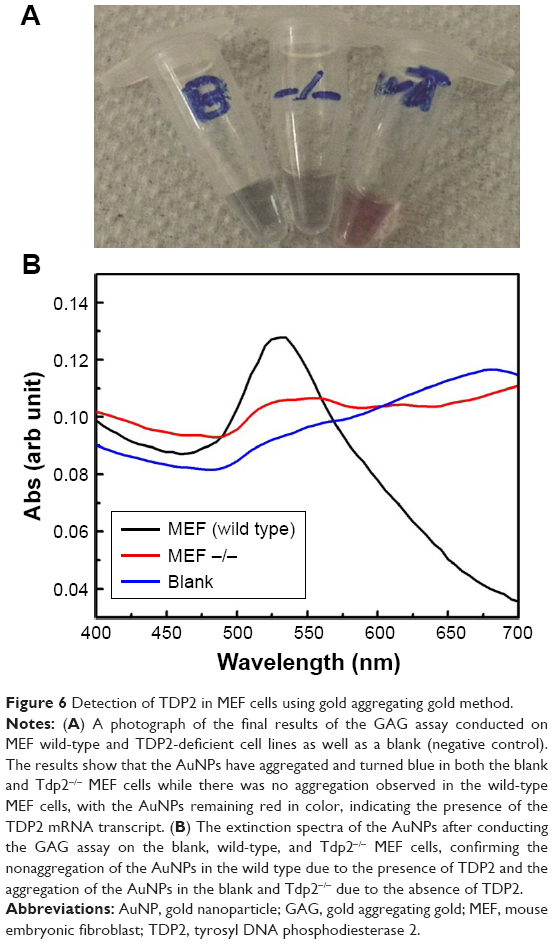 | Figure 6 Detection of TDP2 in MEF cells using gold aggregating gold method. |
Mechanism of GAG assay
After eluting the RNA transcript, it is added to the nanoprobe and denatured at 95°C for 3 minutes. This is necessary to allow the accessibility of the probes to the RNA molecules, through unfolding the RNA tertiary structure. As a result, hybridization between the target mRNA and the complementary probe occurs and when the mixture is subsequently cooled to room temperature, the RNA would then refold to adopt a more favorable, thermodynamically stable form. The folding of the target mRNA around the specific nanoprobe stabilizes it against the aggregation induced by the addition of the cysteamine-functionalized AuNPs as it results in the formation of multiple layers of RNA. Cysteamine-functionalized AuNPs are distributed along the RNA molecules, with their positively charged amino groups interacting electrostatically with the negatively charged phosphate backbone of the target RNA shielding the nanoprobe, hence preventing its aggregation. In the absence of the target RNA, the positively charged cysteamine-functionalized AuNPs would interact with the negatively charged phosphate backbone of the probe functionalized on the AuNPs (nanoprobe), which would bring them in close proximity, resulting in the aggregation of the AuNPs.
Conclusion
In conclusion, we demonstrated the potential of the GAG assay as a biosensor designed to specifically detect and quantitate endogenous genome stability transcripts that are clinically important for both cancer and neurologic disease. Our method is useful for diagnosing and monitoring the progression of disease and can be used as an indicator for response to chemotherapeutic treatment. The developed biosensor could compete with the real-time PCR in measuring gene expression with a detection limit of ten copies of the specific mRNA target. Moreover, the biosensor has the potential in discriminating between the target mRNA in cells expressing or not expressing the desired target. The overall time of the assay is ~30–45 minutes including the mRNA extraction. Moreover, absolute quantification of RNA has been achieved without the tedious and labor-intensive real-time PCR standard curve generation of the RNA target. Therefore, the developed biosensor could be used in small laboratories in rural areas where sophisticated equipment and well-trained personnel are not available.
Acknowledgments
This work was funded by Zewail City Program Grant and Wellcome Trust Investigator Award (103844) to SFEK.
Authors contribution
SMS supervised the experiments and figures preparation. AMA conducted the experiments with help from AAA. All authors wrote and approved the manuscript. SFEK conceived and managed the project. All authors contributed to data analysis, drafting or revising the article, gave final approval of the version to be published, and agree to be accountable for all aspects of the work.
Disclosure
The authors report no conflicts of interest in this work.
References
Ventola CL. Pharmacogenomics in clinical practice: reality and expectations. P T. 2011;36(7):412–450. | ||
Jeggo PA, Pearl LH, Carr AM. DNA repair, genome stability and cancer: a historical perspective. Nat Rev Cancer. 2016;16(1):35–42. | ||
McKinnon PJ. DNA repair deficiency and neurological disease. Nat Rev Neurosci. 2009;10(2):100–112. | ||
Ashour ME, Atteya R, El-Khamisy SF. Topoisomerase-mediated chromosomal break repair: an emerging player in many games. Nat Rev Cancer. 2015;15(3):137–151. | ||
Cortes Ledesma F, El Khamisy SF, Zuma MC, Osborn K, Caldecott KW. A human 5′-tyrosyl DNA phosphodiesterase that repairs topoisomerase-mediated DNA damage. Nature. 2009;461(7264):674–678. | ||
El-Khamisy SF, Saifi GM, Weinfeld M, et al. Defective DNA single-strand break repair in spinocerebellar ataxia with axonal neuropathy-1. Nature. 2005;434(7029):108–113. | ||
Gómez-Herreros F, Schuurs-Hoeijmakers JHM, McCormack M, et al. TDP2 protects transcription from abortive topoisomerase activity and is required for normal neural function. Nat Genet. 2014;46(5):516–521. | ||
Katyal S, Lee Y, Nitiss KC, et al. Aberrant topoisomerase-1 DNA lesions are pathogenic in neurodegenerative genome instability syndromes. Nat Neurosci. 2014;17(6):813–821. | ||
Walker C, Herranz-Martin S, Karyka E, et al. C9orf72 expansion disrupts ATM-mediated chromosomal break repair. Nat Neurosci. 2017;20(9):1225–1235. | ||
Liao C, Beveridge R, Hudson JJR, et al. UCHL3 regulates topoisomerase-induced chromosomal break repair by controlling TDP1 proteostasis. Cell Rep. 2018;23(11):3352–3365. | ||
Mcleod HL, Keith WN. Variation in topoisomerase I gene copy number as a mechanism for intrinsic drug sensitivity. Br J Cancer. 1996;74(4):508–512. | ||
Jansen WJ, Zwart B, Hulscher ST, Giaccone G, Pinedo HM, Boven E. CPT-11 in human colon-cancer cell lines and xenografts: characterization of cellular sensitivity determinants. Int J Cancer. 1997;70(3):335–340. | ||
Stenvang J, Kümler I, Nygård SB, et al. Biomarker-guided repurposing of chemotherapeutic drugs for cancer therapy: a novel strategy in drug development. Front Oncol. 2013;3:313. | ||
Ntai I. TDP2 as a Biomarker of Sensitivity to TOP2 Targeting Agents and As a Novel Therapeutic Target [doctoral thesis]. Brighton: University of Sussex; 2017. | ||
Zeng Z, Sharma A, Ju L, et al. TDP2 promotes repair of topoisomerase I-mediated DNA damage in the absence of TDP1. Nucleic Acids Res. 2012;40(17):8371–8380. | ||
Gómez-Herreros F, Romero-Granados R, Zeng Z, et al. TDP2-dependent non-homologous end-joining protects against topoisomerase II-induced DNA breaks and genome instability in cells and in vivo. PLoS Genet. 2013;9(3):e1003226. | ||
Do PM, Varanasi L, Fan S, et al. Mutant p53 cooperates with ETS2 to promote etoposide resistance. Genes Dev. 2012;26(8):830–845. | ||
Islam MN, Masud MK, Haque MH, et al. RNA biomarkers: diagnostic and prognostic potentials and recent developments of electrochemical biosensors. Small Methods. 2017;1(7):1700131. | ||
Kevil CG, Walsh L, Laroux FS, Kalogeris T, Grisham MB, Alexander JS. An improved, rapid Northern protocol. Biochem Biophys Res Commun. 1997;238(2):277–279. | ||
Alberts B, Johnson A, Lewis JR, Roberts M, Walter K. Molecular Biology of the Cell. 5th ed. Garland Science, NY: Taylor & Francis Group; 2008. | ||
Wu MF, Wagner D. RNA in situ hybridization in Arabidopsis. Methods Mol Biol. 2012;883:75–86. | ||
Baker M. RNA imaging in situ. Nat Methods. 2012;9(8):787–790. | ||
Goldrick M, Kessler D. RNA analysis by nuclease protection. Curr Protoc Neurosci. 2003;Chapter 5:Unit 5.1. | ||
Wong ML, Medrano JF. Real-time PCR for mRNA quantitation. Biotechniques. 2005;39(1):75–85. | ||
Bustin SA. Absolute quantification of mRNA using real-time reverse transcription polymerase chain reaction assays. J Mol Endocrinol. 2000;25(2):169–193. | ||
Whelan JA, Russell NB, Whelan MA. A method for the absolute quantification of cDNA using real-time PCR. J Immunol Methods. 2003;278(1–2):261–269. | ||
Fronhoffs S, Totzke G, Stier S, et al. A method for the rapid construction of cRNA standard curves in quantitative real-time reverse transcription polymerase chain reaction. Mol Cell Probes. 2002;16(2):99–110. | ||
Cordeiro M, Ferreira Carlos F, Pedrosa P, Lopez A, Baptista PV. Gold nanoparticles for diagnostics: advances towards points of care. Diagnostics. 2016;6(4):E43. | ||
Huang X, Jain PK, El-Sayed IH, El-Sayed MA. Gold nanoparticles: interesting optical properties and recent applications in cancer diagnostics and therapy. Nanomedicine. 2007;2(5):681–693. | ||
Li H, Rothberg L. Detection of specific sequences in RNA using differential adsorption of single-stranded oligonucleotides on gold nanoparticles. Anal Chem. 2005;77(19):6229–6233. | ||
Larguinho M, Baptista PV. Gold and silver nanoparticles for clinical diagnostics – from genomics to proteomics. J Proteomics. 2012;75(10):2811–2823. | ||
Thaxton CS, Georganopoulou DG, Mirkin CA. Gold nanoparticle probes for the detection of nucleic acid targets. Clin Chim Acta. 2006;363(1–2):120–126. | ||
Koo KM, Carrascosa LG, Shiddiky MJ, Trau M. Amplification-free detection of gene fusions in prostate cancer urinary samples using mRNA-gold affinity interactions. Anal Chem. 2016;88(13):6781–6788. | ||
Liu S, Wei W, Wang Y, Fang L, Wang L, Li F. Ultrasensitive electrochemical detection of nucleic acid by coupling an autonomous cascade target replication and enzyme/gold nanoparticle-based post-amplification. Biosens Bioelectron. 2016;80:208–214. | ||
Shawky SM, Awad AM, Allam W, Alkordi MH, El-Khamisy SF. Gold aggregating gold: a novel nanoparticle biosensor approach for the direct quantification of hepatitis C virus RNA in clinical samples. Biosens Bioelectron. 2017;92:349–356. | ||
Kouassi GK, Irudayaraj J. Magnetic and gold-coated magnetic nanoparticles as a DNA sensor. Anal Chem. 2006;78(10):3234–3241. | ||
Kouassi GK, Irudayaraj J, McCarty G. Activity of glucose oxidase functionalized onto magnetic nanoparticles. Biomagn Res Technol. 2005;3(1):1. | ||
Liu Y, Li Y, Li XM, He T. Kinetics of (3-aminopropyl)triethoxylsilane (APTES) silanization of superparamagnetic iron oxide nanoparticles. Langmuir. 2013;29(49):15275–15282. | ||
Hill HD, Mirkin CA. The bio-barcode assay for the detection of protein and nucleic acid targets using DTT-induced ligand exchange. Nat Protoc. 2006;1(1):324–336. | ||
Turkevich J. Colloidal gold. Part I. Gold Bull. 1985;18(3):86–91. | ||
Turkevich J. Colloidal gold. Part II. Gold Bull. 1985;18(4):125–131. | ||
Hurst SJ, Lytton-Jean AK, Mirkin CA. Maximizing DNA loading on a range of gold nanoparticle sizes. Anal Chem. 2006;78(24):8313–8318. | ||
Kim JW, Kim JH, Chung SJ, Chung BH. An operationally simple colorimetric assay of hyaluronidase activity using cationic gold nanoparticles. Analyst. 2009;134(7):1291–1293. | ||
Meisenberg C, Ashour ME, El-Shafie L, et al. Epigenetic changes in histone acetylation underpin resistance to the topoisomerase I inhibitor irinotecan. Nucleic Acids Res. 2017;45(3):1159–1176. | ||
Katyal S, El-Khamisy SF, Russell HR, et al. TDP1 facilitates chromosomal single-strand break repair in neurons and is neuroprotective in vivo. Embo J. 2007;26(22):4720–4731. | ||
Chiang SC, Meagher M, Kassouf N, et al. Mitochondrial protein-linked DNA breaks perturb mitochondrial gene transcription and trigger free radical-induced DNA damage. Sci Adv. 2017;3(4):e1602506. | ||
Delong RK, Reynolds CM, Malcolm Y, Schaeffer A, Severs T, Wanekaya A. Functionalized gold nanoparticles for the binding, stabilization, and delivery of therapeutic DNA, RNA, and other biological macromolecules. Nanotechnol Sci Appl. 2010;3:53–63. | ||
Liu X, Atwater M, Wang J, Huo Q. Extinction coefficient of gold nanoparticles with different sizes and different capping ligands. Colloids Surf B Biointerfaces. 2007;58(1):3–7. |
Supplementary materials
Molar concentration calculations
Molar concentration of the citrate-capped and cysteamine-functionalized AuNPs was calculated using equations A.1 and A.2, assuming that all the gold ions have been consumed in the reaction and the particles are spherical in shape forming face-centered cubic (FCC) phase within the AuNPs.1
|
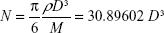
where N is the average number of gold atoms per particle, ρ is the density for FCC gold (19.3 g/cm3), M is the atomic weight of gold (197 g/mol), and D is the average diameter, in nanometer, for the AuNPs as analyzed from the TEM images.
Then, the molar concentration is calculated according to the following equation:
|

in which Ntotal is the number of gold nanoparticles in the reaction volume, N is the average number of gold atoms calculated from equation A.1, whereas V is the volume of the reaction solution in liters, and NA is Avogadro’s number.
Characterization of citrate-capped and cysteamine-functionalized gold nanoparticles
Zeta potential of the synthesized AuNPs was recorded by zeta Sizer. Each sample was measured three times and scanned 100 times for each measurement, and both mean and SD for each sample was calculated. The zeta potential of citrate and cysteamine AuNPs is shown in Figure S1.
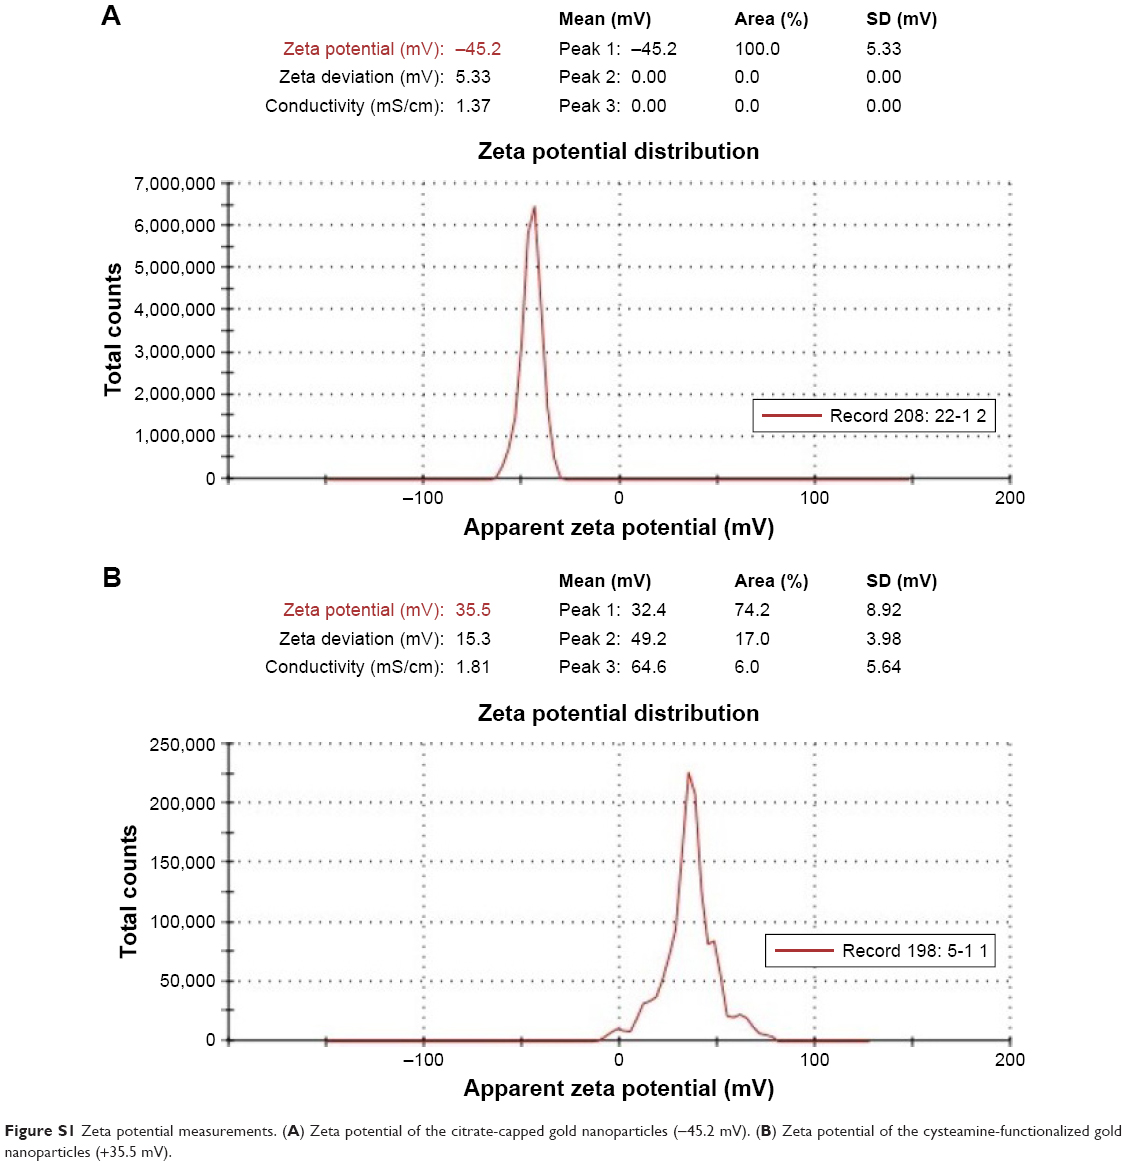 | Figure S1 Zeta potential measurements. (A) Zeta potential of the citrate-capped gold nanoparticles (−45.2 mV). (B) Zeta potential of the cysteamine-functionalized gold nanoparticles (+35.5 mV). |
Generation of absolute standard curves for quantification of TOP1 and TDP2 transcripts using real-time PCR
For TOP1, the forward primer was 5′GAAGTCCGGCATGATAACAAGG′3, whereas the reverse primer was 5′AGTCTTCTCGATACTGGTTCCG′3. On the other hand, for TDP2, the forward primer was 5′AGCCCAAGACCTATGTTGACC′3, whereas the reverse primer was 5′CTAAGTAGGAACACACCCCTC′3. The annealing temperature was adjusted specifically for each transcript to be 57.3°C for TOP1 and 55.3°C for TDP2. The thermal cycler for TOP1 was 95°C for 15 seconds, 57.3°C for 60 seconds, and 95°C for 15 seconds for 35 cycles, whereas the thermal cycler for TDP2 was 95°C for 15 seconds, 55.3°C for 60 seconds, and 72°C for 20 seconds for 35 cycles.
All the reaction volume for both transcripts was taken and run on agarose gel, and the specified band was excised from the gel and purified by the QiAquick Gel Extraction Kit (Cat No 28706) according to the manufacturer’s instructions. Further purification was done for the amplicons using QiAquick PCR Purification Kit (Cat No 28104), according to the manufacturer’s instructions. These processes were repeated three times to get a high yield and concentration of the PCR product for both transcripts. The final amplicon concentrations were measured using UV at 260 nm, and the copy numbers were calculated according to the base pairs of each amplicon to be 187 and 183 for TOP1 and TDP2, respectively.
Serial dilutions of the purified amplicons were then performed for TOP1 and TDP2 (101–1010), and qPCR with the same abovementioned cycling conditions was performed for each dilution and standard curves for TOP1 and TDP2 were generated as shown in Figures S3 and S4, respectively. These standard curves were then used for calculating the copy numbers of RNA in the nanoassay.
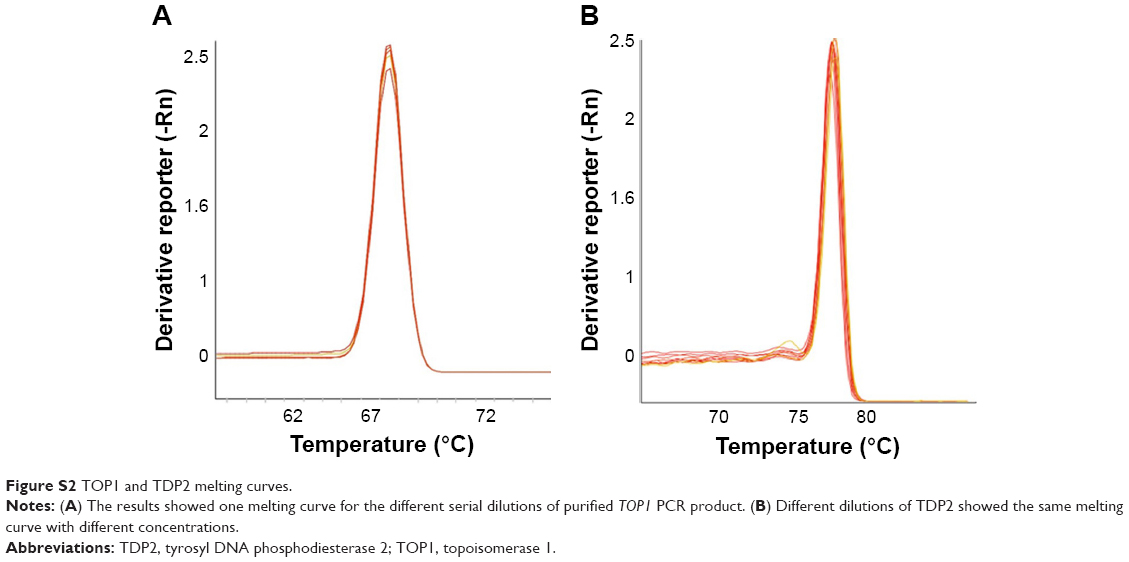 | Figure S2 TOP1 and TDP2 melting curves. |
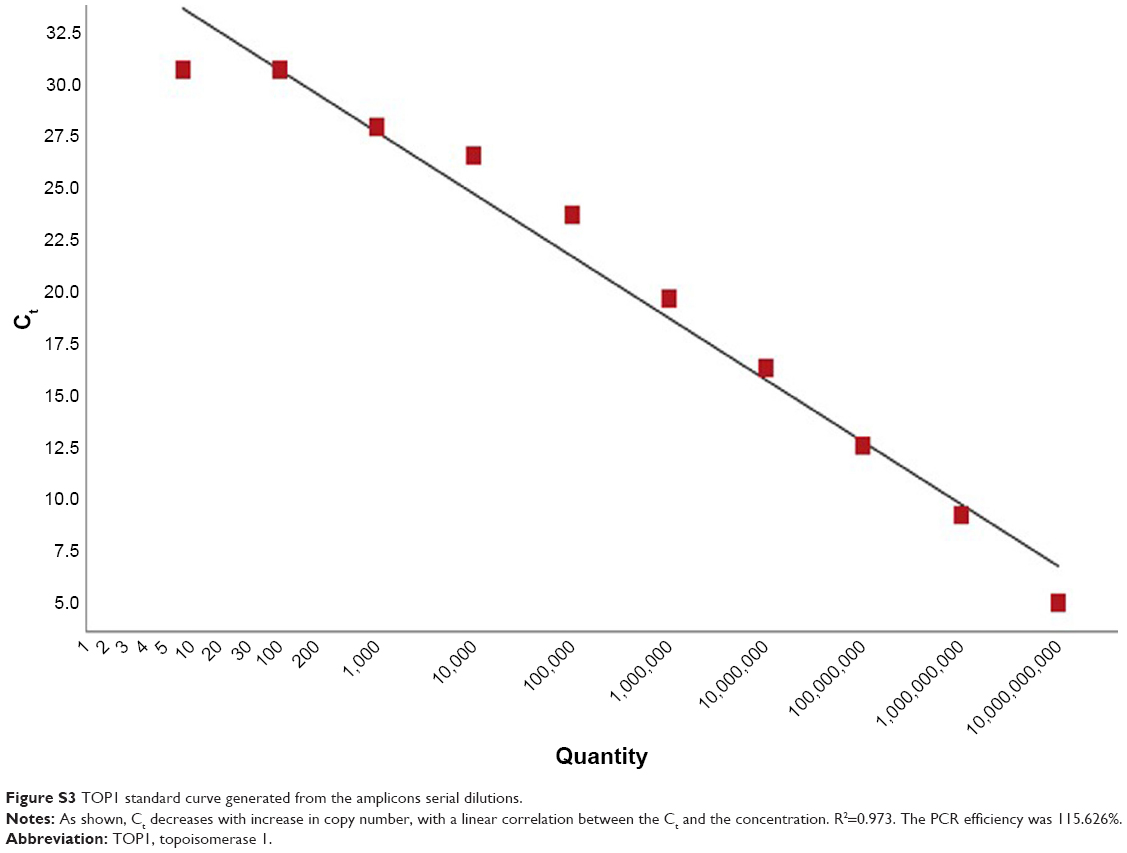 | Figure S3 TOP1 standard curve generated from the amplicons serial dilutions. |
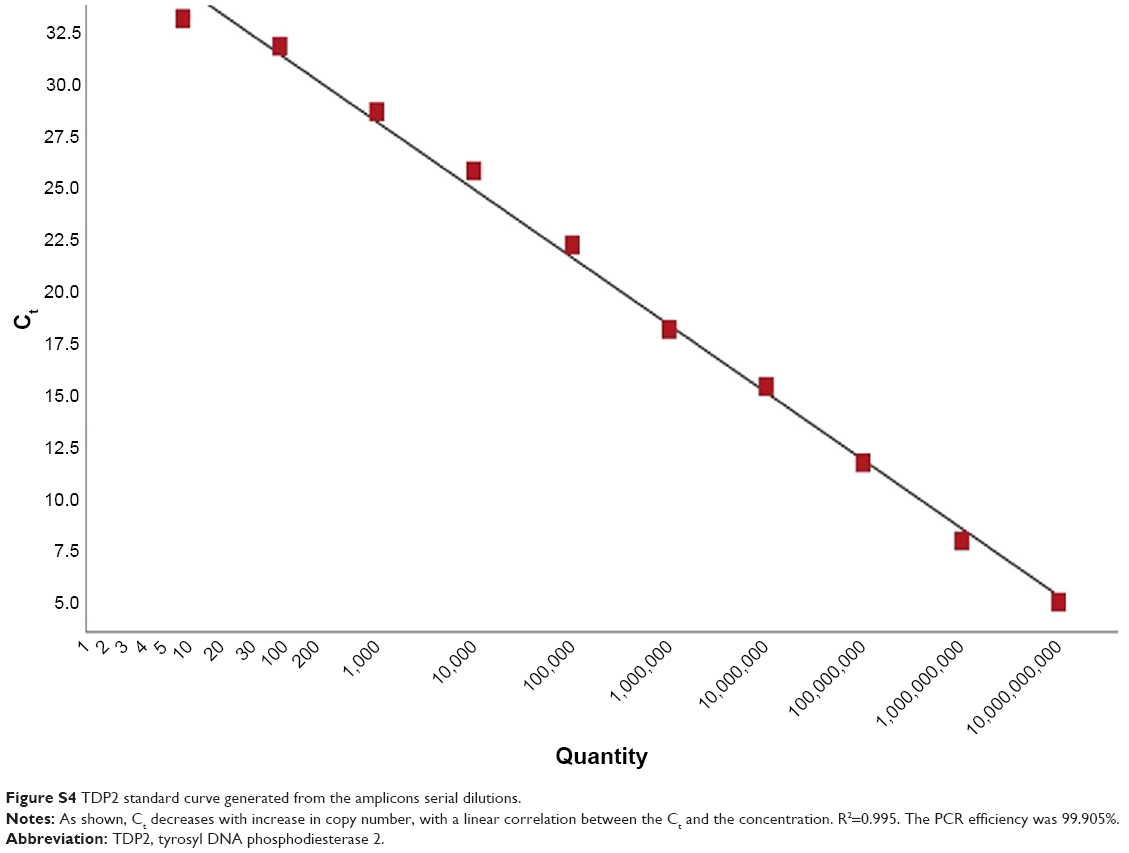 | Figure S4 TDP2 standard curve generated from the amplicons serial dilutions. |
Reference
Liu X, Atwater M, Wang J, Huo Q. Extinction coefficient of gold nanoparticles with different sizes and different capping ligands. Colloids Surf B Biointerfaces. 2007;58(1):3–7. |
 © 2018 The Author(s). This work is published by Dove Medical Press Limited, and licensed under a Creative Commons Attribution License.
The full terms of the License are available at http://creativecommons.org/licenses/by/4.0/.
The license permits unrestricted use, distribution, and reproduction in any medium, provided the original author and source are credited.
© 2018 The Author(s). This work is published by Dove Medical Press Limited, and licensed under a Creative Commons Attribution License.
The full terms of the License are available at http://creativecommons.org/licenses/by/4.0/.
The license permits unrestricted use, distribution, and reproduction in any medium, provided the original author and source are credited.