")
Back to Journals » Cancer Management and Research » Volume 12
Glucose Transporter-1 Cooperating with AKT Signaling Promote Gastric Cancer Progression
Authors Zhou D , Jiang L, Jin L, Yao Y, Wang P, Zhu X
Received 27 February 2020
Accepted for publication 7 May 2020
Published 3 June 2020 Volume 2020:12 Pages 4151—4160
DOI https://doi.org/10.2147/CMAR.S251596
Checked for plagiarism Yes
Review by Single anonymous peer review
Peer reviewer comments 2
Editor who approved publication: Professor Seema Singh
Diyuan Zhou,1,* Linhua Jiang,1,* Lichen Jin,1,* Yizhou Yao,1 Peijie Wang,2 Xinguo Zhu1
1Department of General Surgery, The First Affiliated Hospital of Soochow University, Suzhou, Jiangsu, People’s Republic of China; 2Institute of Mental Health, The Affiliated Guangji Hospital of Soochow University, Suzhou, Jiangsu, People’s Republic of China
*These authors contributed equally to this work
Correspondence: Xinguo Zhu
Department of General Surgery, The First Affiliated Hospital of Soochow University, Suzhou, Jiangsu Province 215006, People’s Republic of China
Email [email protected]
Peijie Wang
Institute of Mental Health, The Affiliated Guangji Hospital of Soochow University, Suzhou, Jiangsu Province 215000, People’s Republic of China
Email [email protected]
Objective: High expression of GLUT1 has been observed in numerous solid cancers, facilitating glucose consumption for supporting tumor cell survival. The altered metabolic activity is regulated by series of signaling pathways, including AKT signaling that acts as a key role in glucose metabolism and shows close correlation with the malignant transformation. In this study, we aimed to elucidate the effect of GLUT1 on gastric cancer (GC) and to explore the relation between GLUT1 and AKT signaling.
Materials and Methods: GLUT1, p-AKT, and p-S6k1 expression were investigated by immunohistochemistry and semi-quantitative analysis in 57 paired-GC samples. The relationship of GLUT1 with clinical indexes in GC tissues was investigated. The effects of GLUT1 on the prognosis of GC patients and the underlying mechanism involved were studied by subgroup analysis.
Results: In GC tissues, an obvious increase in GLUT1 expression was observed when compared with that of normal tissues (P< 0.001). Advanced clinicopathological factors (tumor size P=0.019, invasion depth P=0.002, lymph node metastasis P< 0.001, differentiation P=0.024, neural invasion P=0.003, and TNM staging P=0.001) correlated with high GLUT1 levels. GLUT1 was an independent risk factor resulting in poor prognosis (P=0.002, HR=5.132). GLUT1 increased the activation ratio of p-AKT (P< 0.01) and p-S6K1 (P< 0.001) in GC. The expression of p-S6K1 and GLUT1 was positively correlated. (P=0.001, R=0.173). The survival probability of GC patients with GLUT1(+)/p-S6K1(+) was worse when compared to that of GLUT1(+)/p-S6K1(-) or GLUT1(-)/p-S6K1(+) (P< 0.001).
Conclusion: High expression of GLUT1 facilitated GC progression, leading to poor prognosis. Overexpression of GLUT1 activated AKT-S6K1 axis, resulting in adverse outcomes of GC. GLUT1 is novel indicator of GC prognosis and GLUT1 targeted metabolic treatment that has potential therapeutic value.
Keywords: AKT, gastric cancer, GLUT1, S6K1
Introduction
Gastric cancer (GC) is the common gastrointestinal malignancy, and accounts for 8.2% of cancer-related deaths worldwide.1
The prognosis of GC patients remains unsatisfactory, because of the low diagnostic rate of early GC. Many patients were preliminary diagnosed at advanced or metastatic stages. Intensive surgical efforts could improve the survival; however, chemotherapy is still indispensable in the treatment of GC. However, drug resistance during chemotherapy limits treatment efficacy.2,3
Cancer cells display enhanced glucose metabolism and prefer to generate ATP via glycolysis instead of oxidative phosphorylation even in the presence of oxygen.4 The characteristic metabolic phenotype is known as aerobic glycolysis.5 The glucose transporter (GLUT) family includes various homologous membrane proteins that transport glucose from the extracellular environment to the cytosol. Among the GLUT family, GLUT1 is the most widely expressed, and functions in basal glucose uptake.6 Elevated expression of GLUT1 is commonly observed in various types of malignancies.7–10 In GC, GLUT1 overexpression has been associated with higher stages of disease and inferior prognosis.10,12 Moreover, it has been found that GLUT1 promotes cell proliferation and metastasis in GC cells.13 Thus, GLUT1 may be a potential target for GC therapy. However, the underlying mechanism of action of how GLUT1 impacts cellular functions in GC remains unknown.
As one of the most commonly activated signaling pathways in cancer, the threonine-protein kinase (AKT) signaling pathway is crucial for a cellular activity, such as cell proliferation, survival, and differentiation, which is mainly mediated by ribosomal protein S6 kinase 1 (S6K1) downstream of AKT.14,15 Previous studies reported that AKT signaling plays a regulatory role in the surface expression of GLUT1.16,17 In addition, in a recent study, it was revealed that silencing of GLUT1 inhibited cell proliferation and promoted apoptosis by inactivating the AKT signaling pathway in GC cells.18 Although upregulation of the AKT signaling pathway has been frequently observed in GC, the effects of GLUT1 expression on AKT signaling has not yet been elucidated. In this study, we aimed to explore the mechanism of action between GLUT1 and AKT-S6K1 axis in GC, to identify a novel therapeutic target for GC treatment.
Materials and Methods
Patients and Tissue Specimens
A total of 57 patients were included in this study. All patients were diagnosed as having GC in the first affiliated Hospital of Soochow University (Suzhou, China) between 2008 and 2012 without artificial selection. Tissue samples from these patients including GC tissues and normal tissues were detected with immunohistochemistry (IHC).
Inclusion criteria: (a) Diagnosed as gastric adenocarcinoma by postoperative pathological analysis. No prior history of cancer; (b) Have not undergone any type of preoperative therapy, including neoadjuvant chemotherapy, radiotherapy, or other therapy; (c) Agreed to be followed up with unabridged clinical data; (d) Patients were informed about the details of the study and signed informed consent. The diagnosis criteria of clinical stages and pathological features of GC was consistent with the criteria of the American Joint Commission on Cancer. Conduction of this study complied with the human subject regulations of the Soochow University and the Code of Ethics of the World Medical Association (Declaration of Helsinki). The study passed the review of the Research Ethics Committee of The First Affiliated Hospital of the Soochow University (Soochow, China).19
Immunohistochemistry
GLUT1, p-AKT, and p-S6K1 expression in tissue samples was determined by IHC. After excision, tissue samples were immediately fixed in formalin. Then, samples were paraffin-embedded, and cut into 5-μm sections. IHC was performed as described in our previous study.19
The immunoreactive scores (IRSs) were the product of the scores of positively-stained cells and staining intensity. (percentage of positive cells: 0, <5%; 1, 5%-25%; 2, 25%-50%; 3, 50%-75%; 4, >75%; staining intensity: 0, negative; 1, weak; 2, moderate; 3, strong).
The IRSs were classified by grade: negative (0–1), weakly positive (2–3), moderately positive (4–7) and strongly positive (8–12). For further studies, tissues were divided into negative (0–4) and positive (5–12). IHC staining was independently evaluated by two pathologists.
Statistical Analysis
Continuous variables are expressed as the mean ± SD. The Student’s t-test was applied for evaluating the difference in IHC scores between groups. Chi-square (χ2) test or Fisher’s exact test were performed for evaluating the effect of GLUT1 expression with the clinicopathologic index.
Patient’s survival was evaluated by Kaplan-Meier survival analysis and compared by the Log rank test. Univariate analysis with Cox proportional hazard model revealed several significant risk factors. Then, significant risk factors underwent multivariate survival analysis. P < 0.05 was considered statistically significant. All statistical analyses were performed using SPSS 22.0 software (SPSS Inc, Chicago, IL, USA) and GraphPad prism 8. R program (version 3.6.1 for Windows) was used for cluster analysis and nomogram construction. Figures were created using Microsoft PowerPoint.
Results
Increased Expression of GLUT1 in Gastric Cancer
Diverse studies reported that anomalous GLUT1 expression was correlated with cancer development.20–25 GLUT1 expression in paired GC tissue samples was evaluated by IHC, and the IRS was introduced for semiquantitative analysis, estimating GLUT1 expression (Figure 1A). We found significantly increased GLUT1 expression in GC tissues when compared with para-cancerous tissues (Figure 1B). In addition, GLUT1 was also differentially expressed in cancer tissues as demarcated by tumor invasion depth, lymph node metastasis, and TNM staging (Figure 1B–E). We showed that GLUT1 expression was increased by deeper invasion (Figure 1C), lymph node metastasis (Figure 1D) and advanced TNM staging tissues (Figure 1E). Taken together, the above-mentioned results showed that high GLUT1 levels correlated with GC progression.
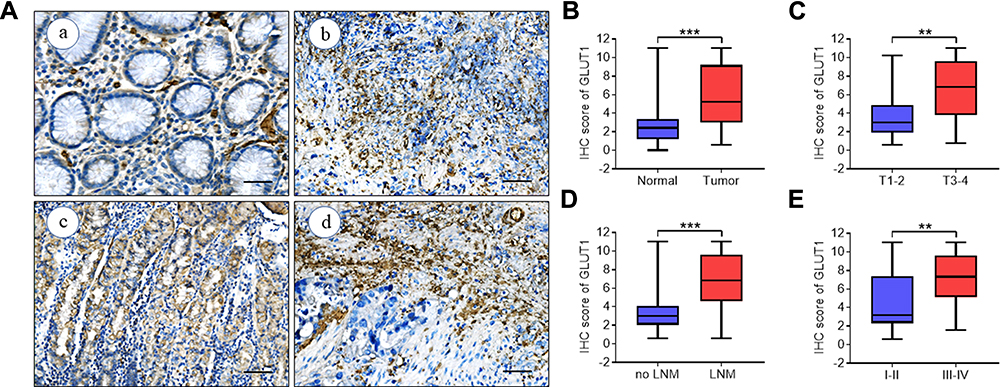 |
Figure 1 GLUT1 expression in GC tissues. (A) Representative immunohistochemistry (IHC) staining of GLUT1 in GC and adjacent normal tissues (scale bar = 100μm, (a) negative (b) weak (c) positive (d) strongly positive). (B-E) Nonparametric t test of IHC scores between (B) normal and tumor tissues, (C) T1-2 and T3-4, (D) no LNM and LNM and (E) TNM Ⅰ-Ⅱand TNM III-Ⅳ (**P<0.01; ***P<0.001). Abbreviations: T, tumor grading; LNM, lymph node metastasis; TNM, TNM staging. |
GLUT1 Promotes Cancer Progression in Gastric Cancer
Subsequently, the relationship between GLUT1 expression and clinicopathological parameters was investigated (Table 1). We found a higher GLUT1 positive ratio in GC tumors with a massive tumor size (P=0.019), advanced invasion depth (P=0.002), lymph node metastasis (P<0.001), poor differentiation (P=0.024), neural invasion (P=0.003), and an advanced TNM stage (P=0.001). However, no significant correlation was observed between GLUT1 expression and other parameters, including gender, age, and venous invasion (P>0.05). Given the elevated GLUT1 expression in GC tissues with advanced clinicopathological parameters, we hypothesized that GLUT1 could facilitate the development of GC.
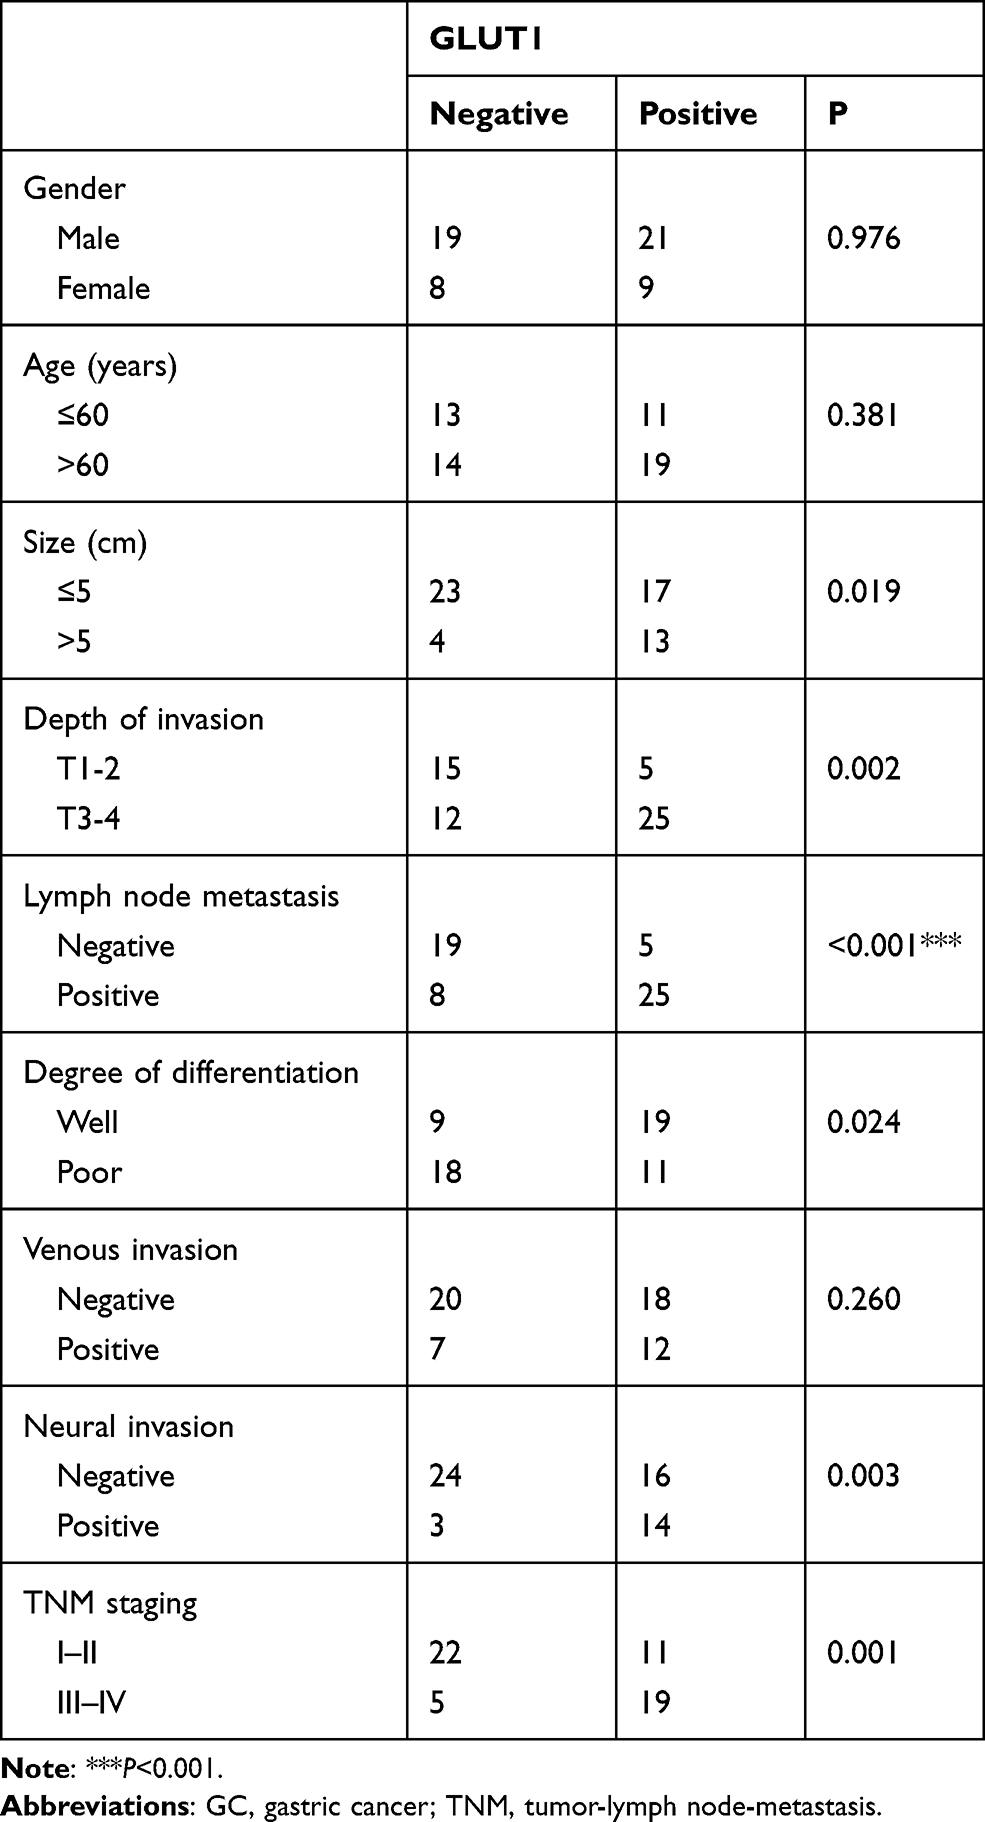 |
Table 1 Association Between GLUT1 Expression and Clinicopathological Factors in 57 Patients with GC |
High GLUT1 Expression Results in Poor Prognosis in Gastric Cancer Patients
To extent our results, the influence of GLUT1 on overall survival (OS) of GC patients was examined. GC patients were divided to subgroups according to their GLUT1 expression level and OS curves were created analyzed. We found a significant decrease in survival of the group with GLUT1 positive results when compared with that of the GLUT1 negative group (P<0.001, Figure 2A).10
Subsequently, patients were discriminated with lymph node metastasis (LNM) (-), LNM (+), TNM Ⅰ-Ⅱ, and TNM III-Ⅳ and OS of patients in each group was evaluated according to GLUT1 expression. The results further confirmed that high GLUT1 expression contributed to poor prognosis of GC patients regardless of LNM (P<0.001, Figure 2B) or without LNM (P=0.016, Figure 2C) and classified into TNM Ⅰ-Ⅱ stage (P<0.001, Figure 2D). However, GLUT1 expression had no effect on the OS of GC patents with TNM III-Ⅳ stage (P=0.212, Figure 2E).
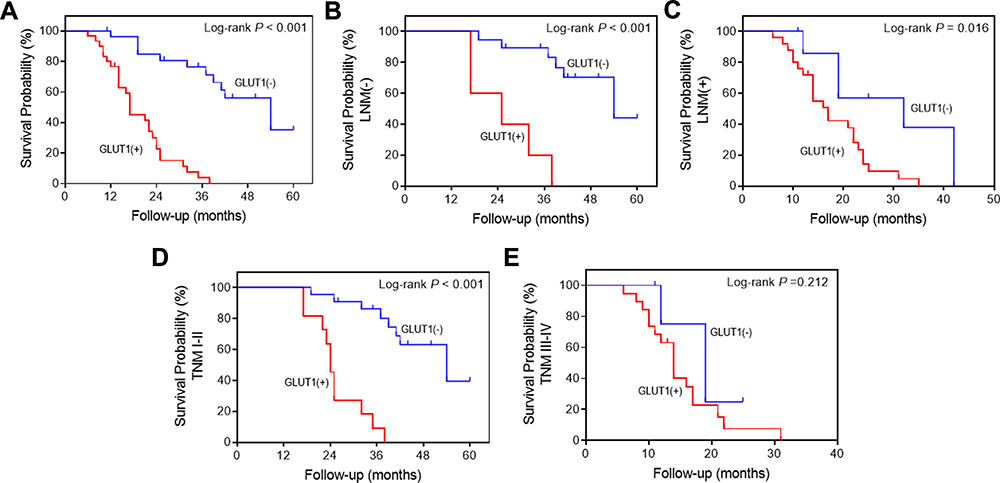 |
Figure 2 Kaplan-Meier survival analysis of postoperative GC patients. (A) Overall survival (OS) curves of 57 postoperative patients according to positive or negative GLUT1 expression. OS curves of postoperative patients in subgroups demarcated with lymph node metastasis (B), without lymph node metastasis (C), TNMⅠ-Ⅱ (D) or TNM III-Ⅳ (E) according to GLUT1 expression. |
The univariate analysis showed several risk factors, including tumor size, invasion depth, lymph node metastasis, venous invasion, neural invasion, TNM stage, and GLUT1 expression, which related with poor prognosis (Table 2). In addition, multivariate analyses indicated that GLUT1 was an independent prognostic factor of survival (Table 2).
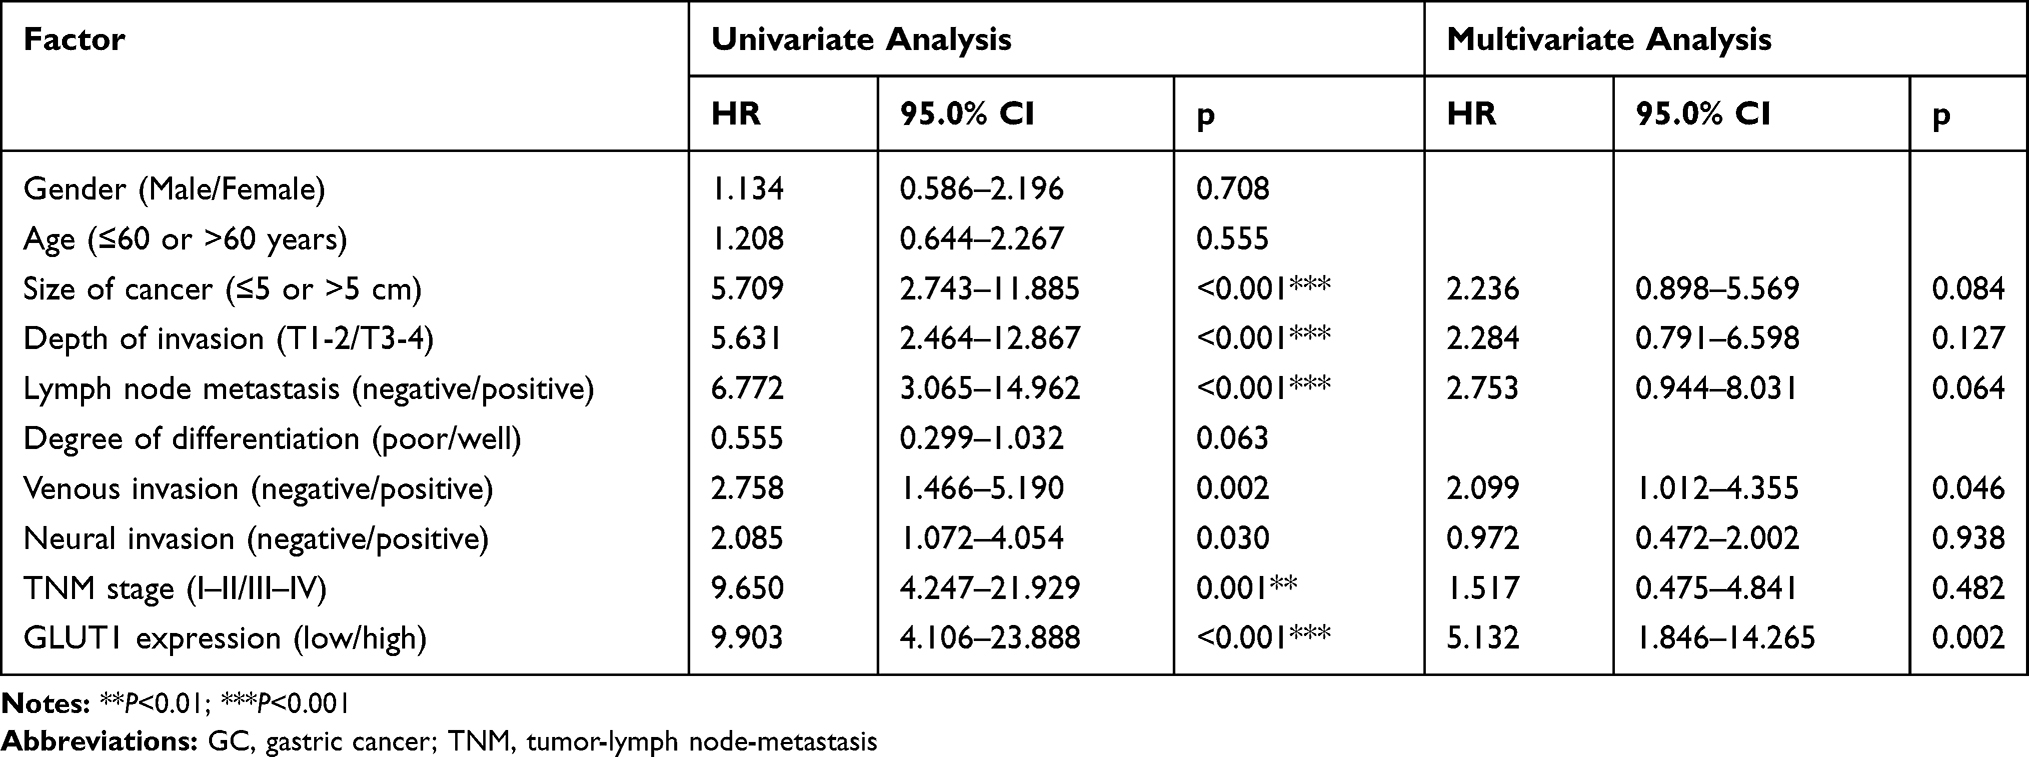 |
Table 2 Results of Univariate and Multivariate Analyses of Patients’ Survival in Gastric Cancer by Cox’s Proportional Hazard Model |
Subgroup Analysis of GLUT1 Expression with Prognostic Factors
As shown in Figure 3, GC patients with overexpressed GLUT1 had a worse prognosis when compared to patients with low GLUT1 levels regardless of age, gender, tumor size, invasion depth, lymph node metastasis, differentiation, venous invasion, neural invasion, and TNM staging (Figure 3).
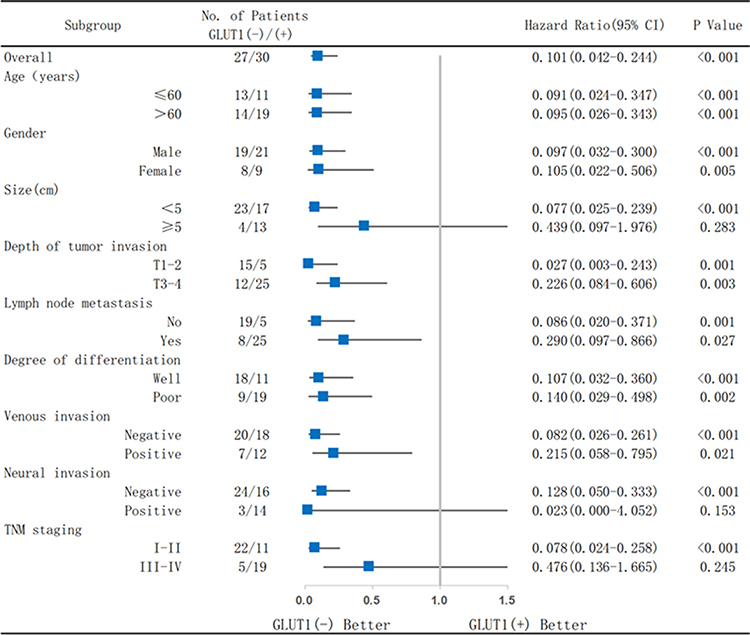 |
Figure 3 Analysis of the effects on survival of GC patients in subgroups according to GLUT1 expression. Patients were divided into groups by age, gender, tumor size, depth of tumor invasion, lymph node metastasis, degree of differentiation, venous invasion, neural invasion, and TNM staging. |
In addition, high GLUT1 levels markedly reduced OS of GC patients with a tumor size <5cm (P<0.001), negative neural invasion (P<0.001), and TNM Ⅰ-Ⅱ stage (P<0.001). However, no significant differences were observed in the respective matched group containing GC patients with a tumor size ≥5cm (P=0.283), positive neural invasion (P=0.153), and TNM III-Ⅳ stage (P=0.245), which could be attributed to a more advanced GC stage. The above-mentioned results confirmed that high expression of GLUT1 could be a poor prognosis index for GC, especially for early stage GC patients.
Overexpression of GLUT1 Activates AKT-S6K1 Axis in Gastric Cancer
Glucose metabolism is closely regulated by AKT signaling and S6K1 acts as one of the downstream components of AKT mediating protein transcription.25 Activation of AKT-S6K1 axis promotes phosphorylation of AKT and S6K1.26,27 Therefore, we further explored the effects of GLUT1 on AKT-SK61 in GC by evaluating p-AKT and p-S6K1 (Figure 4A and D). As shown in Figure 4, high expression of GLUT1 promoted the positive ratio of p-AKT (Figure 4B) and p-S6K1 (Figure 4E). Moreover, p-AKT and p-S6K1 were significantly overexpressed in GC tumors compared to normal tissues. Thus, we speculated that high GLUT1 expression promoted AKT-S6K1 axis activation, and that high level of p-AKT/p-S6K1 contributed to GC development (Figure 4C and F).
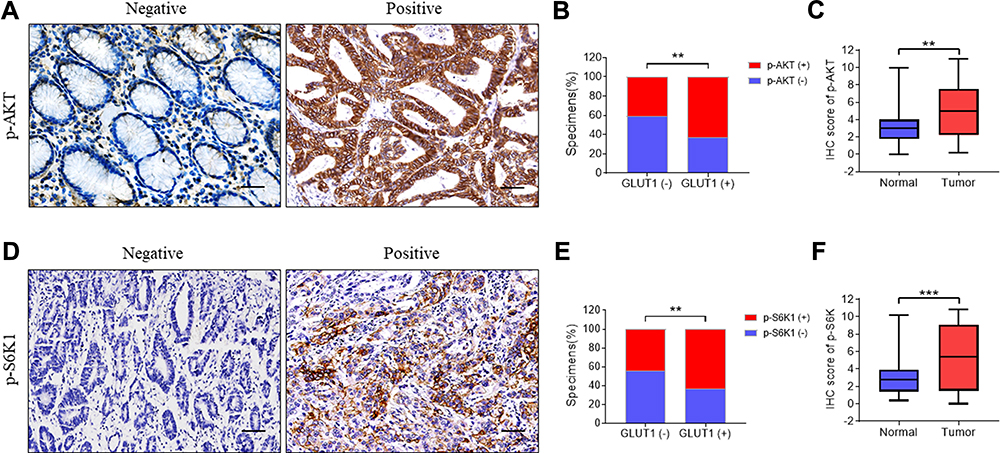 |
Figure 4 Immunohistochemistry of p-AKT and p-S6K1 correlated with GLUT1 expression in GC tissues. Expression of (A) p-AKT and (D) p-S6K1 were evaluated in gastric cancer (GC) tissues by immunohistochemistry (IHC) (scale bar=100μm). Expression analysis of (C) p-AKT and (F) p-S6K in normal and GC tissues. Proportion analysis of (B) p-AKT (-)/p-AKT (+), (E) p-S6K1 (-)/p-S6K1 (+) in GLUT1 (-)/(+) tissues. (**, P<0.01; ***, P<0.001; —, negative; +, positive). |
Cluster analysis revealed the significant difference in IHC scores of GLUT1 and p-AKT between GC tumors and normal tissues (Figure 5A). Normal tissue mainly collects in Cluster 1, whereas tumor tissue mainly collects in Cluster 2 (Figure 5B). Furthermore, correlation analysis showed a significant positive correlation between IHC scores of GLUT1 and p-S6K1 in GC tissues (Figure 5C). OS curves of GC patients in subgroups based on p-S6K1 and GLUT1 expression confirmed the influence of p-S6K1 on GC patients. Our data showed that GC patients with p-SK61(+) had a reduced OS to p-S6K1(-) (Figure 5D). Although GC patients with GLUT1(+)/p-S6K1(+) showed a worse prognosis to anyone low (GLUT1(-)/p-S6K1(+) or GLUT1(+)/p-S6K1(-), Figure 5E), we observed a similar survival probability in GLUT1(+)/p-S6K1(-) and GLUT1(+)/p-S6K1(+) groups, thereby indicating that GLUT1 was the dominant factor resulting in a poor OS (Figure 5F). The above-mentioned variables were integrated in a nomogram, showing the prediction of the 3-year and 5-year survival probability (Figure 6). The nomogram confirmed the massive impetus of GLUT1(+)/p-S6K1(+) to poor prognosis, which was mainly GLUT1(+) mediated because of the analogous rank between GLUT1(+)/p-S6K1(+) and GLUT1(+)/p-S6K1(-) (Figure 6).
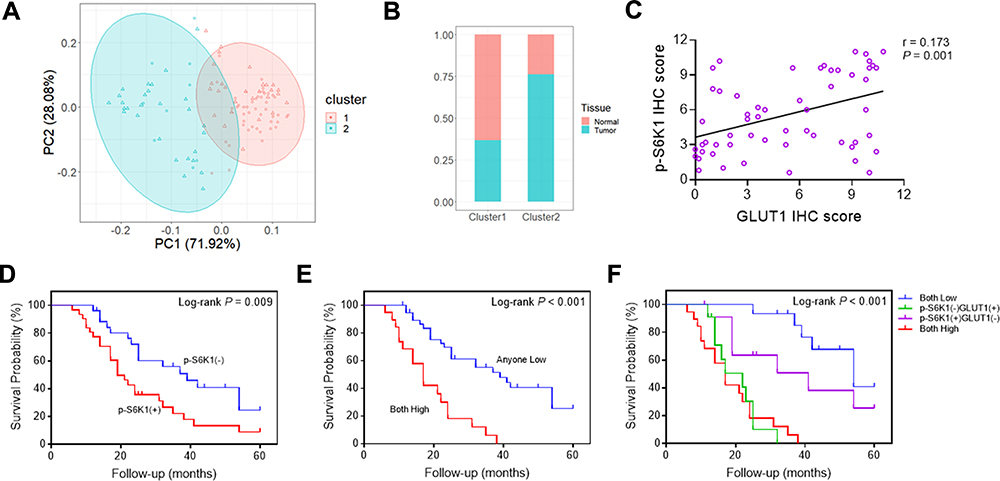 |
Figure 5 Correlation between GLUT1 and S6K1 expression in gastric cancer tissues. (A) Stratification of 57 pairs gastric cancer (GC) tissues and normal tissues into cluster 1 (RED) and cluster (green) according to GLUT1 and S6K1 immunohistochemistry (IHC) staging scores. (B) The percentage of normal and tumor tissues in each cluster. (C) Correlation analysis of p-S6K1 and GLUT1 IHC score in in GC tissues (p=0.001, R=0.173). (D) OS curves of GC patients according to negative or positive p-S6K1 expression. (E) OS curves of GC patients with GLUT1(+)/p-S6K1(+) or GLUT1(-)/p-S6K1(+) and GLUT1(+)/p-S6K1(-). (F) OS curves of GC patients with p-S6K1(-)/GLUT1(-), p-S6K1(-)/GLUT1(+), p-S6K1(+)/GLUT1(-) and p-S6K1(+)/GLUT1(+). (—, negative; +, positive). |
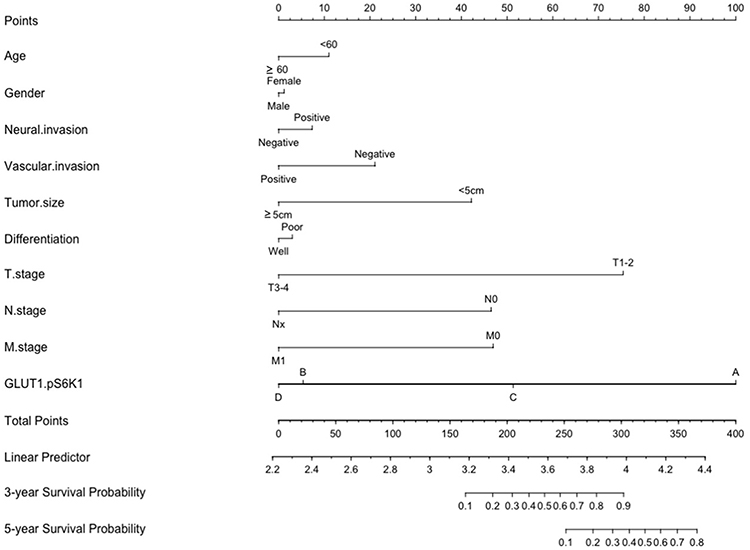 |
Figure 6 Nomogram for the predication of survival probability of gastric cancer patients. A total of 10 variables were involved, the points of every variable correspond to the scale in the first row. The summary of variable points projected on the TOTAL POINTS scale corresponds to the 3/5-year survival probability scale. (The scale of GLUT1.pS6K1: A= p-S6K1(-)/GLUT1(-); B= GLUT1(+)/p-S6K1(-); C= p-S6K1(+)/GLUT1(-); D= p-S6K1(+)/GLUT1(+)). |
Discussion
Although the treatment of GC has achieved significant progress, over 780,000 deaths are attributed to GC annually.28 The most important factor is that most patients were initially diagnosed with advanced GC. For advanced GC, traditional adjuvant chemotherapy is essential, however drug resistance and side effects along with treatment significantly restricted curative effects.29,30 Novel strategies for advanced GC patients are emerging, including metabolism-targeted cancer therapy, which showed extensive application value.31–36
High level of glycolysis and glucose uptake is a significant hallmark in cancer and GLUT1 is the main rate limiting step of glucose uptake.37,38 Existing studies have proven that elevated GLUT1 expression is observed in most solid cancers.4,39–42
In our study, we further demonstrated the aberrant expression of GLUT1 in GC tissues, resulting GC progression. In addition, high GLUT1 expression closely correlated with advanced clinicopathological parameters, including tumor size, invasion depth, lymph node metastasis, neural invasion, and TNM staging. However, poorly differentiated tumors seemed to have a reduced positive ratio of GLUT1 when compared to that of well differentiated tumors.
Although our survival analysis confirmed that increased GLUT1 expression shortened the survival time of GC patients, which was in line with previous studies,12 our subgroup analysis showed that the downtrend of survival probability of early GC patients without lymph node metastasis or TNM staging Ⅰ-Ⅱ was more apparent when compared with that of advanced GC patients, resulting from GLUT1 overexpression. Thus, our results indicated that high GLUT1 expression in the early GC stage could be meaningful for therapeutic intervention. Multivariate analyses showed that GLUT1 was an independent prognostic factor for survival of GC. Taken together, the above-mentioned results revealed a critical role of GLUT1 in GC development.
In general, glucose metabolism is closely mediated by AKT signaling in response to insulin receptor stimulation, which promotes glucose transporter expression and translocation from the cytoplasm to the plasma membrane.42,43 It has been established that AKT is vital in the transformation of the Warburg effect in cancer cells.44 Moreover, overactivated AKT signaling is commonly found in cancer, which facilitates cancer cell proliferation and survival.45 S6K1 acts as the core effector protein downstream of AKT, mediating protein transcription and positively correlates with the activity of AKT signaling.46,47 However, whether activation of AKT signaling results in aberrant GLUT1 expression in GC still needs to be elucidated.
Here, we explored the interaction between GLUT1 and AKT-S6K1 in situ of GC tissues rather than in vivo or animal models as shown in other studies.48 We showed that p-AKT and p-S6K1 expression were significantly increased in tumor tissues when compared to normal tissues. In addition, high GLUT1 levels promoted p-AKT/p-S6K1 expression in GC tumor tissues. We hypothesized that the activation of AKT-S6K1 axis attributed to high glucose levels in the cytoplasm, thereby activating glucose consumption and biosynthesis mediated by AKT signaling.26 Furthermore, an apparent positive association between GLUT1 and p-S6K1 indicated that the AKT-S6K1 axis plays a role in the effect of GLUT1 on GC.46,49–51
Subgroup survival analysis of GC patients based on p-S6K1 and GLUT1 expression showed that GLUT1 overexpression could be the governing factor upstream of AKT-S6K1. Because GC patients with p-S6K1(+) had worse prognosis than those with p-S6K1(-), GLUT1(+)/p-S6K1(+) also showed a lower survival probability to patients who showed a low negative expression of GLUT1 or p-S6K1. However, a survival probability of GLUT1(+)/p-S6K1(-) group was similar to GLUT1(+)/p-S6K1(+). The nomogram also showed a close rank between GLUT1(+)/p-S6K1(-) and GLUT1(+)/p-S6K1(+). The results indicated that high GLUT1 expression was the major risk of poor prognosis, which was independent of p-AKT and p-S6K1 expression. Therefore, we confirmed high expression of GLUT1 as a representative indicator for a poor prognosis of GC as a supplement to related studies.10,12,52
Instead of serving as the downstream of AKT-S6K1 axis activation, overexpressed GLUT1 acted as the upstream of AKT-S6K1 and promoted the activation of AKT signaling. However, the retroaction of AKT singling on GLUT1 should be investigated and considered. In addition, the single center nature of the retrospective study with a limited simple capacity impaired the power of the study. We will address the above-mentioned limitations in our subsequent study.
In summary, we revealed that the anomalous increase of GLUT1 acted as an independent risk factor in GC tissues, contributing to advanced clinicopathological parameters and poor prognosis. Early stage GC was more sensitive to high GLUT1 expression and related to poor progression. GLUT1 was the dominant factor cooperating with AKT-S6K1 axis, thereby promoting GC progression.53 Thus, GLUT1 was found to be a representative metabolic-associated prognostic index and estimable target for GC therapy especially for early stage patients.
Acknowledgments
This study was supported by the Project of National Science Foundation of Jiangsu Province, China (BK20161225) and the Nature Science Foundation of China (81672348).
Disclosure
The authors declare no conflicts of interest in this work.
References
1. Bray F, Ferlay J, Soerjomataram I, Siegel RL, Torre LA, Jemal A. Global cancer statistics 2018: GLOBOCAN estimates of incidence and mortality worldwide for 36 cancers in 185 countries. CA Cancer J Clin. 2018;68(6):394–424. doi:10.3322/caac.21492
2. Lordick F, Shitara K, Janjigian YY. New agents on the horizon in gastric cancer. Ann Oncol. 2017;28(8):1767–1775. doi:10.1093/annonc/mdx051
3. Lawrence MS, Stojanov P, Polak P, et al. Mutational heterogeneity in cancer and the search for new cancer-associated genes. Nature. 2013;499(7457):214–218. doi:10.1038/nature12213
4. Spencer NY, Stanton RC. The Warburg effect, lactate, and nearly a century of trying to cure cancer. Semin Nephrol. 2019;39(4):380–393. doi:10.1016/j.semnephrol.2019.04.007
5. Warburg O. On the origin of cancer cells. Science. 1956;123(3191):309–314. doi:10.1126/science.123.3191.309
6. Wood IS, Trayhurn P. Glucose transporters (GLUT and SGLT): expanded families of sugar transport proteins. Br J Nutr. 2003;89(1):3–9. doi:10.1079/BJN2002763
7. Younes M, Brown RW, Stephenson M, Gondo M, Cagle PT. Overexpression of Glut1 and Glut3 in stage I nonsmall cell lung carcinoma is associated with poor survival. Cancer. 1997;80(6):1046–1051. doi:10.1002/(SICI)1097-0142(19970915)80:6<1046::AID-CNCR6>3.0.CO;2-7
8. Amann T, Maegdefrau U, Hartmann A, et al. GLUT1 expression is increased in hepatocellular carcinoma and promotes tumorigenesis. Am J Pathol. 2009;174(4):1544–1552. doi:10.2353/ajpath.2009.080596
9. Martins SF, Amorim R, Viana-Pereira M, et al. Significance of glycolytic metabolism-related protein expression in colorectal cancer, lymph node and hepatic metastasis. BMC Cancer. 2016;16(1):535. doi:10.1186/s12885-016-2566-9
10. Kawamura T, Kusakabe T, Sugino T, et al. Expression of glucose transporter-1 in human gastric carcinoma: association with tumor aggressiveness, metastasis, and patient survival. Cancer. 2001;92(3):634–641. doi:10.1002/1097-0142(20010801)92:3<634::AID-CNCR1364>3.0.CO;2-X
11. Berlth F, Monig S, Pinther B, et al. Both GLUT-1 and GLUT-14 are independent prognostic factors in gastric adenocarcinoma. Ann Surg Oncol. 2015;22(Suppl 3):S822–831. doi:10.1245/s10434-015-4730-x
12. Schlosser HA, Drebber U, Urbanski A, et al. Glucose transporters 1, 3, 6, and 10 are expressed in gastric cancer and glucose transporter 3 is associated with UICC stage and survival. Gastric Cancer. 2017;20(1):83–91. doi:10.1007/s10120-015-0577-x
13. Yan S, Wang Y, Chen M, Li G, Fan J. Deregulated SLC2A1 promotes tumor cell proliferation and metastasis in gastric cancer. Int J Mol Sci. 2015;16(7):16144–16157. doi:10.3390/ijms160716144
14. Liu P, Cheng H, Roberts TM, Zhao JJ. Targeting the phosphoinositide 3-kinase pathway in cancer. Nat Rev Drug Discov. 2009;8(8):627–644. doi:10.1038/nrd2926
15. Ruvinsky I, Meyuhas O. Ribosomal protein S6 phosphorylation: from protein synthesis to cell size. Trends Biochem Sci. 2006;31(6):342–348. doi:10.1016/j.tibs.2006.04.003
16. Melstrom LG, Salabat MR, Ding XZ, et al. Apigenin inhibits the GLUT-1 glucose transporter and the phosphoinositide 3-kinase/Akt pathway in human pancreatic cancer cells. Pancreas. 2008;37(4):426–431. doi:10.1097/MPA.0b013e3181735ccb
17. Gonnella R, Santarelli R, Farina A, et al. Kaposi sarcoma associated herpesvirus (KSHV) induces AKT hyperphosphorylation, bortezomib-resistance and GLUT-1 plasma membrane exposure in THP-1 monocytic cell line. J Exp Clin Cancer Res. 2013;32:79. doi:10.1186/1756-9966-32-79
18. Wu XL, Wang LK, Yang DD, et al. Effects of Glut1 gene silencing on proliferation, differentiation, and apoptosis of colorectal cancer cells by targeting the TGF-beta/PI3K-AKT-mTOR signaling pathway. J Cell Biochem. 2018;119(2):2356–2367. doi:10.1002/jcb.26399
19. Yao Y, Zhou D, Shi D, et al. GLI1 overexpression promotes gastric cancer cell proliferation and migration and induces drug resistance by combining with the AKT-mTOR pathway. Biomed Pharmacother. 2019;111:993–1004. doi:10.1016/j.biopha.2019.01.018
20. Xiao H, Wang J, Yan W, et al. GLUT1 regulates cell glycolysis and proliferation in prostate cancer. Prostate. 2018;78(2):86–94. doi:10.1002/pros.23448
21. Deng Y, Zou J, Deng T, Liu J. Clinicopathological and prognostic significance of GLUT1 in breast cancer: a meta-analysis. Medicine. 2018;97(48):e12961. doi:10.1097/MD.0000000000012961
22. Koh YW, Lee SJ, Park SY. Differential expression and prognostic significance of GLUT1 according to histologic type of non-small-cell lung cancer and its association with volume-dependent parameters. Lung Cancer. 2017;104:31–37. doi:10.1016/j.lungcan.2016.12.003
23. Sun HW, Yu XJ, Wu WC, et al. GLUT1 and ASCT2 as predictors for prognosis of hepatocellular carcinoma. PLoS One. 2016;11(12):e0168907. doi:10.1371/journal.pone.0168907
24. Ancey PB, Contat C, Meylan E. Glucose transporters in cancer - from tumor cells to the tumor microenvironment. FEBS J. 2018;285(16):2926–2943. doi:10.1111/febs.14577
25. Pan C, Liu Q, Wu X. HIF1alpha/miR-520a-3p/AKT1/mTOR feedback promotes the proliferation and glycolysis of gastric cancer cells. Cancer Manag Res. 2019;11:10145–10156. doi:10.2147/CMAR.S223473
26. Schultze SM, Hemmings BA, Niessen M, Tschopp O. PI3K/AKT, MAPK and AMPK signalling: protein kinases in glucose homeostasis. Expert Rev Mol Med. 2012;14:e1. doi:10.1017/S1462399411002109
27. Guerrero-Zotano A, Mayer IA, Arteaga CL. PI3K/AKT/mTOR: role in breast cancer progression, drug resistance, and treatment. Cancer Metastasis Rev. 2016;35(4):515–524. doi:10.1007/s10555-016-9637-x
28. Salati M, Orsi G, Smyth E, et al. Gastric cancer: translating novels concepts into clinical practice. Cancer Treat Rev. 2019;79:101889. doi:10.1016/j.ctrv.2019.101889
29. Wang S, Liu Y, Feng Y, et al. A review on curability of cancers: more efforts for novel therapeutic options are needed. Cancers (Basel). 2019;11(11):11. doi:10.3390/cancers11111782
30. Smyth EC, Moehler M. Late-line treatment in metastatic gastric cancer: today and tomorrow. Ther Adv Med Oncol. 2019;11:1758835919867522. doi:10.1177/1758835919867522
31. Vinasco K, Mitchell HM, Kaakoush NO, Castano-Rodriguez N. Microbial carcinogenesis: lactic acid bacteria in gastric cancer. Biochim Biophys Acta Rev Cancer. 2019;1872(2):188309. doi:10.1016/j.bbcan.2019.07.004
32. Goossens JF, Bailly C. Ursodeoxycholic acid and cancer: from chemoprevention to chemotherapy. Pharmacol Ther. 2019;203:107396. doi:10.1016/j.pharmthera.2019.107396
33. van Boxel GI, Ruurda JP, van Hillegersberg R. Robotic-assisted gastrectomy for gastric cancer: a European perspective. Gastric Cancer. 2019;22(5):909–919. doi:10.1007/s10120-019-00979-z
34. Yang L, Wang Y, Wang H. Use of immunotherapy in the treatment of gastric cancer. Oncol Lett. 2019;18(6):5681–5690. doi:10.3892/ol.2019.10935
35. Zhao W, Jia L, Zhang M, et al. The killing effect of novel bi-specific Trop2/PD-L1 CAR-T cell targeted gastric cancer. Am J Cancer Res. 2019;9(8):1846–1856.
36. Zhu G, Foletti D, Liu X, et al. Targeting CLDN18.2 by CD3 bispecific and ADC modalities for the treatments of gastric and pancreatic cancer. Sci Rep. 2019;9(1):8420. doi:10.1038/s41598-019-44874-0
37. Amann T, Hellerbrand C. GLUT1 as a therapeutic target in hepatocellular carcinoma. Expert Opin Ther Targets. 2009;13(12):1411–1427. doi:10.1517/14728220903307509
38. Mueckler M, Thorens B. The SLC2 (GLUT) family of membrane transporters. Mol Aspects Med. 2013;34(2–3):121–138. doi:10.1016/j.mam.2012.07.001
39. Zaal EA, Berkers CR. The influence of metabolism on drug response in cancer. Front Oncol. 2018;8:500. doi:10.3389/fonc.2018.00500
40. Wu Z, Wu J, Zhao Q, Fu S, Jin J. Emerging roles of aerobic glycolysis in breast cancer. Clin Transl Oncol. 2020;22(5):631–646. doi:10.1007/s12094-019-02187-8
41. Yan L, Raj P, Yao W, Ying H. Glucose metabolism in pancreatic cancer. Cancers (Basel). 2019;11(10):10. doi:10.3390/cancers11101460
42. Glenister A, Simone MI, Hambley TW. A Warburg effect targeting vector designed to increase the uptake of compounds by cancer cells demonstrates glucose and hypoxia dependent uptake. PLoS One. 2019;14(7):e0217712. doi:10.1371/journal.pone.0217712
43. Pereira-Nunes A, Afonso J, Granja S, Baltazar F. Lactate and lactate transporters as key players in the maintenance of the Warburg effect. Adv Exp Med Biol. 2020;1219:51–74.
44. Vyas M, Patel N, Celli R, Wajapeyee N, Jain D, Zhang X. Glucose metabolic reprogramming and cell proliferation arrest in colorectal micropapillary carcinoma. Gastroenterology Res. 2019;12(3):128–134. doi:10.14740/gr1145
45. Hennessy BT, Smith DL, Ram PT, Lu Y, Mills GB. Exploiting the PI3K/AKT pathway for cancer drug discovery. Nat Rev Drug Discov. 2005;4(12):988–1004. doi:10.1038/nrd1902
46. Kim H, Ju JH, Son S, Shin I. Silencing of CD133 inhibits GLUT1-mediated glucose transport through downregulation of the HER3/Akt/mTOR pathway in colon cancer. FEBS Lett. 2019.
47. Beg M, Abdullah N, Thowfeik FS, Altorki NK, McGraw TE. Distinct Akt phosphorylation states are required for insulin regulated Glut4 and Glut1-mediated glucose uptake. Elife. 2017;6.
48. Zhang TB, Zhao Y, Tong ZX, Guan YF. Inhibition of glucose-transporter 1 (GLUT-1) expression reversed Warburg effect in gastric cancer cell MKN45. Int J Clin Exp Med. 2015;8(2):2423–2428.
49. Hu Y, Yang Z, Bao D, Ni JS, Lou J. miR-455-5p suppresses hepatocellular carcinoma cell growth and invasion via IGF-1R/AKT/GLUT1 pathway by targeting IGF-1R. Pathol Res Pract. 2019;215(12):152674. doi:10.1016/j.prp.2019.152674
50. Siska PJ, van der Windt GJ, Kishton RJ, et al. Suppression of Glut1 and glucose metabolism by decreased Akt/mTORC1 signaling drives T cell impairment in B cell leukemia. J Immunol. 2016;197(6):2532–2540. doi:10.4049/jimmunol.1502464
51. Phadngam S, Castiglioni A, Ferraresi A, Morani F, Follo C, Isidoro C. PTEN dephosphorylates AKT to prevent the expression of GLUT1 on plasmamembrane and to limit glucose consumption in cancer cells. Oncotarget. 2016;7(51):84999–85020. doi:10.18632/oncotarget.13113
52. Li H, Fu L, Liu B, Lin X, Dong Q, Wang E. Ajuba overexpression regulates mitochondrial potential and glucose uptake through YAP/Bcl-xL/GLUT1 in human gastric cancer. Gene. 2019;693:16–24. doi:10.1016/j.gene.2019.01.018
53. Lu YX, Wu QN, Chen DL, et al. Pharmacological ascorbate suppresses growth of gastric cancer cells with GLUT1 overexpression and enhances the efficacy of oxaliplatin through redox modulation. Theranostics. 2018;8(5):1312–1326. doi:10.7150/thno.21745
 © 2020 The Author(s). This work is published and licensed by Dove Medical Press Limited. The full terms of this license are available at https://www.dovepress.com/terms.php and incorporate the Creative Commons Attribution - Non Commercial (unported, v3.0) License.
By accessing the work you hereby accept the Terms. Non-commercial uses of the work are permitted without any further permission from Dove Medical Press Limited, provided the work is properly attributed. For permission for commercial use of this work, please see paragraphs 4.2 and 5 of our Terms.
© 2020 The Author(s). This work is published and licensed by Dove Medical Press Limited. The full terms of this license are available at https://www.dovepress.com/terms.php and incorporate the Creative Commons Attribution - Non Commercial (unported, v3.0) License.
By accessing the work you hereby accept the Terms. Non-commercial uses of the work are permitted without any further permission from Dove Medical Press Limited, provided the work is properly attributed. For permission for commercial use of this work, please see paragraphs 4.2 and 5 of our Terms.