")
Back to Journals » Cancer Management and Research » Volume 10
Glucose deprivation promotes apoptotic response to S1 by enhancing autophagy in human cervical cancer cells
Authors Zhou L , Kong QH, Zhang YH, Yang W, Yan S, Li MH, Wang YD, Zhou YJ, Yu HM, Han LY
Received 17 August 2018
Accepted for publication 24 October 2018
Published 23 November 2018 Volume 2018:10 Pages 6195—6204
DOI https://doi.org/10.2147/CMAR.S184180
Checked for plagiarism Yes
Review by Single anonymous peer review
Peer reviewer comments 2
Editor who approved publication: Dr Ahmet Emre Eşkazan
Li Zhou,1,2 Qinghuan Kong,3 Yunhan Zhang,3 Wei Yang,4 Shan Yan,3 Meihui Li,3 Yidan Wang,3 Yanjie Zhou,3 Huimei Yu,3 Liying Han1
1Department of Obstetrics and Gynecology, The Second Hospital of Jilin University, Changchun 130041, China; 2Department of Obstetrics and Gynecology, The First Hospital of Jilin University, Changchun 130021, China; 3Department of Pathology and Pathophysiology, School of Basic Medical Sciences, Jilin University, Changchun 130021, China; 4Department of Hepatobiliary and Pancreatic Surgery, The First Hospital of Jilin University, Changchun 130021, China
Background: S1 is a novel BH3 mimetic that can induce death in some types of cancer cells, such as melanoma B16, ovarian cancer SKOV3, and U251 glioma cells. S1 inhibits Bcl-2 and Mcl-1 expression and induces cancer cell apoptosis. Cancer cell survival is highly dependent on glucose. Here, we observed the effect of glucose deprivation on the apoptotic response to S1 in human cervical cancer (HeLa) cells.
Materials and methods: Earle’s balanced salt solution (EBSS) was used to simulate glucose deprivation. MTT assay was used to analyze the cell survival rate, and Hoechst 33342 dye was used to detect the apoptosis in HeLa cells. Western blotting was used to detect the expression of ER stress and autophagy relative proteins. In addition, lysosomes were observed with LysoTracker staining by confocal microscopy.
Results: S1 decreased cell distribution density and survival rate, and MTT assay showed that EBSS enhanced the inhibitory effects of S1 on HeLa cell growth. Hoechst 33342 dye showed that S1 led to pyknosis, fragmentation, and strong staining in HeLa cell nuclei, and EBSS enhanced these effects. Western blotting indicated that EBSS enhanced the expression of apoptosis-related proteins (cytochrome C, caspase-3, and poly[ADP-ribose] polymerase 1) induced by S1 in HeLa cells. S1 decreased p62 expression and increased the autophagosome-associated protein LC3-II expression, which indicated that S1 induced autophagy in HeLa cells. EBSS enhanced S1-induced autophagy in HeLa cells. Furthermore, autophagy inhibitor chloroquine enhanced S1-induced apoptosis in HeLa cells.
Conclusion: These results indicate that EBSS exacerbates S1-induced autophagy and severe autophagy induced by EBSS and S1 could lead to apoptosis in HeLa cells. The results also suggest that EBSS enhances the sensitivity of HeLa cells to S1-induced apoptosis and that autophagy plays an important role in this process.
Keywords: Earle’s balanced salt solution, glucose deprivation, S1, endoplasmic reticulum stress, autophagy, apoptosis
Introduction
Malignant tumor cells have abnormal energy metabolism that is characterized by aerobic glycolysis (also called the Warburg effect), which can lead to extracellular lactic acid accumulation.1,2 The glycolytic pathway provides ATP for cancer cells, which is helpful for cancer cell survival and invasiveness.3 In recent years, much research on the treatment of malignant cancer has focused on glucose deprivation and/or blocking the glycolytic pathway.4,5 Some research has shown that, under conditions of glucose deprivation, cells can be induced to apoptosis by the regulation of Bcl-2 family proteins through the following pathways: 1) glycogen synthase kinase 3β phosphorylates Mcl-1 (antiapoptotic Bcl-2 family protein with BH1-4 domain) and targets Mcl-1 for proteasome-mediated degradation6 and 2) AMP-activated protein kinase (AMPK) is activated, induces the transcription of Bim (apoptotic Bcl-2 family protein with BH1-3 domain), and inactivates AMPK-dependent mammalian target of rapamycin, which can inhibit Mcl-1 transcription.7 Other research has shown that glucose metabolism participates in apoptotic regulation by Bcl-2 family proteins. Glucose catabolism regulates Mcl-1 protein function at the transcriptional and post-transcriptional levels.
Cancer cell survival and death are regulated by multiple factors and targets. Overexpression of antiapoptotic Bcl-2 family proteins often leads to cancer cell survival by helping the cells to avoid apoptosis. S1 is a novel BH3 mimetic compound and a Bcl-2-specific inhibitor, which can inhibit another antiapoptosis protein, Mcl-1. The chemical structure is shown in the previous study.8 Cytological experiments have shown that S1 dissociates Bcl-2/Bax and Mcl-1/Bak dimers and then causes Bax to move toward mitochondria and induces caspase-3 activation, resulting in apoptosis. Our previous studies have shown that S1 inhibits the viability of melanoma B16 cells,9 which might be caused by the endoplasmic reticulum (ER) and mitochondrial apoptosis pathways. In addition, S1 has inhibitory effects on human ovarian cancer cell lines SKOV3 and SKOV3/DDP (cisplatin-resistant cell line).10–13 S1 inhibits the growth of glioma cell line U251 and induces autophagy by inhibiting Bcl-2 and releasing Beclin 1.14
In the present study, we designed a combined-efficiency program that was glucose deprivation with S1 in HeLa cells, based on the inhibitory effect of S1 on Bcl-2, and we added another treatment. HeLa cells require a lot of glucose to meet their metabolic needs. Therefore, we used Earle’s balanced salt solution (EBSS) to simulate the glucose deprivation environment and to observe the effect of glucose deprivation on the apoptotic response to S1 in HeLa cells. At the same time, we investigated the relationship between autophagy and apoptosis. Our study may provide new insights into treatment for cervical cancer.
Materials and methods
Reagents
S1 was synthesized as previously reported.8 S1 was dissolved in dimethyl sulfoxide (DMSO). The autophagy inhibitors (chloroquine [CQ]), Hoechst 33342, LysoTracker, and MTT were purchased from Sigma-Aldrich Co. (St Louis, MO, USA).
Cell culture
Human cervical cancer cells (HeLa cells) were obtained from American Type Culture Collection (ATCC) (Manassas, VA, USA) and cultured in Iscove’s modified Dulbecco’s media (IMDM) (Thermo Fisher Scientific, Waltham, MA, USA) supplemented with 10% (v/v) FBS (Thermo Fisher Scientific) at 37°C with 5% CO2. When S1 was used to treat the HeLa cells, the concentration was 10 μM/L in IMDM. The antibody against Bcl-2 (1:500, rabbit) and LC3 (1:500, rabbit) was purchased from Abcam (Cambridge, MA, USA). The antibody against Bax (1:100, mouse) and Atg 12 (1:100, rabbit) was purchased from Santa Cruz Biotechnology Inc. (Dallas, TX, USA). The antibody against caspase-3 (1:500, rabbit) was purchased from Cell Signaling (Beverly, MA, USA). The antibody against Beclin (1:100, mouse) was purchased from BD Biosciences (San Jose, CA, USA).
Cell culture under glucose deprivation
Human cervical cancer cells (HeLa cell) were cultured in Earle’s balanced salt solution (EBSS) with 10% (v/v) FBS at 37°C with 5% CO2. When the HeLa cells were treated with S1 and EBSS, S1 was added to EBSS and the final concentration was 10 µM/L in EBSS.
Cell viability assays
Cell viability was determined by MTT assays. Cells were plated at 1×10⁴/well in 96-well plates and exposed to different concentrations of inhibitors for various amounts of time. Each treatment was repeated in six separate wells. The cells were incubated at 37°C with 5% CO2, and MTT reagent (20 µL, 5 mg/mL in PBS; Sigma-Aldrich Co.) was added to each well and incubated for 4 hours. Formazan crystals were dissolved in 150 µL DMSO. Absorbance was recorded at a wavelength of 490 nm.
Western blot analysis
For the extraction of cytoplasmic proteins, cells were harvested and washed with cold PBS. Cells were centrifuged for 5 minutes at 600× g at 4°C and, then, incubated in cell lysis buffer (150 mM NaCl, 1 mM EDTA, 10 mM HEPES, 1 mM PMSF, and 0.6% NP-40). Lysates were sonicated and incubated for 15 minutes on ice and, then, centrifuged at 700× g for 10 minutes at 4°C. The supernatant was centrifuged at 14,000× g for another 30 minutes at 4°C: cytoplasmic proteins were contained within the resultant supernatant. For Western blot analysis, equivalent amounts of protein (30 µg) were separated by 10% (w/v) SDS-PAGE and transferred onto nitrocellulose membranes (Whatman, Maidstone, UK). The membranes were blocked with 5% (w/v) skim milk in buffer (10 mM Tris-HCl [pH 7.6], 100 mM NaCl, and 0.1% [v/v] Tween 20) for 1 hour at room temperature and then incubated with primary antibodies (Santa Cruz Biotechnology Inc.) overnight at 4°C, followed by incubation with horseradish peroxidase-conjugated secondary antibodies (Thermo Fisher Scientific) at 1:1,000 dilution for 2 hours at room temperature. The immunoreactive bands were visualized by the diaminobenzidine coloration method. The semiquantitation of proteins was surveyed using a Tanon GIS gel imager System.
Hoechst 33342 and LysoTracker staining
Apoptotic nuclear changes were assessed with Hoechst 33342 (Sigma-Aldrich Co.). Lysosome change was assessed with LysoTracker. Cells were cultured on coverslips overnight and, then, treated with 6 µg/mL cisplatin for 0 and 24 hours. After incubation, cells were fixed with 4% paraformaldehyde, stained with Hoechst 33342 (2 μg/mL) or LysoTracker for 30 minutes, washed with PBS, and examined using the Olympus FV1000 confocal laser microscopy.
Statistical analysis
Data are expressed as mean ± SD. Statistical analysis of the data was analyzed by one-way ANOVA. Values of P<0.05 or P<0.01 were considered statistically significant difference. Data are representative of three independent experiments performed in triplicate.
Results
Effect of glucose deprivation on inhibition of HeLa cell proliferation induced by S1
In our experiment, we treated HeLa cells with S1 (0, 2.5, 5.0, 10.0, and 20.0 µM) for 24 hours and viability was determined by the MTT assay. The results showed that cell viability decreased in a dose-dependent manner (Figure 1A). We selected 10 µM as the optimum concentration of S1 because the cell survival rate was closed to 50%. To observe the effect of glucose deprivation on the proliferation of HeLa cells treated with S1, EBSS was used to replace IMDM to simulate glucose deprivation. We treated HeLa cells with 10 µM S1 or EBSS, and the MTT assay showed that cell viability decreased in a time-dependent manner (Figure 1B). We determined whether S1 and EBSS inhibited HeLa cell proliferation. HeLa cells were treated with S1 and EBSS for 12 hours, and proliferation was decreased (Figure 1C and D). Glucose deprivation enhanced the inhibition of HeLa cell proliferation induced by S1.
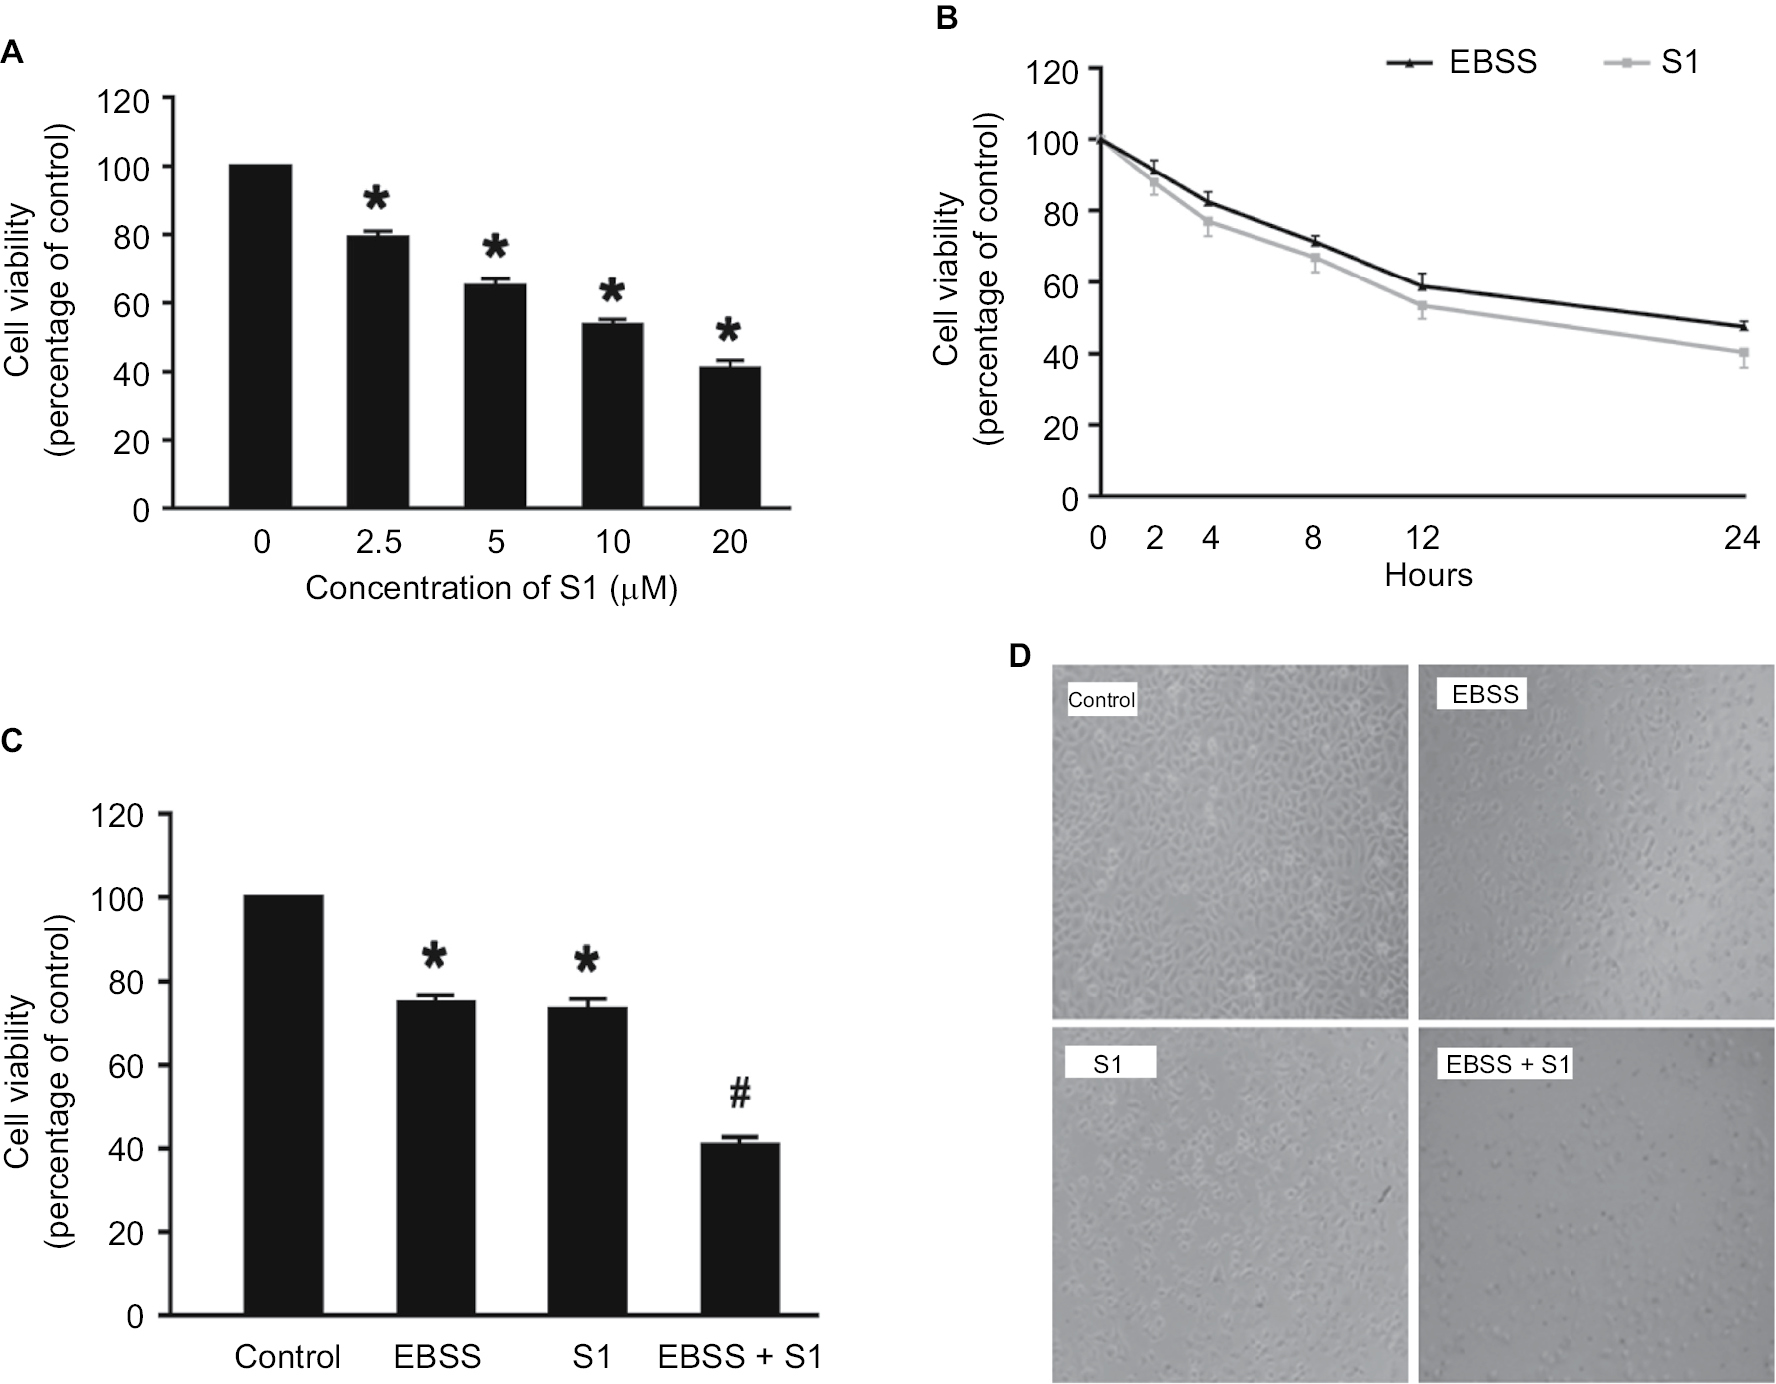 | Figure 1 Glucose deprivation enhances the inhibition of HeLa cell proliferation induced by S1. Notes: (A) HeLa cells were treated with S1 (0, 2.5, 5.0, 10.0, and 20.0 µM) for 24 hours, and cell viability was determined by MTT assay. (B) HeLa cells were treated with 10 µM S1 or EBSS for different times (0, 2,4, 8, 12, and 24 hours), and then cell viability was determined by MTT assay. (C) HeLa cells were treated with 10 µM S1 and 10 µM S1 + EBSS for 12 hours, and then, cell viability was determined by the MTT assays. Data are presented as mean ± SD (n=6). *P<0.05 vs control group. (D) Optical microscopy images for HeLa cells in control, 10 µM S1, 10 µM S1, and EBSS. Abbreviation: EBSS, Earle’s balanced salt solution. |
Effects of glucose deprivation on apoptosis in HeLa cells induced by S1
To determine if EBSS- and S1-induced cytotoxicity was mediated by apoptosis, Western blotting was used to detect apoptosis-associated proteins. Compared with the control cells, the expression of cytochrome C, cleaved caspase-3, and cleaved poly(ADP-ribose) polymerase 1 (PARP-1) was significantly increased after treatment with EBSS and S1 (10 µM) for 8 hours (Figure 2A and B). HeLa cells treated with EBSS and S1 (10 µM) for 8 hours also showed apoptotic nuclear chromatin condensation by confocal microscopy with Hoechst 33342 staining (Figure 2C).
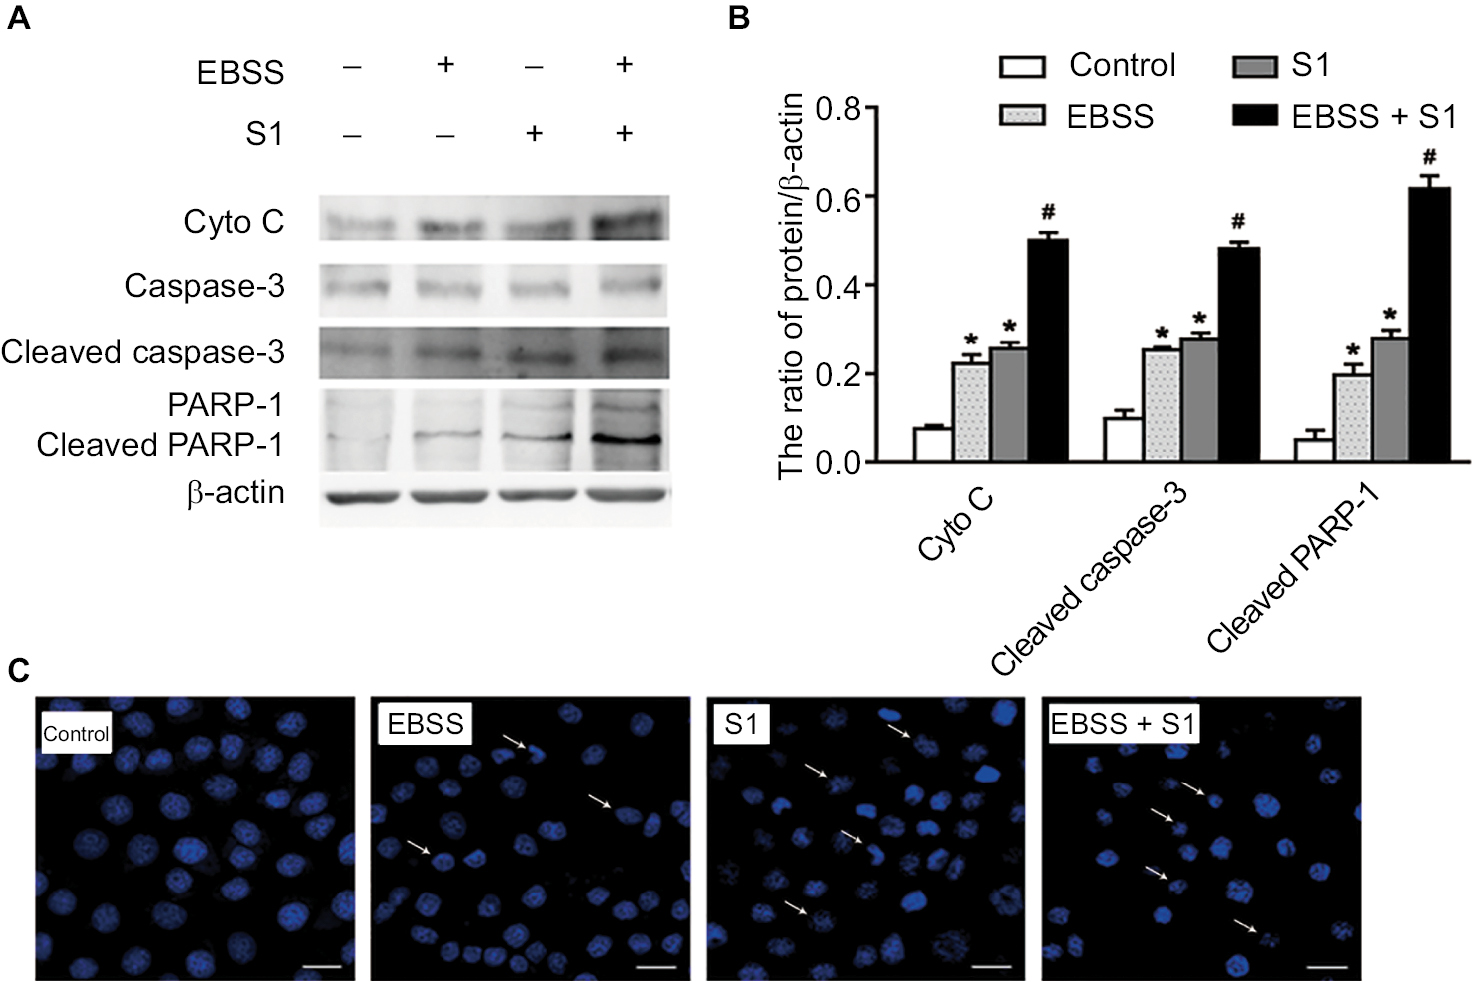 | Figure 2 Glucose deprivation enhances the apoptosis of HeLa cell induced by S1. Notes: HeLa cells were treated with 10 µM S1, EBSS, and 10 µM S1 and EBSS for 8 hours. (A) The expression level of Cyto C, caspase-3, and PARP-1 was determined by Western blot. (B) Quantification of Cyto C, caspase-3, and PARP-1 levels was shown as mean ± SD (n=6). *P<0.05 vs control group. #P<0.01 vs control group. (C) Changes in nuclear morphology were observed by confocal microscopy (bar, 10 μM) with Hoechst 33342 staining. Abbreviation: EBSS, Earle’s balanced salt solution. |
Effects of glucose deprivation on S1-induced expression of proapoptotic and antiapoptotic proteins
Because glucose deprivation enhanced S1-induced apoptosis of HeLa cells, we detected the expression of Bcl-2 family proteins, including proapoptotic and antiapoptotic proteins. Western blotting showed that the expression of antiapoptotic proteins such as Bcl-2 and Mcl-1 was significantly decreased in HeLa cells treated with EBSS and S1 (Figure 3A and B), whereas the expression of proapoptotic proteins such as Bak, Bax, Noxa, and Bim was significantly increased (Figure 3C and D). These results suggested that glucose deprivation increased the expression of proapoptotic proteins and decreased the expression of antiapoptotic proteins induced by S1.
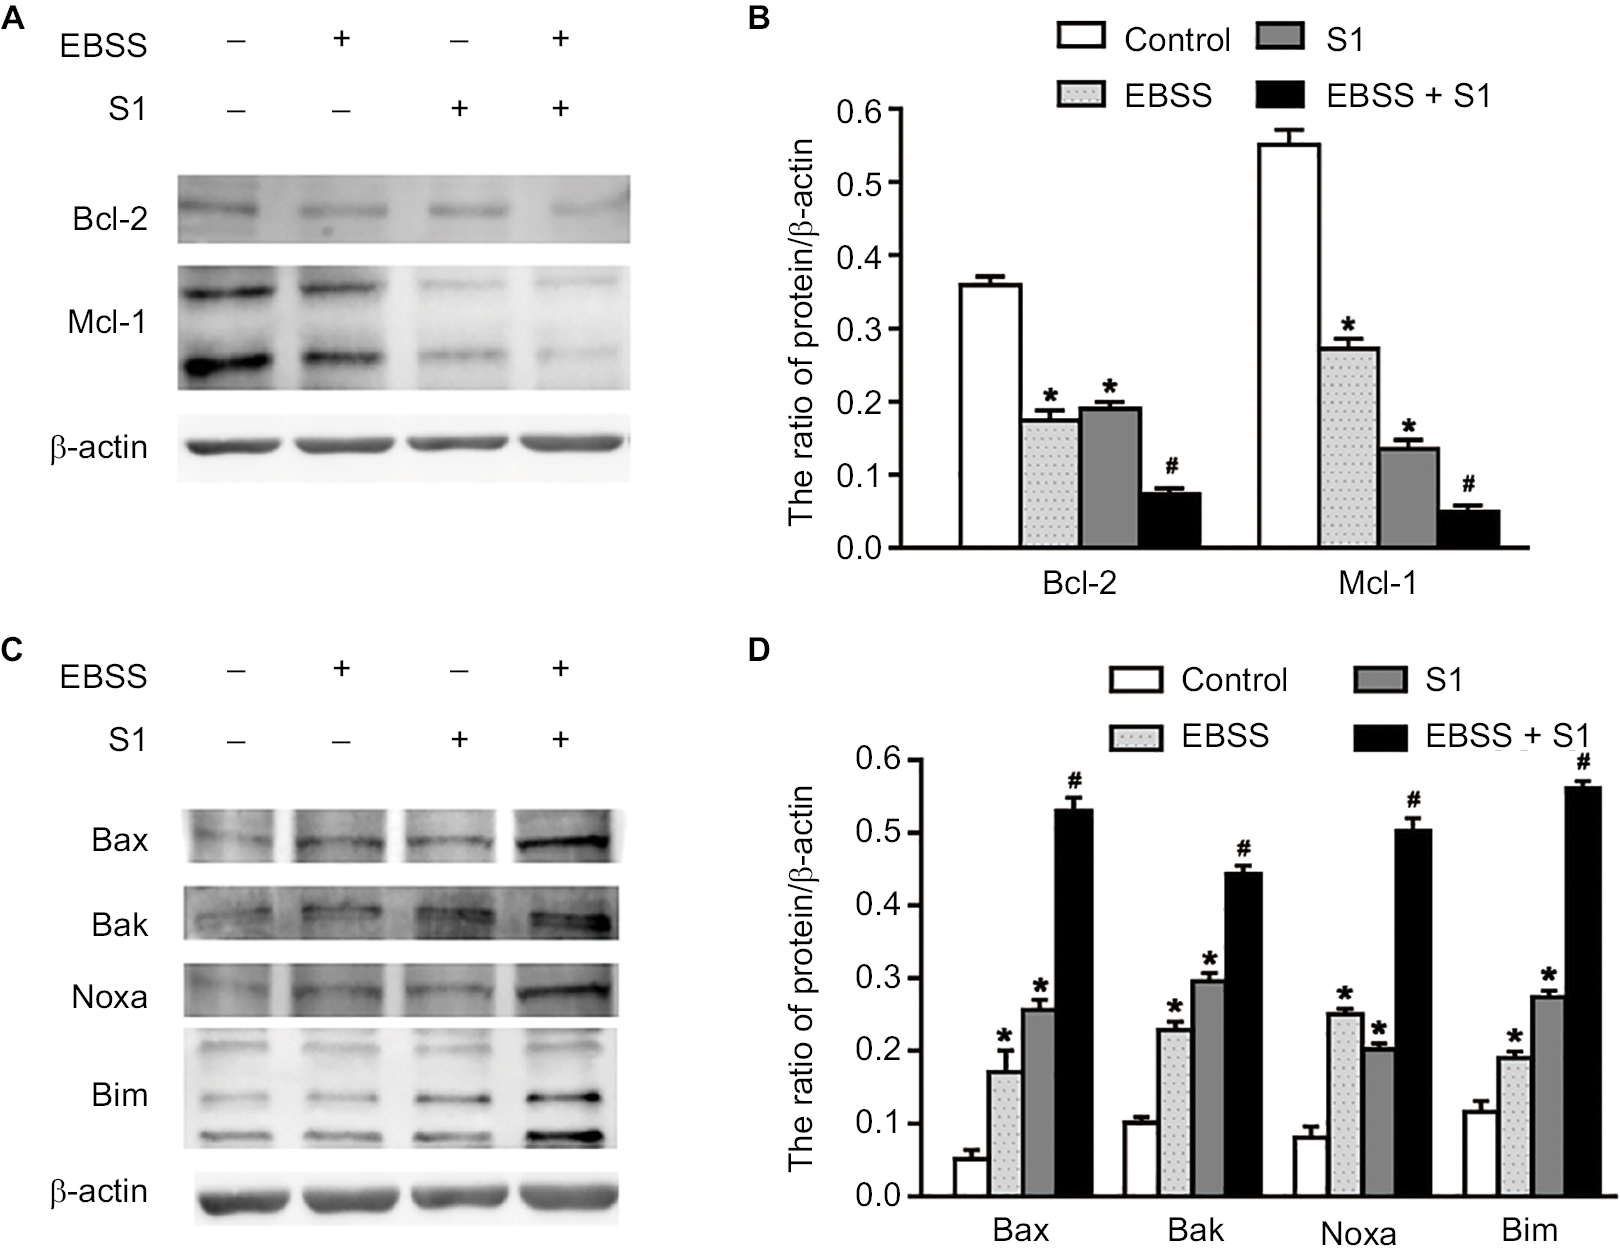 | Figure 3 Glucose deprivation increased the expression of proapoptotic proteins and decreased the expression of antiapoptotic proteins induced by S1. Notes: HeLa cells were treated with 10 µM S1, EBSS, and 10 µM S1 and EBSS for 8 hours. (A and C) The expression level of Bcl-2 family proteins including proapoptotic proteins such as Bax, Bak, Noxa, and Bim and antiapoptotic proteins such as Bcl-2 and Mcl-1 was determined in each group. (B and D) Quantification of Bax, Bak, Noxa, Bim, Bcl-2, and Mcl-1 levels were shown as mean ± SD (n=3) (B). *P<0.05 vs control group. #P<0.01 vs control group. Abbreviation: EBSS, Earle’s balanced salt solution. |
Glucose deprivation enhanced S1-induced ER stress (ERS) in HeLa cells
To investigate whether glucose deprivation and S1 induced ERS, HeLa cells were treated with EBSS, S1, or EBSS and S1 for 8 hours. We detected fluorescence changes in glucose-regulated protein-78 (Grp78) using the laser confocal microscopy. Compared with the control group, the expression of GRP78 was significantly increased in treated HeLa cells (Figure 4A). We detected the expression level of GRP78 and protein disulfide isomerase (PDI), which served as ERS marker proteins. Western blotting showed that the expression of GRP78 and PDI increased significantly (Figure 4B and C), which suggested that both glucose deprivation and S1 induced ERS. Western blotting also showed the upregulation of ERS-related proteins such as phospho-protein kinase R-like endoplasmic reticulum kinase (p-PERK) and inositol-requiring enzyme-1α (IRE1) (Figure 4D–G) and increased the expression of some downstream factors phospho-eukaryotic initiation factor 2α (p-eIF2α), PERK, activating transcription factor 4 (ATF4), the growth-arrest- and DNA-damage-inducible gene 153/C/EBP homology protein (GADD153/CHOP), c-Jun N-terminal kinases (JNK), and p-JNK in the major unfolded protein response pathways. This indicated activation of the PERK and IRE1 pathways in HeLa cells. The combined action of EBSS and S1 enhanced the increased expression of ERS-related proteins, which may have affected the expression and activity of the related Bcl-2 family proteins that regulate apoptosis in HeLa cells.
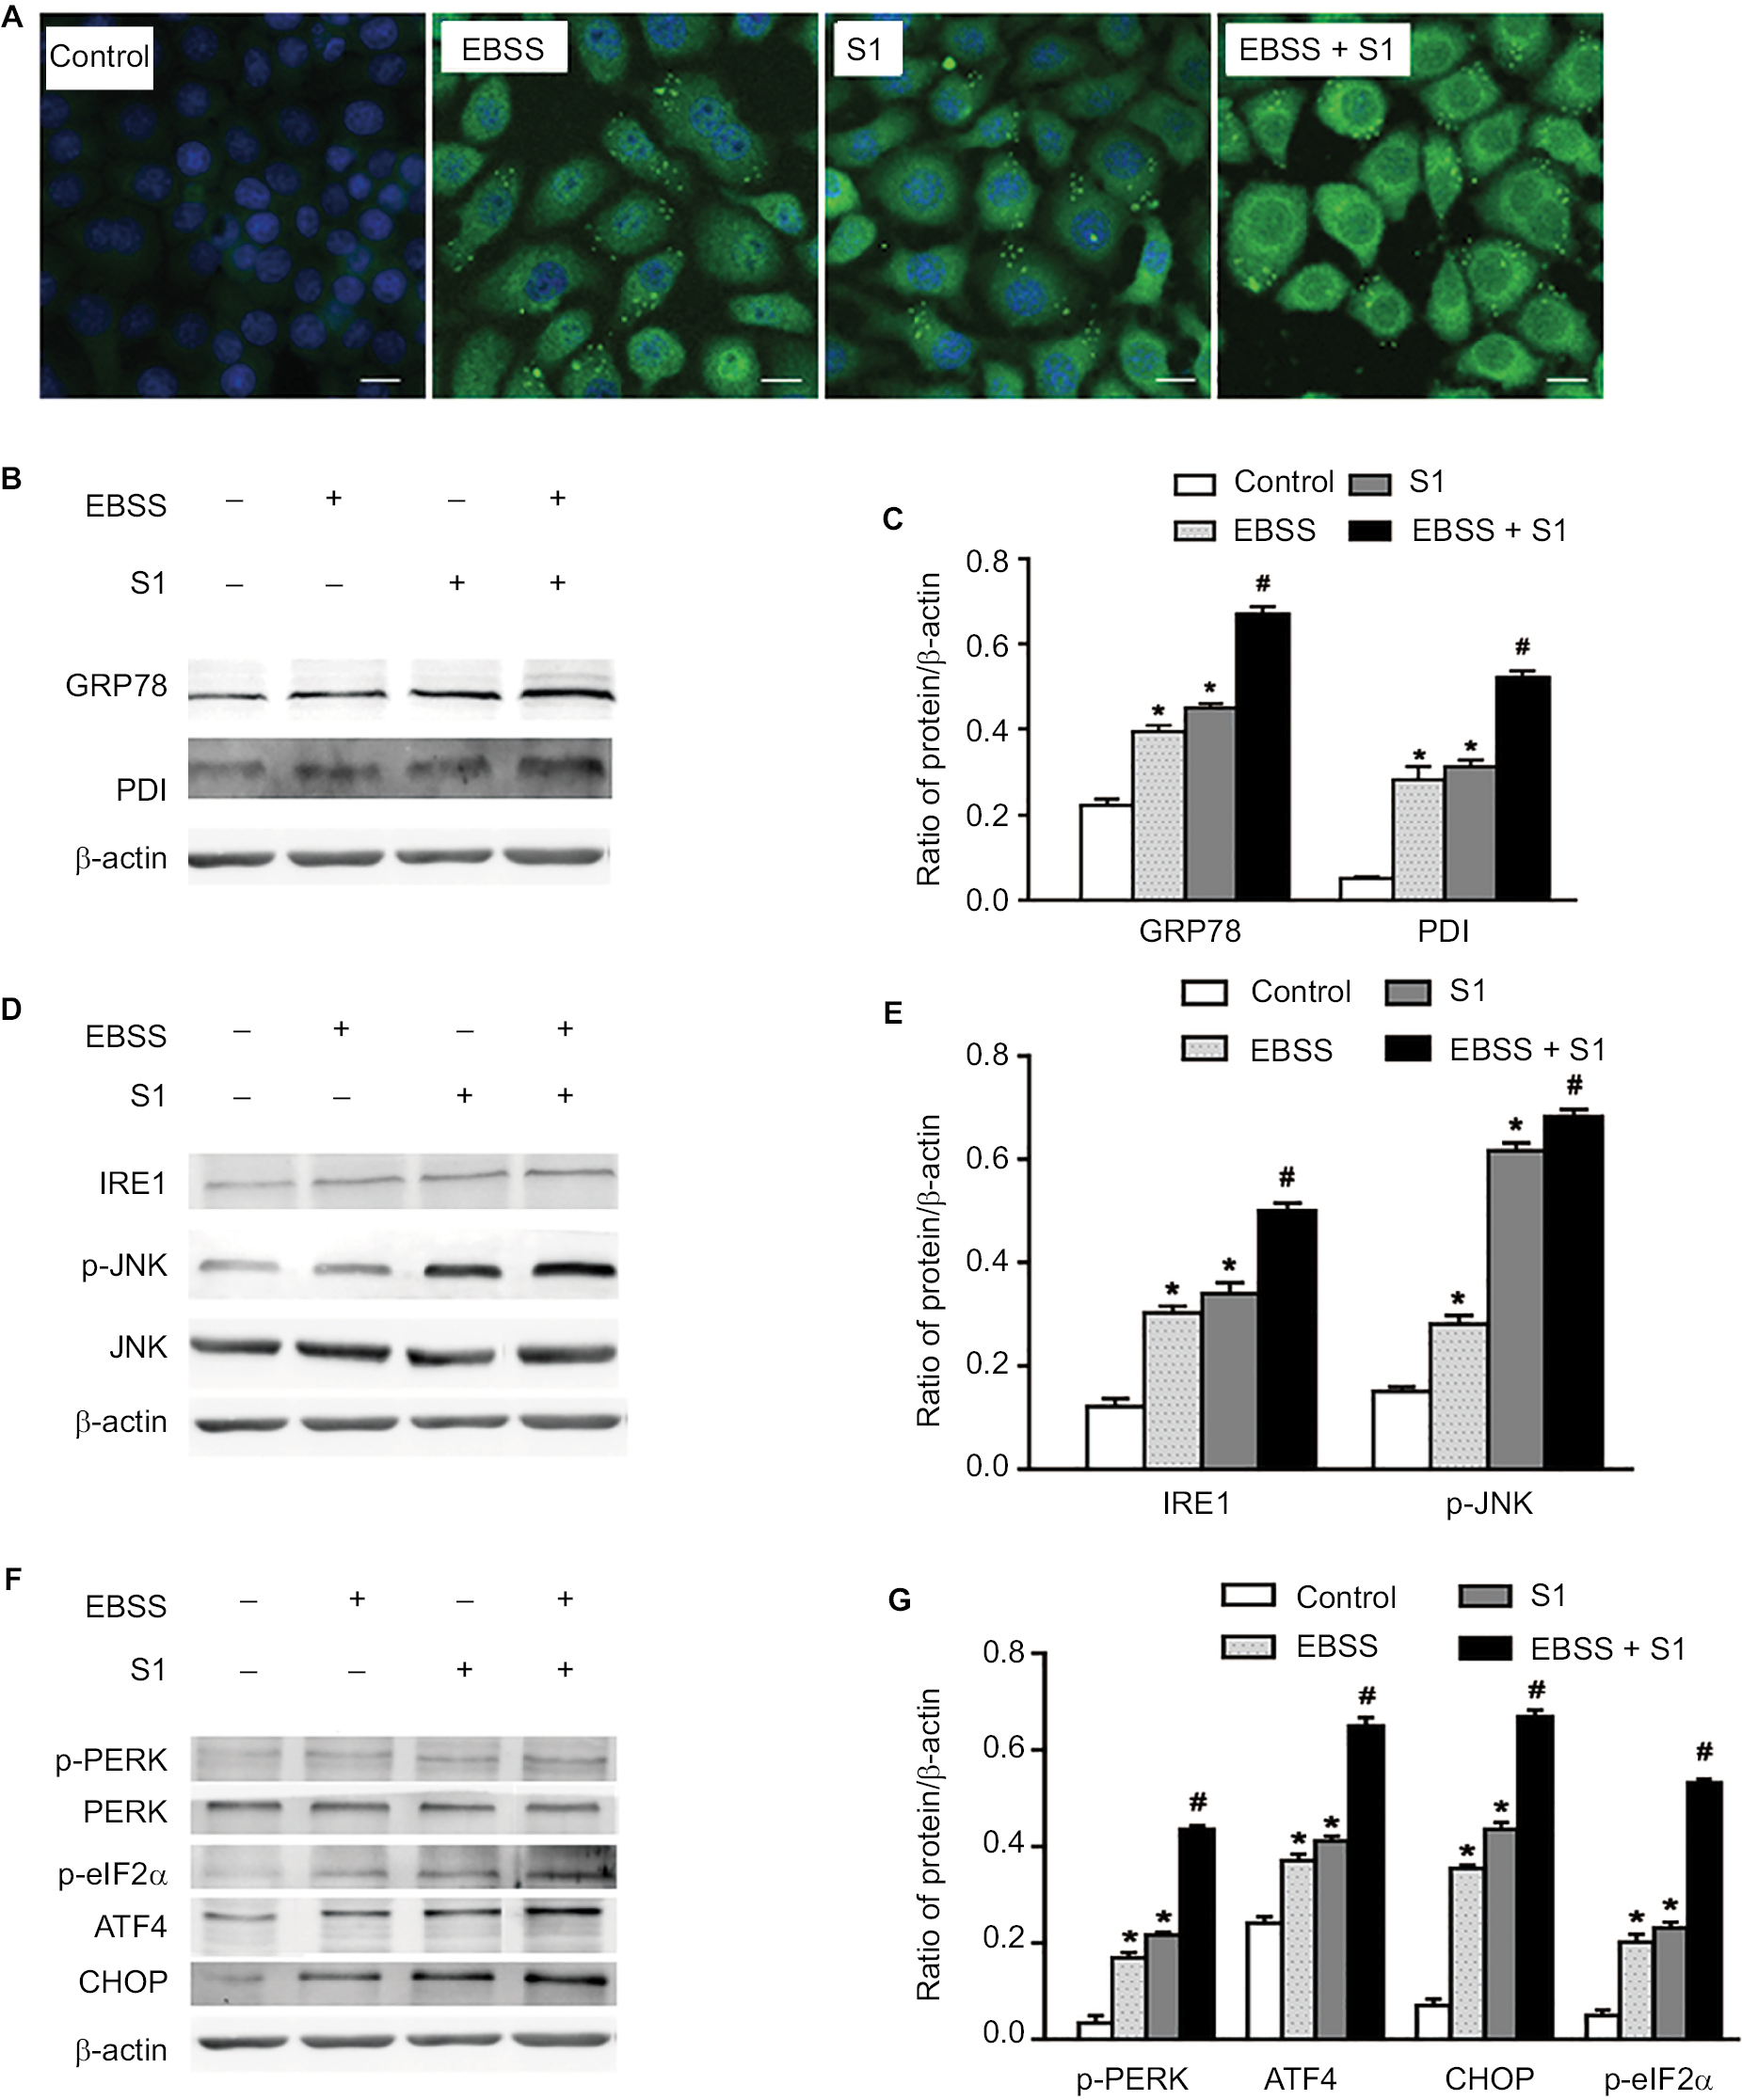 | Figure 4 Glucose deprivation enhances the ERS in HeLa cell induced by S1. Notes: HeLa cells were treated with 10 µM S1, EBSS, and 10 µM S1 and EBSS for 8 hours. (A) The expression of GRP78 was detected by confocal microscopy (bar, 10 µm). (B) The expression of PDI and GRP78 was detected by the Western blot. (C) Quantification of PDI and GRP78 levels. Data are presented as mean ± SD (n=3). (D) The expression of IRE, JNK, and p-JNK was detected by the Western blot. (E) Quantification of IRE, JNK, and p-JNK levels. Data are presented as mean ± SD (n=3). (F) The expression of PERK, p-PERK, p-eIF2α, ATF4, and CHOP was detected by the Western blot. (G) Quantification of PERK, p-PERK, p-eIF2α, ATF4, and CHOP levels. Data are presented as mean ± SD (n=3). *,#P<0.05 vs control group. #P<0.01 vs control group. Abbreviations: EBSS, Earle’s balanced salt solution; ERS, endoplasmic reticulum stress. |
Effects of glucose deprivation on S1-induced autophagy in HeLa cells
Our previous studies have shown that S1 induces apoptosis and autophagy.10,12–14 Autophagy plays an important role in tumor cell death: moderate autophagy has a protective role in tumor cells, but severe autophagy enhances apoptosis. Therefore, we investigated the effect of glucose deprivation on S1-induced autophagy. HeLa cells were treated with EBSS, S1, or EBSS and S1 for 8 hours, and the expression of LC3-II/I, Beclin 1, Atg12–5 complex, and p62 was determined by Western blotting. Compared with the control group, the expression of autophagy-related proteins LC3-II/I, Beclin 1, and Atg12–5 complex was increased significantly and the expression of p62 was decreased significantly in HeLa cells treated with S1 and EBSS (Figure 5A and B).
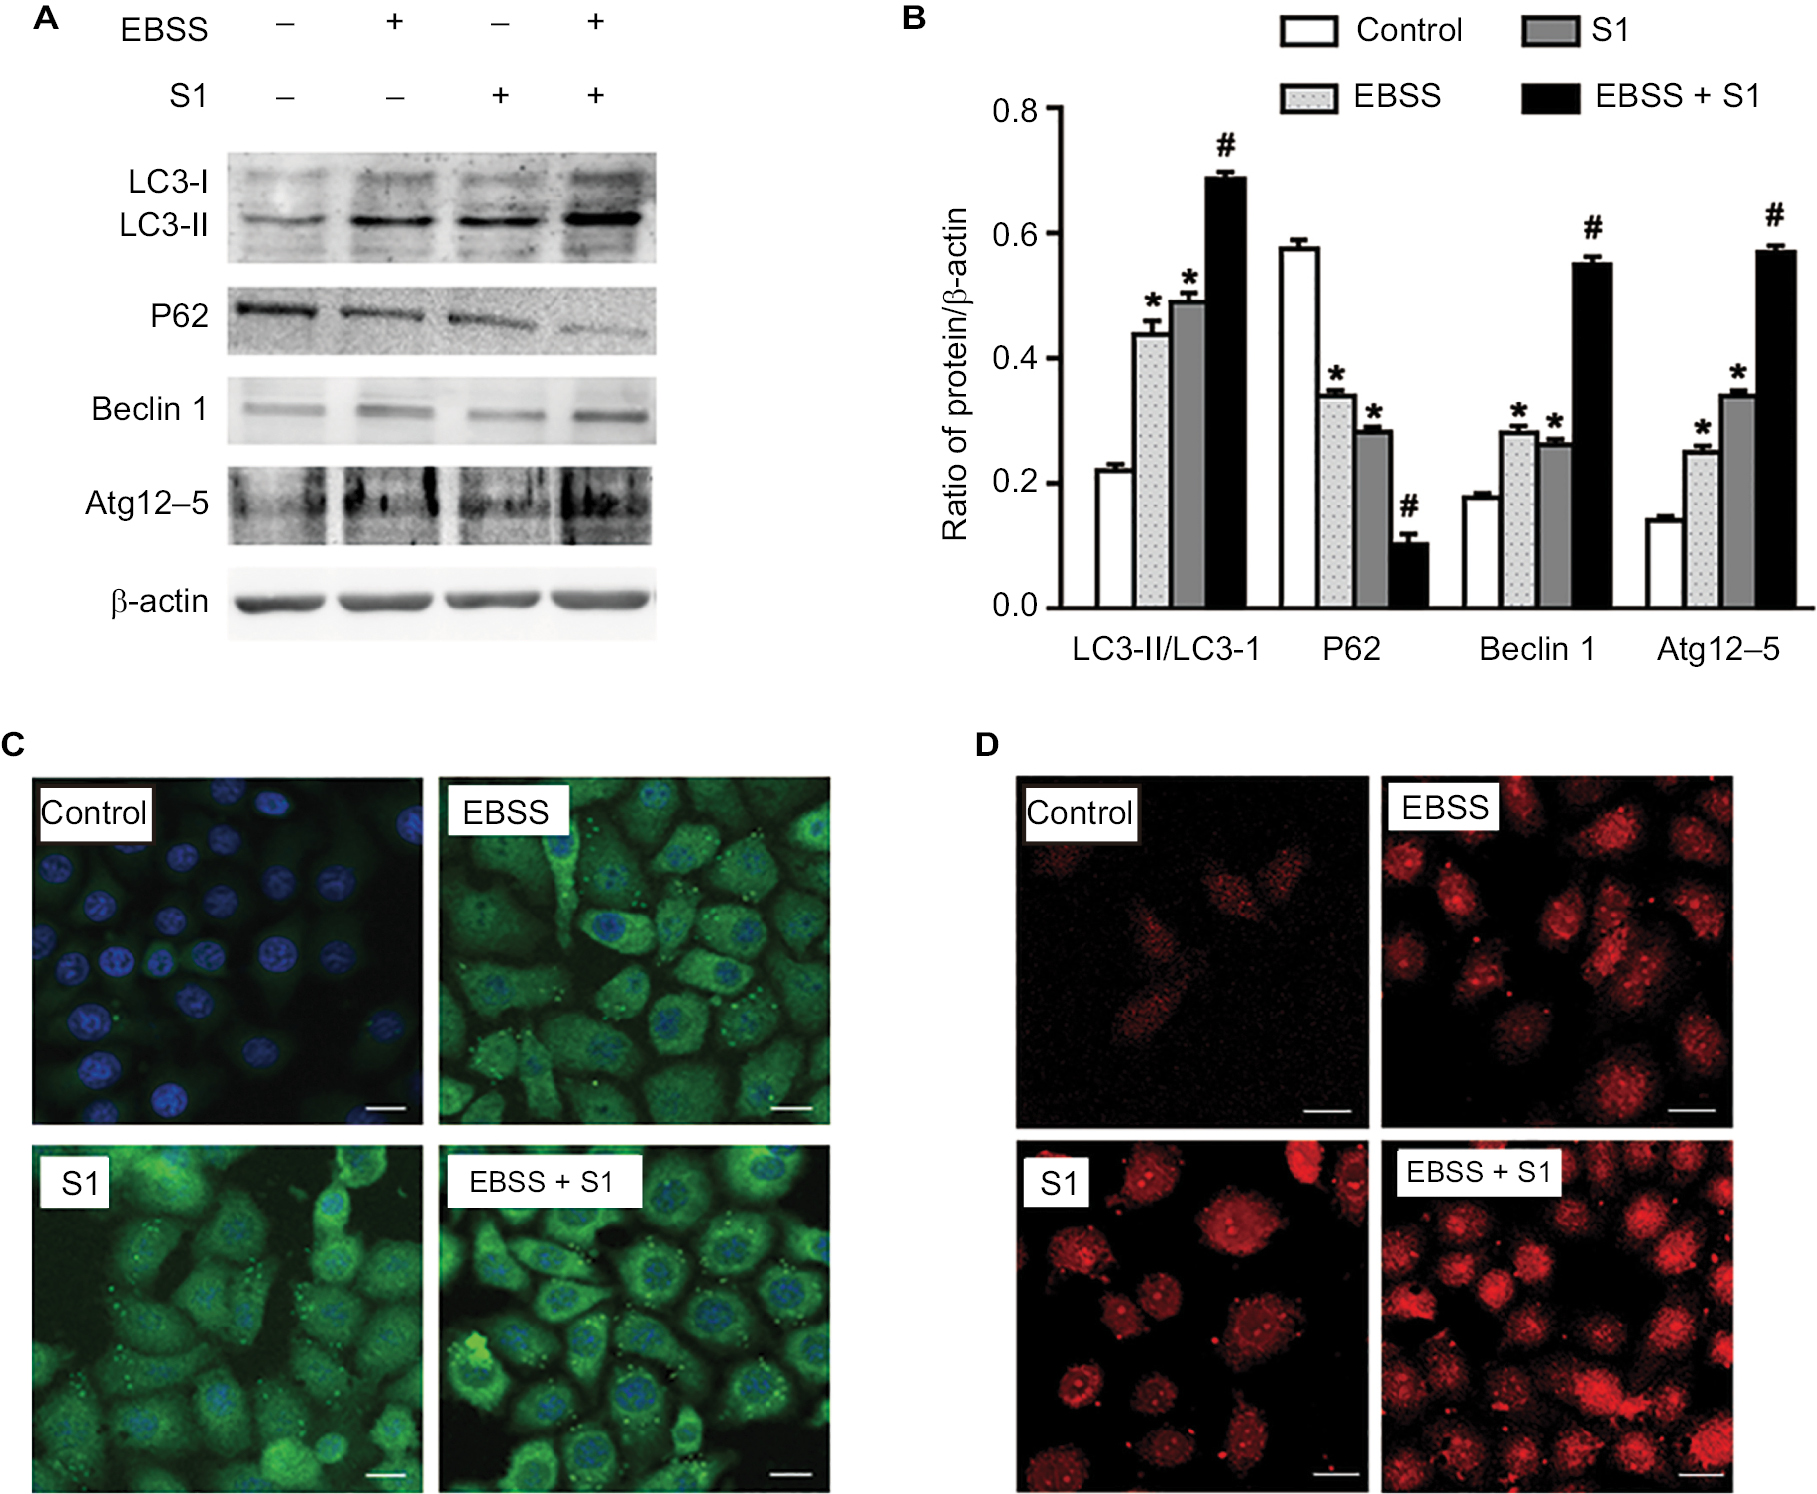 | Figure 5 Glucose deprivation enhances the autophagy in HeLa cell induced by S1. Notes: HeLa cells were treated with 10 µM S1, EBSS, and 10 µM S1 and EBSS for 8 hours. (A) The expression of LC3-II, P62, Beclin 1, and Atg12–5 was determined by Western blot. (B) Quantification of P62 and LC3-II, Beclin 1, and Atg12–5 levels. Data are presented as mean ± SD (n=3). *P<0.05 vs control group. #P<0.01 vs control group. (C) The expression of LC3 was detected by confocal microscopy (bar, 10 µm). (D) Lysosome was observed with LysoTracker staining by confocal microscopy (bar, 10 µm). Abbreviation: EBSS, Earle’s balanced salt solution. |
We detected fluorescence of the autophagy marker LC3 using the laser confocal microscopy. LC3 puncta accumulation increased when cells were treated with S1 and EBSS (Figure 5C). Lysosomes were observed with LysoTracker staining by confocal microscopy. The number of lysosomes increased significantly in HeLa cells treated with EBSS and S1 (Figure 5D). These results indicated that glucose deprivation and S1 induced autophagy and glucose deprivation aggravated S1-induced autophagy in HeLa cells.
CQ strengthened apoptosis in HeLa cells treated with glucose deprivation and S1
Lysosomal inhibitor CQ is a weakly basic drug and has high affinity with lysosomes. It inhibits the fusion of autophagic vacuoles with late lysosomes and autophagosomes. To clarify the role of autophagy, HeLa cells were treated with CQ combined with EBSS and S1 for 8 hours and viability was detected by the MTT assay. CQ significantly reduced the survival of HeLa cells treated with EBSS and S1 (Figure 6A). This indicated that the inhibition of lysosome function significantly increased the inhibitory effect of hypoxia and S1 on HeLa cell proliferation, aggravating the damage caused by glucose deprivation and S1.
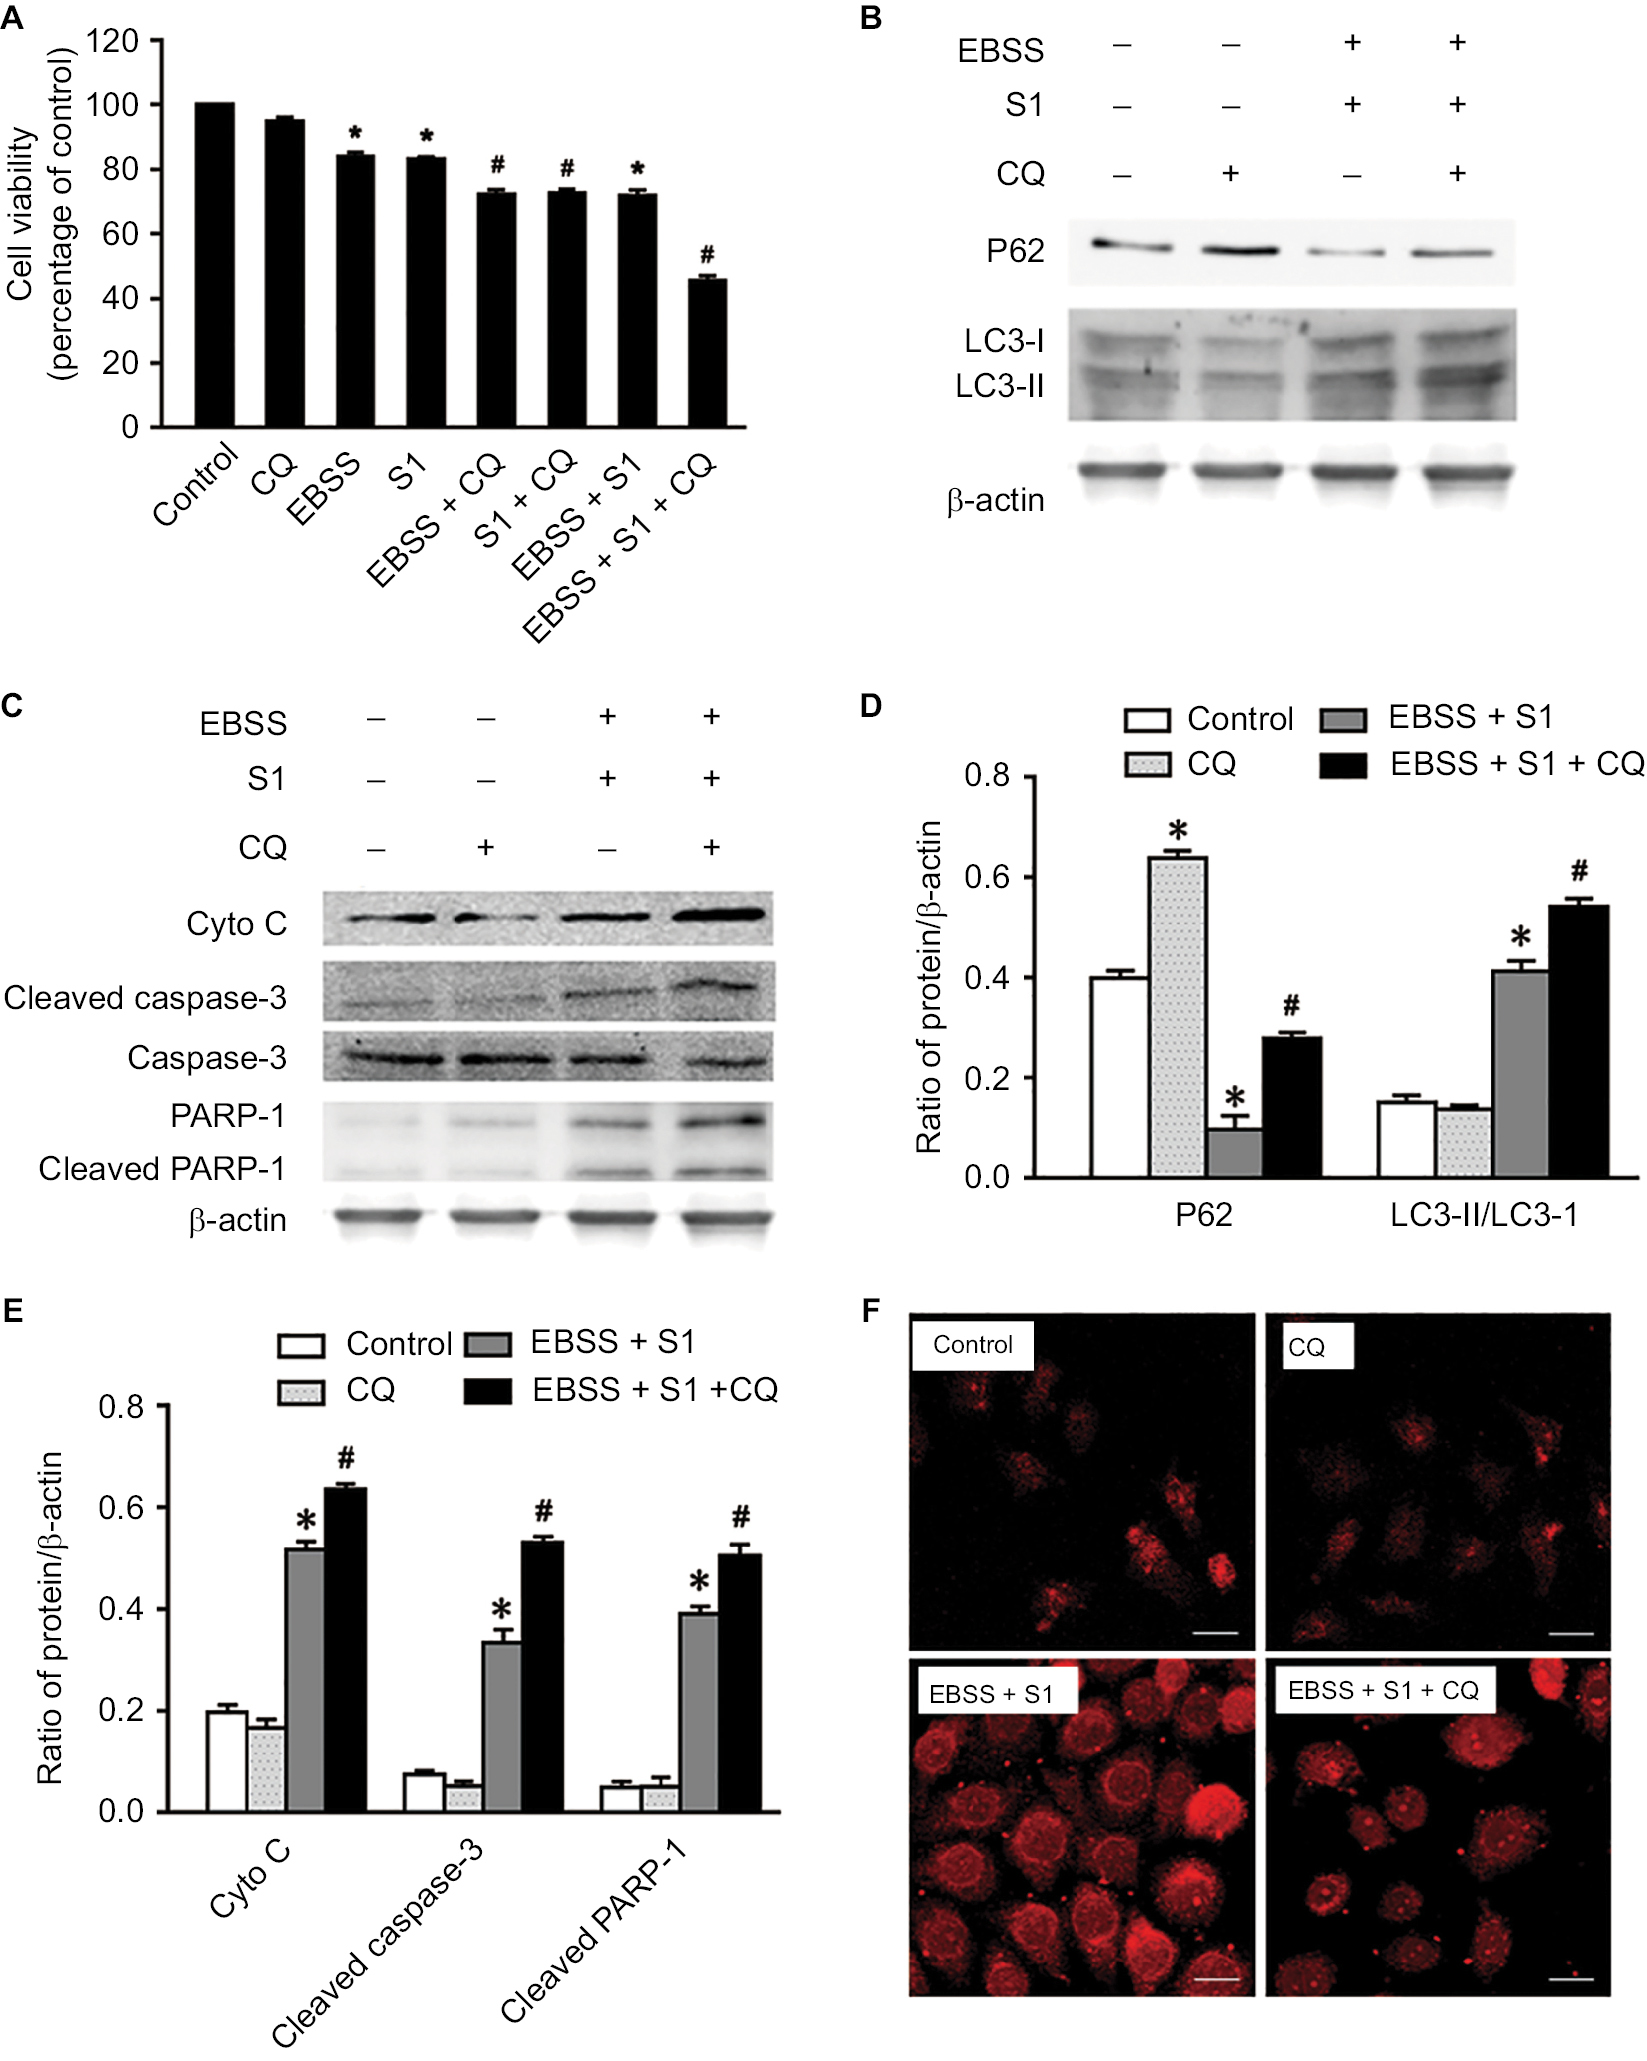 | Figure 6 Autophagy inhibitor CQ increases S1-induced apoptosis in HeLa cell. Notes: The 50 µM CQ (an inhibitor of autophagy) was used to pretreat the HeLa cell for 30 minutes, and then, HeLa cells were treated with 10 µM S1, EBSS, and 10 µM S1and EBSS for 8 hours. (A) Cell viability was determined by MTT assay in each group. Data are presented as mean ± SD (n=3). *P<0.05 vs control group. #P<0.01 vs control group. (B) The expression of LC3-II and P62 was determined by Western blot. (C) The expression of Cyto C, cleaved caspase-3, and cleaved PARP-1 was determined by Western blot. (D) Quantification of P62 and LC3-II levels. (E) Quantification of Cyto C, cleaved caspase-3, and cleaved PARP-1 levels. (F) Lysosome was observed with LysoTracker staining by confocal microscopy (bar, 10 µm). Data are presented as mean ± SD (n=3). Abbreviations: CQ, chloroquine; EBSS, Earle’s balanced salt solution. |
The expression of LC3 II/I and p62 was detected and analyzed by Western blotting (Figure 6B and D). Compared with the control group, CQ increased the expression of LC3-II/I and p62 protein in HeLa cells treated with EBSS and S1. This suggested that CQ interfered with the lysosomal degradation of LC3-II and p62 by inhibiting the fusion of autophagosomes and lysosomes induced by glucose deprivation and S1. This in turn affected the late stage of autophagy without affecting the early stage, which was further demonstrated by LysoTracker staining (Figure 6F).
To establish whether the effect of autophagy induced by EBSS and S1 was related to apoptosis, Western blotting was used to detect the expression of apoptosis-related proteins. The expression of cytochrome C, cleaved caspase-3, and cleaved PARP-1 increased significantly when HeLa cells were treated with CQ combined with EBSS and S1 (Figure 6C and E). These results indicated that S1-induced autophagy had a protective effect against apoptosis in HeLa cells.
Discussion
Cervical cancer is the most serious gynecological malignancy.15,16 Previously, treatment for cervical cancer has mainly been based on surgery and chemotherapy, for example, cisplatin.17,18 More recently, researchers have begun to focus on the abnormal energy metabolism in malignant cancer, which is characterized by aerobic glycolysis.19,20 Increased glycolysis provides ATP for cancer cells. Many researchers are now working on treatment for malignant cancer by focusing on glucose deprivation and/or blocking the glycolytic pathway.21,22
The current study is believed to provide the first evidence that glucose deprivation promotes an apoptotic response to S1 in HeLa cells. This conclusion is supported by the following findings: 1) glucose deprivation enhanced the inhibition of HeLa cell proliferation induced by S1; 2) glucose deprivation enhanced the apoptotic sensitivity to S1 in HeLa cells by inhibiting Bcl-2 and Mcl-1; and 3) glucose deprivation enhanced S1-induced autophagy in HeLa cells. Autophagy inhibitor CQ strengthened apoptosis in HeLa cells treated with S1 but weakened apoptosis in cells treated with S1 and EBSS.
Previous studies have shown that, in many cancers, one of the mechanisms involved in apoptosis evasion and treatment resistance is increased expression of antiapoptotic proteins such as Bcl-2, Mcl-1, and Bcl-xl.23–25 Hence, inhibition of expression of antiapoptotic proteins in the Bcl-2 family may be an effective method of cancer treatment. S1 is a novel BH3 mimetic and Bcl-2 inhibitor.8 It targets Bcl-2 and Mcl-1 and activates Bax/Bak, thus inducing tumor cell apoptosis. Our previous studies have shown that S1 induces apoptosis in melanoma B16, ovarian cancer SKOV3, and U251 glioma cells.14 Our present results also showed that S1 inhibited the viability of HeLa cells through promoting apoptosis.26 Our results also showed that S1 inhibited the expression of Bcl-2 and Mcl-1, increased the expression of Bax and Bak, increased the ratio of Bax/Bcl-2, and enhanced the expression of cleaved caspase-3, cytochrome C, and cleaved PARP-1. These results suggest that S1 induces apoptosis in HeLa cells.
Autophagy plays an important role in tumor cell death; moderate autophagy has a protective role in tumor cells, but severe autophagy enhances apoptosis.27–29 This was confirmed in our present study. We detected autophagy-related proteins by Western blotting. Atg12–5 complex and LC3 are ubiquitin-like protein-binding systems that are necessary for autophagy. p62 is an adapter protein that is also necessary for autophagy. Some studies have shown that p62 is accumulated if autophagy is disrupted. We showed that the expression of autophagy-related proteins LC3-II, Beclin 1, and Atg12–5 complex was increased significantly and the expression of p62 protein was decreased significantly in HeLa cells treated with S1 and glucose deprivation, compared with control cells. This indicated that glucose deprivation and S1 induced autophagy and glucose deprivation aggravated S1-induced autophagy in HeLa cells.
Some research has shown that S1 targets antiapoptotic proteins of the Bcl-2 family and induces apoptosis, but S1 induces autophagy, which is an adaptive response in cells and might limit the effect of chemotherapy.8 Our previous study showed that S1 promoted Beclin 1 release through the inhibition of Bcl-2 and induced LC3 II expression in human glioma U251 cells,14 which indicated that S1 induced autophagy in U251 cells. Our present study showed that S1 induced autophagy in HeLa cells. S1 increased the aggregation of the autophagy marker protein LC3II and increased the expression of autophagy-related proteins such as Atg 12–5 complex, LC3 II, and Beclin 1.
Conclusion
We evaluated the effect of glucose deprivation on the apoptotic response to S1 in human cervical cancer (HeLa) cells. Our results indicate that EBSS exacerbates autophagy induced by S1 and severe autophagy induced by EBSS and S1 leads to apoptosis in HeLa cells. The results suggest that EBSS enhances sensitivity to S1-induced apoptosis in HeLa cells, and autophagy plays an important role in this process. In other words, glucose deprivation promotes an apoptotic response to S1 by enhancing autophagy in HeLa cells.
Abbreviations
AMPK, AMP-activated protein kinase; ATF4, activating transcription factor 4; EBSS, Earle’s balanced salt solution; GADD153/CHOP, growth-arrest- and DNA-damage-inducible gene 153/C/EBP homology protein; Grp78, glucose-regulated protein-78; IRE1, inositol-requiring enzyme-1α; ; JNK, c-Jun N-terminal kinases; PARP-1, poly(ADP-ribose) polymerase 1; PDI, protein disulfide isomerase; p-eIF2α, phospho-eukaryotic initiation factor 2α; PERK, protein kinase R-like endoplasmic reticulum kinase
Acknowledgments
We wish to thank Dr Liankun Sun, Department of Pathology and Pathophysiology, School of Basic Medical Sciences, Jilin University, for help with the manuscript. In addition, we thank Cathel Kerr, PhD, from Liwen Bianji, Edanz Editing China (www.liwenbianji.cn/ac) for editing the English text of a draft of this manuscript. This study was funded by National Natural Science Foundation of China (81772794, 81672948, and 81472419), the 13th Five-year Science and Technology Project of Jilin Provincial Education Department (JJKH20180190KJ, JJKH20170834KJ, and JJKH20170825KJ), Jilin Provincial Research Foundation for the Development of Science and Technology Projects (20170623021TC and 20160414005GH), and the Youth Foundation of Health and Family Planning Commission of Jilin Province (2017Q025).
Disclosure
The authors report no conflicts of interest in this work.
References
Warburg O, Posener K, Negelein E. The metabolism of carcinoma cells. J Cancer Res. 1925;9(1):148–163. | ||
Warburg O. On the origin of cancer cells. Science. 1956;123(3191):309–314. | ||
Pelicano H, Martin DS, Xu RH, Huang P, Rh X. Glycolysis inhibition for anticancer treatment. Oncogene. 2006;25(34):4633–4646. | ||
Walker A, Singh A, Tully E, et al. Nrf2 signaling and autophagy are complementary in protecting breast cancer cells during glucose deprivation. Free Radic Biol Med. 2018;120:407–413. | ||
Xie L, Feng X, Shi Y, et al. Blocking the glycolytic pathway sensitizes breast cancer to sonodynamic therapy. Ultrasound Med Biol. 2018;44(6):1233–1243. | ||
Alves NL, Derks IA, Berk E, Spijker R, van Lier RA, Eldering E. The Noxa/Mcl-1 axis regulates susceptibility to apoptosis under glucose limitation in dividing T cells. Immunity. 2006;24(6):703–716. | ||
Pradelli LA, Bénéteau M, Chauvin C, et al. Glycolysis inhibition sensitizes tumor cells to death receptors-induced apoptosis by AMP kinase activation leading to Mcl-1 block in translation. Oncogene. 2010;29(11):1641–1652. | ||
Zhang Z, Song T, Zhang T, et al. A novel BH3 mimetic S1 potently induces Bax/Bak-dependent apoptosis by targeting both Bcl-2 and Mcl-1. Int J Cancer. 2011;128(7):1724–1735. | ||
Liu Y, Xie M, Song T, Sheng H, Yu X, Zhang Z. A novel BH3 mimetic efficiently induces apoptosis in melanoma cells through direct binding to anti-apoptotic Bcl-2 family proteins, including phosphorylated Mcl-1. Pigment Cell Melanoma Res. 2015;28(2):161–170. | ||
Xiang XY, Kang JS, Yang XC, et al. SIRT3 participates in glucose metabolism interruption and apoptosis induced by BH3 mimetic S1 in ovarian cancer cells. Int J Oncol. 2016;49(2):773–784. | ||
Li X, Su J, Xia M, et al. Caspase-mediated cleavage of Beclin1 inhibits autophagy and promotes apoptosis induced by S1 in human ovarian cancer SKOV3 cells. Apoptosis. 2016;21(2):225–238. | ||
Yang X, Xiang X, Xia M, et al. Inhibition of JNK3 promotes apoptosis induced by BH3 mimetic S1 in chemoresistant human ovarian cancer cells. Anat Rec. 2015;298(2):386–395. | ||
Liu N, Xu Y, Sun JT, et al. The BH3 mimetic S1 induces endoplasmic reticulum stress-associated apoptosis in cisplatin-resistant human ovarian cancer cells although it activates autophagy. Oncol Rep. 2013;30(6):2677–2684. | ||
Zhong JT, Xu Y, Yi HW, et al. The BH3 mimetic S1 induces autophagy through ER stress and disruption of Bcl-2/Beclin 1 interaction in human glioma U251 cells. Cancer Lett. 2012;323(2):180–187. | ||
Morice P, Uzan C, Gouy S, Verschraegen C, Haie-Meder C. Gynaecological cancers in pregnancy. Lancet. 2012;379(9815):558–569. | ||
Skrzypczyk-Ostaszewicz A, Rubach M. Gynaecological cancers coexisting with pregnancy - a literature review. Contemp Oncol. 2016;20(3):193–198. | ||
Rose PG, Bundy BN, Watkins EB, et al. Concurrent cisplatin-based radiotherapy and chemotherapy for locally advanced cervical cancer. N Engl J Med. 1999;340(15):1144–1153. | ||
Wang JQ, Wang T, Shi F, et al. A randomized controlled trial comparing clinical outcomes and toxicity of lobaplatin- versus cisplatin-based concurrent chemotherapy plus radiotherapy and high-dose-rate brachytherapy for FIGO stage II and III cervical cancer. Asian Pac J Cancer Prev. 2015;16(14):5957–5961. | ||
de Preter G, Neveu MA, Danhier P, et al. Inhibition of the pentose phosphate pathway by dichloroacetate unravels a missing link between aerobic glycolysis and cancer cell proliferation. Oncotarget. 2016;7(3):2910–2920. | ||
Peng X, Gong F, Chen Y, et al. Autophagy promotes paclitaxel resistance of cervical cancer cells: involvement of Warburg effect activated hypoxia-induced factor 1-α-mediated signaling. Cell Death Dis. 2014;5:e1367. | ||
Pusapati RV, Daemen A, Wilson C, et al. mTORC1-Dependent metabolic reprogramming underlies escape from glycolysis addiction in cancer cells. Cancer Cell. 2016;29(4):548–562. | ||
Masui K, Tanaka K, Ikegami S, et al. Glucose-dependent acetylation of Rictor promotes targeted cancer therapy resistance. Proc Natl Acad Sci U S A. 2015;112(30):9406–9411. | ||
Leverson JD, Phillips DC, Mitten MJ, et al. Exploiting selective BCL-2 family inhibitors to dissect cell survival dependencies and define improved strategies for cancer therapy. Sci Transl Med. 2015;7(279):ra240. | ||
Delbridge AR, Strasser A. The BCL-2 protein family, BH3-mimetics and cancer therapy. Cell Death Differ. 2015;22(7):1071–1080. | ||
Um HD, Hd U. Bcl-2 family proteins as regulators of cancer cell invasion and metastasis: a review focusing on mitochondrial respiration and reactive oxygen species. Oncotarget. 2016;7(5):5193–5203. | ||
Shen L, Wen N, Xia M, et al. Calcium efflux from the endoplasmic reticulum regulates cisplatin-induced apoptosis in human cervical cancer HeLa cells. Oncol Lett. 2016;11(4):2411–2419. | ||
Mariño G, Niso-Santano M, Baehrecke EH, Kroemer G. Self-consumption: the interplay of autophagy and apoptosis. Nat Rev Mol Cell Biol. 2014;15(2):81–94. | ||
Fernández A, Ordóñez R, Reiter RJ, González-Gallego J, Mauriz JL. Melatonin and endoplasmic reticulum stress: relation to autophagy and apoptosis. J Pineal Res. 2015;59(3):292–307. | ||
Sui X, Kong N, Ye L, et al. p38 and JNK MAPK pathways control the balance of apoptosis and autophagy in response to chemotherapeutic agents. Cancer Lett. 2014;344(2):174–179. |
 © 2018 The Author(s). This work is published and licensed by Dove Medical Press Limited. The full terms of this license are available at https://www.dovepress.com/terms.php and incorporate the Creative Commons Attribution - Non Commercial (unported, v3.0) License.
By accessing the work you hereby accept the Terms. Non-commercial uses of the work are permitted without any further permission from Dove Medical Press Limited, provided the work is properly attributed. For permission for commercial use of this work, please see paragraphs 4.2 and 5 of our Terms.
© 2018 The Author(s). This work is published and licensed by Dove Medical Press Limited. The full terms of this license are available at https://www.dovepress.com/terms.php and incorporate the Creative Commons Attribution - Non Commercial (unported, v3.0) License.
By accessing the work you hereby accept the Terms. Non-commercial uses of the work are permitted without any further permission from Dove Medical Press Limited, provided the work is properly attributed. For permission for commercial use of this work, please see paragraphs 4.2 and 5 of our Terms.