")
Back to Journals » Cancer Management and Research » Volume 12
Glucosamine-6-Phosphate Isomerase 1 Promotes Tumor Progression and Indicates Poor Prognosis in Hepatocellular Carcinoma
Authors Li D, Cheng X, Zheng W , Chen J
Received 16 February 2020
Accepted for publication 21 May 2020
Published 24 June 2020 Volume 2020:12 Pages 4923—4935
DOI https://doi.org/10.2147/CMAR.S250094
Checked for plagiarism Yes
Review by Single anonymous peer review
Peer reviewer comments 2
Editor who approved publication: Professor Rudolph Navari
Dezhi Li, 1 Xianyi Cheng, 1 Wei Zheng, 2 Junhui Chen 1
1Intervention and Cell Therapy Center, Peking University Shenzhen Hospital, Shenzhen Peking University-The Hong Kong University of Science and Technology Medical Center, Shenzhen, Guangdong, People’s Republic of China; 2Department of Research and Development, Shenzhen Institute for Innovation and Translational Medicine, Shenzhen, Guangdong, People’s Republic of China
Correspondence: Wei Zheng
Department of Research and Development, Shenzhen Institute for Innovation and Translational Medicine, Shenzhen International Biological Valley-Life Science Industrial Park, Shenzhen 518119, Guangdong, People’s Republic of China
Tel +86 135 04319 000
Email [email protected]
Junhui Chen
Intervention and Cell Therapy Center, Peking University Shenzhen Hospital, Shenzhen Peking University-The Hong Kong University of Science and Technology Medical Center, Futian District, Shenzhen 518035, Guangdong, People’s Republic of China
Tel +86 138 2316 1919
Email [email protected]
Purpose: Reprogramming of metabolic pathways is a hallmark of the pathological changes that occur in cancer cells. Under physiological conditions, glucosamine-6-phosphate isomerase 1 (GNPDA1) promotes the conversion of the hexosamine system to the glycolytic pathway and may, therefore, affect energy metabolism. Low expression of GNPDA1 has been reported in normal liver tissues, however, analysis of the hepatocellular carcinoma (HCC) database in The Cancer Genome Atlas (TCGA) revealed that GNPDA1 was highly expressed in HCC tissues. The purpose of this study was to explore the role of GNPDA1 in HCC.
Patients and Methods: We analyzed the expression of GNPDA1 in HCC tissues as well as the clinical outcomes of HCC patients with high or low expression of GNPDA1. Furthermore, the relationship between the expression of GNPDA1 and advanced tumor stage, TNM stage, grade, gender, or metastasis was assessed using high-throughput RNA sequencing data from TCGA HCC cohort and Kaplan–Meier survival analysis. The expression of GNPDA1 in HCC and normal liver cell lines was subsequently detected by qRT-PCR and Western blot analysis. Additionally, the effects of GNPDA1 knockdown in SMMC-7721 and Huh7 cell lines were examined. Cell proliferation, migration, invasion, and apoptosis following knockdown were investigated by the MTT assay and EdU, cell cycle, apoptosis, transwell, and wound healing analyses.
Results: There was a significant association between high GNPDA1 expression and advanced tumor stage, TNM stage or grade, but not with gender. High GNPDA1 expression was associated with poor prognosis in patients with HCC. Furthermore, the MTT assay and EdU, cell cycle, apoptosis, wound healing, and transwell analyses revealed that GNPDA1 promoted the proliferation, migration, and invasion of HCC cells and inhibited apoptosis.
Conclusion: The results of this study suggest that GNPDA1 may serve as a novel prognostic biomarker and therapeutic target for HCC.
Keywords: hepatocellular carcinoma, glucosamine-6-phosphate isomerase 1, poor prognosis, reprogramming of metabolic pathways
Corrigendum for this paper has been published
Introduction
Liver cancer is a common malignant tumor, accounting for 5.6 and 12.9% of the total cancer incidence in China and worldwide, respectively, in 2012.1 Furthermore, it was the third most common cancer in China in 2010.2,3 Globally, liver cancer was the sixth most common cancer death in 2018.4 The morbidity and mortality of liver cancer are consistently high, which seriously threaten patient health.5–7 Hepatocellular carcinoma (HCC) is the main type of liver cancer, and is characterized by high malignancy, recurrence, drug resistance, and late diagnosis.7–9 Early diagnosis and treatment are important strategies to improve patient prognosis. Alpha-fetoprotein (AFP), a classical marker of HCC, has been applied for the clinical detection of the disease for several years.10 More novel markers, including alpha-fetoprotein heterogeneous body 3 (AFP-L3), abnormal prothrombin (DCP/PIVKA-II), Golgi protein 73 (GP73), and phosphatidyl 3 (GPC-3), are gaining increasing popularity.10–14 Additionally, liquid biopsies for the analysis of circulating microRNA, tumor cells, and tumor DNA have developed rapidly in recent years, and may facilitate the early diagnosis of HCC.15
Metabolic reprogramming is one of the fundamental characteristics of tumor cells,16 and is a novel marker for tumors.17 Metabolic reprogramming balances energy demand and anabolic metabolism, and facilitates the synthesis of biological macromolecules to meet the requirements of rapidly proliferating cells.16,18 The widely known “Warburg effect” proposes that tumor cells exhibit an abnormally high rate of glycolysis, which is accompanied by weakened mitochondrial aerobic metabolism.17 Metabolic changes in HCC include a number of pathways involving aerobic glycolysis, pentose phosphate, tricarboxylic acid cycle, fatty acids, and glutathione. Furthermore, poor prognosis in patients with HCC is related to the aberrant expression of several metabolism-related genes.9,19-21 This suggests that metabolic reprogramming in HCC may serve as a novel therapeutic target for the disease.
Glucosamine-6-phosphate isomerase 1 (GNPDA1/GNP1) belongs to the glucosamine 6-phosphate deaminase family,22,23 and catalyzes the conversion of glucosamine 6-phosphate to fructose 6-phosphate.22,24 GNPDA1 links the hexosamine system with the glycolytic pathway, and may therefore promote the catabolism of hexosamines derived from glycoproteins, glycolipids, and sialic acids into phosphate sugars to provide energy sources.25
Generally, tumor cells in HCC exhibit high levels of glucose metabolism, in which glycolysis is abnormally active, known as the “Warburg effect”. Furthermore, GNPDA1 promotes the conversion of glucosamine to fructose 6-phosphate, increasing the raw materials for glycolysis.9,17,26 Few studies have investigated the association between GNPDA1 expression and HCC, therefore, the importance and clinical significance of GNPDA1 in HCC was investigated in the present study.
Materials and Methods
Bioinformatics Analysis
The transcriptome profiling data of 50 normal and 374 HCC tissues were downloaded from The Cancer Genome Atlas (TCGA) (https://portal.gdc.cancer.gov/). GNPDA1 expression data in these unpaired samples was further extracted using the limma package (version 3.8) (https://bioconductor.org/packages/release/bioc/html/limma.html) in R software (version 3.5.1) (https://cran.r-project.org/). GNPDA1 expression data in 50 paired samples from TCGA were obtained using The Perl Programming Language (version 5.30.0) (https://www.perl.org/).
A total of 342 cases was downloaded from TCGA and the association between GNPDA1 expression and gender, staging, tumor size, distant metastasis or lymph node metastasis was determined using The Perl Programming Language (version 5.30.0). Incomplete data were deleted. The overall survival (OS) and disease‐free survival (DFS) were the primary endpoint of this study. OS was defined as the time from diagnosis to death or last examination. DFS was defined as the time between diagnosis or surgery and the recurrence of disease or death (for any reason) at the last follow‐up.
Cell Culture
The HepG2 and Hep-3B cell lines were purchased from the American Type Culture Collection (Manassas, VA, USA). The L-02, SMMC-7721, and Huh7 cell lines were obtained from Antihela BioTech (Xiamen, Fujian, China). Cells were cultured in DMEM (Gibco; Thermo Fisher Scientific, Inc., Waltham, MA, USA) supplemented with 10% fetal bovine serum (FBS), 100 U/mL penicillin, and 100 U/mL streptomycin and maintained at 37°C and 5% CO2.
Construction of Stable GNPDA1-Knockdown Cell Lines
The pLV-sh-puro vector was used to construct lentiviruses for GNPDA1 RNA interference (shGNPDA1) and control (shctrl) experiments. shGNPDA1-1 and shGNPDA1-2, were designed based on the human GNPDA1 gene. The shGNPDA1 primer sequences were designed and synthesized according to the pLV-sh-puro vector specification and the gene of GNPDA1 (Table 1).
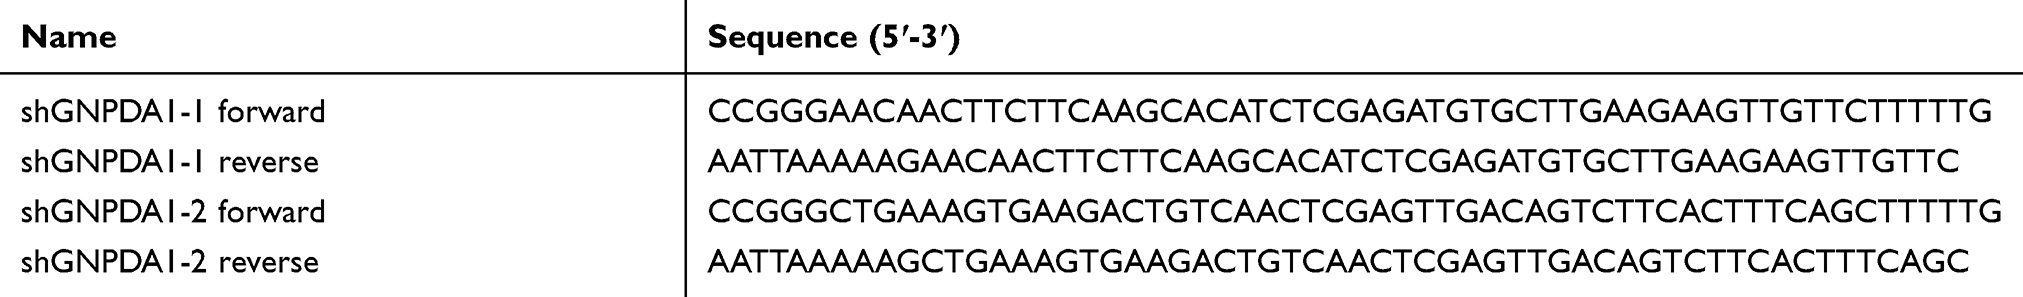 |
Table 1 The Primer Sequences of shGNPDA1 |
To prepare lentiviral particles, 9 μg of the shGNPDA1 vector and the packaging plasmids (3 μg pMD2G and 6 μg pspax2) were co-transfected into 293T cells from Antihela BioTech (Xiamen, Fujian, China) using Lipofectamine 2000 (Invitrogen; Thermo Fisher Scientific, Inc., Waltham, MA, USA). Lentivirus-containing medium was collected 48 h post-transfection and used to culture SMMC-7721 and Huh7 cells. After 48 h, the medium was replaced with fresh medium, and puromycin was added at a final concentration of 1.0 μg/mL. After 72 h, the cells were collected for GNPDA1 expression analysis. SMMC-7721 and Huh7 cells with the highest knockdown efficiency were used for subsequent experimentation.
Quantitative Real‑time PCR (qRT-PCR) Assay
Total RNA was isolated from cells using TRIzol reagent, and was reverse transcribed into cDNA using a HiScript II 1st Strand cDNA Synthesis kit (Vazyme, Piscataway, NJ, USA). The iQ5 Real-Time PCR Detection System (Bio-Rad Laboratories, Hercules, CA, USA) and the ChamQ SYBR qRT-PCR Master Mix kit (Vazyme, Piscataway, NJ, USA) were used to perform qRT-PCR to detect the mRNA expression levels of the target genes. The primers were designed using DNAMAN 10.0 (https://dnaman.software.informer.com/) for qRT-PCR and are presented in Table 2. The thermocycling conditions were: 94°C 3 min, followed by 94°C 15 sec, 60°C 20 sec and 72°C 20 sec, for 40 cycles. Each detection was carried out in triplicate. Finally, the target gene was quantified by the 2−ΔΔCt method.
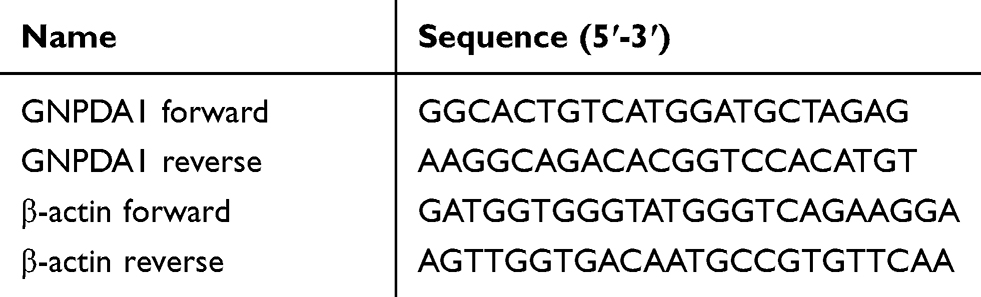 |
Table 2 The Primers of qRT-PCR |
Western Blot Assay
Cells were lysed in ice-cold RIPA buffer, and total protein (20 µg/lane) was separated by SDS-PAGE on 10% gels. Separated proteins were transferred onto PVDF membranes, which were subsequently incubated with the primary antibodies for 2 h at room temperature. Following primary antibody incubation, the membranes were incubated with the appropriate secondary antibodies for 1 h at room temperature. The following primary antibodies were used in present study: anti-GNPDA1 (Catalog No.: 12,312-1-AP, 1:1000, Proteintech, Wuhan, China) and anti-GAPDH (Catalog No.: 60,004-1-lg, 1:20,000, Proteintech, Wuhan, China). Anti-mouse (Catalog No.: 9309, 1:2000, Cell Signaling Technology, Inc., Danvers, MA, USA) and anti-rabbit (Catalog No.: 7074, 1:2000, Cell Signaling Technology, Inc., Danvers, MA, USA) secondary antibodies were used.
MTT Assay
SMMC-7721 and Huh7 cells stably expressing shctrl or shGNPDA1 were seeded in 96-well plates at a density of 10,000 cells per well. After 24, 48, or 72 h, 20 μL MTT (5 mg/mL) was added to each well and the cells were incubated at 37°C for 4 h. The culture supernatant in the wells was aspirated, and 150 μL DMSO was added to each well to dissolve the formazan crystals. The optical density was measured at a wavelength of 490 nm using an enzyme-linked immunosorbent monitor. The cell growth curve was plotted with time as the abscissa and absorbance as the ordinate.
EdU Assay
SMMC-7721 and Huh7 cells stably expressing shctrl or shGNPDA1 were seeded in 96-well plates at a density of 10,000 cells per well. After 24 h, the cells were incubated at 37°C for 4 h with DMEM containing 50 µm EdU (Guangzhou RiboBio Co., Ltd., Guangzhou, China). The cells were subsequently fixed with 4% formaldehyde for 20 min, followed by addition of glycine for 5 min. After treatment with 0.5% Triton X-100 for 10 min at 28°C, the cells were washed twice with PBS. The cells in each well were incubated with 200 μL 1X Apollo reaction cocktail for 20 min. Subsequently, nuclear DNA was stained with DAPI (5 μg/mL). The cells were visualized under a fluorescence microscope (MOTIC, Hongkong, China) and imaged.
Cell Cycle Assay
SMMC-7721 and Huh7 cells stably expressing shctrl or shGNPDA1 were seeded into 6-well plates at a density of 100,000 cells per well.in equal numbers. After 24 h, the cells were harvested and fixed in 70% ethanol at 4°C overnight. The cells were washed twice with PBS, and the fixed cells were incubated in PBS containing 0.2% Triton X-100 and 10 μg/mL RNase at 37°C for 30 min. The cells were subsequently incubated with 20 μg/mL propidium iodide (PI) for 30 min at room temperature in the dark, and analyzed using a flow cytometer.
Cell Apoptosis Assay
SMMC-7721 and Huh7 cells stably expressing shctrl or shGNPDA1 were seeded into 6-well plates at a density of 100,000 cells per well. After 48 h, adherent and floating cells were collected and resuspended in incubation buffer. The cells were then incubated with Annexin V-FITC and PI (Catalog No.: A211-02, Vazyme, Piscataway, NJ, USA) for 10 min at 28°C in the dark and analyzed using a flow cytometer. The results were presented as the percentage of apoptotic cells relative to all the analyzed cells.
Wound Healing Assay
SMMC-7721 and Huh7 cells stably expressing shctrl or shGNPDA1 were seeded in 6-well plates and grown to 100% confluence. A wound was created by scratching the confluent cell monolayer with a 20 μL pipette tip. The cells were cultured in serum-free medium for 24 h and the width of the gap was subsequently observed under a microscope.
Transwell Assay
For migration assays, a total of 1 × 10⁵ A-498 cells stably expressing shctrl or shGNPDA1 were plated in the upper chambers of Transwell plates (8-μm pore size; Corning, Inc., Corning, NY, USA) containing serum-free medium, and 10% FBS medium was added to the lower chambers of Transwell plates. Following incubation for 24 h, the migratory cells were stained with 0.5% crystal violet. Stained cells were counted in six randomly-selected fields. For invasion assays, the Transwell plates were coated with Matrigel, and the subsequent steps were consistent with migration assays.
Statistical Analysis
The data are presented as the mean ± SD. The paired t-test was used to analyze two paired groups, the independent t-test was used to analyze two groups and the one-way analysis of variance was used to analyze several groups. The effect of GNPDA1 expression on survival was evaluated by the Kaplan–Meier (KM) method, and the survival curves were compared with the Log rank test. The OS was divided into OS-good and OS-poor. OS-good referred to patients who survived or are disease-free for ≥5 years. OS-poor referred to patients who succumbed to the disease or relapsed within two years. p < 0.05 was considered to indicate a statistically significant difference. Statistical analyses were performed with SPSS software (version 22.0; IBM Corp., Armonk, NY, USA).
Results
High Expression of GNPDA1 Confers Poor Prognosis in Patients with HCC
To investigate the role of GNPDA1 in HCC, the GNPDA1 mRNA expression in HCC tissues in TCGA was investigated. Compared with normal liver tissue, GNPDA1 mRNA expression was significantly increased in HCC tissues (Figure 1A). Moreover, the expression of GNPDA1 in HCC tissues was higher than that in paracancerous tissues (Figure 1B). In addition, there was a significant association between high GNPDA1 expression and advanced tumor stage (T stage), TNM stage, or grade, but not with gender (Figure 1C–F). We explored the prognostic significance of GNPDA1 in HCC, indicating that GNPDA1 expression was higher in patients with OS-poor and patients who had succumbed to the disease (Figure 1G and H). In conclusion, these data suggested that GNPDA1 expression may be used as prognostic indicator in patients with HCC.
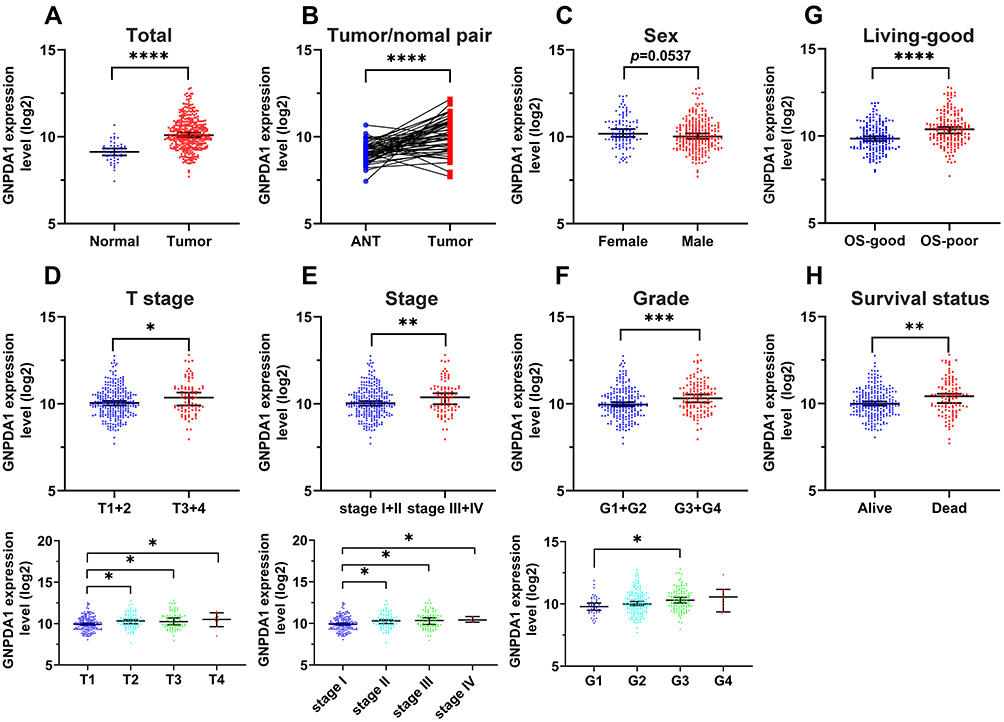 |
Figure 1 GNPDA1 is highly expressed in HCC tissues, which suggests poor prognosis in patients with HCC. (A) Comparison of the GNPDA1 mRNA levels in normal tissues and HCC tissues from TCGA. (B) Comparison of the GNPDA1 mRNA levels in paired adjacent normal tissues and HCC tissues from TCGA. (C) Scatter plots of GNPDA1 expression in HCC patients of different genders. (D) Scatter plots of GNPDA1 expression in different T stages of HCC. (E) Scatter plots of GNPDA1 expression in different TNM stages of HCC. (F) Scatter plots of GNPDA1 expression in different grade of HCC. (G) Comparison of GNPDA1 expression levels between OS-good and OS-poor HCC patients. (H) Comparison of the GNPDA1 mRNA levels in recovered patients and in patients who succumbed to HCC. OS-good referred to patients who survived or are disease-free for ≥5 years. OS-poor referred to patients who succumbed to the disease or relapsed within two years. *P < 0.05, **P < 0.01, ***P < 0.001, and ****P<0.0001. Abbreviations: OS, overall survival; ANT, adjacent normal tissue; G1, grade 1; G2, grade 2; G3, grade 3; G4, grade 4; G1+G2, grade 1 and grade 2; G3+G4, grade 3 and grade 4; GNPDA1, glucosamine-6-phosphate isomerase 1. |
GNPDA1 Expression Is Associated with HCC
To investigate whether GNPDA1 expression is associated with poor prognosis in patients with HCC, ROC curves were used to analyze whether GNPDA1 expression could be used to effectively differentiate HCC patients based on distinct pathological parameters. GNPDA1 expression was able to discriminate HCC from normal tissues (AUC = 0.8370, 95% CI: 0.7880–0.8860, p < 0.0001, Figure 2A). Similarly, GNPDA1 expression effectively distinguished HCC from normal tissues in 50 paired samples (AUC = 0.7998, 95% CI: 0.7107–0.8889, p < 0.0001, Figure 2B). We also found significant differences in GNPDA1 expression in HCC subgroups, including grade (grade 1+grade 2/grade 3+grade 4, AUC = 0.5966, p = 0.0020), TNM stage (TNM stage I+II/TNM stage III+IV, AUC = 0.5875, p = 0.0135), T stage (T1+T2/T3+T4, AUC = 0.5783, p = 0.0297), status (alive/decreased, AUC = 0.5692, p = 0.0273) and good or poor OS (AUC = 0.6284, p < 0.0001; Figure 2C–G). These results demonstrate that high GNPDA1 expression was associated with poor prognosis in patients with HCC.
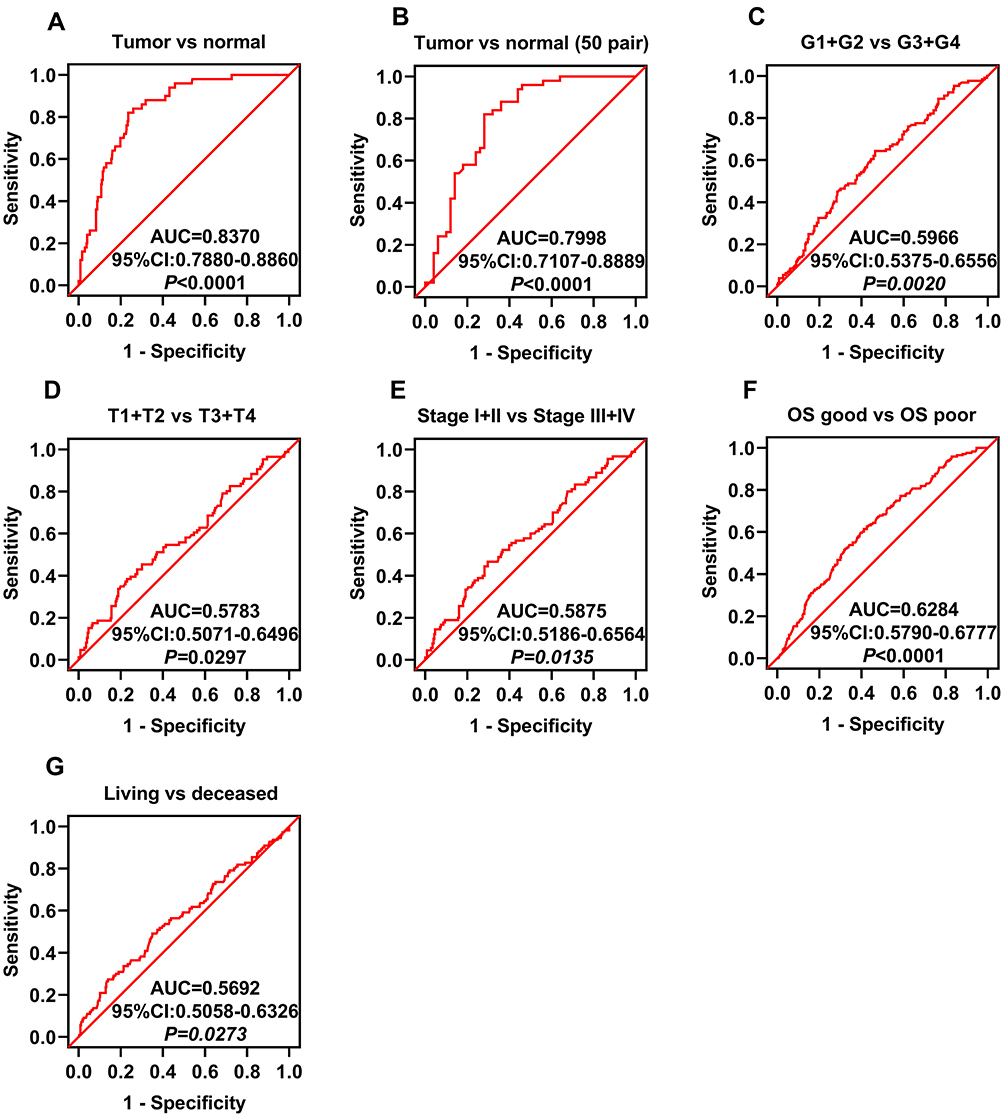 |
Figure 2 GNPDA1 expression is associated with HCC. ROC curve analysis of GNPDA1 expression and clinical parameters in patients with HCC. (A, B) ROC curve analysis showed that GNPDA1 expression was able to discriminate between (A) HCC and normal tissues (AUC = 0.8370, P < 0.0001) and (B) HCC and normal paired tissues (AUC = 0.7998, P < 0.0001). ROC curve analysis of GNPDA1 mRNA levels in subgroups of patients with HCC and (C) grade, (D) T stage, (E) TNM stage, (F) OS good vs. poor, and (G) living status. OS good referred to patients who survived or are disease-free for ≥5 years. OS poor referred to patients who succumbed to the disease or relapsed within two years. Abbreviations: AUC, area under the curve; OS, overall survival; ROC, receiver operator characteristic; G1+G2, grade 1 and grade 2; G3+G4, grade 3 and grade 4. |
Patients with High GNPDA1 Expression Have Higher Probability to Exhibit a Shorter OS Time
We determined the association between OS time and GNPDA1 expression in patients with HCC by KM survival analysis. According to the median GNPDA1 mRNA expression value, we divided 342 patients in the TCGA into two groups, High GNPDA1 mRNA group and Low GNPDA1 mRNA group. Patients with high GNPDA1 expression have higher probability to exhibit a shorter OS time compared to patients with low GNPDA1 expression (p = 0.0011, Figure 3A). Moreover, we analyzed the association between the OS and GNPDA1 expression in various clinical subgroups. As shown in Figure 3B–F and H–J, compared with patients with low GNPDA1 expression, males (p = 0.0050), >65 years (p = 0.0102), ≤65 years (p = 0.0283), grade 1+grade 2 (p = 0.0197), T1 + T2 stage (p = 0.0443), N0 (p = 0.0017) and M0 (p = 0.0026) patients with high GNPDA1 mRNA level have higher probability to exhibit a shorter OS time. Grade 3+grade 4 (p = 0.0416) patients with high GNPDA1 mRNA level exhibit a shorter OS time (Figure 3G). Next, we used UCSC Xena (https://xenabrowser.net/) to analyze the relationship between GNPDA1 levels and DFS time, finding that patients with high GNPDA1 levels had a higher probability of short DFS time (Figure 3K). Taken together, these results indicate that patients with high GNPDA1 expression have higher probability to exhibit a shorter OS time. Moreover, univariate and multivariate analyses demonstrated that GNPDA1 might be an independent prognostic factor for ADC patients (Table 3). In summary, these findings strongly suggested that GNPDA1 might serve as a prognostic biomarker of HCC.
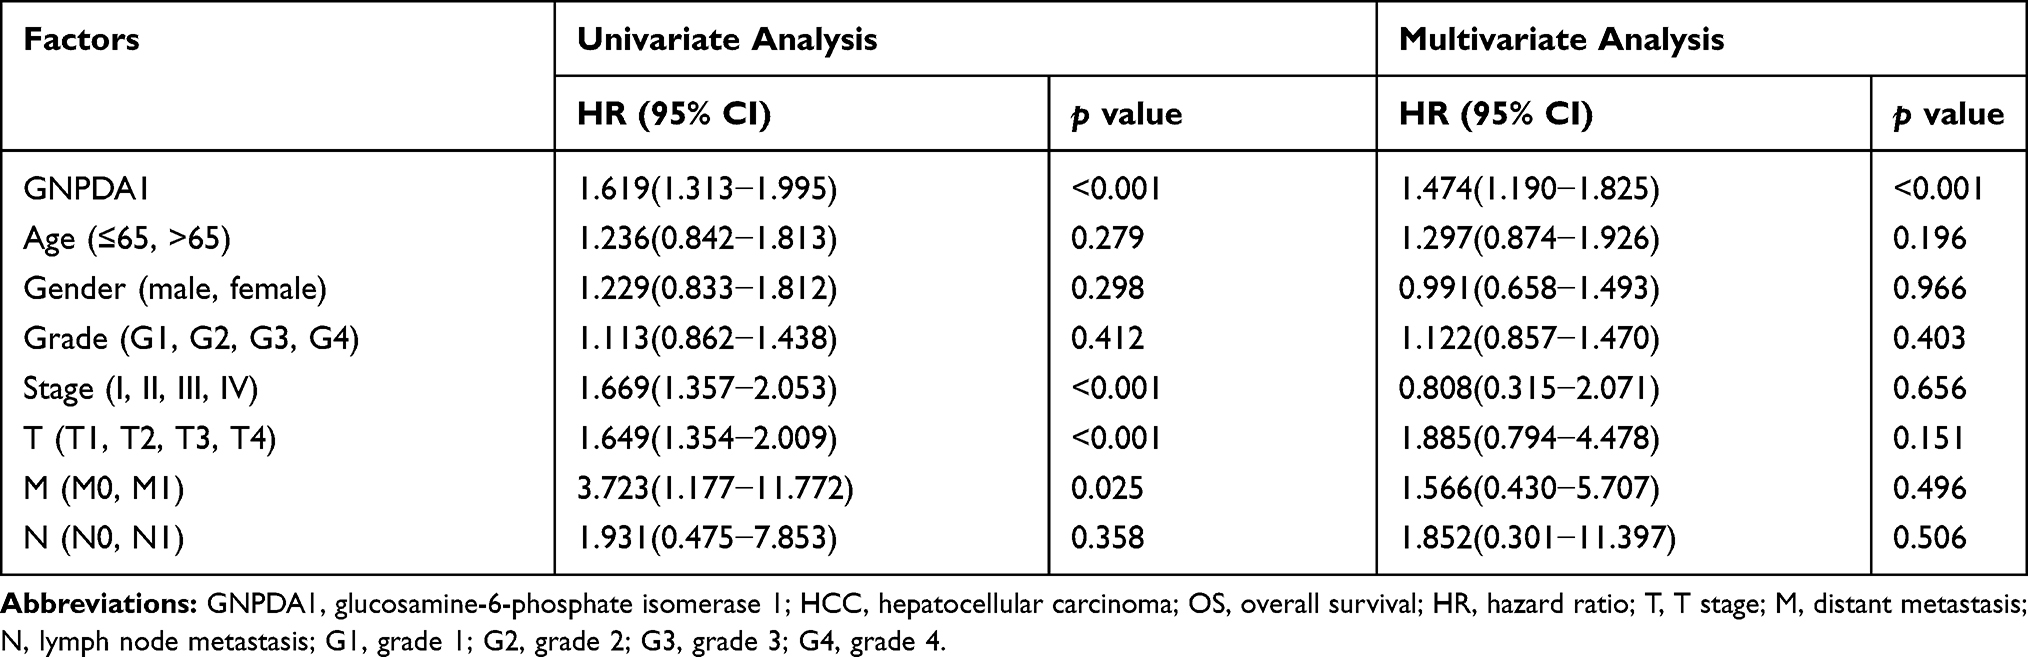 |
Table 3 Univariate and Multivariate Cox Regression Analyses for OS in Patients with HCC (n=342) |
 |
Figure 3 Patients with high GNPDA1 expression have higher probability to exhibit a shorter OS time. Patients with HCC in TCGA were divided into low and high GNPDA1 expression groups based on the median value of GNPDA1 mRNA expression. (A) The association between GNPDA1 mRNA expression level and OS time in patients with HCC was assessed by the Kaplan–Meier method. (B–J) OS analysis was performed in the following subgroups of patients with HCC: (B) male, (C) female, (D) age >65 years, (E) age ≤65 years, (F) G1+G2, (G) G3+G4, (H) T1+T2, (I) N0 stage, (J) M0 stage. (K) The association between GNPDA1 mRNA expression level and DFS time in patients with HCC was assessed by the KM method. Abbreviations: G1+G2, grade 1 and grade 2; G3+G4, grade 3 and grade 4; OS, overall survival; DFS, disease-free survival; GNPDA1, glucosamine-6-phosphate isomerase 1. |
GNPDA1 Is Highly Expressed in HCC Cell Lines
To investigate the function of GNPDA1 in HCC, we compared GNPDA1 expression in HCC cell lines (SMMC-7721, HepG2, Huh7 and Hep-3B) and a normal liver cell line (L-02) by qRT-PCR and Western blotting. As shown in Figure 4A and B, both the mRNA and protein expression levels of GNPDA1 were higher in HCC cells compared with L-02 cells. The GNPDA1 expression level was highest in SMMC-7721 cells, followed by Huh7 cells, therefore these cell lines were selected for subsequent experimentation. Two lentiviruses targeting human GNPDA1 (shGNPDA1-1 and shGNPDA1-2) as well as a negative control (shctrl) were produced and used to generate SMMC-7721 and Huh7 cells with stable GNPDA1 knockdown. The knockdown efficiency was assessed by Western blot analysis and qRT-PCR. The results showed that shGNPDA1 effectively inhibited the expression of endogenous GNPDA1 in SMMC-7721 and Huh7 cell lines (Figure 4C and D).
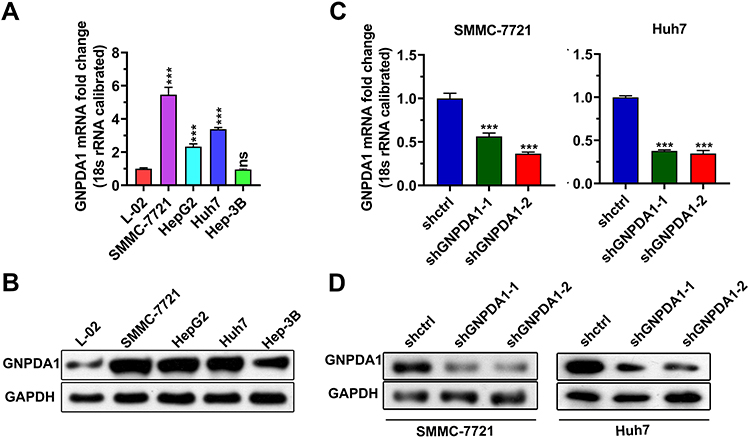 |
Figure 4 Generation of stable knockdown-GNPDA1 cell lines. The GNPDA1 expression level in L-02, SMMC-7721, HepG2, Huh7, and Hep-3B cell lines was analyzed by (A) qRT-PCR and (B) Western blot analysis. (C and D) GNPDA1 expression levels in SMMC-7721 and Huh7 cells following knockdown were evaluated by qRT-PCR and Western blot analysis. ***P < 0.001. Abbreviations: shctrl, the control cell line of cell line with low GNPDA1; shGNPDA1-1, Cell line numbered 1 with low GNPDA1; shGNPDA1-2, Cell line numbered 2 with low GNPDA1; GAPDH, Glyceraldehyde-3-phosphate dehydrogenase; GNPDA1, glucosamine-6-phosphate isomerase 1; ns, not significant. |
GNPDA1 Enhances Cell Proliferation and Suppresses Apoptosis
The effect of GNPDA1 on the proliferation of SMMC-7721 and Huh7 cells with stable GNPDA1 knockdown was assessed using the MTT assay. As shown in Figure 5A, the proliferation of SMMC-7721 and Huh7 cells with stable GNPDA1 knockdown at 72 h was significantly lower than that of control cells, indicating that GNPDA1 promoted cell proliferation (Figure 5A). Moreover, the results of the cell cycle assay showed that GNPDA1 knockdown increased the percentage of cells in the G0/G1 phase, which also suggested that GNPDA1 promoted cell proliferation (Figure 5B and C). In addition, the EdU proliferation assay revealed that SMMC-7721 and Huh7 cells with stable GNPDA1 knockdown had a lower EdU+ rate compared with control cells (Figure 5D and E).
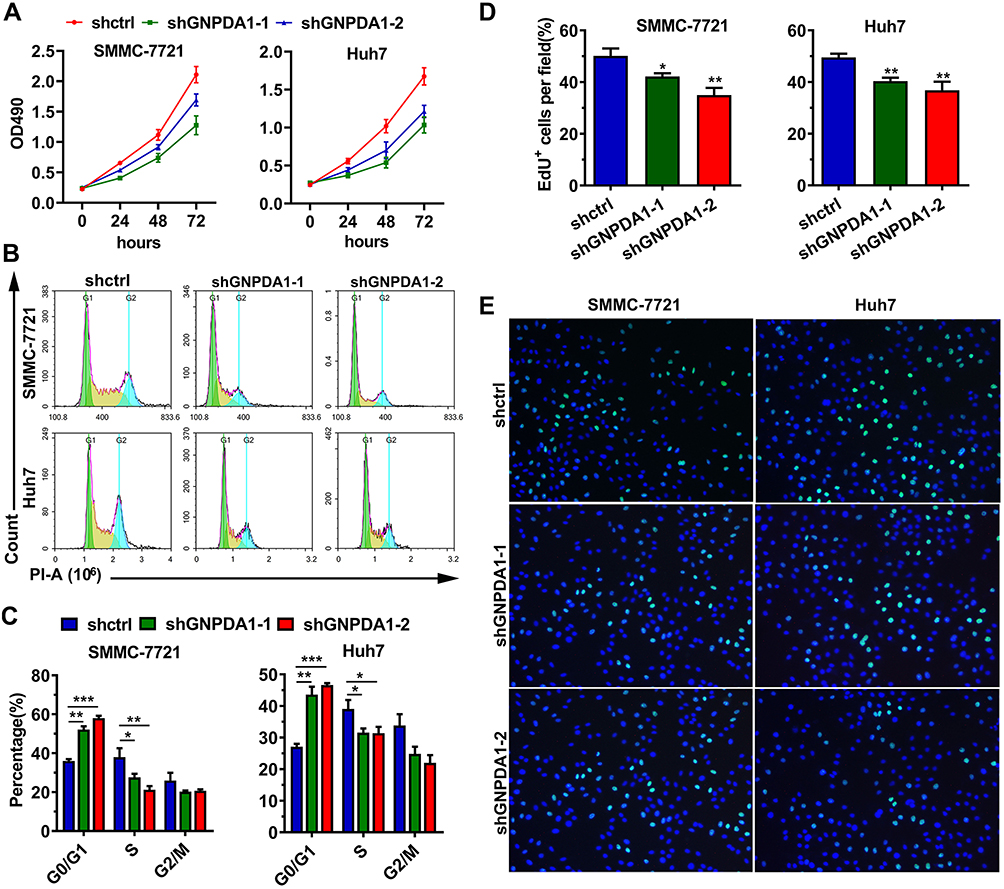 |
Figure 5 GNPDA1 enhances cell proliferation. (A) Results of the MTT assay performed in SMMC-7721 and Huh7 cells with GNPDA1 knockdown and controls. (B) Representative images of the cell cycle analysis. (C) GNPDA1 knockdown induced G0/G1 arrest. (D) Representative images of the EdU proliferation assay. (E) Quantification of EdU-positive cells (n = 3). *P < 0.05, **P < 0.01, and ***P < 0.001. Abbreviations: shctrl, the control cell line of cell line with low GNPDA1; shGNPDA1-1, Cell line numbered 1 with low GNPDA1; shGNPDA1-2, Cell line numbered 2 with low GNPDA1; GNPDA1, glucosamine-6-phosphate isomerase 1. |
Annexin-V/PI staining and flow cytometry revealed that stable GNPDA1 knockdown in SMMC-7721 and Huh7 cells increased the proportion of apoptotic cells compared with controls (Figure 6A and B), suggesting that GNPDA1 serves as an inhibitor of apoptosis.
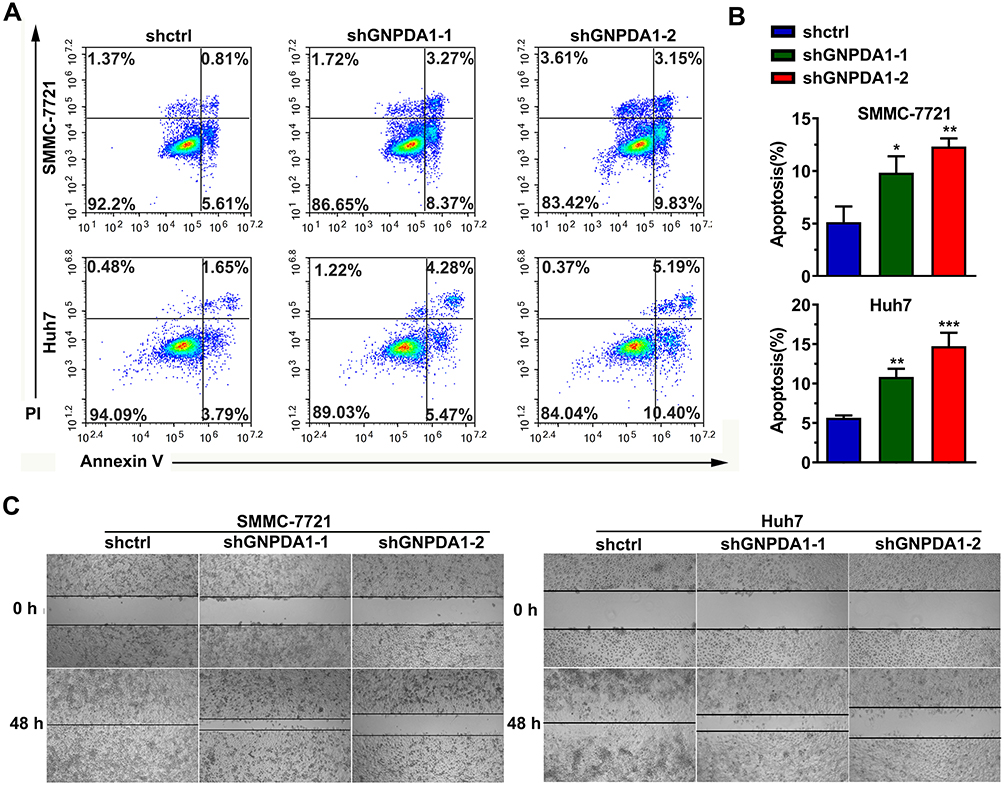 |
Figure 6 GNPDA1 suppresses cell apoptosis. (A) Representative flow cytometry plots of apoptosis analysis. (B) GNPDA1 inhibited the apoptosis of HCC cells. (C) GNPDA1 knockdown in SMMC-7721 and Huh7 cell lines inhibited cell migration, as revealed by a wound healing assay. Data are presented as the mean ± SD of triplicate wells. *P < 0.05, **P < 0.01, and ***P < 0.001. Abbreviations: shctrl, the control cell line of cell line with low GNPDA1; shGNPDA1-1, Cell line numbered 1 with low GNPDA1; shGNPDA1-2, Cell line numbered 2 with low GNPDA1; GAPDH, Glyceraldehyde-3-phosphate dehydrogenase; GNPDA1, glucosamine-6-phosphate isomerase 1. |
GNPDA1 Promotes Migration and Invasion of HCC Cells
The wound healing assay revealed that stable GNPDA1 knockdown decreased the migration rate of SMMC-7721 and Huh7 cells compared with controls (Figure 6C). Similar results were obtained with the transwell migration (Figure 7A and B) and invasion (Figure 7C and D) assays. Collectively, these results demonstrated that GNPDA1 promoted cell migration and invasion in HCC.
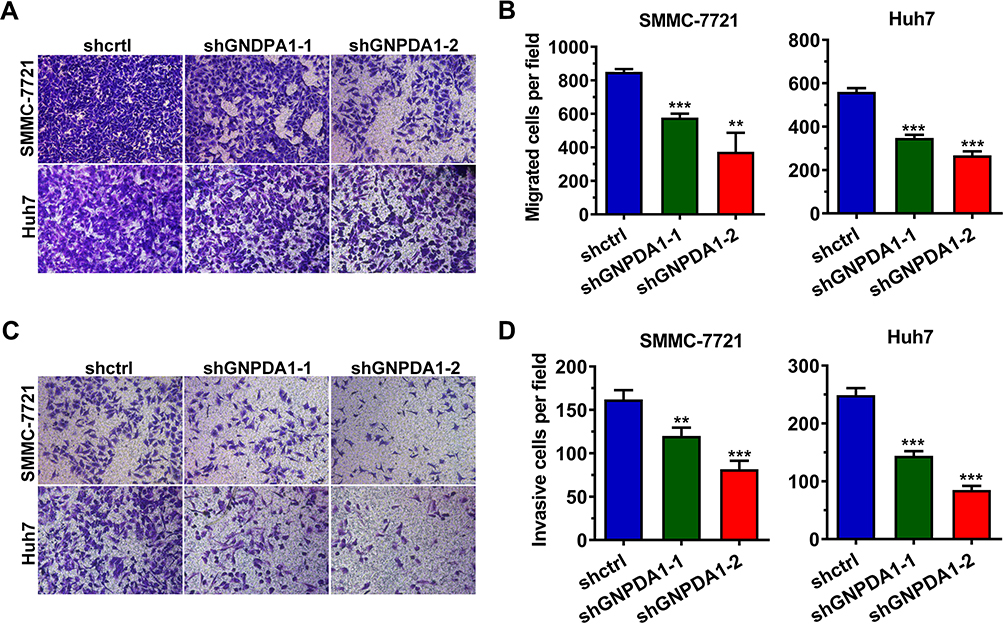 |
Figure 7 GNPDA1 promotes the migration and invasion of HCC cells. Transwell assays revealed that shRNA-mediated GNPDA1 knockdown decreased the migration (A and B) and invasion (C and D) of SMMC-7721 and Huh7 cell lines. Data are presented as the mean ± SD of triplicate wells. **P < 0.01, and ***P < 0.001. Abbreviations: shctrl, the control cell line of cell line with low GNPDA1; shGNPDA1-1, Cell line numbered 1 with low GNPDA1; shGNPDA1-2, Cell line numbered 2 with low GNPDA1; GNPDA1, glucosamine-6-phosphate isomerase 1. |
Discussion
GNPDA1 is an allosteric enzyme that catalyzes the reversible conversion of D-6-glucosamine phosphate to fructose 6-phosphate and ammonium salts.22 In the kidney and small intestine, GNPDA1 is localized in epithelial cells, which have the highest cell metabolic rate in the body.25 High GNPDA1 expression is also seen in sperm, as they require a great deal of energy for dynamic movement.25 In the brain, GNPDA1 expression is higher in neurons than in glia, as neurons consume more energy than glia. GNPDA1 expression is concentrated in the neuron terminal,25 the most energy-consuming region in the cell, due to the large quantity of energy requirements associated with exocytosis and endocytosis of synaptic vesicles.25 GNPDA1 converts from the hexosamine system to the glycolytic pathway is reversible, as the synthesis of hexosamine requires high ammonia concentrations.25,27 Therefore, under physiological conditions, GNPDA1 synthesizes fructose 6-phosphate and can transfer hexosamine from structural macromolecules to the glycolytic pathway, suggesting that GNPDA1 potentially affects energy metabolism.25 In addition, the specific localization of GNPDA1 in vivo supports the viewpoint that GNPDA1 is closely associated with the availability of energy sources.
One of the hallmarks of cancer cells is the reprogramming of metabolic pathways.17 An imbalance in the expression of genes that directly control the rate of metabolic pathways may promote the adaptation and development of tumor cells, allowing them to adopt a more aggressive phenotype.16,18 Studies have shown that metabolic changes in HCC cells involve lipid synthesis and breakdown, amino acid and protein metabolism, and oxidative metabolism.9
Although GNPDA1 was reported to be expressed in some cancer cell lines, its role in tumorigenesis remains unclear.24,28 Wolosker et al found that GNPDA1 was downregulated in normal rat liver tissues.25 However, by analyzing the data in TCGA, we found that the expression level of GNPDA1 in HCC tissues was significantly higher than that in normal liver tissue. Therefore, we hypothesized that GNPDA1, as an enzyme linking the hexosamine system and the glycolytic pathway, may provide additional energy for HCC cells to facilitate the synthesis of biological macromolecules and support rapid proliferation. Moreover, using the MTT assay and EdU, cell cycle, apoptosis, wound healing, transwell analyses, we demonstrated that GNPDA1 can indeed promote the proliferation, migration and invasion of HCC cells and inhibit apoptosis.
Currently, changes in enzymatic activity and metabolite levels are used to evaluate liver function in the clinic.9 In fact, glucose and acetate utilization rates, serum lactate levels, and serum lactate dehydrogenase levels have become diagnostic or prognostic indicators of HCC.9 The present study revealed that there is a significant association between upregulated GNPDA1 expression and advanced tumor stage (T stage), TNM stage and grade, and that high GNPDA1 expression was indicated of a poor prognosis in patients with HCC. Taken together, these results suggest that GNPDA1 may serve as a novel prognostic biomarker and therapeutic target for HCC.
Furthermore, we selected four HCC cells with different genetic backgrounds to detect the level of GNPDA1 in HCC cells. HepG2 was derived from the liver tissue of a fifteen-year-old Caucasian American male with hepatoblastoma, and does not synthesize hepatitis B virus surface antigen (HBsAg);29 Hep-3B was derived from the liver tissue of a 8-year-old black male with hepatocellular carcinoma, and synthesizes HBsAg;30 Huh-7 was derived from the liver tissue of a Japanese man with highly differentiated hepatocellular carcinoma, and does not synthesize HBsAg; HepG2, Hep-3B and Huh7 are highly representative of HCC and show the same metastatic properties of the high-risk metastatic HCC tissues;31 SMMC-7721 cell line was established in China. We found that compared with L-02, the GNPDA1 levels in SMMC-7721, HepG2 and Huh7 were higher, while there was no significant difference in the level of GNPDA1 between Hep-3B and L-02, which may be affected by HBsAg.
Conclusion
In conclusion, the present study demonstrated that GNPDA1 may promote the progression of HCC. The results revealed that GNPDA1 can promote the proliferation, migration and invasion, as well as inhibit apoptosis, of HCC cells. However, the mechanisms underlying these effects were not explored, and further studies are required to elucidate the exact mechanisms involved. This study may serve as the basis for further investigation into the prognostic and therapeutic values of GNPDA1 in HCC.
Data Sharing Statement
All relevant data and materials are presented in the manuscript. For more information, please contact the corresponding author.
Disclosure
The authors declare no conflicts of interest.
References
1. Shimada S, Mogushi K, Akiyama Y, et al. Comprehensive molecular and immunological characterization of hepatocellular carcinoma. EBioMedicine. 2019;40:457–470. doi:10.1016/j.ebiom.2018.12.058
2. Wei K-R, Yu X, Zheng R-S, et al. Incidence and mortality of liver cancer in China, 2010. Chin J Cancer. 2014;33:388–394. doi:10.5732/cjc.014.10088
3. Ferlay J, Soerjomataram I, Dikshit R, et al. Cancer incidence and mortality worldwide: sources, methods and major patterns in GLOBOCAN 2012. Int J Cancer. 2015;136:E359–E386. doi:10.1002/ijc.29210
4. Bray F, Ferlay J, Soerjomataram I, Siegel RL, Torre LA, Jemal A. Global cancer statistics 2018: GLOBOCAN estimates of incidence and mortality worldwide for 36 cancers in 185 countries. CA Cancer J Clin. 2018;68(6):394–424. doi:10.3322/caac.21492
5. Bray F, Ferlay J, Laversanne M, et al. Cancer incidence in five continents: inclusion criteria, highlights from volume X and the global status of cancer registration. Int J Cancer. 2015;137:2060–2071. doi:10.1002/ijc.29670
6. Chen W-Q, Zheng R-S, Zhang S-W. Liver cancer incidence and mortality in China, 2009. Chin J Cancer. 2013;32:162–169. doi:10.5732/cjc.013.10027
7. Ally A, Balasundaram M, Carlsen R. Cancer Genome Atlas Research Network. Electronic address wbe and Cancer Genome Atlas Research N: comprehensive and integrative genomic characterization of hepatocellular carcinoma. Cell. 2017;169(7):1327–1341.e1323s. doi:10.1016/j.cell.2017.05.046
8. Chen W, Zheng R, Baade PD, et al. Cancer statistics in China, 2015. CA Cancer J Clin. 2016;66:115–132. doi:10.3322/caac.21338
9. De Matteis S, Ragusa A, Marisi G, et al. Aberrant metabolism in hepatocellular carcinoma provides diagnostic and therapeutic opportunities. Oxid Med Cell Longev. 2018;2018:7512159. doi:10.1155/2018/7512159
10. Yi X, Yu S, Bao Y. Alpha-fetoprotein-L3 in hepatocellular carcinoma: a meta-analysis. Clin Chim Acta. 2013;425:212–220. doi:10.1016/j.cca.2013.08.005
11. Xing H, Zheng Y-J, Han J, et al. Protein induced by vitamin K absence or antagonist-II versus alpha-fetoprotein in the diagnosis of hepatocellular carcinoma: a systematic review with meta-analysis. Hepatobiliary Pancreat Dis Int. 2018;17:487–495. doi:10.1016/j.hbpd.2018.09.009
12. Yan C, Hu J, Yang J, et al. Serum ARCHITECT PIVKA-II reference interval in healthy Chinese adults: sub-analysis from a prospective multicenter study. Clin Biochem. 2018;54:32–36. doi:10.1016/j.clinbiochem.2018.02.007
13. Mao Y, Yang H, Xu H, et al. Golgi protein 73 (GOLPH2) is a valuable serum marker for hepatocellular carcinoma. Gut. 2010;59:1687–1693. doi:10.1136/gut.2010.214916
14. Wu Y, Liu H, Ding H. GPC-3 in hepatocellular carcinoma: current perspectives. J Hepatocell Carcinoma. 2016;3:63–67. doi:10.2147/JHC.S116513
15. Zhou J, Huang A, Yang X-R. Liquid biopsy and its potential for management of hepatocellular carcinoma. J Gastrointest Cancer. 2016;47:157–167. doi:10.1007/s12029-016-9801-0
16. Zhang C, Zhang Z, Zhu Y, Qin S. Glucose-6-phosphate dehydrogenase: a biomarker and potential therapeutic target for cancer. Anticancer Agents Med Chem. 2014;14:280–289. doi:10.2174/18715206113136660337
17. Zhang Q, Bai H-G, Yang Z, et al. Aberrant activation of glucose 6-phosphate dehydrogenase promotes cell proliferation through up-regulating CyclinD1 expression in clear cell renal cell carcinoma. Chin J Biochem Mol Biol. 2017;33:590–599.
18. Hanahan D, Weinberg RA. Hallmarks of cancer: the next generation. Cell. 2011;144:646–674. doi:10.1016/j.cell.2011.02.013
19. Liu X, Sui X, Zhang C, et al. Glutathione S-transferase A1 suppresses tumor progression and indicates better prognosis of human primary hepatocellular carcinoma. J Cancer. 2020;11:83–91. doi:10.7150/jca.36495
20. Liang JQ, Teoh N, Xu L, et al. Dietary cholesterol promotes steatohepatitis related hepatocellular carcinoma through dysregulated metabolism and calcium signaling. Nat Commun. 2018;9:4490. doi:10.1038/s41467-018-06931-6
21. Zhong X-Y, Yuan X-M, Xu -Y-Y, et al. CARM1 methylates GAPDH to regulate glucose metabolism and is suppressed in liver cancer. Cell Rep. 2018;24:3207–3223. doi:10.1016/j.celrep.2018.08.066
22. Arreola R, Valderrama B, Morante ML, Horjales E. Two mammalian glucosamine-6-phosphate deaminases: a structural and genetic study. FEBS Lett. 2003;551:63–70. doi:10.1016/S0014-5793(03)00896-2
23. Alvarez-Añorve LI, Alonzo DA, Mora-Lugo R, et al. Allosteric kinetics of the isoform 1 of human glucosamine-6-phosphate deaminase. Biochim Biophys Acta. 2011;1814:1846–1853. doi:10.1016/j.bbapap.2011.07.010
24. Zhang J, Zhang W, Zou D, et al. Cloning and functional characterization of GNPI2, a novel human homolog of glucosamine-6-phosphate isomerase/oscillin. J Cell Biochem. 2003;88:932–940. doi:10.1002/jcb.10444
25. Wolosker H, Kline D, Bian Y, et al. Molecularly cloned mammalian glucosamine-6-phosphate deaminase localizes to transporting epithelium and lacks oscillin activity. FASEB J. 1998;12:91–99. doi:10.1096/fasebj.12.1.91
26. Shang R-Z, Qu S-B, Wang D-S. Reprogramming of glucose metabolism in hepatocellular carcinoma: progress and prospects. World J Gastroenterol. 2016;22:9933–9943. doi:10.3748/wjg.v22.i45.9933
27. Oikari S, Makkonen K, Deen AJ, et al. Hexosamine biosynthesis in keratinocytes: roles of GFAT and GNPDA enzymes in the maintenance of UDP-GlcNAc content and hyaluronan synthesis. Glycobiology. 2016;26:710–722. doi:10.1093/glycob/cww019
28. He Y-J, Li W-L, Liu B-H, Dong H, Mou Z-R, Wu Y-Z. Identification of differential proteins in colorectal cancer cells treated with caffeic acid phenethyl ester. World J Gastroenterol. 2014;20:11840–11849. doi:10.3748/wjg.v20.i33.11840
29. Costantini S, Di Bernardo G, Cammarota M, Castello G, Colonna G. Gene expression signature of human HepG2 cell line. Gene. 2013;518:335–345. doi:10.1016/j.gene.2012.12.106
30. Knowles BB, Howe CC, Aden DP. Human hepatocellular carcinoma cell lines secrete the major plasma proteins and hepatitis B surface antigen. Science. 1980;209:497–499. doi:10.1126/science.6248960
31. Ao L, Guo Y, Song X, et al. Evaluating hepatocellular carcinoma cell lines for tumour samples using within-sample relative expression orderings of genes. Liver Int. 2017;37:1688–1696. doi:10.1111/liv.13467
 © 2020 The Author(s). This work is published and licensed by Dove Medical Press Limited. The full terms of this license are available at https://www.dovepress.com/terms.php and incorporate the Creative Commons Attribution - Non Commercial (unported, v3.0) License.
By accessing the work you hereby accept the Terms. Non-commercial uses of the work are permitted without any further permission from Dove Medical Press Limited, provided the work is properly attributed. For permission for commercial use of this work, please see paragraphs 4.2 and 5 of our Terms.
© 2020 The Author(s). This work is published and licensed by Dove Medical Press Limited. The full terms of this license are available at https://www.dovepress.com/terms.php and incorporate the Creative Commons Attribution - Non Commercial (unported, v3.0) License.
By accessing the work you hereby accept the Terms. Non-commercial uses of the work are permitted without any further permission from Dove Medical Press Limited, provided the work is properly attributed. For permission for commercial use of this work, please see paragraphs 4.2 and 5 of our Terms.