")
Back to Journals » Clinical Epidemiology » Volume 14
Global, Regional, and National Burden of Urolithiasis from 1990 to 2019: A Systematic Analysis for the Global Burden of Disease Study 2019
Authors Zhang L, Zhang X, Pu Y, Zhang Y, Fan J
Received 7 May 2022
Accepted for publication 31 July 2022
Published 15 August 2022 Volume 2022:14 Pages 971—983
DOI https://doi.org/10.2147/CLEP.S370591
Checked for plagiarism Yes
Review by Single anonymous peer review
Peer reviewer comments 4
Editor who approved publication: Professor Henrik Sørensen
Lu Zhang,1,* Xu Zhang,2,* Yuanchun Pu,1,* Yaodong Zhang,1 Jinhai Fan1,3
1Department of Urology, The First Affiliated Hospital of Xi’an Jiaotong University, Xi’an, People’s Republic of China; 2Department of Gastroenterology, The First Affiliated Hospital of Xi’an Jiaotong University, Xi’an, People’s Republic of China; 3Oncology Research Lab, Key Laboratory of Environment and Genes Related to Diseases, Ministry of Education, Xi’an, People’s Republic of China
*These authors contributed equally to this work
Correspondence: Jinhai Fan, Department of Urology, The First Affiliated Hospital of Xi’an Jiaotong University, #277 Yanta West Road, Xi’an, 710061, People’s Republic of China, Tel +86-29-8532-3661, Fax +86-29-8532-3203, Email [email protected]
Introduction: To get insight into the temporal trends of urolithiasis, and thus decrease the health burden of urolithiasis, we comprehensively investigated the specific epidemiological indicators that varied among different countries and regions according to the diversity of geographic locations, gender, age, year, and socioeconomic status.
Methods: In this study, we investigated the incidence, death, disability-adjusted life years (DALYs) of urolithiasis quantified by the number of patients, age-standardized rates, and estimated annual percentage changes based on geographic locations, gender, age, and year to decode the epidemiological characteristics using the data from 1990 to 2019 in the Global Burden of Disease database.
Results: In 2019, more than 115 million (95% uncertainty interval [95% UI] 93– 140) incident cases of urolithiasis occurred worldwide, and the age-standardized incidence rate (ASIR) (per 100,000 population) decreased from 1696.2 (1358.1– 2078.1) in 1990 to 1394 (1126.4– 1688.2) in 2019. Nearly 13,279 (95% UI: 10616– 16267) died of urolithiasis, contributing to 0.6 million (0.5– 0.7) DALYs in 2019. The highest age-standardized DALY rates (33.33 per 100 000 population) in 2019 were observed in Armenia, whereas the largest negative estimated annual percentage changes of DALYs were seen in Poland. The ASIR of males was higher than females. However, the ASIR EAPC of males was lower than females from 1990 to 2019. Males aged 50– 54 years old were more likely to suffer from urolithiasis. Joinpoint regression model analyses suggested that the global age-standardized incidence and DALY rates of urolithiasis encountered a trend to decline over the past 30 years. Over the years, the attenuation of this disease was pinpointed to be weakly related to the Socio-demographic index.
Conclusion: At the global level, both the incident and DALY cases experienced substantial growth compared to the absolute cases in 1990. However, global age-standardized incidence and DALY rate of urolithiasis were observed to decline from 1990 to 2019. Males’ ASIR was higher than females, while the gap narrowed over the years. A weakly positive correlation between ASIR of urolithiasis and SDI was also observed in this study.
Keywords: urolithiasis, incidence, death, disability-adjusted life years, Global Burden of Disease
Background
Urolithiasis is a common urinary system disease, with a prevalence ranging from 1% to 20%.1 A 2014 survey showed that approximately one in ten people in the United States had suffered from urolithiasis.2,3 In addition, socio-economic status is also a fundamental risk factor for this disease.3 The prevalence of urolithiasis is increasing worldwide, contributing to an inevitable health burden to all age groups. It is of paramount urgency for us to make tremendous public health efforts to solve this problem.
Urolithiasis can be stratified into four types and nine subtypes based on the stone composition and etiology, including non–infection stones (calcium oxalate, calcium phosphate, uric acid), infection stones (magnesium ammonium phosphate, carbonate apatite, ammonium urate), genetic causes (cystine, xanthine, 2,8-Dihydroxyadenine) and drug stones.1 Currently, shreds of evidence regarding the causes of stone formation remain controversial, exemplified by Randall’s theory, urine supersaturation crystallization theory, and the theory of lacking inhibitory factors. Pain, nausea, vomiting, hematuria, and recurrent infections are invariably characterized as urolithiasis prominent clinical manifestations. A colossal health burden to society automatically occurs according to this disease’s severe symptoms and high morbidity. EAU (European Association of Urology) guidelines suggest that Shockwave lithotripsy (SWL), Ureteroscopy (URS), and Percutaneous nephrolithotomy (PNL), or other surgical treatments may relieve the obstruction symptoms of the urinary tract.1 However, the recurrent rate of urolithiasis is up to 50%.4 Accurately assessing of epidemiological disease indicators and changing trends is critical in preventing the diseases from increasing and relapsing constantly, more importantly, making precise clinical decisions. ASR (age-standardized rates), ASIR (age-standardized incidence rate), ASDR (age-standardized death rate), and other indicators are widely used in the field of epidemiology such as pulmonary diseases, cardiovascular diseases.5–8 The Global Burden of Diseases (GBD) study converges massive epidemiological data of diverse diseases, contributing to an abundance of consecutive and praiseworthy analyses that guide clinical decisions and epidemic prevention. Various published studies of urinary diseases such as kidney cancer, bladder cancer, and benign prostatic hyperplasia were investigated comprehensively based on the GBD study as well.9–11
In this study, we obtained urolithiasis cases data from 1990 to 2019 and calculated ASIR, DALYs (disability-adjusted life years), EAPC (estimated annual percentage change), and other indicators according to geographic locations, age, gender, and SDI (socio-demographic index), in order to figure out the etiologies and trends for urolithiasis. This study also uncovered that the development of socio-economics allowed policy-makers to reasonably allocate social and medical resources, thus relieving the social health burden of urolithiasis.
Materials and Methods
Data Acquisition
The epidemiological data (Prevalence, incidence, and disability-adjusted life years (DALYs)) of urolithiasis between 1990 to 2019, classified by age, year, and sex for global, regional, and national groups, were retrieved from Global Burden of Diseases 2019 (GBD 2019, https://ghdx.healthdata.org/gbd-2019). These data involved 21 regions and 204 countries that were classified into five regions by the socio-demographic index (SDI) levels, as exemplified by low SDI, low-middle SDI, middle SDI, high-middle SDI and high SDI. This summary index quantified the countries or geographic areas based on the development spectrum. SDI is a composite average related to incomes per capita, average educational attainment, and fertility rates scaled ranging from 0 to 1.
Statistical Analysis
ASRs data such as age-standardized incidence rate, age-standardized death rate, and age-standardized DALYs were used to avoid the effects of different age compositions of the population and ensure statistical comparability. The direct method was used in the calculation, such as calculating the age-standardized incidence rate: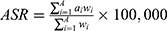 (age-specific ratio (ai, i represents the ith age group), number of people or weighted number (wi,). In line with the method recommended by GBD, DALYs consist of years of life lost (YLLs) and years lived with disability (YLDs): DALYs=YLLs+YLDs. We calculated the estimated annual percentage change (EAPC), which could assess the temporal trend of ASR by using a generalized linear model (GLM). When EAPC>0 and its 95% confidence interval (CI) lower boundary>0, ASR is in an increasing trend. In contrast, when EAPC<0 and CI upper boundary<0, ASR is in a decreasing trend. Average Annual Percent Change (AAPC) is a measure that summarizes the change in trend over a specific period, calculated by taking the weighted average of the annual percentage changes derived from joinpoint regression analysis. An age-period-cohort (APC) model framework was used to evaluate the underlying trends by age, period, and birth cohort, decoding the complex interplay of age-associated biological factors, technological and social factors in disease trends. The APC model was constructed using Age Period Cohort Analysis Web Tool (https://analysistools.cancer.gov/apc/) and subsequently visualized by R package “ggplot2, a system for data visualization and creating graphics”. All data have 95% confidence intervals.
Data visualization was statistically analyzed by R software and Joinpoint Trend Analysis software. The GBD study data did not require patient consent and followed the Guidelines for Accurate and Transparent Health Estimation Reporting for Population Health Research (GATHER). Data from the GHDx Query Tool is publicly available.
Results
Global Urolithiasis Burden
In 2019, there were 115,552,140 (95% UI: 93045130.4–140180402.4) incident cases globally, and the age-standardized incidence rate (ASIR) (per 100,000 population) decreased from 1696.2 (1358.1–2078.1) in 1990 to 1394 (1126.4–1688.2) in 2019. Incidence EAPC change was −0.83 (95% UI: −0.92–0.74) since 1990. Males ASIR (per 100,000 population) 1856.9 (95% UI: 1495.3–1148.4) was much higher than females ASIR 947.2 (761.2–1148.4) in 2019, but males EAPC (−1.01, 95% UI: −1.09–0.92) was lower than females (−0.47, 95% UI: −0.59–0.36), which indicated that males ASIR had a stronger downward trend than females (Supplementary Table 1).
At the same time, death cases also increased from 11,338 (95% UI: 7277.6–13,777.5) in 1990 to 13,278.9 (10,616–16,267.4) in 2019, and the age-standardized death rate (ASDR) (per 100,000) fell from 0.3 (0.2–0.4) in 1990 to 0.2 (0.1–0.2) in 2019. The change in deaths EAPC was −2.05 (95% UI: −2.24–1.86) since 1990. Males ASDR (per 100,000 population) (0.2, 95% UI: 0.1–0.3) was higher than the females ASDR (per 100,000 population) (0.1, 95% UI: 0.1–0.2) in 2019. We observed that males EAPC was −2.32 (95% UI: −2.47–2.18), while females EAPC was −1.89 (−2.15–1.61), suggesting that the ASDR of males and females showed a notable reduction between 1990–2019 (Supplementary Table 2).
Furthermore, the global attributable DALYs cases of urolithiasis increased from 516,731.1 (95% UI: 374,132.9–635,717.3) in 1990 to 6,04,308.9 (477,353.5–745,193.9) in 2019. But the DALYs ASR (per 100,000) decreased from 11.7 (95% UI: 8.6–14.4) in 1990 to 7.4 (5.8–9) in 2019. The EAPC for DALYs was −1.77 (95% UI: −1.91–1.64) since 1990 (Supplementary Table 3). In 2019, the DALYs ASR (per 100,000 population) of males 9.1 (95% UI: 6.9–11.3) was higher than that of females 5.7 (4.6–7.1). Males DALYs EAPC-1.8 (95% UI: −1.9–1.7) and females DALYs EAPC (−1.8, 95% UI: −2.0–1.6) indicated that both DALYs showed a downward trend, suggesting that the remission of this health burden benefited from advances and innovation of curative strategies.
Regional Urolithiasis Burden
In 2019, the ASIR (per 100,000) of urolithiasis had the highest point in Eastern Europe (4433.7, 95% UI: 3542.5–5414.7), much higher than the second-highest region of Central Asia (1788, 95% UI: 1435.5–2174.9) and the third-highest in Andean Latin America (1772.4, 95% UI: 1472.6–2110.7). ASIR for urolithiasis (per 100,000) in Eastern Sub-Saharan Africa (565.7, 95% UI: 444.3–692.3), Central Sub-Saharan Africa (575.4, 95% UI: 446.6–711.2), Southern Sub-Saharan Africa (725.5, 95% UI: 574.2–893.3) and Western Sub-Saharan Africa (735.8, 95% UI: 579.3–902.5) were the lowest. Caribbean 0.66 (95% UI: 0.63–0.7) had the highest EAPC (1990–2019) of incidence, followed by South Asia 0.64 (0.5–0.78). Meanwhile, East Asia −2.68 (95% UI: −2.95–2.42) had the lowest EAPC (1990–2019) (Supplementary Table 1).
In 2019, Eastern Europe (0.5, 95% UI: 0.5–0.7), Central Asia (0.4, 95% UI: 0.3–0.7) and Southeast Asia (0.4, 95% UI: 0.1–0.5) had the highest ASDR (per 100,000) across all the regions. Southern Latin America (0, 95%UI: 0–0.1) and North Africa and Middle East (0, 95% UI: 0–0) had the lower indicator. EAPC (1990–2019) for urolithiasis death had the largest increase in Tropical Latin America (4, 95% UI: 3.76–4.24), followed by Asia Pacific-high income (2.6, 95% UI: 2.33–2.87), with the largest decrease in Central Europe (−6.31, 95% UI: −7.29–5.32), followed by East Asia (−4.93, 95% UI: −5.21–4.65) (Supplementary Table 2).
In 2019, the ASR (per 100,000) of urolithiasis DALYs had the highest indicator in Eastern Europe (23.6, 95% UI: 18.7–29.2), much higher than the second in Southeast Asia (13.1, 95% UI: 6.9–16.5) and the third in Central Asia (12.4, 95% UI: 9.9–15.9). Southern Sub-Saharan Africa (3.5, 95% UI: 2.6–4.4) and Western Sub-Saharan Africa (3.6, 95% UI: 2.4–4.8) were the lowest indicators. DALYs with the highest EAPC (1990–2019) increase was Tropical Latin America (2.07, 95% UI: 1.94–2.2) followed by Caribbean (1.08, 95% UI: 0.98–1.18), with the highest decline in East Asia (−4.43, 95% UI: −4.68–4.18) followed by Central Europe (−3.18, 95% UI: −3.58–2.78). The ASR of DALYs decreased in all European regions and increased in Asia except for Central Asia (Supplementary Table 3).
From 1990 to 2019, the global AAPC of incidence was negative, representing a decline in ASIR. East Asia and High-income North America had the most prominent negative AAPC of incidence in different regions. In contrast, the Caribbean and South Asia had the most significant positive AAPC of incidence (Figure 1A). The global AAPC of DALYs is negative, representing a reduction in ASR of DALYs. Among the AAPC of DALYs in different regions, East Asia and Central Europe had the most significant negative values, and Tropical Latin America, Caribbean, and Central Asia had the most significant positive values (Figure 1B).
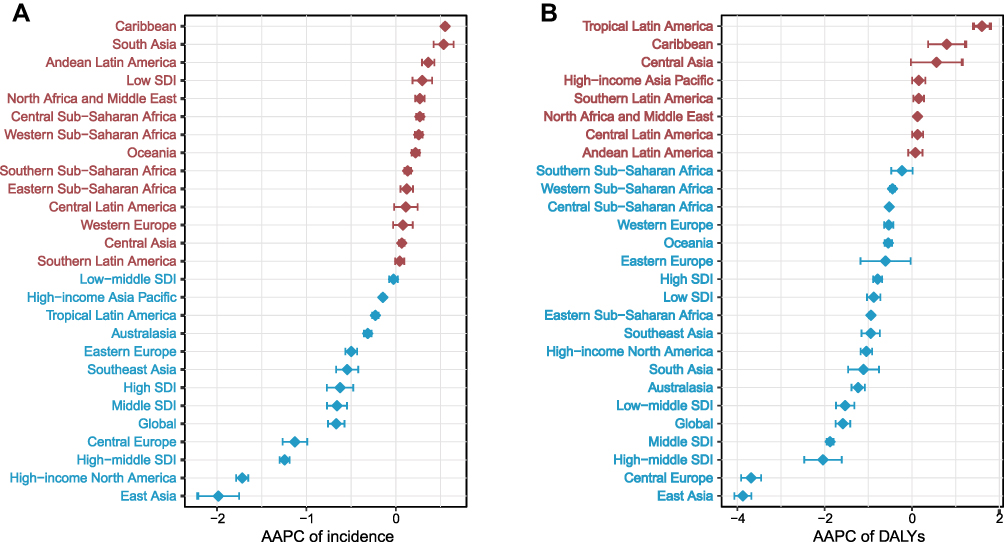 |
Figure 1 The AAPC of incidence and DALYs at global and regional levels, from 1990 to 2019. (A) The AAPC of incidence. (B) The AAPC of DALYs. Red represented the regions of AAPC > 0, blue represented those of AAPC < 0. Abbreviations: AAPC, average annual percent change; DALYs, disability-adjusted life years. |
National Burden
At the national level, Russia had the highest ASIR 4.54×10³ (/100,000 population), with the lowest in Burundi 0.53×10³ (/100,000 population) (Supplementary Figure 1A). Armenia had the highest ASDR 1.82 (/100,000 population) (Supplementary Figure 2A) and the highest ASR of DALYs 33.33 (/100,000 population) (Figure 2A). North Macedonia had the lowest ASDR 0.004 (/100,000 population) (Supplementary Figure 2A). The incidence of EAPC (1990–2019) had the highest point in Jordan at EAPC 2.10, with the lowest point in Poland −3.87 (Supplementary Figure 1B). The death EAPC (1990–2019) had the highest point in Costa Rica 7.18, with the lowest point in Bulgaria −10.59 (Supplementary Figure 2B). DALY’s EAPC (1990–2019) had the highest point in Armenia 2.46, with the lowest point in Poland −5.84 (Figure 2B).
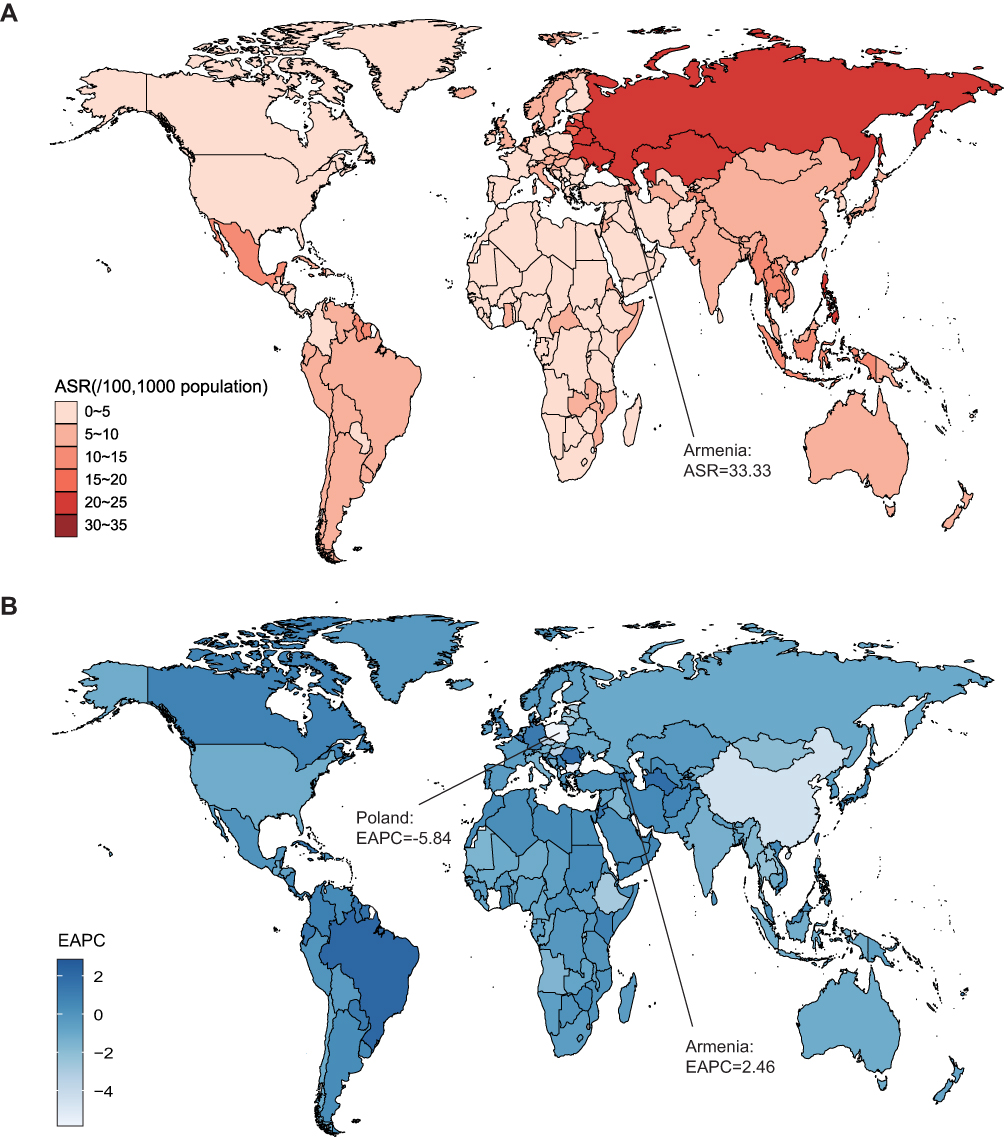 |
Figure 2 The global ASR (per 100,000) and EAPC of DALYs on urolithiasis, by country and territory. (A) The ASR of DALYs in 2019. (B) The EAPC of DALYs from 1990 to 2019. Abbreviations: ASR, age-standardized rates; EAPC, estimated annual percentage change; DALYs, disability-adjusted life years. |
Age and Sex
The number of incidence cases and ASIR of males were higher than females in any age group, with the highest incidence and widest gap in the 50–59 age group, and then decreasing continuously, attributing to the conclusion that ASIR for males was declining faster than females (Supplementary Figure 3A). For the 15–19 age group, males’ ASDR was higher than females, and the ASDR of both groups showed an upward trend with age increasing (Supplementary Figure 3B).
With age increasing, the DALYs of males and females continued to increase (Figure 3). The DALY numbers of male patients peaked in the 50–54 age group, whereas the DALYs numbers of female patients reached their peak in the 55–59 age group, followed by the reduction with aging. The DALY rates in males and females rose rapidly and uninterruptedly after the 10 to 14 age group. Males had higher DALY rates (per 100,000 population) than females after the 25–29 age group. YLD cases in both men and women increased with age, peaked in the 50–54 age group, and then declined (Figure 4A). YLD cases of males were higher than that of females across all ages. The YLDs rate of males and females generally increased with age, peaked in the 80–84 age group, and then declined. YLL cases in males and females increased with age (except for the female age group 45–49), peaked in the 65–69 age group, and declined (Figure 4B). The YLLs rate for males and females generally increased with age, peaking in the 95plus age group. From the 15–19 age group, the YLL rate of males was higher than females.
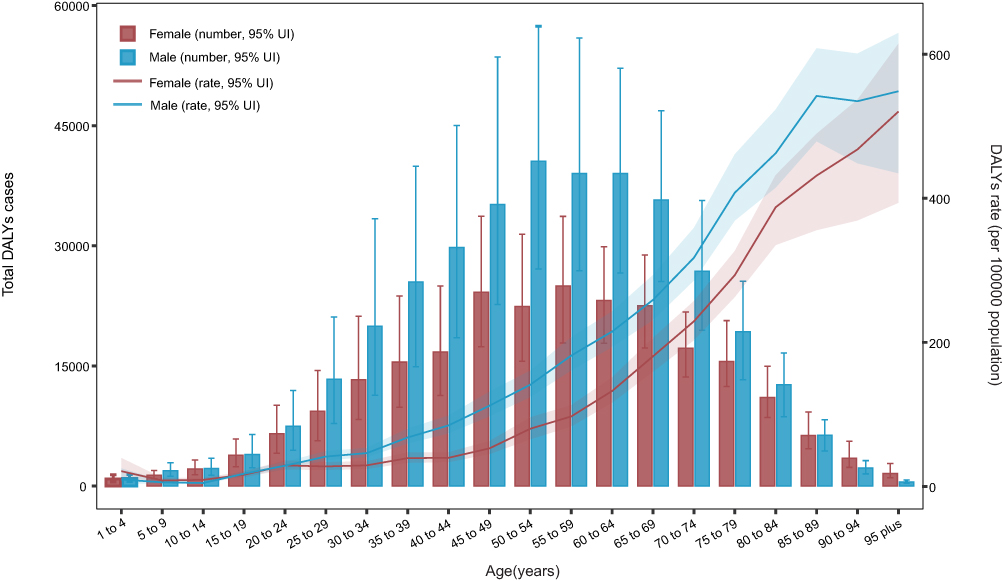 |
Figure 3 Age patterns by sex in 2019 of the total number of DALY cases and age-specific DALY rate of urolithiasis at the global level. Abbreviation: DALY, disability-adjusted life year. |
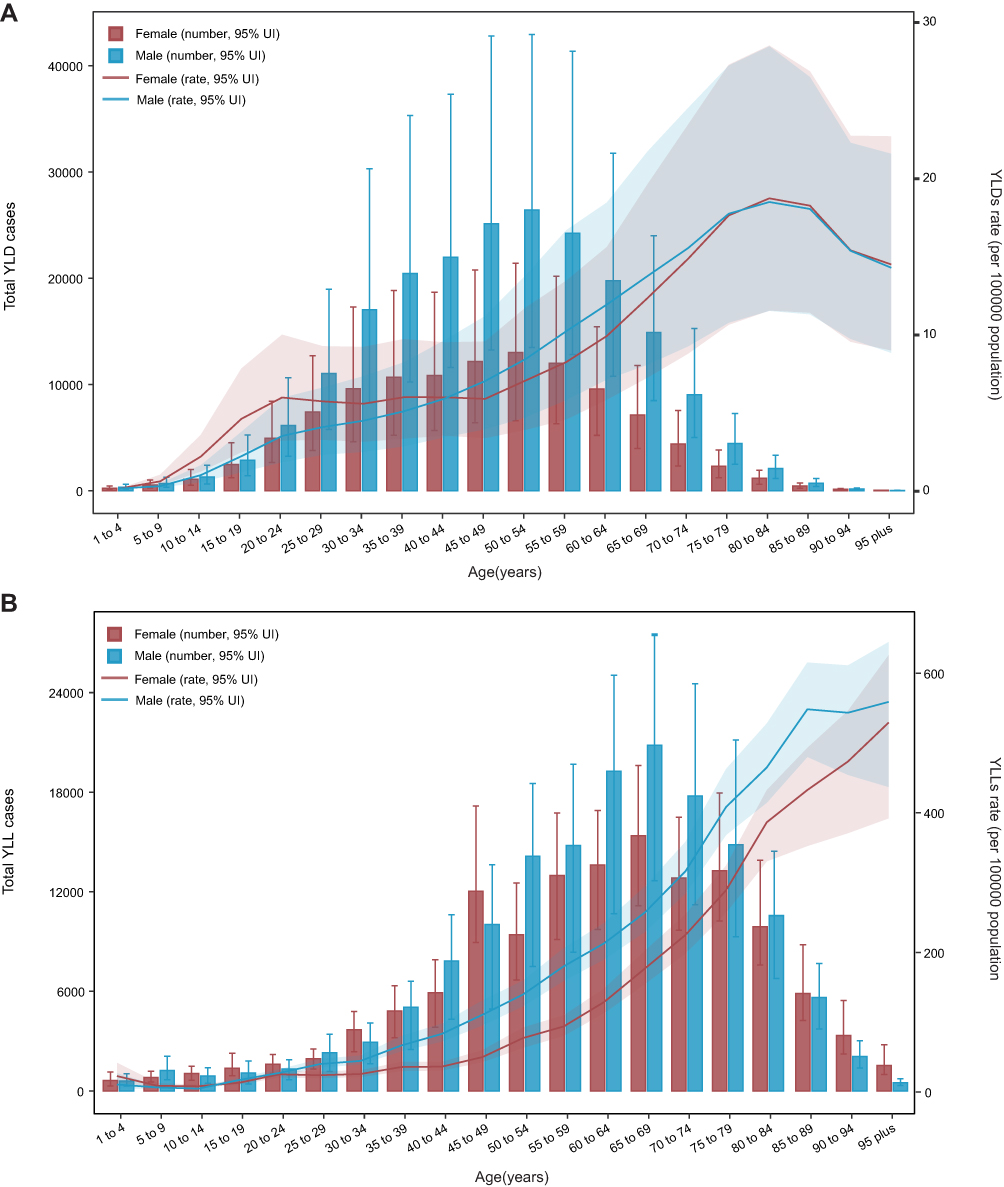 |
Figure 4 Age patterns by sex in 2019 of YLD and YLL at the global level. (A) Age patterns of the total number and age-specific rate of YLD. (B) Age patterns of the total number and age-specific rate of YLL. Abbreviations: YLD, years lived with disability; YLL, years of life lost. |
The Socio-Demographic Index (SDI) and Human Development Index (HDI)
SDI represents a proxy indicator of each country’s socioeconomic situation, and HDI is identified as a surrogate indicator of the level of healthcare in each country. We divide SDI into five levels: high SDI, high middle SDI, middle SDI, low middle SDI, and low SDI. Importantly, there was a weakly positive correlation between SDI and ASIR of urolithiasis, suggesting that the increased burden of urolithiasis was associated with rapid socio-economic development (Figure 5). From the perspectives of regions, Eastern Europe encountered the extremely high ASIR accompanied by the relatively high SDI levels, whereas the high-income Asia Pacific and North America, Western Europe, and Australia had moderate ASIR. However, there is no correlation between SDI, HDI levels, and EAPC incidence (Supplementary Figure 4). Incident cases of global, middle SDI, low middle SDI, and low SDI regions increased year by year, and high middle SDI and middle SDI cases were higher in other regions (Supplementary Figure 5). Most incident cases belong to the 15−49 years and 50−69 years groups. Between 1990 and 2010, the ASIR of global, high SDI, high-middle SDI, and middle SDI regions did not increase until 2010, with a moderate run-up between 2010 and 2019 based on an APC model (Supplementary Figure 6A–D). However, the ASIR of low-middle SDI and low SDI regions experienced a wavy rise in the 20th century (Supplementary Figure 6E–F).
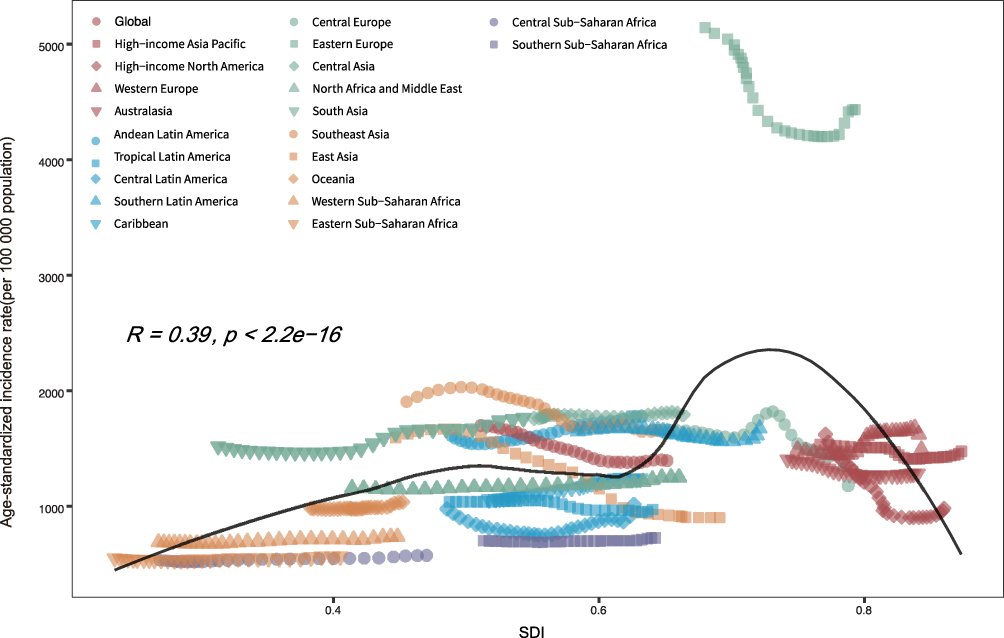 |
Figure 5 ASIR of urolithiasis globally and for 21 GBD regions by SDI, 1990–2019. Abbreviations: ASIR, age-standardized incidence rate; GBD, Global Burden of Disease; SDI, socio-demographic index. |
There was a weakly negative correlation between SDI and ASDR of urolithiasis, suggesting a lower death burden with higher socio-economic development (Supplementary Figure 7). From 1990 to 2019, Eastern Europe, Central Asia, Southeast Asia, and Eastern Sub-Saharan Africa were higher than expectations. Andean Latin America, Southern Latin America, North Africa, the Middle East, Western Sub-Saharan Africa, Central Sub-Saharan Africa, and Southern Sub-Saharan Africa were lower than expected.
Surprisingly, DALYs EAPC was significantly associated with HDI, whereas no correlation was observed between DALYs EAPC and SDI (Supplementary Figure 8). We observed that DALYs cases of high-middle and middle SDI regions were higher than in other regions, and most regions encountered an increasing trend from 1990 to 2019 (Figure 6). Moreover, most DALY cases came from the 15−49 years group and 50−69 years group. A slightly positive correlation between SDI and the DALYs ASR of urolithiasis was observed in 22 regions (Figure 7). Except for the high SDI regions (Figure 8B), the ASR of DALYs in the global (Figure 8A) and other SDI regions (Figure 8C–F) showed a significant decreasing trend over the years based on an APC model.
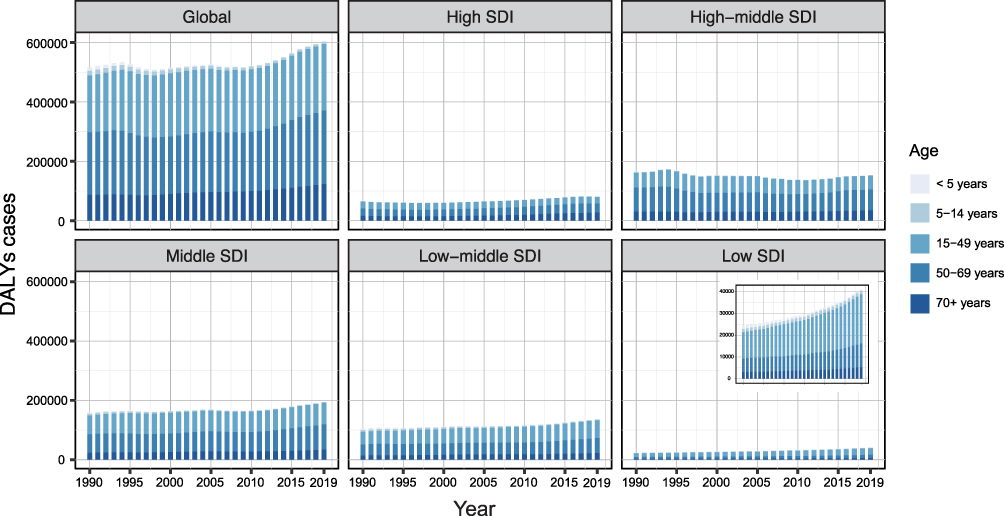 |
Figure 6 The urolithiasis DALYs cases in different age groups, by SDI regions, from 1990 to 2019. The data on low SDI regions is presented in the top-right panel. Abbreviations: DALYs, disability-adjusted life years; SDI, socio-demographic index. |
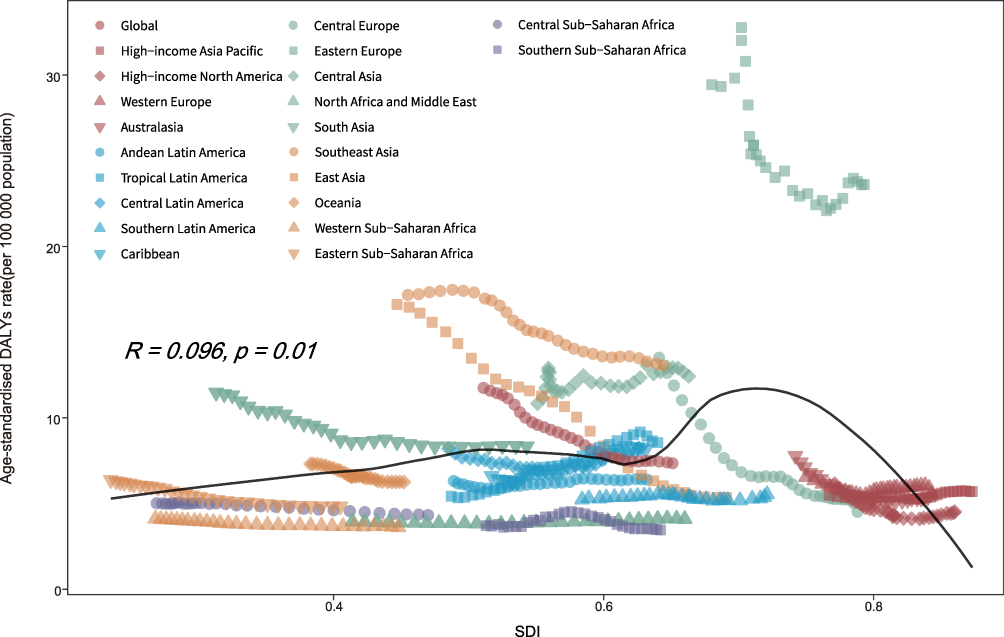 |
Figure 7 Age-standardized DALY rate of urolithiasis globally and for 21 GBD regions by SDI, 1990–2019. Abbreviations: DALY, disability-adjusted life year; GBD, Global Burden of Disease; SDI, socio-demographic index. |
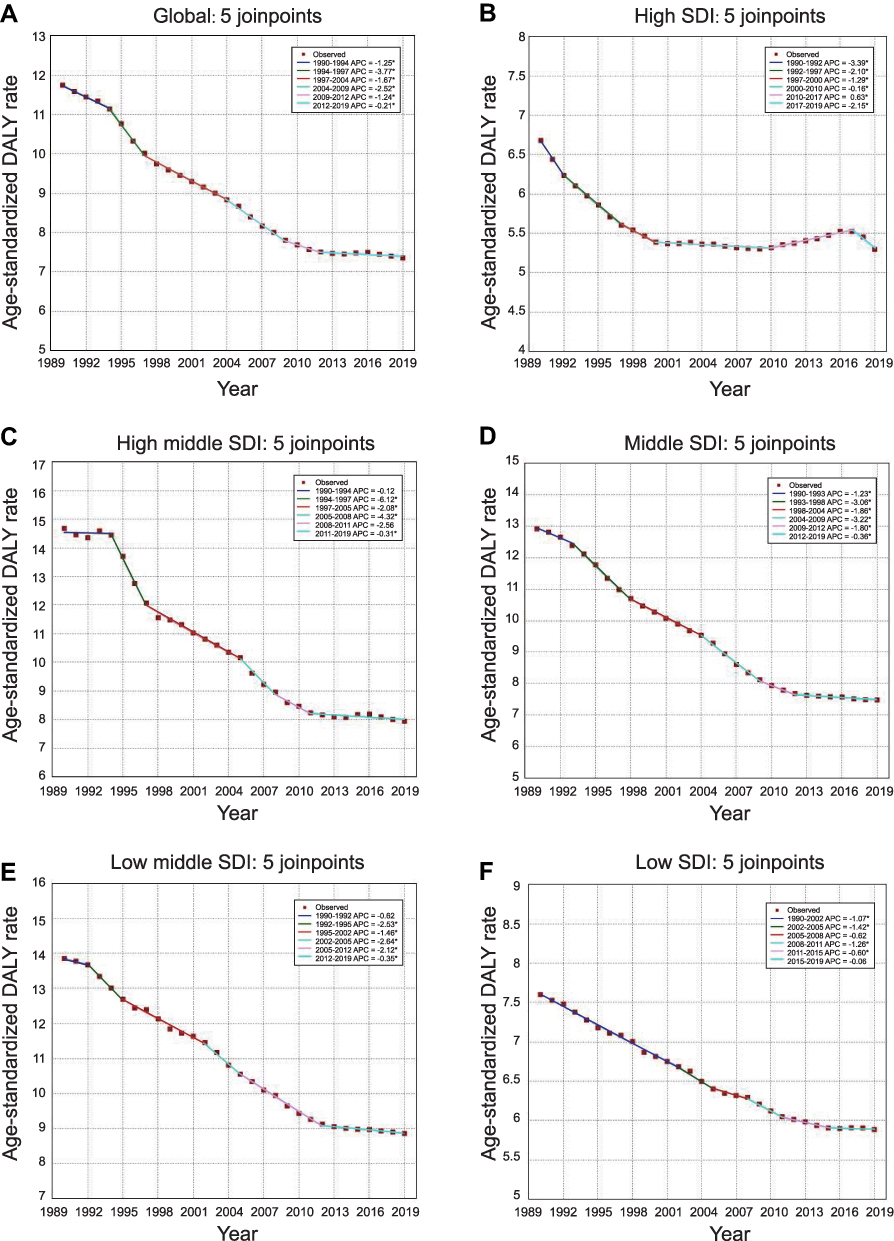 |
Figure 8 Temporal trends of age-standardized DALY rate by SDI regions using Joinpoint regression model. Temporal trends at global (A), high SDI (B), high middle SDI (C), middle SDI (D), low middle SDI (E), and low SDI (F) levels. *Indicates that the Annual Percent Change (APC) is significantly different from zero at the alpha = 0.05 level. Abbreviations: DALY, disability-adjusted life year; SDI, socio-demographic index. |
Age, Period, and Cohort Effects on Urolithiasis Morbidity
Generally, similar patterns in age effects were observed in males and females, with the highest risk in the 50–59 age groups. Compared to females of the same age, males encountered more rates across age group (Figure 9A). Period effects generally showed a notable reduction of risk rate over the past decades, with less decline in females than males (Figure 9B). A successive declining risk rate was pinpointed in the elderly birth cohort, with individuals born in the 1960 with the lowest morbidity risk rate across all age groups (Figure 9C). We also observed a little risk rate improvement in the younger birth cohort from 1980 to 1990.
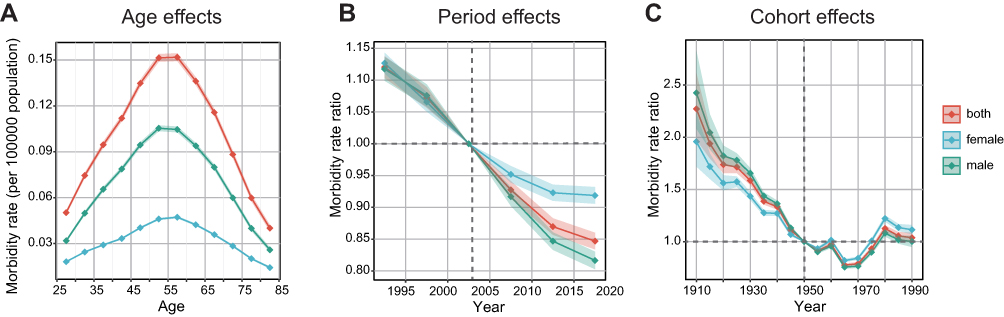 |
Figure 9 Age, period, and cohort effects on urolithiasis incidence. (A) The fitted longitudinal age curves of incidence (per 100,000 person-years) adjusted for period deviations showed age effects on urolithiasis. (B) Period effects were shown by incidence rate ratio and computed as the ratio of age-specific rates from 1990 to 2019. (C) Cohort effects were presented by the relative incidence risk and computed as the ratio of age-specific rates from the 1910 cohort to the 1990 cohort. The dots and shaded areas denote incidence rates or rate ratios and their corresponding 95% UIs. Abbreviations: SDI, socio-demographic index; UIs, uncertainty intervals. |
Discussion
This study investigated global urolithiasis morbidity, mortality, DALYs, and their associations with age, gender, and SDI across 202 countries and territories, based on the GBD 2019 database compiled with comprehensive data and epidemiological resources.12 We identified that the global ASIR change of urolithiasis decreased by 0.83% from 1990 to 2019, which may attribute to the increase in the global consumption of healthy food, nutrients, and water resources per capita.13 Consistent with our hypothesis, Taylor et al constructed a DASH score involving eight components, as exemplified by abundant intake of fruits, vegetables, nuts and legumes, low-fat dairy products, whole grains, and low intake of sodium, sweetened beverages, and red and processed meats, which is closely related to reduced risk of kidney stones.14 In addition, Curhan et al also demonstrated that dietary intake of animal protein directly increased the risk of kidney stones, whereas high intake of potassium and fluid were inversely associated with stones prevention.15 Interestingly, although the ASIR of urolithiasis decreased, the total incident cases showed substantial growth from 1990 to 2019. We speculated that the opposite trends between age-standardized rates of incidence and absolute cases were attributed to an aging population.
The AISR of males was higher than that of females. We carefully retrieved the relevant literature to get insight into the differences between males and females. Previous studies indicated the controversial implications of sex hormones on stone formation. A comparative study by van Aswegen et al revealed that testosterone was observed to be lower in kidney stone patients than in healthy counterparts.16 However, Otunctemur et al demonstrated that testosterone levels did not affect stone formation, whereas potential risk factors contributing to stone formation showed an effect on testosterone levels.17 In contrast, an authoritative study suggested that estrogen might protect women from the risk of urolithiasis by lowering urinary calcium, oxalate, and uric acid.18 Peerapen et al pinpointed the cellular mechanism of estrogen that reduction of calcium oxalate (CaOx) crystal-binding capability, decreased intracellular metabolism, and increased cell proliferation and tissue healing might contribute to stone prevention in females.19 However, Nackeeran et al indicated that there was no independent relationship between sex hormones and the prevalence of kidney stones in males or females based on the National Health and Nutrition Examination Survey (NHANES) database from 2013 to 2016.20 Actually, males are more likely to eat excess food and alcohol than females, which might contribute to the incident differences. However, the ASIR EAPC of males was lower than females, and the ASIR ratio of males to females has dropped from 2.20 in 1990 to 1.96 in 2019, accounting for the expected prevalence of obesity among females,21–23 and the close gap in lifestyle, diet between males and females.24–26
Similar to previous studies, we identified that the burden of urolithiasis varied by geographic, economic, and cultural factors.27,28 Eastern Europe had the highest ASIR in different regions, such as Russia, and Armenia, which were strongly associated with obesity, diabetes, and meat consumption.3,29 For Central Asian countries such as Saudi Arabia, Iran, Pakistan, etc., evidence showed that high heat and water shortage environment could promote the rapid evaporation of water in the body, leading to improvement of the concentration of urate, the risk of urine crystallization and thus the formation of stone.30–32 Sub-Saharan Africa had the lowest ASIR, but incidence data of urolithiasis might be imprecise because of the under-reported cases in this region and the lack of large-scale epidemiological studies.33 One of the inevitable points to affect the epidemiology of urolithiasis is socioeconomic status. According to a previous study, lower socioeconomic status correlated with the severer stone disease at the time of medical intervention.34 In addition, another retrospective analysis of National Health and Nutrition Examination Survey (NHANES) data from 2007 to 2014 was performed to suggest that kidney stones were higher among individuals with state-assisted insurance than those with private insurance, which also indicated the relationship between socioeconomic status and stone disease.35 Consistently, a slightly positive correlation between SDI and ASIR of urolithiasis was identified in this study. We envisioned that people in high SDI regions get more access to excessive protein, high-fat products, dairy calcium, and sodium that contribute to the rising trend of urolithiasis.3 Meanwhile, the areas with high SDI referred to high medical standards and more access to medical examination, which may prolong the survival time of patients and reduce death cases.
Although our study comprehensively analyzed burden data and trends of urolithiasis at different global, regional, and national levels from 1990 to 2019, it still had inevitable limitations. Since GBD data came from hospital disease registration, individual disease reporting, or other aspects, data reliability from different countries and regions is different. Countries and territories with more complete medical systems, such as the United States, the United Kingdom, China, Russia, and the European Union, have higher data reliability. Some of the information is missing and unreliable for developing countries and regions with imperfect medical systems. Low-dose computed tomography (CT) is the preferred diagnostic method for urolithiasis recommended by EAU Guidelines.1 However, due to limited medical resources in these countries and regions, it cannot support a complete and large-scale epidemiological investigation, which may cause missing or wrong statistical data. In addition, GBD data are unavailable in some countries or regions, which is of great urgency to be considered when interpreting the results.
Conclusion
This study suggested that the total incidence and DALY cases showed a significant growth trend, whereas the global ASIR and age-standardized DALY rate of urolithiasis had decreased. Although males’ ASIR was higher than females, the magnitude of increase was closer from 1990 to 2019. We also observed a weakly positive correlation between ASIR of urolithiasis and SDI. More reliable research is needed to elucidate the determinants of stone formation and guide the clinical decisions on urolithiasis prevention and treatment.
Abbreviations
GBD, Global Burden of Disease; IRFS, Injuries and Risk Factors Study; DALYs, disability-adjusted life years; GHDx, Global Health Data Exchange; ASR, age-standardized rates; YLL, years of life lost; YLD, years lived with disability; SDI, socio-demographic index; HDI, human development index; GLM, generalized linear model; EAPC, estimated annual percentage change; AAPC, average annual percent change; GATHER, Guidelines for Accurate and Transparent Health Estimation Reporting for Population Health Research; CI, confidence interval; ASIR, age-standardized incidence rate; ASDR, age-standardized death rate.
Acknowledgments
We would like to sincerely appreciate all the colleagues from the Department of Urology, The First Affiliated Hospital of Xi’an Jiaotong University for their support.
Disclosure
The authors declare that the research was conducted in the absence of any commercial or financial relationships that could be construed as a potential conflict of interest.
References
1. Türk C, Petřík A, Sarica K, et al. EAU guidelines on diagnosis and conservative management of urolithiasis. Eur Urol. 2016;69(3):468–474. doi:10.1016/j.eururo.2015.07.040
2. Scales CD, Smith AC, Hanley JM, Saigal CS. Prevalence of kidney stones in the United States. Eur Urol. 2012;62(1):160–165. doi:10.1016/j.eururo.2012.03.052
3. Sorokin I, Mamoulakis C, Miyazawa K, Rodgers A, Talati J, Lotan Y. Epidemiology of stone disease worldwide. World J Urol. 2017;35(9):1301–1320. doi:10.1007/s00345-017-2008-6
4. Siener R. Nutrition and kidney stone disease. Nutrients. 2021;13(6):1917. doi:10.3390/nu13061917
5. Bray F, Ferlay J, Soerjomataram I, Siegel RL, Torre LA, Jemal A. Global cancer statistics 2018: GLOBOCAN estimates of incidence and mortality worldwide for 36 cancers in 185 countries. Ca- Cancer J Clin. 2018;68(6):394–424. doi:10.3322/caac.21492
6. Lozano R, Naghavi M, Foreman K, et al. Global and regional mortality from 235 causes of death for 20 age groups in 1990 and 2010: a systematic analysis for the Global Burden of Disease Study 2010. Lancet. 2012;380(9859):2095–2128.
7. Yusuf S, Hawken S, Ounpuu S, et al. Effect of potentially modifiable risk factors associated with myocardial infarction in 52 countries (the INTERHEART study): a case-control study. Lancet. 2004;364(9438):937–952.
8. Liu Z, Jiang Y, Yuan H, et al. The trends in incidence of primary liver cancer caused by specific etiologies: results from the Global Burden of Disease Study 2016 and implications for liver cancer prevention. J Hepatol. 2019;70(4):674–683. doi:10.1016/j.jhep.2018.12.001
9. Bai X, Yi M, Dong B, Zheng X, Wu K. The global, regional, and national burden of kidney cancer and attributable risk factor analysis from 1990 to 2017. Exp Hematol Oncol. 2020;9(1):27. doi:10.1186/s40164-020-00181-3
10. Safari S, Kolahi AA, Naghavi M. Global, the regional and national burden of bladder cancer and its attributable risk factors in 204 countries and territories, 1990–2019: a systematic analysis for the Global Burden Disease study 2019. BMJ Glob Health. 2021;6(11):e004128. doi:10.1136/bmjgh-2020-004128
11. Launer BM, McVary KT, Ricke WA, Lloyd GL. The rising worldwide impact of benign prostatic hyperplasia. BJU Int. 2021;127(6):722–728. doi:10.1111/bju.15286
12. Murray CJL, Lopez AD. Measuring the Global Burden of Disease. N Engl J Med. 2013;369(5):448–457. doi:10.1056/NEJMra1201534
13. Imamura F, Micha R, Khatibzadeh S, et al. Dietary quality among men and women in 187 countries in 1990 and 2010: a systematic assessment. Lancet Glob Health. 2015;3(3):e132–42. doi:10.1016/S2214-109X(14)70381-X
14. Taylor EN, Fung TT, Curhan GC. DASH-style diet associates with reduced risk for kidney stones. J Am Soc Nephrol. 2009;20(10):2253–2259. doi:10.1681/ASN.2009030276
15. Curhan GC, Willett WC, Rimm EB, et al. A prospective study of dietary calcium and other nutrients and the risk of symptomatic kidney stones. N Engl J Med. 1993;328(12):833–838. doi:10.1056/NEJM199303253281203
16. van Aswegen CH, Hurter P, van der Merwe CA, et al. The relationship between total urinary testosterone and renal calculi. Urol Res. 1989;17(3):181–183. doi:10.1007/BF00256248
17. Otunctemur A, Ozbek E, Cakir SS, et al. Urolithiasis is associated with low serum testosterone levels in men. Arch Ital Urol Androl. 2015;87(1):83–86. doi:10.4081/aiua.2015.1.83
18. Heller HJ, Sakhaee K, Moe OW, Pak CYC. Etiological role of estrogen status in renal stone formation. J Urol. 2002;168(5):1923–1927. doi:10.1097/01.ju.0000033907.21910.be
19. Peerapen P, Thongboonkerd V. Protective cellular mechanism of estrogen against kidney stone formation: a proteomics approach and functional validation. Proteomics. 2019;19(19):e1900095. doi:10.1002/pmic.201900095
20. Nackeeran S, Katz J, Ramasamy R, Marcovich R. Association between sex hormones and kidney stones: analysis of the national health and nutrition examination survey. World J Urol. 2021;39(4):1269–1275. doi:10.1007/s00345-020-03286-w
21. Blüher M. Obesity: global epidemiology and pathogenesis. Nat Rev Endocrinol. 2019;15(5):288–298. doi:10.1038/s41574-019-0176-8
22. Curhan GC, Willett WC, Rimm EB, et al. Body size and risk of kidney stones. J Am Soc Nephrol. 1998;9(9):1645–1652. doi:10.1681/ASN.V991645
23. Trinchieri A, Croppi E, Montanari E. Obesity and urolithiasis: evidence of regional influences. Urolithiasis. 2017;45(3):271–278. doi:10.1007/s00240-016-0908-3
24. Silva GRN, Maciel LC. Epidemiology of urolithiasis consultations in the Paraíba Valley. Rev Colégio Bras Cir. 2016;43:410–415. doi:10.1590/0100-69912016006001
25. Bartoletti R, Cai T, Mondaini N, et al. Epidemiology and risk factors in urolithiasis. Urol Int. 2007;79(1):3–7. doi:10.1159/000104434
26. Seitz C, Fajkovic H. Epidemiological gender-specific aspects in urolithiasis. World J Urol. 2013;31(5):1087–1092. doi:10.1007/s00345-013-1140-1
27. Ramello A, Vitale C, Marangella M. Epidemiology of nephrolithiasis. J Nephrol. 2000;13(Suppl 3):S45–50.
28. Ziemba JB, Matlaga BR. Epidemiology and economics of nephrolithiasis. Investig Clin Urol. 2017;58(5):299–306. doi:10.4111/icu.2017.58.5.299
29. Gadzhiev N, Prosyannikov M, Malkhasyan V, et al. Urolithiasis prevalence in the Russian Federation: analysis of trends over 15 years. World J Urol. 2021;39(10):3939–3944. doi:10.1007/s00345-021-03729-y
30. Memon A, Anwar K, Orakzai N, et al. Epidemiology of stone disease in Pakistan. In: Talati JJ, Tiselius HG, Albala DM, Ye Z, editors. Urolithiasis: Basic Science and Clinical Practice. Springer; 2012: 21–38. doi:10.1007/978-1-4471-4387-1_3
31. Basiri A, Shakhssalim N, Khoshdel AR, Ghahestani SM, Basiri H. The demographic profile of urolithiasis in Iran: a nationwide epidemiologic study. Int Urol Nephrol. 2010;42(1):119–126. doi:10.1007/s11255-009-9588-z
32. Free MAHA, Sreedharan J, Muttappallymyalil J, et al. A retrospective study of the seasonal pattern of urolithiasis. Saudi J Kidney Dis Transplant. 2012;23(6):1232. doi:10.4103/1319-2442.103565
33. Iii AC, Jalloh M, Ndoye M, et al. Surgical management of urolithiasis of the upper tract – current trend of endourology in Africa. Res Rep Urol. 2020;12:225–238. doi:10.2147/RRU.S257669
34. Quarrier S, Li S, Penniston KL, et al. Lower socioeconomic status is associated with adverse urinary markers and surgical complexity in kidney stone patients. Urology. 2020;146:67–71. doi:10.1016/j.urology.2020.09.025
35. Bachour K, Rezaee ME, Swanton AR, et al. Understanding the relationship between health insurance and kidney stones: an examination of NHANES data. Can J Urol. 2020;27(3):10238–10243.
 © 2022 The Author(s). This work is published and licensed by Dove Medical Press Limited. The full terms of this license are available at https://www.dovepress.com/terms.php and incorporate the Creative Commons Attribution - Non Commercial (unported, v3.0) License.
By accessing the work you hereby accept the Terms. Non-commercial uses of the work are permitted without any further permission from Dove Medical Press Limited, provided the work is properly attributed. For permission for commercial use of this work, please see paragraphs 4.2 and 5 of our Terms.
© 2022 The Author(s). This work is published and licensed by Dove Medical Press Limited. The full terms of this license are available at https://www.dovepress.com/terms.php and incorporate the Creative Commons Attribution - Non Commercial (unported, v3.0) License.
By accessing the work you hereby accept the Terms. Non-commercial uses of the work are permitted without any further permission from Dove Medical Press Limited, provided the work is properly attributed. For permission for commercial use of this work, please see paragraphs 4.2 and 5 of our Terms.