")
Back to Journals » Diabetes, Metabolic Syndrome and Obesity » Volume 14
GIP Receptor Antagonist, SKL-14959 Indicated Alteration of the Lipids Metabolism to Catabolism by the Inhibition of Plasma LPL Activity, Resulting in the Suppression of Weight Gain on Diets-Induced Obesity Mice
Authors Nakamura T , Tanimoto H, Okamoto M, Takeuchi M, Tsubamoto Y, Noda H
Received 22 December 2020
Accepted for publication 16 February 2021
Published 9 March 2021 Volume 2021:14 Pages 1095—1105
DOI https://doi.org/10.2147/DMSO.S297353
Checked for plagiarism Yes
Review by Single anonymous peer review
Peer reviewer comments 3
Editor who approved publication: Prof. Dr. Juei-Tang Cheng
Takashi Nakamura, Hitomi Tanimoto, Masayuki Okamoto, Mitsuaki Takeuchi, Yoshiharu Tsubamoto, Hitoshi Noda
Biological Research Group Drug Discovery Laboratories, Sanwa Kagaku Kenkyusho, Mie, Japan
Correspondence: Takashi Nakamura
Sanwa Kagaku Kenkyusho, Biological Research Group Drug Discovery Laboratories, 363 Shiosaki, Hokusei-Cho, Inabe-City, Mie, 511-0406, Japan
Tel +81-594-72-6221
Fax +81-594-72-0071
Email [email protected]
Introduction: Glucose-dependent insulinotropic polypeptide (GIP) plays a crucial role in the regulation of lipid metabolism via lipoprotein lipase (LPL). GIP receptor antagonist, SKL-14959, suppressed the weight gain in the diet-induced obesity model. However, the mechanism is not unclear. Therefore, we aimed to give insight into the reason.
Methods: Mice were divided into three groups of the low-fat diet, high-fat diets mixture with or without SKL-14959 for 151 days, and were monitored body weight and food consumption through the test. Oral glucose tolerance test (OGTT) and insulin tolerance test (ITT) were also performed. After that, blood, liver, muscle and adipose tissue were collected. Blood samples were measured glycosylated hemoglobin A1c (HbA1c), glucose, insulin, GIP level and plasma LPL activity. Triacylglycerol (TG) contents of liver and muscles were also measured. Moreover, a simple correlation analysis was performed.
Results: SKL-14959 suppressed the body weight gain, decreased body mass index (BMI), HbA1c, and fasting glucose level, and trended to decline adipose tissues weight and TG contents compared with the vehicle, and inhibited plasma LPL activity. OGTT and ITT in the SKL-14959 group were not significantly changed relative to the vehicle. Additionally, upon treatment with SKL-14959 treatment, weight gain had weak correlation with lipase activity. Furthermore, lipase activity was associated with the fat mass and not white but red muscle TG contents and liver TG contents were not associated with lipase activity but HbA1c.
In Conclusion: SKL-14959 might direct lipids metabolism to catabolism by inhibition of plasma LPL activity, resulting in the suppression of weight gain on diets-induced obesity mice.
Keywords: GIP, GIP receptor antagonist, anti-obesity, lipase activity, lipid metabolism
Introduction
Overweight and obesity are defined as abnormal or excessive fat accumulation that may impair health, and it recently has been a common issue in developed countries as well as the developing world.1 People who have obesity, compared to those with a normal or healthy weight, are at increased risks for many serious diseases and health conditions, including mortality, type 2 diabetes, insulin resistance, hypertension, dyslipidemia, cardiovascular disease, cancer, and sleep apnea and breathing problems.2
GIP is well known as a kind of incretin hormone released from duodenal intestine K-cell,3,4 which plays a crucial role in lipid accumulation through the anabolic pathway. GIP promotes intake and synthesis of the fatty acids5,6 following by the enhancement of lipoprotein lipase (LPL; EC3.1.1.3) activities on adipocytes.7,8 GIP extinguished plasma chylomicron triglyceride (TG) faster than the control in the dog,9 and suppressed the post-prandial hypertriglyceridemia by intraduodenal fat load and GIP antiserum treatment counteracted this in rat.10 In humans, there is clear evidence that has an association between post-prandial GIP concentration and TG levels, suggesting that this correlation may depend on changes in LPL activity.11 LPL is responsible for hydrolyzing the TG of the triglyceride-rich lipoproteins such as chylomicrons (CM) and very low-density lipoproteins (VLDL),12 and hepatic lipase (HL; EC3.1.1.3) works as both phospholipase and a TG lipase and affects the lipid composition of all lipoprotein classes including in the intermediate-density lipoprotein (IDL) and low-density lipoprotein (LDL), and plays an important role in high-density lipoprotein (HDL) metabolism.13,14
Additionally, GIP receptor knock-out mice showed the suppression of the body weight compared with the wild mice in the high-fat diets (HFD)-induced model,15 and treatment with GIP receptor antagonist, (Pro3)GIP, has protected against obesity, insulin resistance and glucose tolerance in diet-induced obesity (DIO) mice and genetic mice, respectively.16,17 On the contrary, the subchronic treatment with the GIP receptor antagonist, GIP (3–30) NH2, increased body weight and fat mass compared with the vehicle in rats.18 This apparent contradiction might be because those compounds were modified native GIP, making hormone regulation be disrupted by the feedback system.
So far, we have reported19,20 that GIP receptor-specific antagonist, SKL-14959, shows suppressing the weight gain without affecting food intake in high-fat DIO mice model, and reducing the liver and muscle TG contents and improving hepatic transaminase activities by reducing the ketone level. It was suggested that SKL-14959 inhibited fat intake in adipocytes and improved lipids metabolism. However, the mechanism of the effects described above remains to be clarified. In the present study, we aimed to estimate the flow in lipids metabolism by SKL-14959 treatment.
Materials and Methods
Chemicals
SKL-14959 was synthesized in-house laboratory. Human recombinant insulin, NovolinR 100 (100 I.U./mL) was purchased from Novo Nordisk Pharma Ltd. (Bagsvaerd Denmark). All other chemicals were used in molecular biology grade.
Animal Study
All experiments were approved by the committee on animal care of Sanwa Kagaku Kenkyusho, SKK in accordance with the low “Guidelines for Proper Conduct of Animal Experiments”. The animal study was performed as described below (Figure 1). Male ICR mice purchased from Clea Japan (Osaka, Japan) at 10 weeks of age were fed standard powder diet, CRF-1 (Oriental Yeast Co., Ltd. Tokyo, Japan). Mice were maintained at a constant temperature of 23 ± 2°C under a 12-hr light-dark cycle (lights on from 7:00 to 19:00) and were allowed ad libitum access to food and water.
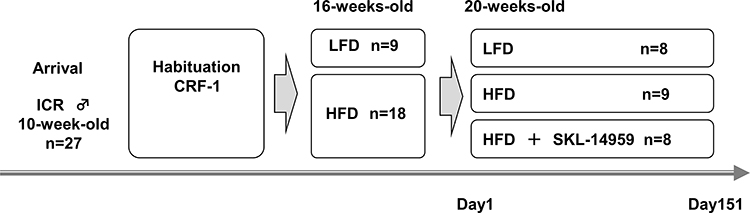 |
Figure 1 The outline of animal study. Male ICR mice were arrived at 10 weeks of age were fed standard diet to acclimate for 6 weeks. After that, mice were divided into two group of LFD and HFD group, moreover, the HFD group was divided into two groups with or without SKL-14959. That day was defined at day 1 and the terms of administration were 151 day. A mouse in the LFD group was excluded because of death by ITT, resulting was in the 8 mice. A mouse in the SKL-14959 treatment group was excluded because of a severe abrasion injury on the neck by the lid of food dispenser, resulting was in the 8 mice. |
Modeling Obesity and Evaluation of Treatment with SKL-14959
At 16weeks of age, mice were divided into two groups of low-fat diet (LFD), CR-LPF (Oriental Yeast Co., Ltd. Tokyo, Japan; fat 5%, protein 16.8%, carbohydrate 60.9%; 358.9 kcal/100g) and HFD21 (Oriental Yeast Co., Ltd. Tokyo, Japan; beef tallow 40%, corn starch 10%, sugar 9%, vitamin mixture 1%, mineral mixture 4% and casein 36%; 563.4 kcal/100g), and they were individually acclimated in the plastic cage for 4 weeks. Thereafter, the group of fed HFD was further divided into two groups with or without SKL-14959 with matched the body mass and food consumption, and the study was evaluated the effect of anti-obesity for 150–151 days. That day was defined on day1. SKL-14959 was administered by 0.133% mixed diets during the elucidating term. Body mass and food intake were continuously measured until the end of the study. Anatomy was split into two days to be as same as the condition of circadian rhythm in a day. Mice were measured the nose-to-anus lengths by caliper under ether anesthesia. Body mass index (BMI) was calculated as body weight (g) divided by the lengths (cm) squared. Blood collection was withdrawn from inferior vena cava followed by centrifuging to separate plasma, and then were kept at –80°C until each assay. Heart, liver, kidney, lung, spleen, adipose tissues (mesenteric, epididymal, perirenal and retroperitoneal adipose pads), muscle tissues (soleus, adductor, gastrocnemius and vastus lateralis) were immediately removed and was weighed. The small piece of liver and muscle tissues were stored –80°C for TG contents.
Oral Glucose Tolerance Test (OGTT) and Insulin-Sensitizing Test (ITT)
OGTT was performed on day 95. Glucose (2 g/kg) was gavaged in 16-h fasted mice, and the blood sample was collected from the cut tip of the tail at 0, 30, 60, 90 and 120 minutes after the challenge. ITT was carried out on day 122. Insulin (0.5 U/kg) was subcutaneously injected in 5-h fasted mice, and the blood sample was drawn from the cut tip of the tail at 0, 15, 30, 45, 60, 90, and 120 minutes after the challenge. Blood glucose level was determined using by glucose analyzer, Glutest Pro (Sanwa Kagaku Kenkyusho Co., Ltd., Nagoya, Japan).
TG Content in Liver and Muscles
TG level in tissues was measured according to the modified procedure reported previously.22 In brief, liver and muscle were homogenized in the chloroform-methanol mixture (2:1) using 5 mm yttria-stabilized zirconia ball (Tosho, Tokyo, Japan), and extracted organic layers by the same reagent and phosphate-buffer. The extracts solution was dried up under the stream of nitrogen and reconstructed in isopropanol-TritonX-100 (9:1). Thereafter, the TG concentration was determined using L-type Wako TG-H (Wako pure Chemicals, Osaka, Japan), and the TG contents in each tissue were expressed as µmol/g tissue.
Blood Analysis
Glycated hemoglobin A1c (HbA1c) was measured using high-performance liquid chromatography, HLC-723GHbV (Tosoh Corporation, Tokyo, Japan). Plasma GIP, insulin, leptin and adiponectin levels were measured using an enzyme-linked immunoassay Kit (LINCO RESEARCH, INC., Missouri USA, Shibayagi, Gunma, Japan, Morinaga Institute of Biological Science, Inc., Yokohama, Japan, and Otsuka pharmaceutical LTD., Tokushima, Japan, respectively). Lipoprotein lipase (LPL) activity was measured using the Total Lipase Test (PROGEN Biotechnik, Heidelberg, Germany) according to the manufacture’s instruction. Briefly, the plasma sample was diluted with the buffer containing physiological salt concentration at pH8.2 for total lipase activity or high salt concentration at pH8.8 for hepatic lipase (HL) activity, respectively.23 The rate assay was detected fluorescence intensity (at 342 nm excitation and 400 nm emission wavelengths) every 2 min at 37°C after the substrate was added to the mixture. The substrate is 1-trinitrophenyl-amino-dodecanoyl-2-pyrendecanoyl-3-0-hexadecyl-sn-glycerol (12-TA-10-P-H6), a triglyceride in which the pyrene fluorescence is intramolecularly quenched by the trinitrophenyl group.24 According to the standard curve, the molar fluorescence of the released pyrene group was calculated, and activities were expressed as pmol/min/mL, and the LPL activity is the total lipase activity minus the HL activity.
Statistical Analysis
Data were expressed as means ± standard error. Statistical analysis was carried out using BellCurve for Excel (Ver.2, Social Survey Research Information Co., Ltd. Tokyo, Japan). Two-way repeated-measures analysis of variance was performed to determine whether significant differences occurred between the weight, the weight gain, and the food intake, and then an unpaired t-test was performed between the LFD and HFD group or the HFD control and SKL-14959 treated group, respectively. Next, a single correlation analysis was performed to provide insight into the mechanism. A p-value <0.05 was considered statistically significant.
Results
Effects of SKL-14959 Treatment in the Biological and Physiological Test
The control group of mice fed HFD was significantly increased the body weight, weight gain, food intake, BMI, and HbA1c relative to the LFD group, and SKL-14959 treated group was significantly declined body weight gain, BMI, and HbA1c compared with that of the HFD control group. But, body weight and food intake were not significant (Table 1A). Next, the HFD control was significantly increased the weight of liver, adipose pads; mesenteric, epididymal, retroperitoneal and perinephric, and the sum of the individual white adipose tissues (WATs) compared with the LFD control, and SKL-14959 treated group was trended to decrease the WATs compared with that of HFD control (p<0.088, Table 1B), but heart, kidney, spleen, and lung were not observed the differentiation (data not shown).
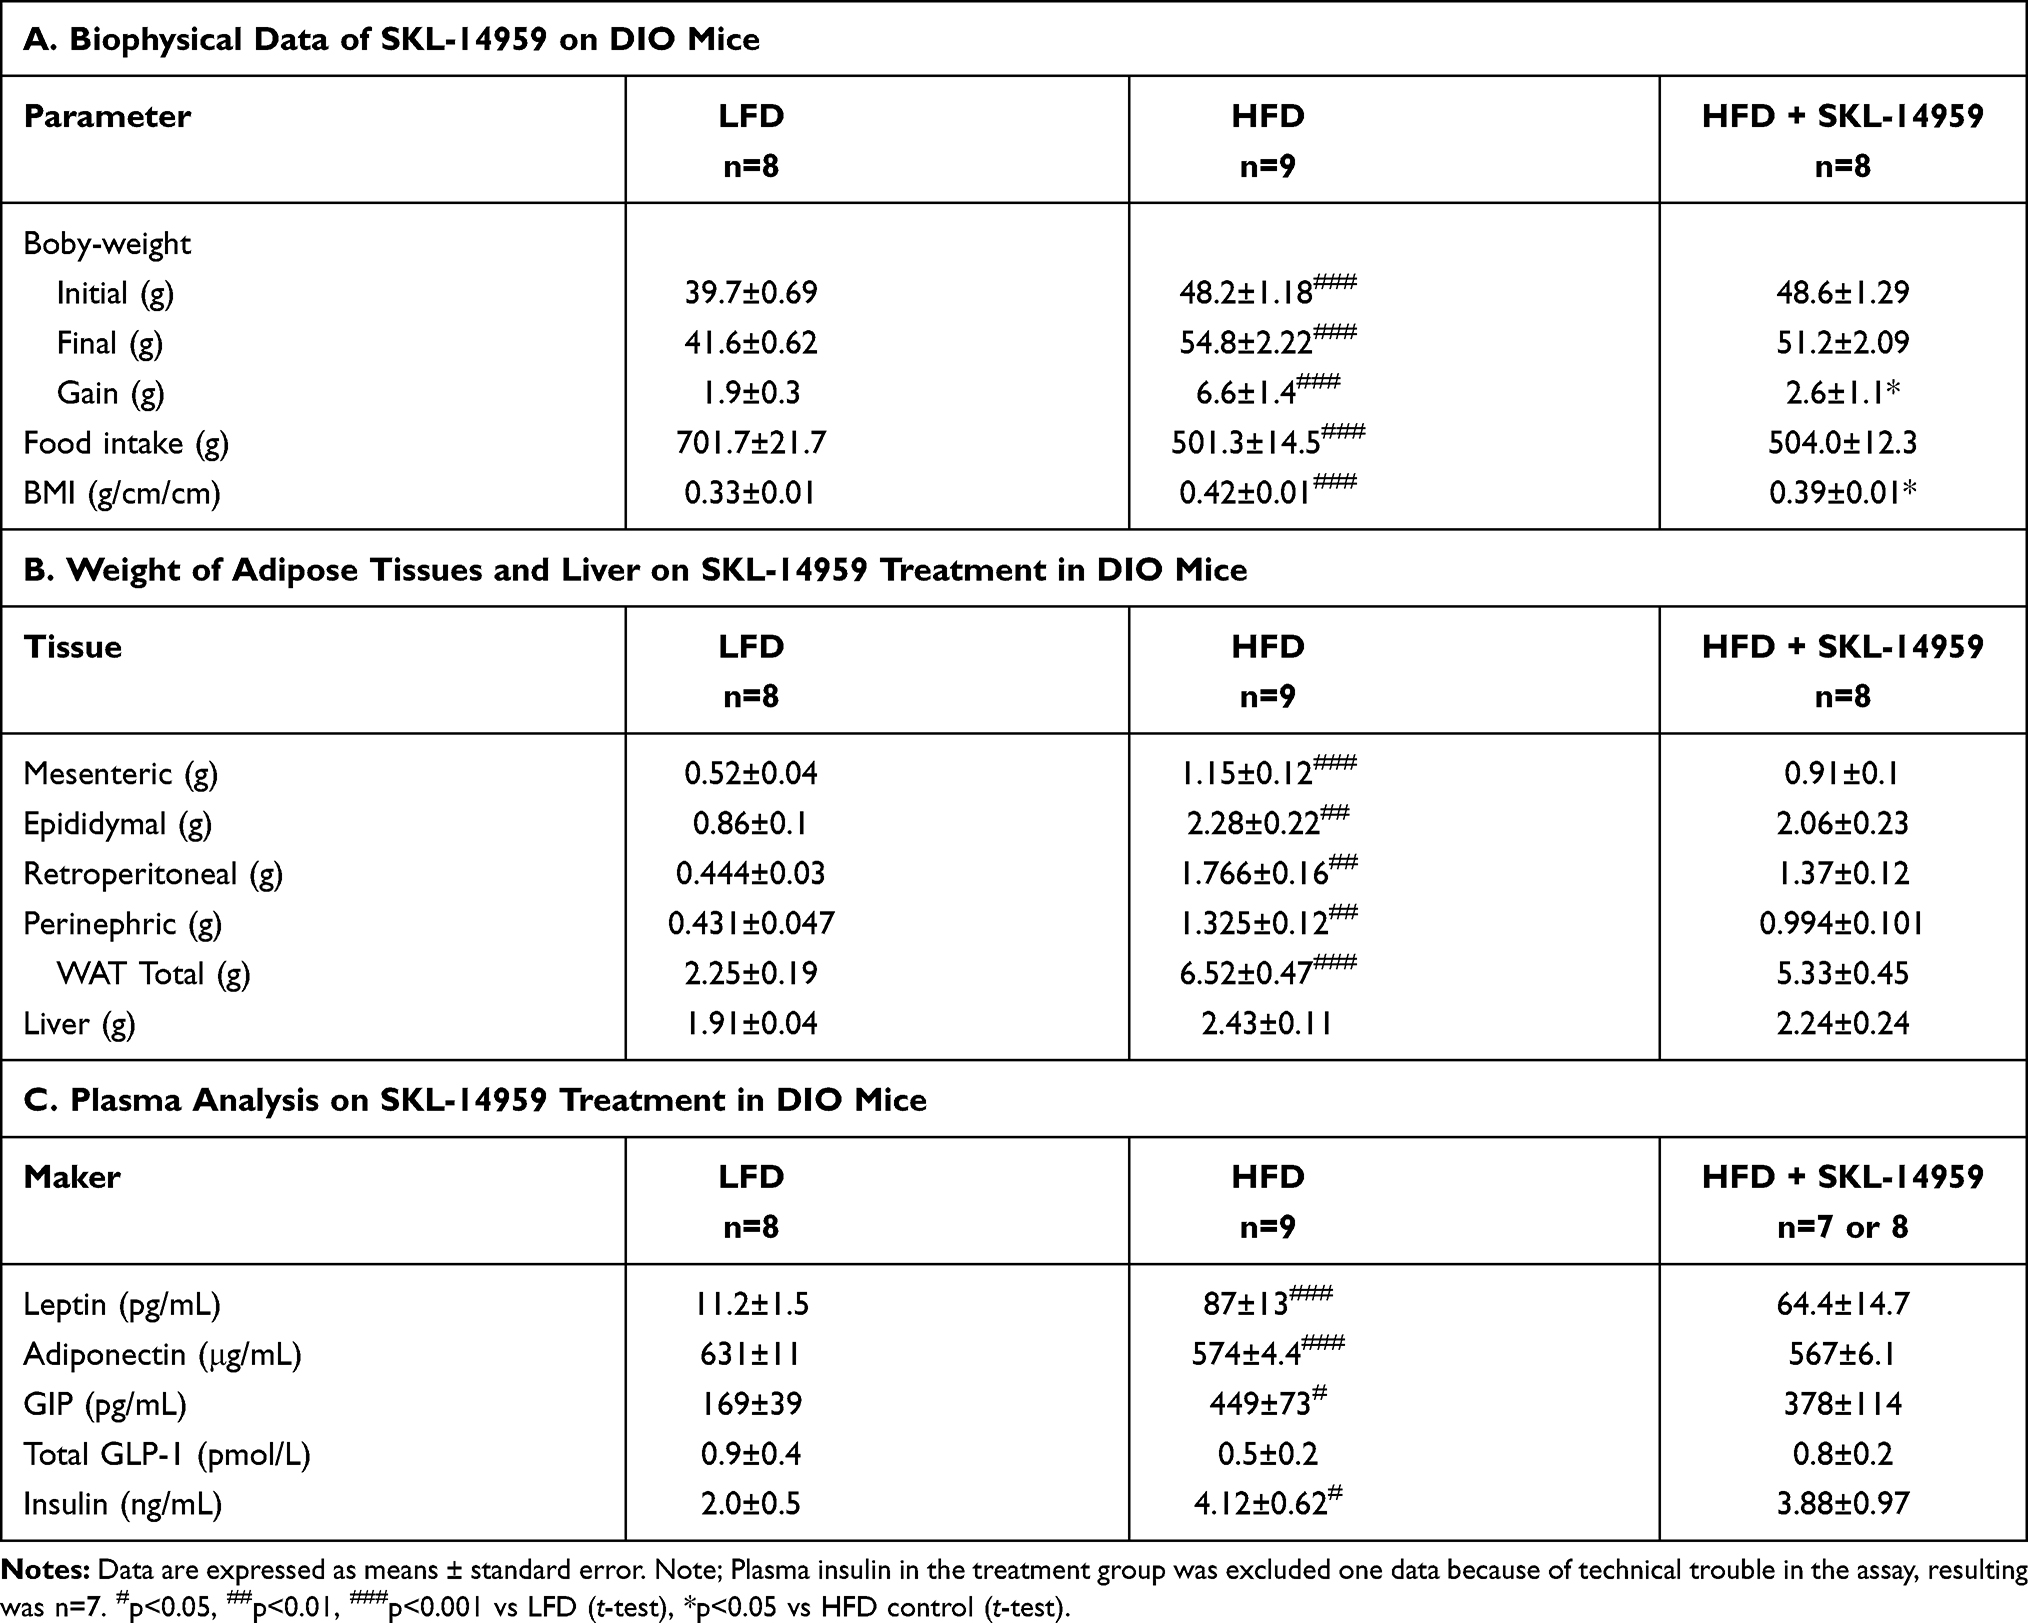 |
Table 1 Effects of SKL-14959 Treatment |
Blood Analysis
Plasma leptin, total GIP, and insulin level in the HFD group were higher than that of LFD group, and the SKL-14959 treated group was shown to be not significantly reduced their levels relative to the HFD group. On the contrary, the plasma adiponectin level in the HFD group was lower than that of the LFD group, and SKL-14959 treated group did not observe any differences. Total GLP-1 level was no significant difference among three groups (Table 1C).
Effect of SKL-14959 Treatment on the OGTT and ITT in DIO Mice
OGTT and ITT were performed on day 95 and 122, respectively. In OGTT, the fasting glucose level, it is at the beginning of the challenge, was increased in the HFD group, SKL-14959 treated group was significantly declined the level (Figure 2A), and thereafter the treated group was not significant reduced in the change of glucose level and the area under the curve (AUC) compared with HFD group (Figure 2B and C). The HbA1c in the group of HFD control was significantly increased compared with the LFD group, and SKL-14959 treatment group was significantly declined it relative to the HFD control group (Figure 2D). In ITT, SKL-14959 treatment was tended to be declined the glucose level compared with HFD control at 15 min after the challenge (p=0.088), thereafter the profile was inverted from 60 min, and the AUC was not significant (Figure 2E and F).
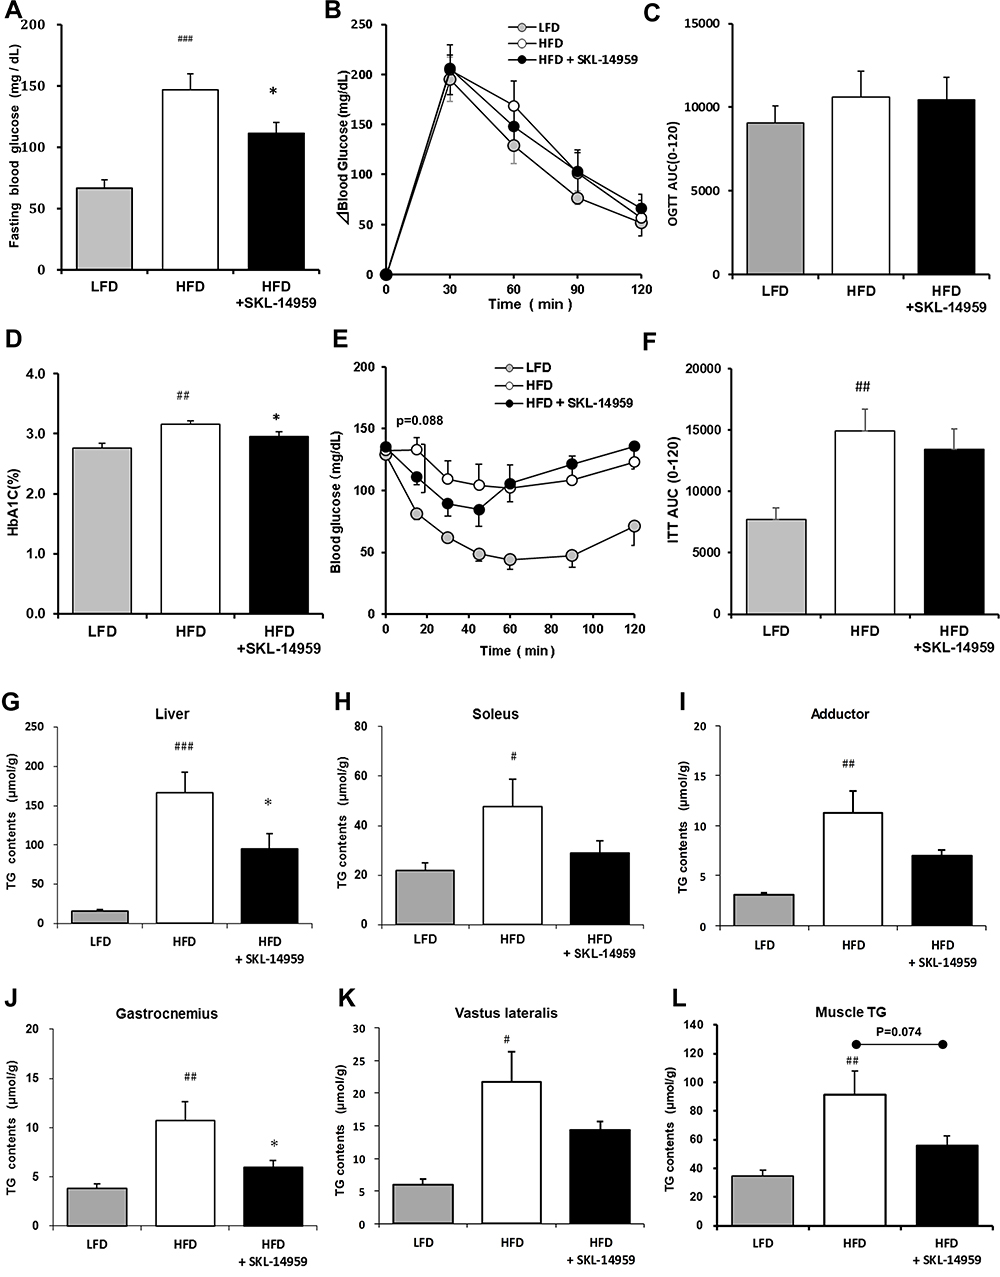 |
Figure 2 Effects of fasting blood glucose (A), change in blood glucose (B) and the AUC (C) in OGTT, HbA1c (D), blood glucose (E) and the AUC (F) in ITT, total, liver (G), soleus (H), adductor (I), gastrocnemius (J), vastus lateralis (K) and sum of muscle (L) TG contents on SKL-14959 treatment in the DIO mice. Data are expressed as means ± standard error in each group; LFD n=8, HFD n=9, HFD+SKL-14959 n=8. #p<0.05, ##p<0.01, ###p<0.001, vs LFD (t-test), *p<0.05 vs HFD control (t-test). |
Effects of SKL-14959 Treatment in the TG Content
The HFD control group was increased lipids accumulation in the liver and muscle (soleus, adductor, gastrocnemius and vastus lateralis, and the sum of each muscle) compared with the LFD group. SKL-14959 treated group was significantly declined the liver TG contents and was a tendency to decrease their muscles TG contents compared with the HFD control (Figure 2G–L).
Lipase Activity
SKL-14959 treated group was tended to decrease the plasma total lipase activity (p=0.069) and decreased the LPL activity relative to the HFD control group (Figure 3A and B). However, HL activity did not observe any difference (Figure 3C).
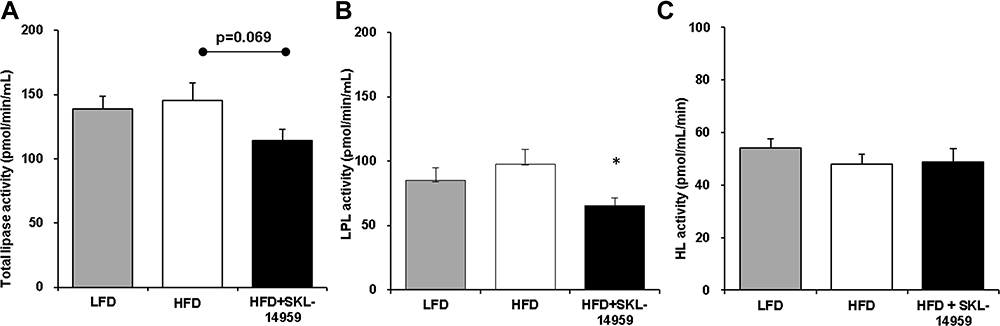 |
Figure 3 Effects of total lipase activity (A), LPL activity (B), and HL activity (C) on SKL-14959 treatment in the DIO mice. Data are expressed as means ± standard error in each group; LFD n=8, HFD n=9, HFD+SKL-14959 n=8. *p<0.05 vs HFD control (t-test). |
Correlation Analysis
A simple correlation analysis was performed to estimate the factors influencing the suppression of body weight gain in the SKL-14959 group. In the present study, the physiological and biological characterization of the high-fat DIO model was initially analyzed. The result showed that the body weight gain was positively associated with body weight, the liver and WATs weight and BMI, and was a weak correlation with TG contents in the liver and muscle (Figure 4). Thus, these results suggested that, at least, the reduction of ectopic fat accumulation in the organ might be important for weight loss. Secondly, according to the SKL-14959 administration, total lipase activity was associated with WATs weight and was a weak correlation with the weight gain and the not white but red muscle TG contents. Liver TG contents were associated with not total lipase activity but HbA1c (Figure 5A–F). Furthermore, GIP was weakly associated with not insulin but LPL activity (Figure 5G and H).
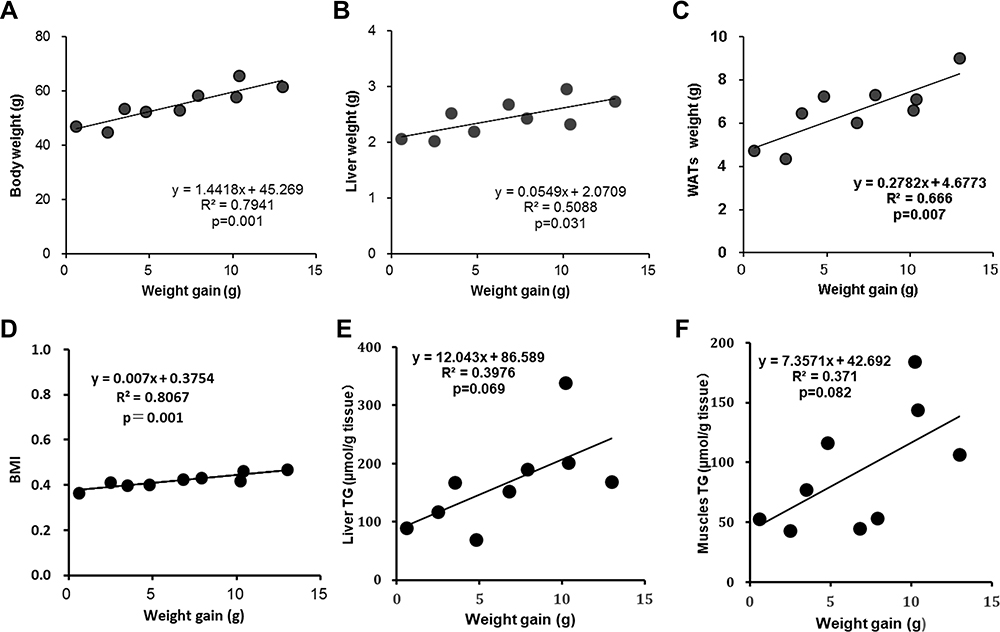 |
Figure 4 The relationship between weight gain versus body weight (A), liver weight (B), WATs(C), BMI (D), liver TG (E) and the sum of each muscle TG (F) of diabetic control group in DIO mice. |
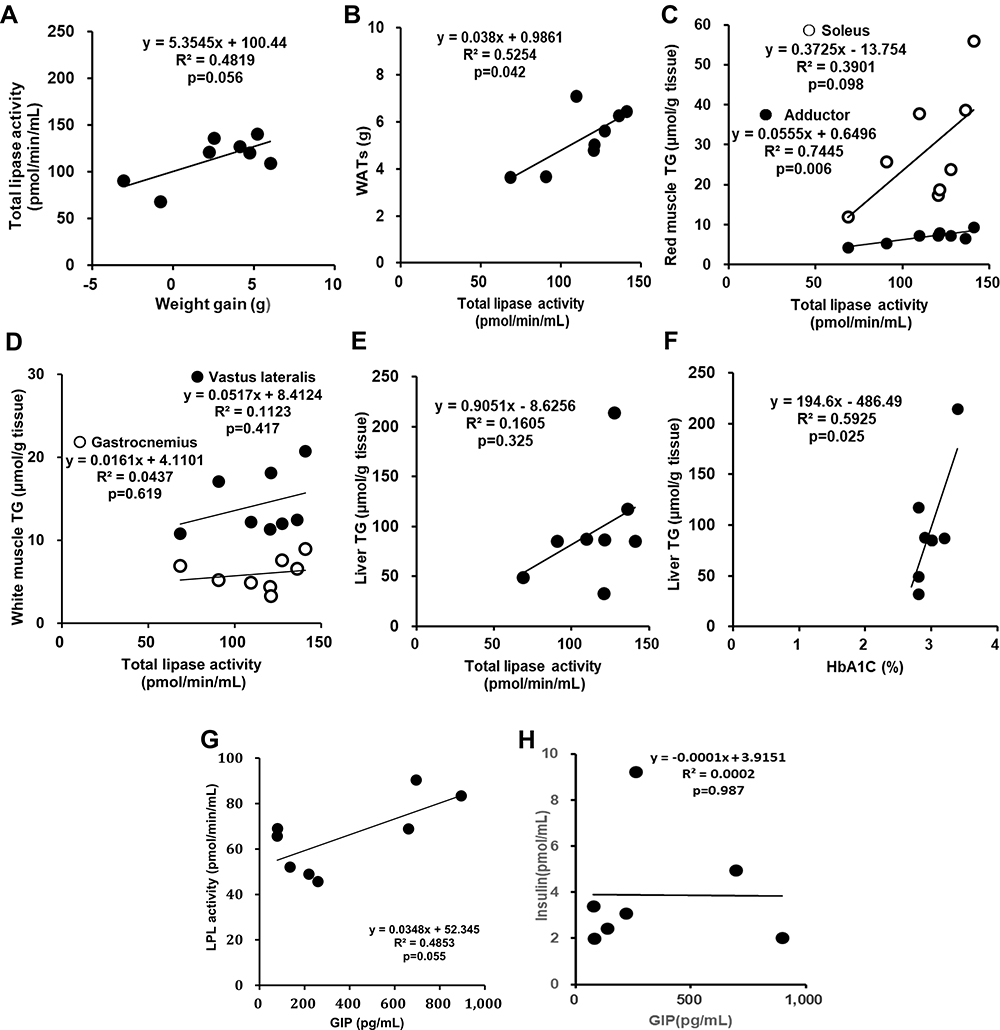 |
Figure 5 The relationship between weight gain versus total lipase activity (A), total lipase activity versus WATs (B), red muscle; soleus and adductor (C), white muscle; gastrocnemius and vastus lateralis (D) and liver TG (E), HbA1c versus liver TG (F), and GIP versus LPL activity (G) and insulin (H) on the SKL-14959 group in DIO mice. Note; Plasma insulin in the treatment group was excluded one data because of technical trouble in the assay, resulting was n=7. |
Discussion
In the present study, SKL-14959 suppressed the body weight gain without affecting food consumption in high-fat DIO mice (Table 1A) as described previously report,20 and glucose tolerance and insulin-sensitizing were evaluated. It had been previously reported that SKL-14959 showed to mechanically deteriorate the impaired glucose tolerance compared with the vehicle owing to the inhibition of insulin secretion when an intraperitoneal glucose tolerance test was performed.19 But, in the present study, SKL-14959 slightly lowered the glucose excursion compared with HFD control after the challenge in OGTT and ITT (Figure 2B and E), regardless of insulin level in the fed state was not significant among the HFD control and treatment group (Table 1C). Moreover, BMI, fasting glucose, and HbA1c levels were significantly decreased by SKL-14959 administration (Table 1A, Figure 2A and D). These results indicate that SKL-14959 might enhance the ability of glucose utilization in peripheral tissues and at least might not deteriorate the impaired glucose tolerance.
Herein, we provided insight into the mechanism that SKL-14959 reflected lipids and glucose metabolism followed by weight gain loss. Diets induce the secretion of hormones such as GIP and insulin and simultaneously increase postprandially chylomicron remnants in blood, and then they are hydrolyzed in a chain by the lipolytic enzymes such as LPL and HL followed act metabolized to HDL via VLDL, IDL and LDL (Figure 6).25
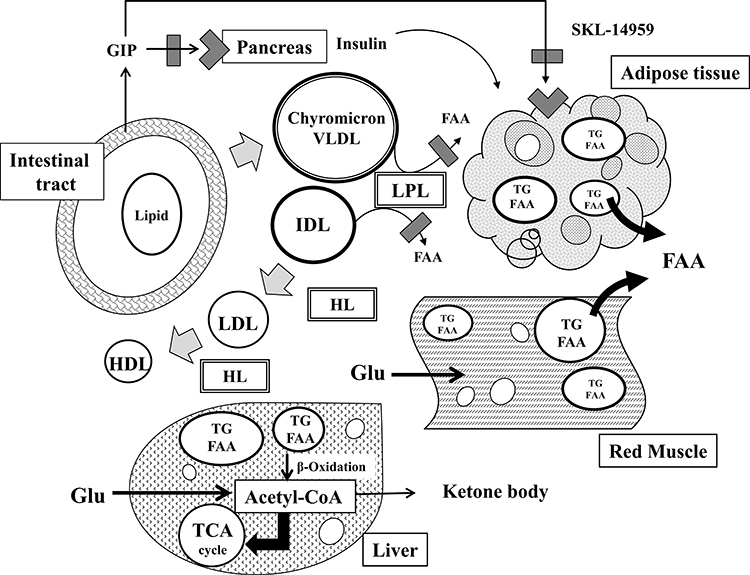 |
Figure 6 The mechanism of SKL-14959 in lipids and glucose metabolism. Diets secret GIP and insulin as well as increase postprandially chylomicron remnants in blood, and then chylomicron particles are sequentially hydrolyzed by LPL and HL, being metabolized to VLDL, IDL, LDL, and HDL. The inhibition of LPL activity can decrease the production of FFAs from lipid particles, catabolizing excess ectopic fat in adipocyte and muscle. After that, glucose uptake is enhanced, and increase glucose utility with beta-oxidation in muscle and liver. |
GIP has an anabolism of lipids via LPL activity.7,8 Kim et al reported26 that GIP increased LPL activity via AMPK with insulin in the adipocyte. According to the simple correlation analysis, GIP level was weakly positively associated with the LPL activity, but insulin was not significant (Figure 5G and H). It might be because that the LPL activity was not adipocyte or muscle but plasma, or the animal model was insulin resistance state. While SKL-14959 is the receptor antagonist, which is still unknown the influence for GIP secretion or the plasma GIP level. Thus, we would need to investigate the GIP-LPL signal pathway using animal tissues or cell lines in adipocytes or muscle.
LPL is a rate-limiting enzyme to hydrolyze TG in lipoprotein particles, which has the effect of removing the blood lipoproteins.27 LPL derived free fatty acids (FFAs) are incorporated into TG to store as energy in the tissues such as adipocyte, muscle, and liver, and are also utilized it for life activity. In the present study, SKL-14959 inhibited plasma LPL activity (Figure 3B). So far, SKL-14959 showed that although it was not significant, the plasma TG and FFA levels were high compared with that of HFD control (TG; 122 ± 19 vs 108 ± 17 mg/dL, FFA; 1.98 ± 0.2 vs 1.76 ± 0.2 μEq/L).20 Additionally, SKL-14959 neither altered the level of leptin and adiponectin (Table 1C) nor influenced the size of adipocyte.20 Thus, it was suggested that the reduction of LPL activity by SKL-14959 might enhance catabolically degradation of excessive ectopic lipids preserved in the adipocyte, muscle, and liver to procure metabolic energy in starvation tactics state.
Interestingly, lipase activity was weak in correlation with not white but red muscle TG contents (Figure 5C and D) and liver TG was associated with HbA1C (Figure 5F). In general, red muscles are aerobic metabolism, which is abundant mitochondria and enzyme activity concerning with Krebs cycle and β-oxidation is high. On the other hand, white muscles are anaerobic metabolism, which is composed of glycolysis enzyme.28 Moreover, FFA is contributed to β-oxidation to generate metabolic energy for lives.29 The β-oxidation is produced acetyl-CoA followed supplying for the Krebs cycle, and is simultaneously metabolized to ketone bodies which is an important fuel for an extra-hepatic organ such as brain substituted for diminished glucose utilities in diabetes mellitus and insulin resistance state.30–32 SKL-14959 was trended to decrease the ketone body.20 Skeletal muscle-specific deletion of LPL in mice reduced muscle TG contents, and increased glucose intake and insulin signaling in skeletal muscle,33 suggesting that long-term reduction of LPL derived FFAs uptake is increased in glucose utilization.34 Thus, excessive FFAs incorporated into the red muscle or liver promoted β-oxidation, and glucose incorporated into the white muscle or liver promoted glycolysis followed by conducting to Krebs cycle (Figure 6). Therefore, it was suggested that SKL-14959 might let an energy substrate switch from lipid to glucose under insulin resistance and obesity state, resulting in the amplification of glucose utility with FFA oxidation and decrease the TG contents followed the suppression of the weight gain.
In the present study, pre-heparin plasma lipase activity was measured. That was because that hemodynamic change by intravenous heparin administration wanted to avoid affecting the systemic molecular and metabolic regulation. In general, it seems that many studies with regard to LPL and HL protein and activity were evaluated using post-heparin plasma or tissue samples owing to the low level of pre-heparin ones.7,8,35,36 However, Robert et al13 reported that the measurement of pre-heparin plasma lipase activities (LPL and HL) does not require the administration of intravenous heparin, and pre-heparin plasma LPL and HL activity were associated with that of post-heparin. Per Tornvall et al reported12 that pre-heparin LPL activity was higher in patients with myocardial infarction compared with control. Moreover, there have been reported that pre-heparin plasma LPL mass was lower in type 2 diabetic mellitus compared with the control subject,37 suggesting that pre-heparin LPL mass might be a biomarker of metabolic syndrome and considered to be the indicator of insulin resistance of the whole body.37–39 In the present study, although the pre-heparin plasma LPL mass did not observe, the activity might be a contributing factor in the progression of lipid metabolism disorder. Thus, additional studies would be needed to elucidate the play a role in the pre-heparin plasma lipase activities.
There are some limitations to the study. Firstly, plasma glucagon levels did not determine. It was because that the IC50 value against the receptor was over 18 folds compared with that of GIP receptor,19 and it was not significantly different by SKL-14959 treatment.20 Secondly, it had needed to measure the LPL activity in muscle and adipocyte to speculate the lipids flow by SKL-14959. However, it is likely to be difficult to apply the muscle or adipose tissue in the point of view in clinical. Finally, the protein expression of the Krebs cycle or β-oxidation components had been analyzed. Thus, it should need to perform more study to elucidate in detail the glucose or lipids metabolism pathway by SKL-14959 in the future study.
In summary, SKL-14959 showed to suppress the body weight gain regardless of food intake as well as to inhibit the plasma LPL activity. Herein, we provided insight into the mechanism of SKL-14959. The inhibition of plasma LPL activity was conducted to the catabolically degradation of TG in the adipocyte under insulin resistance and the obesity state, simultaneously, enhanced the ability of glucose utilization in white muscle and liver as well as FFA-oxidation in red muscle and liver, resulting in moderated the lipids and glucose metabolism. Therefore, SKL-14959 decreased the ectopic fat depots through the inhibition of plasma LPL activity, followed by suppressing the weight gain.
Abbreviations
GIP, glucose-dependent insulinotropic polypeptide; OGTT, oral glucose tolerance test; ITT, insulin tolerance test; CM, chylomicron; LPL, lipoprotein lipase; HL, hepatic lipase; DIO, diet-induced obesity; HFD, high-fat diet; LFD, low-fat diet; WAT, white adipose tissue; BMI, body mass index; FFA, free fatty acid; AUC, area under the curve.
Acknowledgments
We greatly appreciate the excellent technical assistance by Nishitani Hitomi, Itoh Akiko, Ohtani Chika, Nampei Mai, and Akari Seigo for animal study and sample measurement.
Author Contributions
All authors made substantial contributions to conception and design, acquisition of data, or analysis and interpretation of data; took part in drafting the article or revising it critically for important intellectual content; agreed to submit to the current journal; gave final approval of the version to be published; and agree to be accountable for all aspects of the work.
Disclosure
The authors received no funding and report no conflicts of interest for this work.
References
1. WHO. World Health Organization: obesity and overweight. Available from: https://www.who.int/news-room/fact-sheets/detail/obesity-and-overweight.
2. CDC. Centers for disease control and prevention: healthy weight. the health effects of overweight and obesity. Available from: https://www.cdc.gov/healthyweight/effects/index.html.
3. Dupre J, Ross SA, Watson D, Brown JC. Stimulation of insulin secretion by gastric inhibitory polypeptide in man. J Clin Endocrinol Metab. 1973;37(5):826. doi:10.1210/jcem-37-5-826
4. Pederson RA, Schubert HE, Brown JC. Gastric inhibitory polypeptide. Its physiologic release and insulinotropic action in the dog. Diabetes. 1975;24(12):1050–1056. doi:10.2337/diab.24.12.1050
5. Beck B, Max JP. Hypersensitivity of adipose tissue to gastric inhibitory polypeptide action in the obese zucker rat. Cell Mol Biol. 1987;33(5):555–562.
6. Oben J, Morgan L, Fletcher J, Marks. V. Effect of the entero-pancreatic hormones, gastric inhibitory polypeptide and glucagon-like polypeptide-1(7-36) amide, on fatty acid synthesis in explants of rat adipose tissue. J Endocrinol. 1991;130(2):267–272. doi:10.1677/joe.0.1300267
7. Eckel RH, Fujimoto WY, Brunzell JD. Gastric inhibitory polypeptide enhanced lipoprotein lipase activity in cultured preadipocyte. Diabetes. 1979;28(12):1141–1142. doi:10.2337/diab.28.12.1141
8. Knapper JME, Puddicombe SM, Morgan LM, Fletcher JM. Investigations into the actions of glucose-dependent insulinotropic polypeptide and glucagon-like peptide-1 (7-36) amide on lipoprotein lipase activity in explants of rat adipose tissue. J Nutr. 1995;25:183–188.
9. Wasada T, McCorkle K, Harris V, Koichi K, Howard B, Unger RH. Effect of gastric inhibitory polypeptide on plasma levels of chylomicron triglycerides in dog. J Clin Invest. 1981;68(4):1106–1107. doi:10.1172/JCI110335
10. Ebert R, Nauck M, Creutzfeldt W. Effect of exogenous or endogenous gastric inhibitory polypeptide (GIP) on plasma triglyceride responses in rats. Horm Metab Res. 1991;23(11):517–521. doi:10.1055/s-2007-1003745
11. Norris GAMAR, Morgan F, Morgan L, Hampton S, Wright J, Marks V. Elevated post-prandial gastric inhibitory polypeptide concentrations in hypertriglyceridemic subjects. Clin Sci. 1997;93(4):343–347. doi:10.1042/cs0930343
12. Tornvall P, Olivecrona G, Karpe F, Hamsten A, Olivecrona T. Lipoprotein lipase mass and activity in plasma and their increase after heparin are separate parameter with different relations to plasma lipoproteins. Arter Thromb Vasc Biol. 1995;15(8):1086–1093. doi:10.1161/01.ATV.15.8.1086
13. Robert EH, Goldberg IJ, Steiner L, Yost TJ, Paternti JR. Relationship to postheparin lipolytic activity and evidence for metabolic regulation. Diabetes. 1988;37(5):610–615. doi:10.2337/diab.37.5.610
14. Peterson J, Bengtsson-Olivecrona G, Olivecrona T. Mouse preheparin plasma contains high levels of hepatic lipase with low affinity for heparin. Biochem Biophys Acta. 1986;878(1):65–70. doi:10.1016/0005-2760(86)90344-9
15. Miyawaki K, Yamada Y, Ban N, et al. Inhibition of gastric inhibitory polypeptide signaling prevent obesity. Nat Med. 2002;8(7):738–742. doi:10.1038/nm727
16. Gault VA, McClean PL, Cassidy RS, Irwin N, Flatt PR. Chemical gastric inhibitory polypeptide receptor antagonism protects against obesity, insulin resistance, glucose intolerance and associated disturbances in mice fed high-fat and cafeteria diets. Diabetologia. 2002;50(8):1752–1762. doi:10.1007/s00125-007-0710-4
17. Irwin N, McClean PL, Fpm O, et al. Early administration of the Glucose-dependent insulinotropic polypeptide receptor antagonist (Pro3) GIP prevents the development of diabetes and related metabolic abnormalities associated with genetically inherited obesity in ob/ob mice. Diabetologia. 2007;50(7):1532–1540. doi:10.1007/s00125-007-0692-2
18. Baldassano S, Gasbjerg LS, Kizikaya HS, et al. Increased body weight and fat mass after subchronic GIP receptor antagonist, but not GLP-2 receptor antagonist, administration in rat. Front Endocrinol (Lausanne). 2019;10:492. doi:10.3389/fendo.2019.00492
19. Nakamura T, Tanimoto H, Mizuno Y, et al. Biological and functional characteristics of a novel low-molecular-weight antagonist of glucose-dependent insulinotropic polypeptide receptor, SKL-14959, in vitro and in vivo. Diabetes Obes Metab. 2012;14(6):511–517. doi:10.1111/j.1463-1326.2011.01555.x
20. Nakamura T, Tanimoto H, Mizuno Y, et al. Gastric inhibitory polypeptide receptor antagonist, SKL-14959, suppressed body weight gain on diet-induced obesity mice. Obes Sci Pract. 2018;4(2):194–203. doi:10.1002/ops4.164.
21. Han L-K, Takaku T, Li. J, Kimura Y, Okuda H. Anti-obesity action of oolong tea. Int J Obes. 1999;23(1):98–105. doi:10.1038/sj.ijo.0800766
22. Folch BJ, Lees M, Sloanestanley GH. A simple method for the isolated and purification of total lipids from animal tissue. J Biol Chem. 1956;497–509.
23. Krauss RM, Windmueller HG, Levy RI, Fredrickson DS. Selective measurement of two different triglyceride lipase activities in rat postheparin plasm. J Lipid Res. 1973;14(3):286–295. doi:10.1016/S0022-2275(20)36886-3
24. Gerhild Z, Lutz H, Fritz S, et al. Inversion of lipase stereospecificity for fluorogenic alkyldiacyl glycerols effect of substrate solubilization. Eur J Biochem. 1995;231(1):50–55. doi:10.1111/j.1432-1033.1995.0050f.x
25. Cynthia C, Daniel LS. Hepatic lipase, high density lipoproteins, and hypertriglyceridemia. Am J Pathol. 2011;178(4):1429–1433. doi:10.1016/j.ajpath.2010.12.050
26. Kim SJ, Nian C, Mclntosh CHS. Activation of lipoprotein lipase by glucose-dependent insulinotropic polypeptide in adipocytes. J Biol Chem. 2007;282(12):8557–8567. doi:10.1074/jbc.M609088200
27. Eckel RH, Underhill LH, Eckel RH. Lipoprotein lipase: a multifunctional enzyme relevant to common metabolic diseases. N Engl J Med. 1989;320(16):1060–1068. doi:10.1056/NEJM198904203201607
28. Saltin B, Henriksson J, Nygaard E, et al. Fiber types and metabolic potentials of skeletal muscles in sedentary man and endurance runner. Ann NY Acad Sci. 1977;301(1 The Marathon):3–29. doi:10.1111/j.1749-6632.1977.tb38182.x
29. Simon E, Kim B, Morteza P. Mammalian β-oxidation. Biochem J. 1996;320(2):345–357. doi:10.1042/bj3200345
30. Felts PW, Crofford OB, Park CR. Effect of infused ketone bodies on glucose utilization in the dog. J Clin Invest. 1964;43(4):638–646. doi:10.1172/JCI104949
31. Mahendran Y, Vangipurapu J, Cederberg H, et al. Association of ketone body levels with hyperglycemia and type 2 diabetes in 9398 Finnish men. Diabetes. 2013;62(10):3618–3626. doi:10.2337/db12-1363
32. Huang BW, Chiang MT, Yao HT, Chiang W. The effect of high-fat and high fructose diets on glucose tolerance and plasma lipid and leptin levels in rats. Diabetes Obes Metab. 2004;6(2):120–126. doi:10.1111/j.1462-8902.2004.00323.x
33. Wang H, Knaub LA, Jensen DR, et al. Skeletal muscle-specific deletion of lipoprotein lipase enhances insulin signaling inn skeletal muscle but causes insulin resistance inn liver and other tissues. Diabetes. 2009;58(1):116–124. doi:10.2337/db07-1839
34. Augustus AS, Buchanan J, Park TS, et al. Loss of lipoprotein lipase-derived fatty acids leads to increased cardiac glucose metabolism and heart dysfunction. J Biol Chem. 2006;281(13):8716–8723. doi:10.1074/jbc.M509890200
35. Kobayashi J, Hashimoto H, Fukamachi I, et al. Lipoprotein lipase mass and activity in severe hypertriglyceridemia. Clin Chem Acta. 1993;216(1–2):113–123. doi:10.1016/0009-8981(93)90144-S
36. Ranganath LR, Beety JM, Wright J, Morgan LM. Nutrient regulation of post-heparin lipoprotein lipase activity in obese subjects. Horm Metab Res. 2001;33(1):57–61. doi:10.1055/s-2001-12628
37. Miyashita Y, Shirai K. Clinical determination of the severe of metabolic syndrome: preheparin lipoprotein lipase mass as new marker of metabolic syndrome. Curr Med Chem. 2005;3(4):377–381. doi:10.2174/156801605774322292
38. Saiki A, Oyama T, Endo K, et al. Preheparin serum lipoprotein lipase mass might be a biomarker of metabolic syndrome. Diabetes Res Clin Pract. 2007;76(1):93–101. doi:10.1016/j.diabres.2006.08.004
39. Hanyu O, Miida T, Kosuge K, et al. Preheparin lipoprotein lipase mass is a practical marker of insulin resistance in ambulatory type 2 diabetic patients treated with oral hypoglycemic agents. Clin Chem Acta. 2007;384(1–2):118–123. doi:10.1016/j.cca.2007.06.015
 © 2021 The Author(s). This work is published and licensed by Dove Medical Press Limited. The full terms of this license are available at https://www.dovepress.com/terms.php and incorporate the Creative Commons Attribution - Non Commercial (unported, v3.0) License.
By accessing the work you hereby accept the Terms. Non-commercial uses of the work are permitted without any further permission from Dove Medical Press Limited, provided the work is properly attributed. For permission for commercial use of this work, please see paragraphs 4.2 and 5 of our Terms.
© 2021 The Author(s). This work is published and licensed by Dove Medical Press Limited. The full terms of this license are available at https://www.dovepress.com/terms.php and incorporate the Creative Commons Attribution - Non Commercial (unported, v3.0) License.
By accessing the work you hereby accept the Terms. Non-commercial uses of the work are permitted without any further permission from Dove Medical Press Limited, provided the work is properly attributed. For permission for commercial use of this work, please see paragraphs 4.2 and 5 of our Terms.