")
Back to Journals » Neuropsychiatric Disease and Treatment » Volume 14
Ginkgo biloba extract and its diterpene ginkgolide constituents ameliorate the metabolic disturbances caused by recombinant tissue plasminogen activator in rat prefrontal cortex
Authors Chen Z, Bai S, Hu Q, Shen P, Wang T, Liang Z, Wang W, Qi X, Xie P
Received 6 March 2018
Accepted for publication 9 May 2018
Published 4 July 2018 Volume 2018:14 Pages 1755—1772
DOI https://doi.org/10.2147/NDT.S167448
Checked for plagiarism Yes
Review by Single anonymous peer review
Peer reviewer comments 4
Editor who approved publication: Professor Wai Kwong Tang
Zhi Chen,1–3,* Shunjie Bai,1–4,* Qingchuan Hu,1–4,* Peng Shen,2,3,5,* Ting Wang,2–4,* Zihong Liang,2,3,5,6,* Wei Wang,1–3 Xunzhong Qi,2,3,5 Peng Xie1,2,4–6
1Department of Neurology, Yongchuan Hospital, Chongqing Medical University, Chongqing, China; 2Institute of Neuroscience and the Collaborative Innovation Center for Brain Science, Chongqing Medical University, Chongqing, China; 3Chongqing Key Laboratory of Neurobiology, Chongqing, China; 4Key Laboratory of Laboratory Medical Diagnostics of Education, Department of Laboratory Medicine, Chongqing Medical University, Chongqing, China; 5Department of Neurology, The First Affiliated Hospital of Chongqing Medical University, Chongqing, China; 6Department of Neurology, The Inner Mongolia Autonomous Region People’s Hospital, Hohhot, Inner Mongolia, China
*These authors contributed equally to this work
Introduction: Although recombinant tissue plasminogen activator (rtPA) is a widely used therapy in patients with acute ischemic stroke, rtPA-induced toxicity or its adverse effects have been reported in our previous studies. However, Ginkgo biloba extract (GBE) may provide neuroprotective effects against rtPA-induced toxicity. Thus, in the present study, we investigated whether a single administration of rtPA caused neurotoxicity in the prefrontal cortex (PFC) of rats and determined whether GBE or its diterpene ginkgolide (DG) constituents were neuroprotective against any rtPA-induced toxicity.
Materials and methods: We randomly divided adult Sprague-Dawley rats into four groups that were intravenously administered saline, rtPA, rtPA+DG, or rtPA+GBE. The rats were sacrificed 24 hours later and the whole brain removed. A gas chromatography–mass spectrometry metabolomic approach was used to detect molecular changes in the PFC among the groups. Multivariate statistical and pathway analyses were used to determine the relevant metabolites as well as their functions and pathways.
Results: We found 32 metabolites differentially altered in the four groups that were primarily involved in neurotransmitter, amino acid, energy, lipid, and nucleotide metabolism. Our results indicated that a single rtPA administration caused metabolic disturbances in the PFC. Both GBE and DG effectively ameliorated these rtPA-induced disturbances, although DG better controlled the rtPA-induced glutamate and aspartate excitotoxicity and the activation of NMDA receptor.
Conclusion: Our results provide important novel mechanistic insights into the adverse effects of rtPA and offer directions for future exploration on the thrombolytic effects of rtPA combined with the administration of DG or GBE for the treatment of acute ischemic stroke in humans.
Keywords: recombinant tissue plasminogen activator (rtPA), diterpene ginkgolides (DG), Ginkgo biloba extract (GBE), metabolomics, prefrontal cortex, excitotoxicity
Introduction
Recombinant tissue plasminogen activator (rtPA), a serine protease, is the most effective thrombolytic treatment for patients with acute cerebral infarction.1 Intravenous thrombolysis with rtPA between 3 and 4.5 hours after symptom onset can significantly improve outcomes for ischemic stroke patients.2 However, in addition to its thrombolytic effect, rtPA has been associated with neuropathological effects. For instance, our previous studies indicated that rtPA can potentiate excitotoxic lesions and lead to neuronal death induced by NMDA,3 as well as induce long-term anxiety-like behaviors via the ERK1/2-GAD1-GABA cascade.4 Thus, more attention should be paid to the adverse neurological effects of rtPA to achieve more effective treatment of ischemic stroke.
Ginkgo biloba extract (GBE; EGb761) is a patented extract derived from the leaves of the Ginkgo biloba tree. Previous studies have investigated the neuroprotective effects of the extract on an extensive range of disorders and diseases.5–7 GBE and its constituent ginkgolides are potent inhibitors of platelet-activating factor, which leads to a reduction in excitotoxic damage,8,9 and both function as antioxidants. It has been suggested that GBE has a multitude of beneficial effects on central nervous system (CNS) function, and it has thus been widely used for treating neurologic, psychiatric, functional, and physiologic symptoms.6 GBE is approved in Germany for the treatment of cerebral insufficiency10 and in China for the treatment of acute ischemic stroke.11 Accumulating evidence of our group as well as investigators at other research institutes indicates that diterpene ginkgolides (DGs), which in this case are primarily ginkgolides A, B, C, and K, are responsible for the main pharmacological neuroprotection provided by GBE.6,12–17
Neuroprotection is an important auxiliary treatment for improving the prognosis of patients with cerebral infarction.3,18 Given the aforementioned effects of rtPA and GBE, we hypothesized that the combination therapy of rtPA and GBE would not only generate a thrombolytic effect but also protect against the neurotoxicity of rtPA in patients with ischemic stroke.
Quantitatively analyzing the corresponding variations in biochemical metabolites using metabolomics methods has been shown to reveal drug action mechanisms.19,20 Unbiased overall metabolic profiling may shed new light on the molecular mechanisms targeted by both established and experimental pharmacotherapies,21–24 thereby facilitating the development of novel thrombolytic treatments that target defined metabolic pathways.
The prefrontal cortex (PFC) is a pivotal neuroanatomical hub with roles in various cognitive functions, including cognitive control and decision making.25,26 Moreover, the PFC has been shown to be involved in psychiatric disorders. For example, our previous studies have revealed that amino acid metabolic disturbances occur in the PFC in rat models of depression.24,27,28
Taking together the foregoing evidence, in the present study, we investigated whether a single administration of rtPA led to neurotoxicity in normal rats and whether GBE or DG provided protective effects against any rtPA-induced neurotoxicity in the PFC of rats by examining the overall PFC metabolic profiles.
Materials and methods
Animals and experimental procedures
Male Sprague-Dawley (SD) rats (Chongqing Medical University, Chongqing, China) ~8 weeks old and weighing 230–250 g on the day of arrival were used for the experiments. Animals were group housed (5 rats/cage) and maintained with free access to food and water. All animal experiments were reviewed and approved by the Ethics Committee of Chongqing Medical University (permit number: 20120126). The experimental procedures were conducted abiding by the National Institutes of Health’s Guide for the Care and Use of Laboratory Animals.29 Forty-five SD rats were randomly divided into the following four groups (n=15 rats in each group): 1) CON (saline administered through a caudal vein injection, CVI); 2) rtPA (10 mg/kg, CVI); 3) rtPA+DG (10 mg/kg plus 6.75 mg/kg, CVI), DG injected simultaneously with rtPA; and 4) rtPA+GBE (10 mg/kg plus 8 mg/kg, CVI), GBE injected simultaneously with rtPA. RtPA was provided by Boehringer Ingelheim Pharma GmbH & Co. KG (Ingelheim, Germany). Ginaton, a standardized gingko extract, was purchased from Dr Willmar Schwabe (Karlsruhe, Germany). DG meglumine injection acted as DG was provided by Jiangsu Kanion Pharmaceutical Co., Ltd. (Jiangsu, China). The doses used in this study were based on those used in previous studies.16,30–32 The rats were sacrificed 24 hours after the injection by dislocation of the cervical vertebrae, and the whole brain was removed. The PFC was dissected, weighed, rapidly frozen with liquid nitrogen, and stored at −80°C until being used in assays.
Tissue sample pretreatment
To conduct gas chromatography–mass spectrometry (GC-MS) analyses, the PFC samples (40 mg) were transferred to a 1.5 mL centrifuge tube and submerged in 500 μL of a solution of water:methanol:chloroform (5:2:2, v/v/v). The mixture was sonicated for 5 minutes before being centrifuged at 14,000 rpm for 10 minutes. The supernatant (300 μL) was transferred to a glass sampling vial and vacuum dried at room temperature. The dried residue was dissolved in 80 μL of methoxamine hydrochloride (15 mg/mL pyridine) and incubated at 37°C for 90 minutes with continuous shaking. Then, 80 μL of bis(trimethylsilyl)trifluoroacetamide with 1% trimethyl chlorosilane was added, and the mixture was left to react for 1 hour at 70°C. The sample was derivatized and cooled to room temperature before being used in the assays.
GC–MS analysis
The GC-MS metabolomics procedure was conducted as described in our previous study.33 Each aliquot (1 μL) of the derivative sample was injected in splitless mode into a LECO Pegasus 4D GCxGC-TOF mass spectrometer (LECO, San Jose, MI, USA). The components were separated on a DB-17MS column (30 m × 0.25 mm, inner diameter [I.D.]; J&W Scientific, Folsom, CA, USA) with high-purity helium carrier gas at a flow rate of 1 mL/min. The injector temperature was set at 280°C. The temperature of the electron ionization ion source was set at 220°C. The column temperature was initially kept at 60°C for 1 minute and then ramped from 60°C to 100°C at 8°C/min, ramped from 170°C to 210°C at 5°C/min, ramped from 210°C to 305°C at 15°C/min, and then held at 305°C for 7 minutes. MS spectra were acquired from m/z 30 to 600.
The chromatographic peaks in the total ion current (TIC) chromatograms represent corresponding metabolites, and their relative concentrations can be detected using the peak area normalization method. In the present study, the TIC chromatograms from the four PFC sample groups revealed strong signals for analysis, large peak capacity, and good retention time (RT) reproducibility. Individual peaks were detected in each group. These peaks were annotated by comparing the accurate mass (m/z) and RT from National Institute of Standards and Technology online databases. The relative intensities of these metabolites were used in the subsequent multivariate statistical analysis.
Data analysis
GC-MS-based metabolomics data were converted into network common data form (NetCdf) file format using TagFinder preprocessing software.34 The subsequent processing information, containing peak indexes (RT-m/z), sample names, and normalized peak intensities, was imported into the SIMCA 11.5 software package (Umetrics, Umeå, Sweden). We used a principal component analysis (PCA) of quality control (QC) samples to evaluate the accuracy and repeatability of the GC-MS method (Figure S1). PCA score plot demonstrated that the QC samples are clustered together. This showed that our GC-MS analysis method was robust and reliable. Multivariate statistical analyses, a supervised partial least squares discriminant analysis (PLS-DA) with Pareto scaling spectral data, was used to distinguish the difference between the groups of metabolic profiles. The R2Y and Q2 values were used to quantify the quality of the built model. A 200-iteration permutation test was conducted to avoid overfitting the model. A significant metabolite was denoted with a variable importance in the projection (VIP) score >1 and a P-value <0.05 (obtained from two-tailed Student’s t-test). A Venn diagram was calculated and placed on the website located at http://bioinformatics.psb.ugent.be/webtools/Venn/. Cytoscape software 3.4.0 was used to build the correlation network between these differential metabolites and the paired comparisons. GraphPad Prism 7.0 (GraphPad Software, Inc., La Jolla, CA, USA) was used for plotting the data.
Metabolic functions and pathway analysis
The module supporting pathway analysis on the MetaboAnalyst 3.0 website was used to identify the metabolic pathways significantly affected by these metabolites.35 MetaboAnalyst was used to create a heat map of all the different metabolites, and Microsoft Visio 2013 was used to draw the schematic diagram. Ingenuity Pathway Analysis (IPA) Software (Qiagen, Redwood City, CA, USA) was used to analyze the different metabolites to obtain information about predicted molecular pathways and biological functions as described in http://www.ingenuity.com. IPA molecule activity predictor was used to predict the activity of molecules that were highly connected to these networks.
Results
PLS-DA model of GC-MS metabolomic analysis
PLS-DA score plot of CON, rtPA, rtPA+DG, and rtPA+GBE rats demonstrated clear discriminations among the four groups (R2X =0.693, R2Y =0.602, Q2 =0.46; Figure 1A). Then, we used the metabolites from the pairwise groups (15 rtPA rats vs 15 CON rats, 15 rtPA+DG rats vs 15 rtPA rats, and 15 rtPA+GBE rats vs 15 rtPA rats) to build PLS-DA models. The pairwise PLS-DA score plots demonstrated clear discriminations between the rtPA and CON groups (R2X =0.595, R2Y =0.688, Q2 =0.564; Figure 1B), the rtPA+DG and rtPA groups (R2X =0.666, R2Y =0.915, Q2 =0.761; Figure 1C), and the rtPA+GBE and rtPA groups (R2X =0.717, R2Y =0.957, Q2 =0.596; Figure 1D). The results of the 200-iteration permutation test showed that no overfitting had occurred; the models were valid and not overfit (Figure 1E–H).
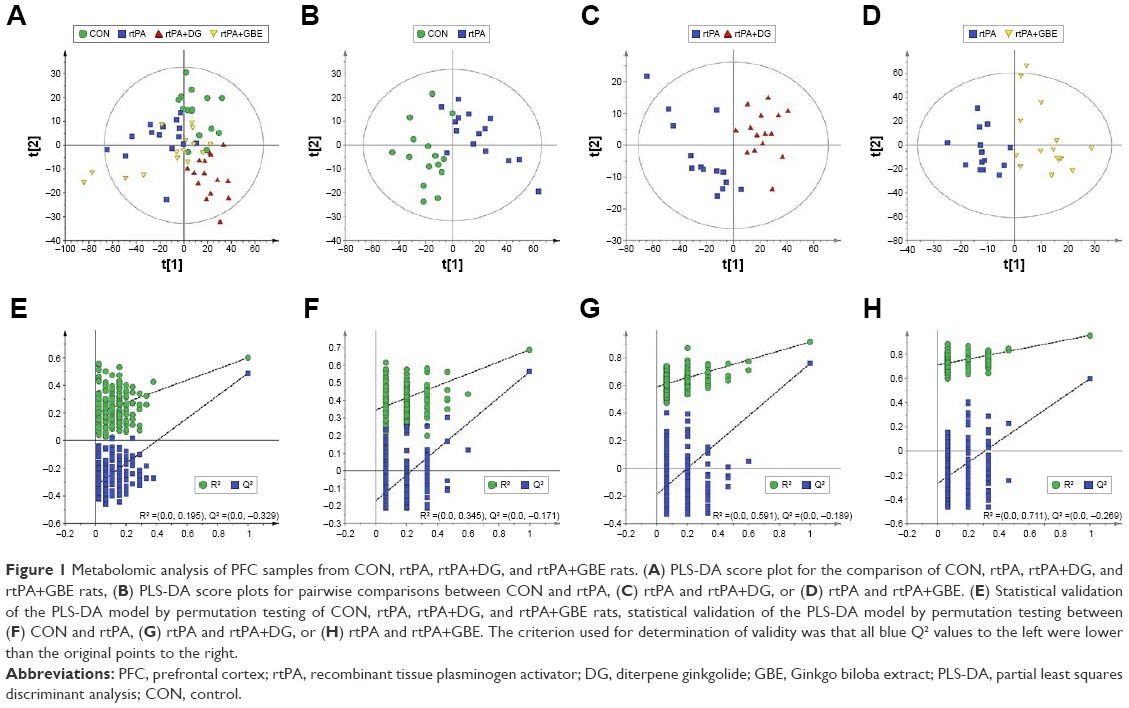 | Figure 1 Metabolomic analysis of PFC samples from CON, rtPA, rtPA+DG, and rtPA+GBE rats. (A) PLS-DA score plot for the comparison of CON, rtPA, rtPA+DG, and rtPA+GBE rats, (B) PLS-DA score plots for pairwise comparisons between CON and rtPA, (C) rtPA and rtPA+DG, or (D) rtPA and rtPA+GBE. (E) Statistical validation of the PLS-DA model by permutation testing of CON, rtPA, rtPA+DG, and rtPA+GBE rats, statistical validation of the PLS-DA model by permutation testing between (F) CON and rtPA, (G) rtPA and rtPA+DG, or (H) rtPA and rtPA+GBE. The criterion used for determination of validity was that all blue Q2 values to the left were lower than the original points to the right. |
Identification of differential metabolites among the four groups
Twenty differential metabolites (VIP >1.0 and P<0.05) were identified between the rtPA and CON groups. As compared with the PFC samples in the CON group, those in the rtPA group demonstrated lower levels of 2,3-dihydroxypyridine, aminooxyacetic acid, N-ethylglycine, hexachlorobenzene, palmitic acid, N-carbamylglutamate, glycine, and phosphate, but higher levels of pyroglutamic acid, myo-inositol, glutamic acid, aspartic acid, N-acetyl-L-aspartic acid (NAA), lactic acid, inosine, gamma-aminobutyric acid (GABA), N-acetyl-beta-alanine, glutamine, O-phosphoethanolamine, and glucose 6-phosphate (Table 1; Figures 2 and 3).
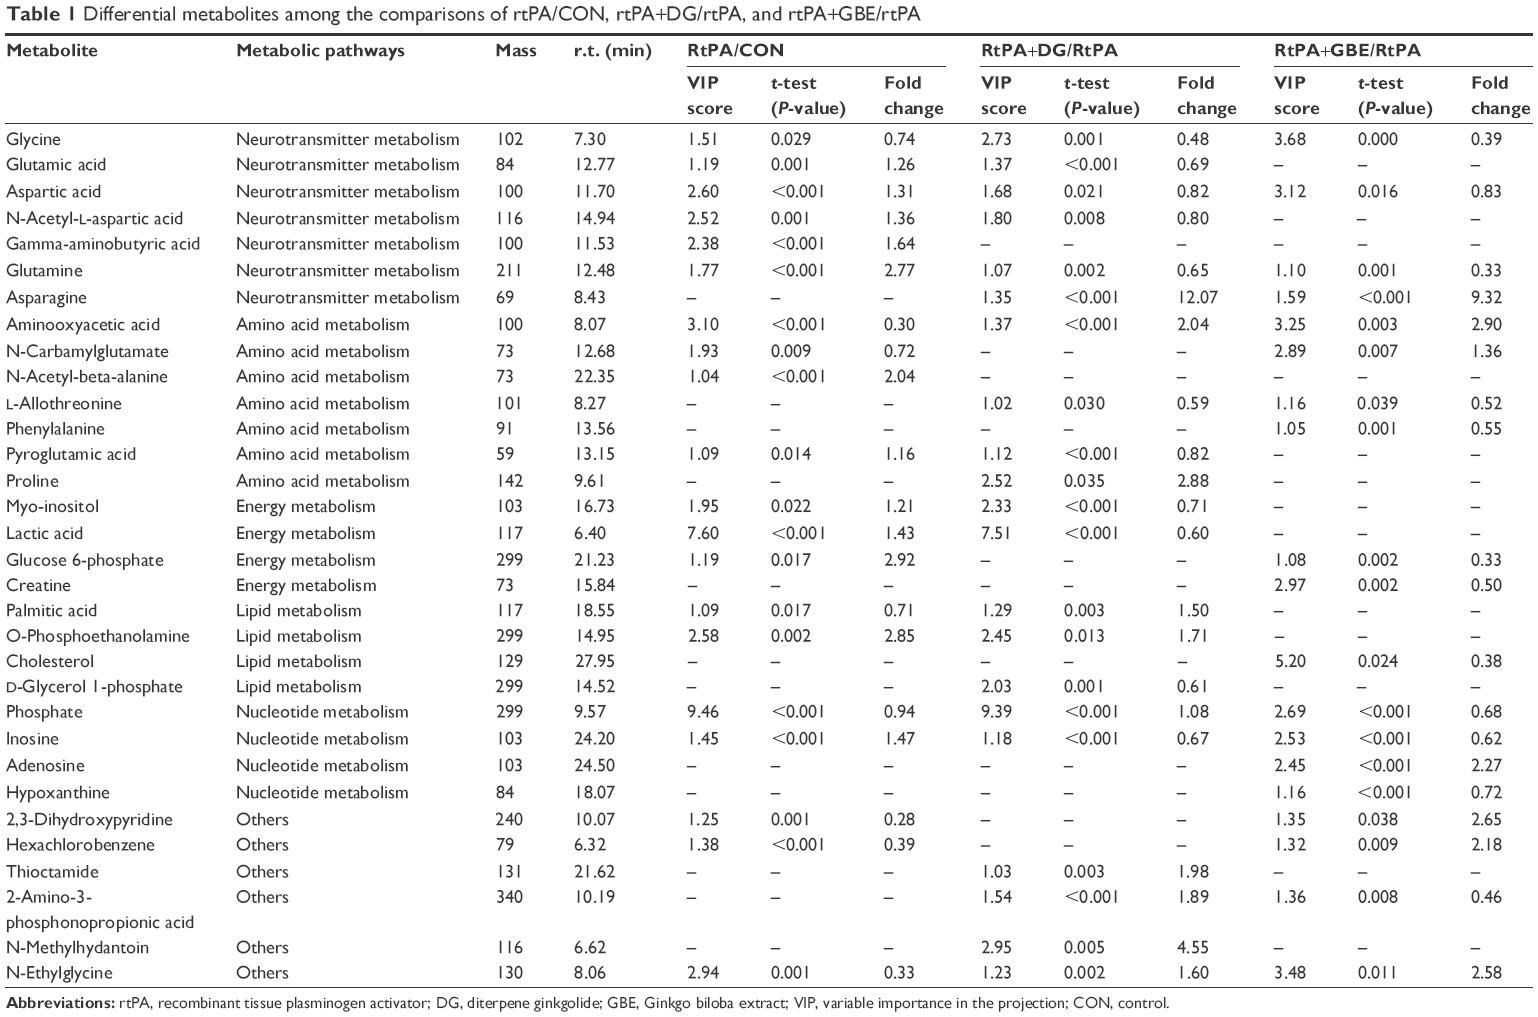 | Table 1 Differential metabolites among the comparisons of rtPA/CON, rtPA+DG/rtPA, and rtPA+GBE/rtPA |
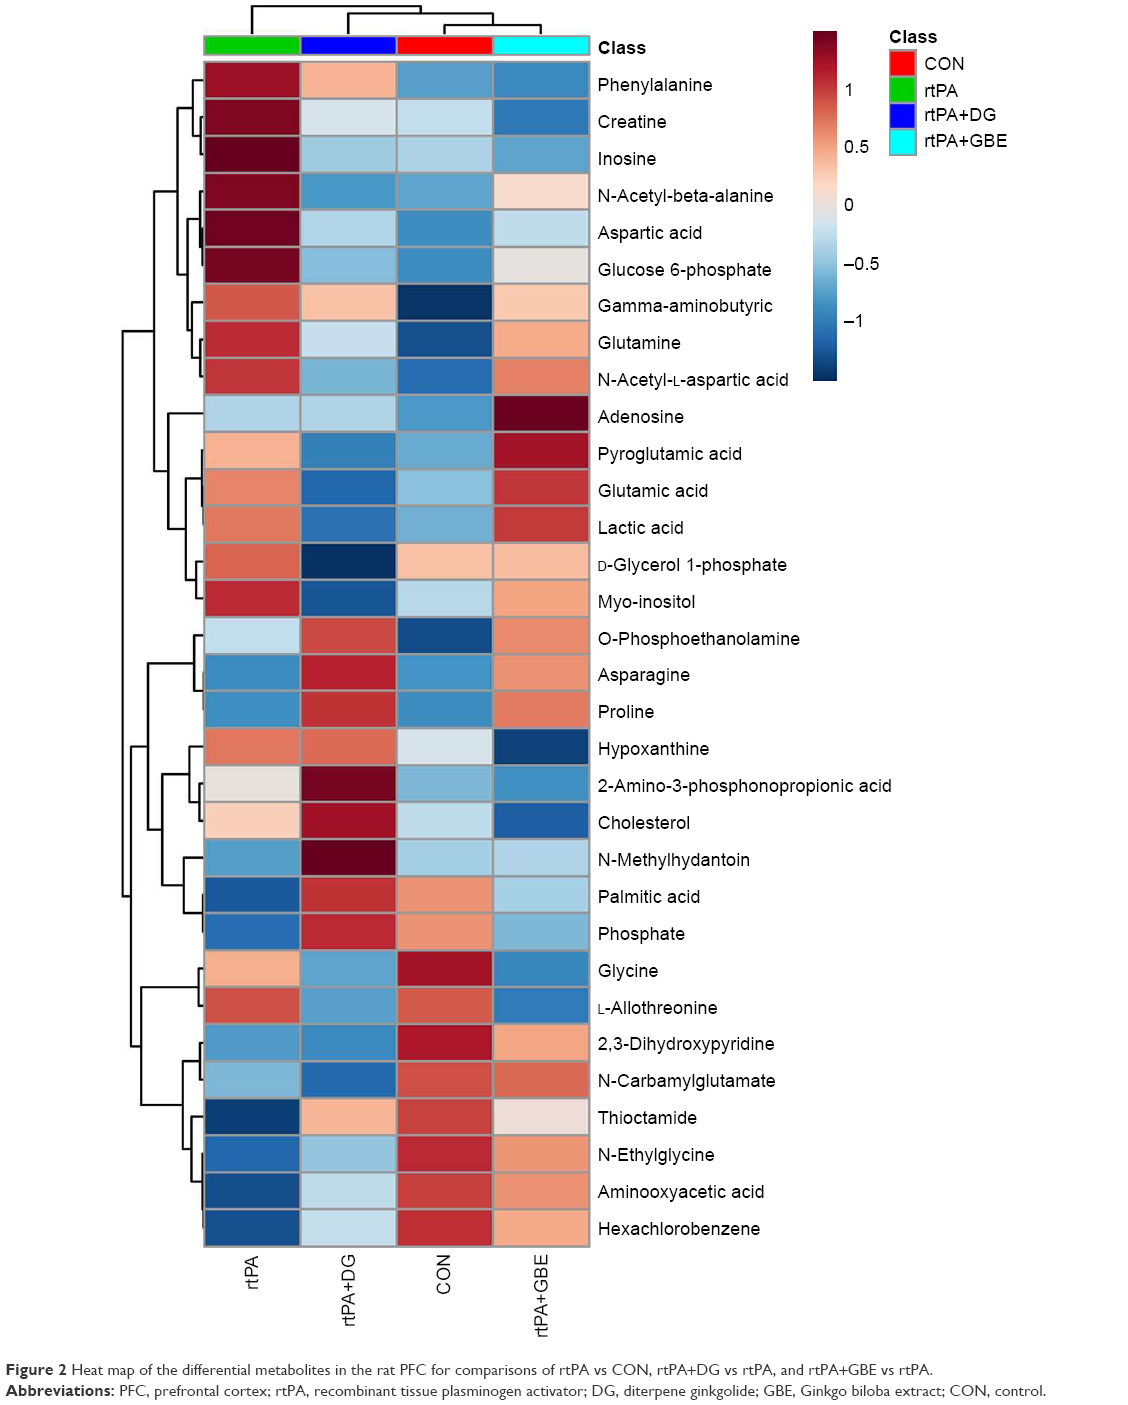 | Figure 2 Heat map of the differential metabolites in the rat PFC for comparisons of rtPA vs CON, rtPA+DG vs rtPA, and rtPA+GBE vs rtPA. |
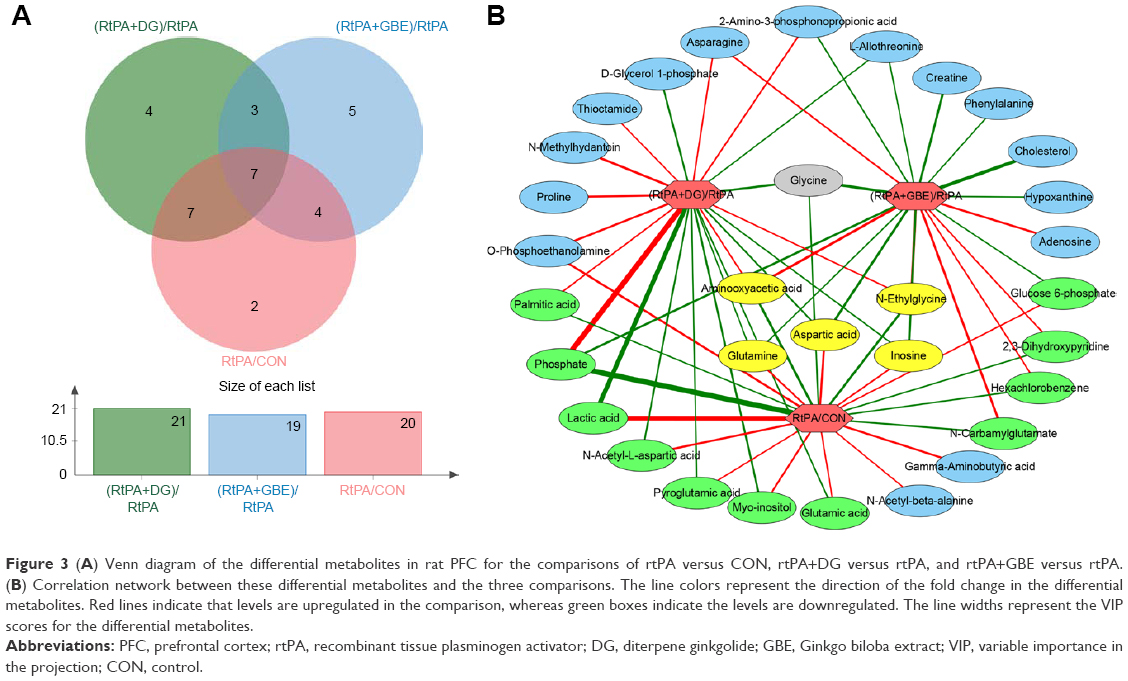 | Figure 3 (A) Venn diagram of the differential metabolites in rat PFC for the comparisons of rtPA versus CON, rtPA+DG versus rtPA, and rtPA+GBE versus rtPA. (B) Correlation network between these differential metabolites and the three comparisons. The line colors represent the direction of the fold change in the differential metabolites. Red lines indicate that levels are upregulated in the comparison, whereas green boxes indicate the levels are downregulated. The line widths represent the VIP scores for the differential metabolites. |
A total of 21 differential metabolites were identified between the rtPA+DG and rtPA groups. As compared with those in the rtPA group, 10 metabolites were upregulated, and 11 metabolites were downregulated in the PFC samples derived from the rtPA+DG group (Table 1; Figures 2 and 3). In comparing the rtPA+GBE and rtPA groups, 19 differential metabolites were identified. As compared with the PFC samples in the rtPA group, 10 metabolites were upregulated, and 11 metabolites were downregulated in samples from the rtPA+DG group (Table 1; Figures 2 and 3).
There were 14 overlapping differential metabolites in the comparison sets of (rtPA+DG)/rtPA and rtPA/CON, among which 12 exhibited changes in the opposite direction, whereas the changes in the levels of O-phosphoethanolamine and glycine were in the same direction (Figure 3A and B). We found 11 overlapping differential metabolites in the comparison sets of (rtPA+GBE)/rtPA and rtPA/CON, among which 9 exhibited changes in the opposite direction, whereas changes in the levels of phosphate and glycine were in the same direction (Figure 3A and B). Among these metabolites, the changes in the levels of five core differential metabolites (ie, aminooxyacetic acid, N-ethylglycine, aspartic acid, inosine, and glutamine) in the comparison sets of (rtPA+DG)/rtPA and (rtPA+GBE)/rtPA were in the opposite direction with respect to those in the comparison set of rtPA/CON (Figure 3B). Glycine was the only core differential metabolite that exhibited changes in the same direction across the three comparison sets (Figure 3B).
In order to evaluate the effects of DG and GBE, we also made two paired comparisons of rtPA+DG versus CON and rtPA+GBE versus CON. The pairwise PLS-DA score plots demonstrated clear discriminations (Figure 4). There were 20 differential metabolites found in the comparisons of rtPA+DG and CON (Table S1; Figure 5A), among which the changes of aminooxyacetic acid, glutamine, N-ethylglycine and phosphate in the comparison sets of (rtPA+DG)/CON and rtPA/CON exhibited opposite direction with respect to those in the comparison set of (rtPA+DG)/rtPA. The results indicated that DG could ameliorate the metabolic disturbances of aminooxyacetic acid, glutamine, N-ethylglycine, and phosphate caused by rtPA. There were 8 differential metabolites (lactic acid, inosine, glutamic acid, myo-inositol, NAA, aspartic acid, pyroglutamic acid, and palmitic acid) found both in the comparison sets of (rtPA+DG)/rtPA and rtPA/CON, but not in the comparison sets of (rtPA+DG)/CON. The results indicated that DG could revise the metabolic disturbances of the 8 differential metabolites caused by rtPA. Meanwhile, there were 17 differential metabolites found in the comparisons of rtPA+GBE and CON (Table S2; Figure 5B), among which GBE could ameliorate the metabolic disturbances of glutamine and revise the metabolic disturbances of the 8 differential metabolites (2,3-dihydroxypyridine, aminooxyacetic acid, N-carbamylglutamate, hexachlorobenzene, N-ethylglycine, glucose 6-phosphate, inosine, and aspartic acid) caused by rtPA.
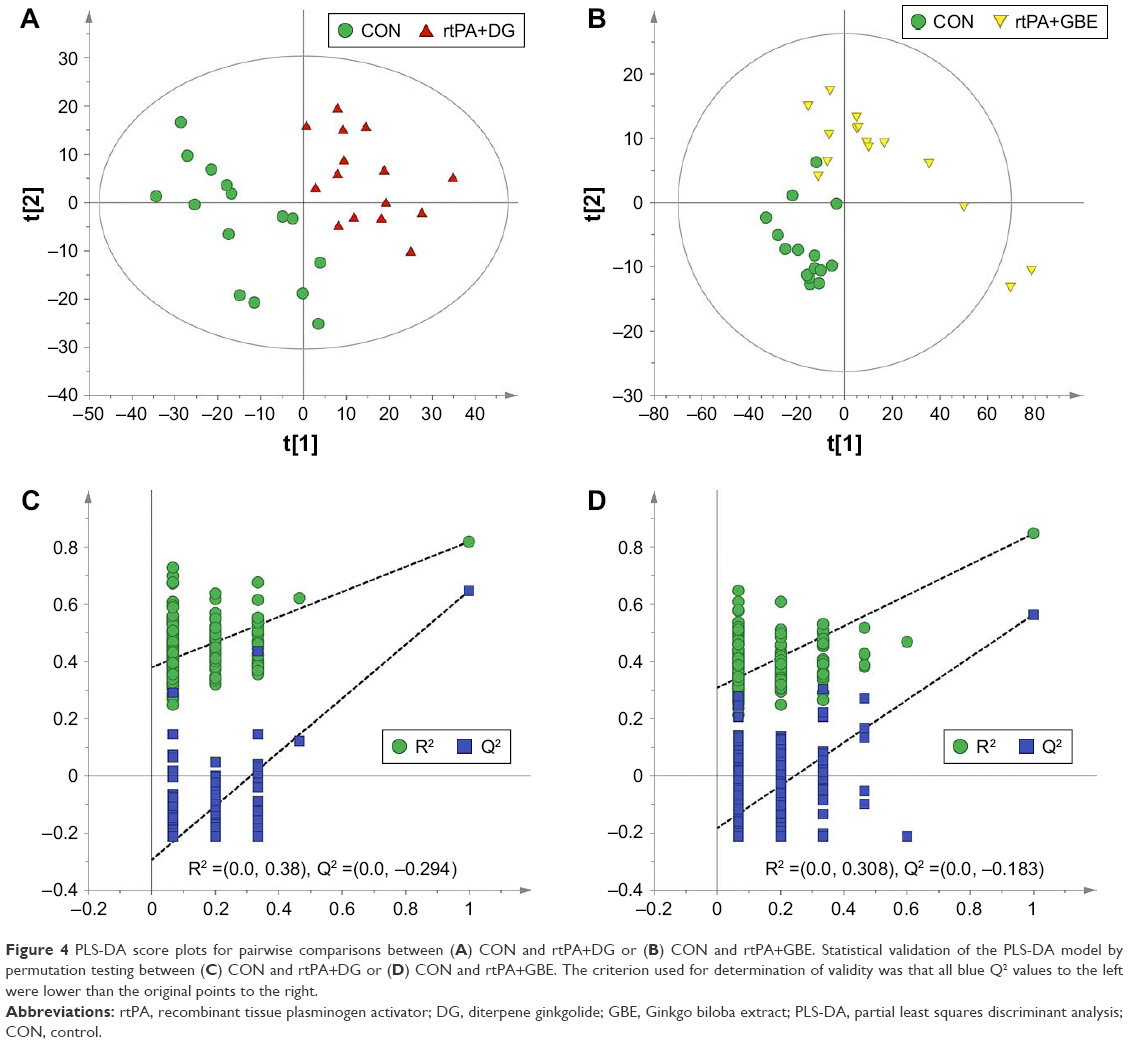 | Figure 4 PLS-DA score plots for pairwise comparisons between (A) CON and rtPA+DG or (B) CON and rtPA+GBE. Statistical validation of the PLS-DA model by permutation testing between (C) CON and rtPA+DG or (D) CON and rtPA+GBE. The criterion used for determination of validity was that all blue Q2 values to the left were lower than the original points to the right. |
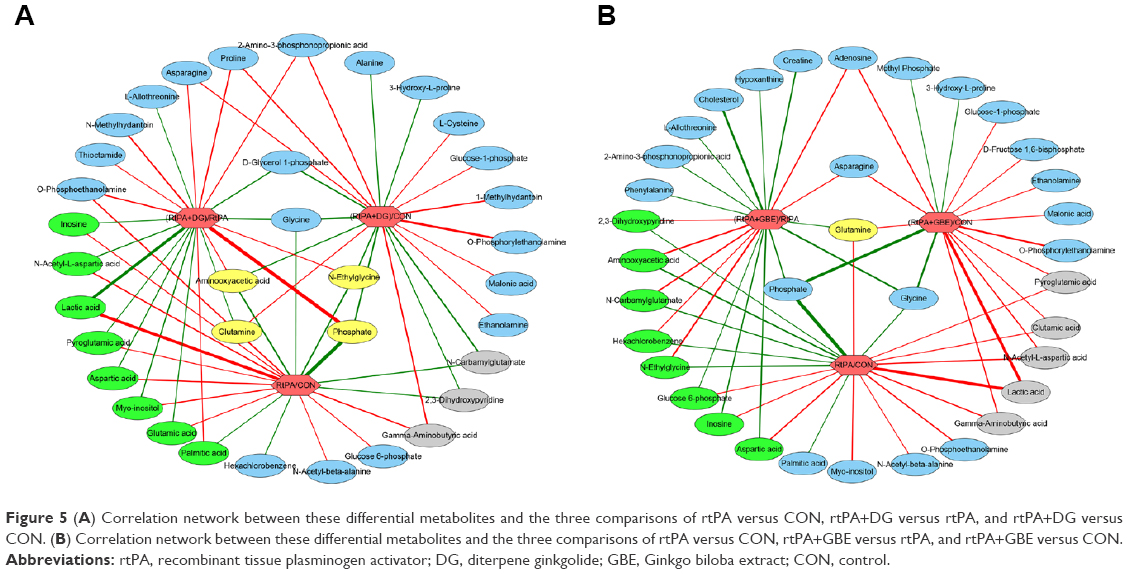 | Figure 5 (A) Correlation network between these differential metabolites and the three comparisons of rtPA versus CON, rtPA+DG versus rtPA, and rtPA+DG versus CON. (B) Correlation network between these differential metabolites and the three comparisons of rtPA versus CON, rtPA+GBE versus rtPA, and rtPA+GBE versus CON. |
MetaboAnalyst pathway analysis of the differential metabolites
MetaboAnalyst 3.0 was used to identify the affected metabolic pathways based on the Kyoto Encyclopedia of Genes and Genomes metabolic library. According to the criteria of a false discovery rate <0.05 and an impact value >0, the comparison of rtPA versus CON showed that the metabolomic alterations were enriched in the pathways of “alanine, aspartate, and glutamate metabolism,” “D-glutamine and D-glutamate metabolism,” and “arginine and proline metabolism” (Figure 6A). The results of the rtPA+DG versus rtPA comparison showed that the metabolomic alterations were also enriched in the same pathways (Figure 6B). By contrast, no affected metabolic pathway was found in the comparison of rtPA+GBE versus rtPA. These three pathways mainly consist of asparagine, aspartic acid, creatine, GABA, glutamic acid, glutamine, NAA, and proline. The relative intensities of the differential metabolites in the four groups are shown in Figure 6C, and the results indicated that DG ameliorated the rtPA-induced metabolic disturbances through the “alanine, aspartate and glutamate metabolism,” “D-glutamine and D-glutamate metabolism,” and “arginine and proline metabolism” pathways. We generated a schematic model depicting the potentially disturbed metabolic pathways based on the MetaboAnalyst analysis of the functional roles and pathways of all the differential metabolites detected among the three comparisons (Figure 7).
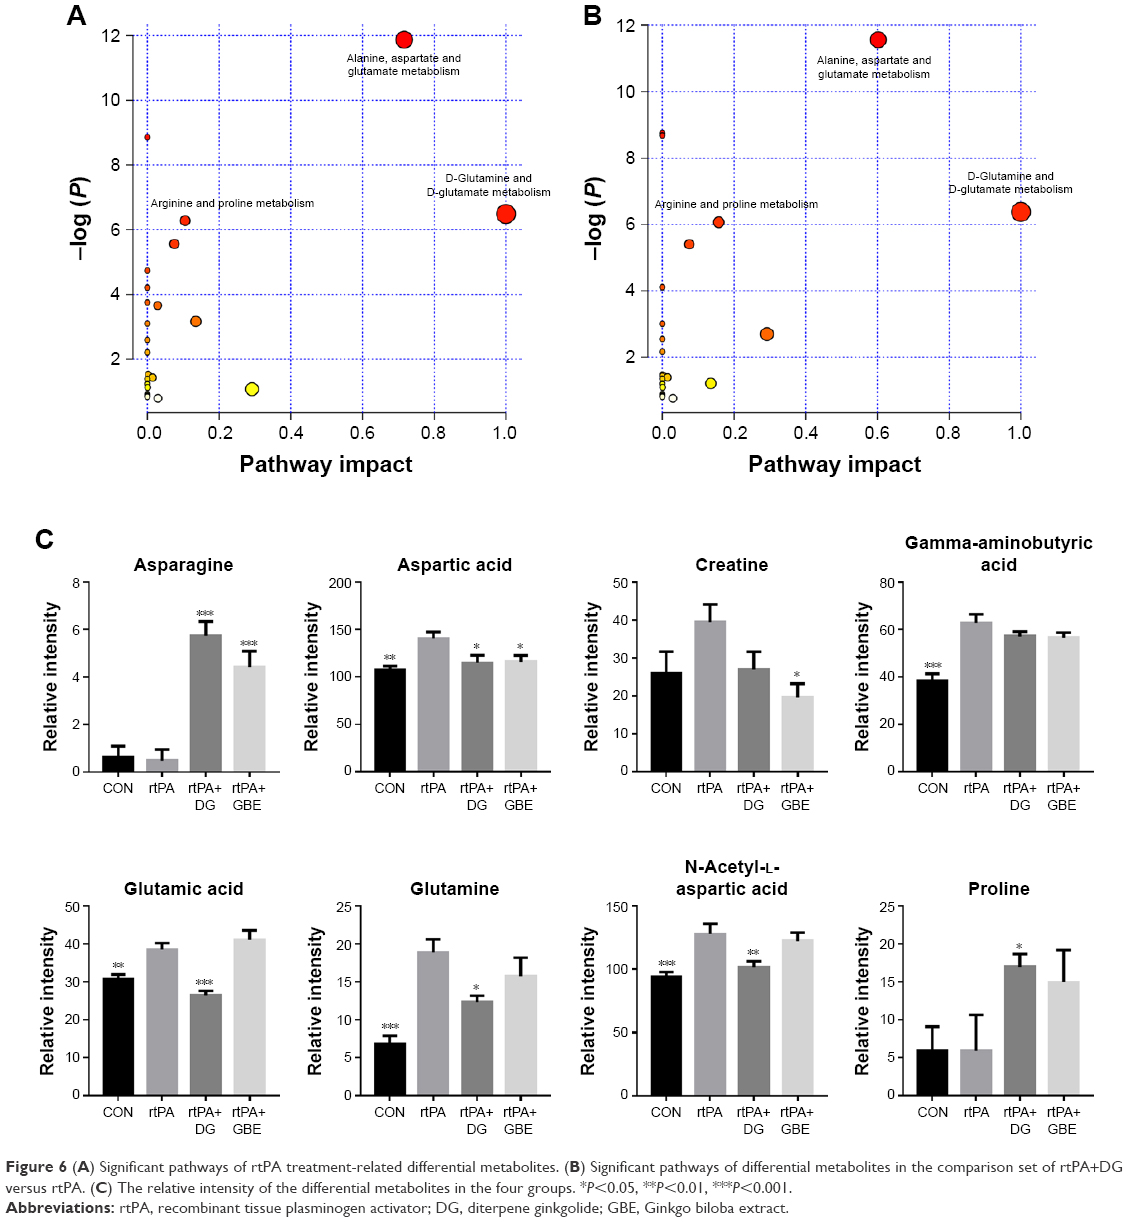 | Figure 6 (A) Significant pathways of rtPA treatment-related differential metabolites. (B) Significant pathways of differential metabolites in the comparison set of rtPA+DG versus rtPA. (C) The relative intensity of the differential metabolites in the four groups. *P<0.05, **P<0.01, ***P<0.001. |
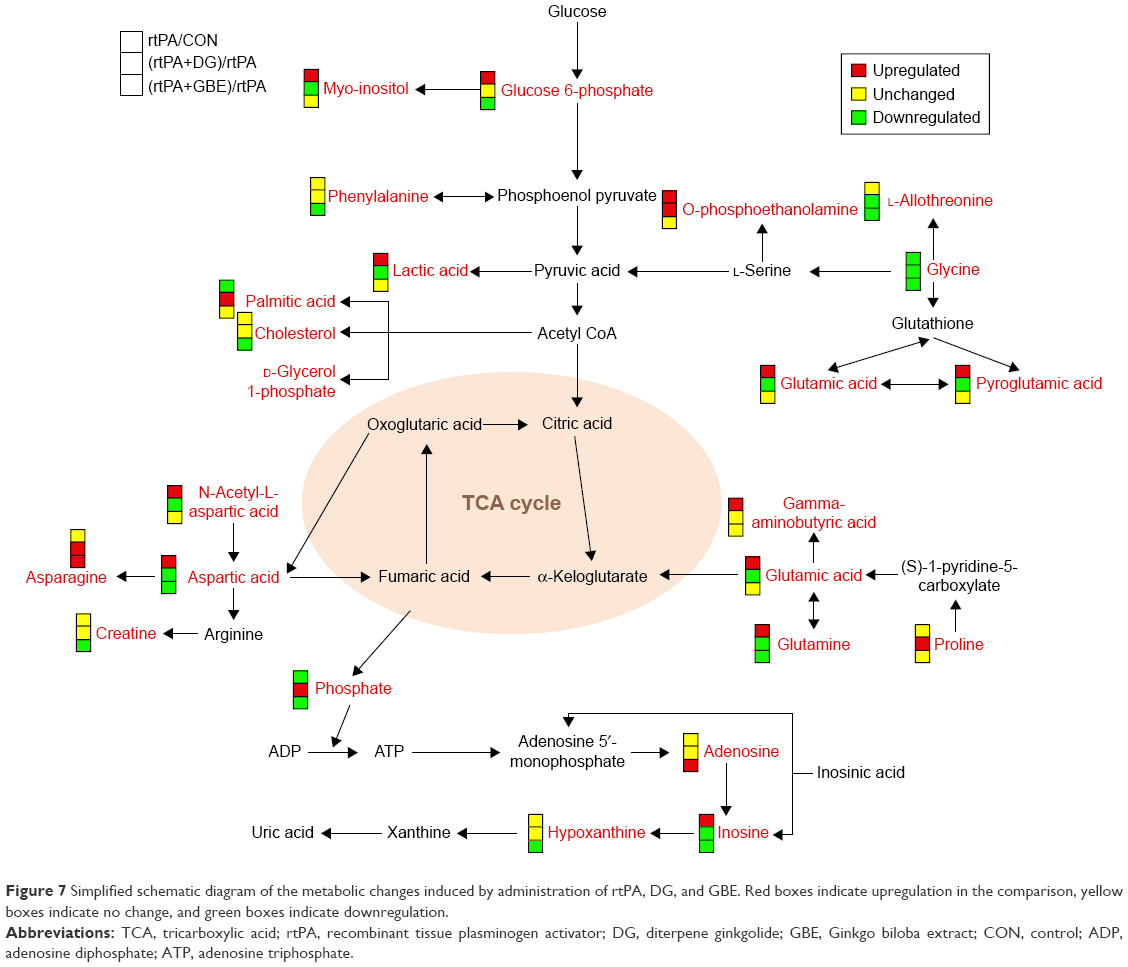 | Figure 7 Simplified schematic diagram of the metabolic changes induced by administration of rtPA, DG, and GBE. Red boxes indicate upregulation in the comparison, yellow boxes indicate no change, and green boxes indicate downregulation. |
Discussion
Previous studies have revealed that in addition to thrombolysis, rtPA administration may cause adverse neurological effects, which may lead to clinical exacerbation in stroke patients.3,31,36 Administration of rtPA can induce not only angioedema through blood–brain barrier disruption but also cytotoxic brain edema through excitotoxic neurotoxicity.37 Therefore, a detailed understanding of the specific neurotoxicity mechanisms for rtPA and strategies to prevent the toxicity induced by treatment with rtPA are needed. Because GBE and DG have been suggested to have many beneficial effects on CNS function and are widely used for the treatment of cerebral insufficiency and acute ischemic stroke,10,11 we hypothesized that combining GBE or DG with rtPA would increase the efficacy of rtPA and protect against rtPA-induced neurotoxicity in patients with ischemic stroke.
In this study, we used GC-MS metabolomic analyses to demonstrate, for the first time, that a single administration of rtPA led to metabolic disturbances in the rat PFC. We also used this analysis following administration of rtPA combined with GBE or DG and found that the metabolic signature of the PFC in the rtPA group was significantly distinguished from that in the CON, rtPA+DG, or rtPA+GBE groups. A total of 32 differential metabolites in rat PFC were altered among the three paired comparisons of rtPA versus CON, rtPA+DG versus rtPA, and rtPA+GBE versus rtPA. To develop a deeper insight into the underlying molecular mechanisms of rtPA, DG, and GBE, we conducted a functional analysis and determined that these identified 32 differential metabolites were primarily involved in 1) neurotransmitter metabolism, 2) amino acid metabolism, 3) energy metabolism, 4) lipid metabolism, and 5) nucleotide metabolism.
Neurotransmitter metabolism
The most significant alterations in the comparative metabolomic analysis of rtPA and CON were attributed to changes in neurotransmitter metabolism, primarily glutamate and aspartate metabolism. Our results showed that rtPA upregulated the production of glutamic acid, aspartic acid, NAA, GABA, and glutamine but downregulated the production of glycine. Although both DG and GBE ameliorated the upregulation of aspartic acid and glutamine, DG also ameliorated the upregulation of glutamic acid and NAA. Neither DG nor GBE ameliorated the rtPA-induced changes in GABA and glycine.
As excitatory amino acid neurotransmitters, glutamic acid and aspartic acid are known to be neurotoxic in cell culture38,39 and to cause local neuronal death.40,41 Glutamic acid can be converted into glutamine when catalyzed by glutamine synthetase.42 There is a direct evidence showing that glutamine induces mitochondrial permeability transition43 and production of free radicals44 in cultured astrocytes. GABA is the primary inhibitory neurotransmitter in the CNS. Disturbances in the GABA system have been linked to neuropsychiatric disorders, for instance, PFC-dependent working memory deficits,45 epilepsy,46 and schizophrenia.47
We also found reduced glycine levels in the rtPA/CON, rtPA+DG/rtPA, and rtPA+GBE/rtPA comparisons, indicating that both DG and GBE strengthened the rtPA-induced reduction of glycine levels. Glycine can markedly potentiate NMDA-mediated neurotoxicity.48,49 However, according to the IPA analysis, the changes in the overall differential metabolites of rtPA and CON lead to the activation of NMDA receptor (Figure 8). Although rtPA was used in combination with GBE, the treatment could still lead to less activation of NMDA receptor (Figure 9). It is worth noting that the treatment of rtPA combined with DG could lead to inhibition of NMDA receptor (Figure 10). Thus, based on our findings, both DG and GBE may exert the neuroprotective effect by reducing the activation of NMDA receptor caused by rtPA.
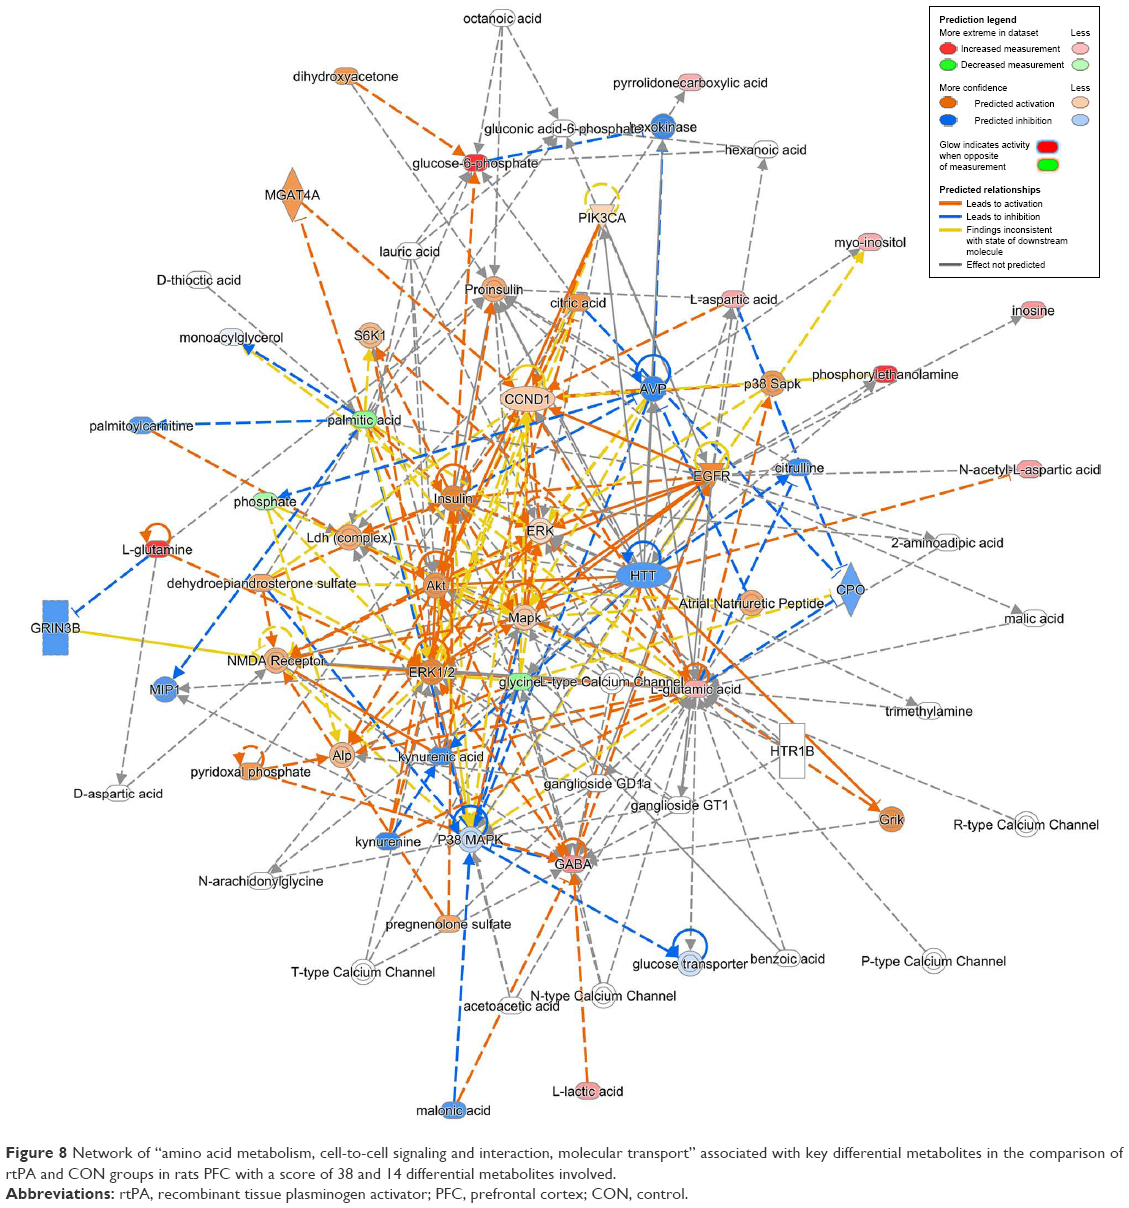 | Figure 8 Network of “amino acid metabolism, cell-to-cell signaling and interaction, molecular transport” associated with key differential metabolites in the comparison of rtPA and CON groups in rats PFC with a score of 38 and 14 differential metabolites involved. |
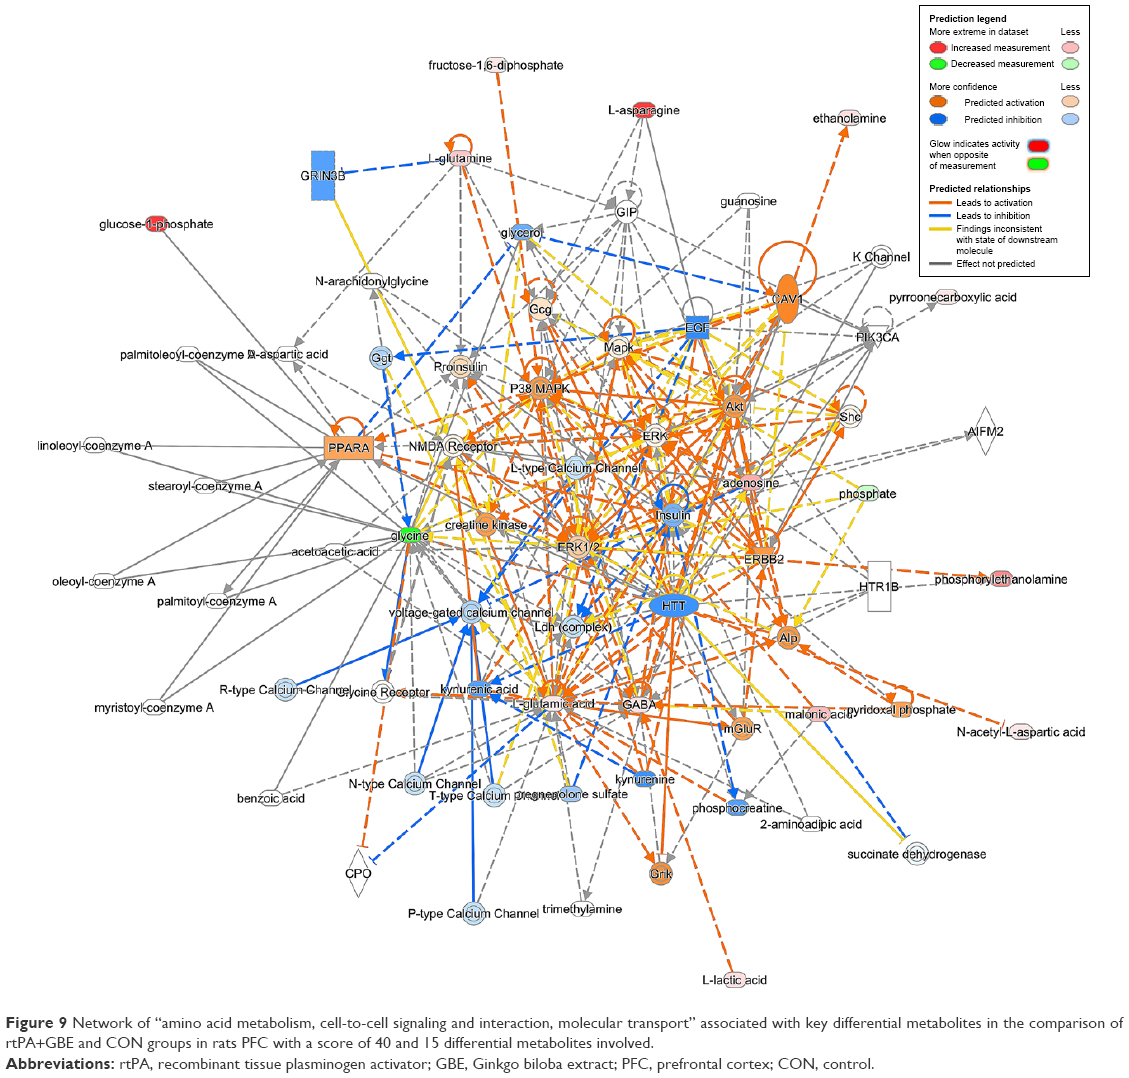 | Figure 9 Network of “amino acid metabolism, cell-to-cell signaling and interaction, molecular transport” associated with key differential metabolites in the comparison of rtPA+GBE and CON groups in rats PFC with a score of 40 and 15 differential metabolites involved. |
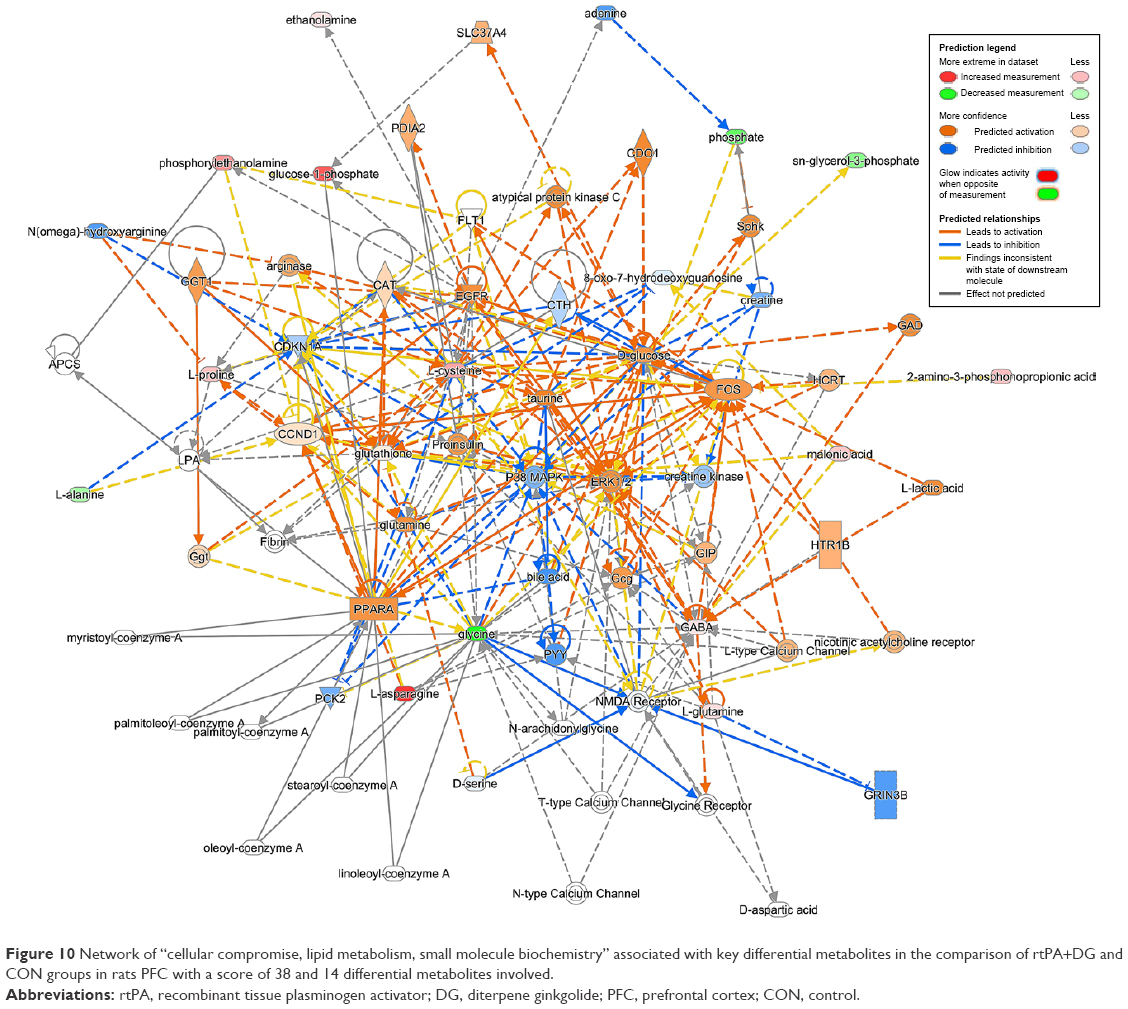 | Figure 10 Network of “cellular compromise, lipid metabolism, small molecule biochemistry” associated with key differential metabolites in the comparison of rtPA+DG and CON groups in rats PFC with a score of 38 and 14 differential metabolites involved. |
Based on our metabolomics results and pathway analysis, DG may exert its neuroprotective effects by reducing the excess production of glutamate and aspartate excitotoxicity and revising the activation of NMDA receptor induced by rtPA in the PFC of rats, while GBE may partially ameliorate the excitotoxicity induced by rtPA.
Amino acid metabolism
Our results demonstrated an elevation in N-acetyl-beta-alanine and pyroglutamic acid and a reduction in aminooxyacetic acid and N-carbamylglutamate levels in the rtPA group compared with those in the CON group. DG ameliorated the rtPA-induced upregulation of pyroglutamic acid and aminooxyacetic acid, whereas GBE ameliorated the downregulation of aminooxyacetic acid and N-carbamylglutamate. Aminooxyacetic acid, a core metabolite, has been reported to increase the level of GABA in rat brain by inhibiting 4-aminobutyrate aminotransferase activity.50 Aminooxyacetic acid also has anticonvulsant properties and can reduce focal cerebral ischemia injury.51,52 The schematic diagram (Figure 4) shows that while pyroglutamic acid is the downstream metabolite of glutathione, glycine is the upstream metabolite. Thus, the downregulation of glycine and the upregulation of pyroglutamic acid reflect the rtPA-induced disturbances in glutathione metabolism. We found that DG ameliorated the upregulation of pyroglutamic acid. Administration of rtPA downregulated N-carbamylglutamate, a drug derivative of N-acetylglutamate that activates the first enzyme in the urea cycle53 but has not been reported in the CNS. This downregulation was ameliorated by GBE.
Energy metabolism
Our results demonstrated a lactic acid level elevation in the rtPA versus CON group analysis and reduction in the rtPA+DG versus rtPA group comparison analysis. The accumulation of lactic acid has been implicated in the deaths of both neurons and glia.54 Thus, DG may protect normal cells against demise in the PFC. In the glycolysis pathway, glucose-6-phosphate and myo-inositol were found to be elevated in the rtPA versus CON group analysis. DG ameliorated the upregulation of myo-inositol and glucose-6-phosphate induced by rtPA. However, administration of rtPA or DG did not alter metabolites in the tricarboxylic acid (TCA) cycle. Thus, our results indicated that rtPA, DG, and GBE exert only limited influence on glycolysis and the TCA cycle.
Lipid metabolism
Four metabolites belonging to lipid metabolism (palmitic acid, O-phosphoethanolamine, cholesterol, and D-glycerol 1-phosphate) were differentially altered in the three paired comparisons. However, only palmitic acid and O-phosphoethanolamine were affected by the treatment with rtPA. Palmitic acid has been found to modify the cysteine residues of proteolipid protein (PLP) to form thioester linkages.55 Based on our findings, DG may restore the rtPA-induced reduced level of palmitic acid in the PFC, and this would facilitate the synthesis of PLP, which participates in the formation of myelin. We also found that DG enhanced the rtPA-induced increase in O-phosphoethanolamine in the PFC.
Nucleotide metabolism
Four metabolites belonging to nucleotide metabolism (phosphate, inosine, adenosine, and hypoxanthine) were differentially altered in the three paired comparisons. A reduction of inosine was observed in both the rtPA+DG/rtPA and rtPA+GBE/rtPA comparisons, but an increase was found in the rtPA/CON comparison. Inosine can inhibit platelet activation and reduce cerebral infarction.56,57 Here, the strengthening effects of thrombolysis caused by inosine may potentially become a target for reducing cerebral hemorrhage risk by using DG or GBE combined with rtPA. Phosphate is a critically important molecule in various reactions. Our results revealed that DG, but not GBE, restored the reduced level of phosphate caused by rtPA in the PFC. However, GBE upregulated the production of adenosine, which acts as a neuromodulator and a homeostatic modulator in the CNS.58
Others
There were six other metabolites (2,3-dihydroxypyridine, hexachlorobenzene, thioctamide, 2-amino-3-phosphonopropionic acid, N-methylhydantoin, and N-ethylglycine) among the three paired comparisons that were differentially altered, but these metabolites could not be definitively classified. Among these, our results demonstrated that N-ethylglycine was elevated by the rtPA administration and that this elevation was ameliorated by both DG and GBE. This metabolite reportedly shows antinociceptive effects in experimental inflammatory and neuropathic pain.
Based on the results of the above categories of functions analysis, the molecular mechanisms of rtPA, DG, and GBE mainly involved in neurotransmitter, amino acid, energy, lipid, and nucleotide metabolism. Neuroprotective effects of DG are mainly related to glutamate, aspartate, and nucleotide metabolism pathways and revising the activation of NMDA receptor induced by rtPA. However, the neuroprotective effects of GBE are only related to aspartate and nucleotide metabolism pathways. GBE may partially ameliorate the excitotoxicity induced by rtPA. GBE is a mixture of substances with many different physical and chemical properties. Numerous pharmacological investigations have led to the conclusion that DG is responsible for the major pharmacological neuroprotective effects. Our results also confirmed the conclusion that DG demonstrated better effects than GBE.
Limitations
There were several limitations in our study that should be acknowledged. Our experiments were conducted with male, normal, non-pathological rats to more clearly reveal the neurotoxicity of rtPA; however, the use of a rat model of ischemia may help us to better understand the neuroprotective effects of DG and GBE and to detect the thrombolytic effect of rtPA combined with DG or GBE and comparing male and female rats in future studies which would have helped to ascertain if there are gender differences in the effects of tPA, DG, and GBE. There were no analyses of a single dose of DG and GBE in this study. To better elaborate the neuroprotective mechanism of DG and GBE, additional metabolomic analysis should be employed in future studies. In addition, our experiments were conducted on samples derived from the PFC, but peripheral metabolic effects and primary cell experiments in vitro may help us to better understand the neurotoxicity of rtPA and the neuroprotective effects of DG and GBE.
Conclusion
Our comparative metabolomics results provided the novel finding that rtPA may cause metabolic disturbances in the PFC of adult rats. Both GBE and its constituent DGs effectively attenuated the rtPA-induced disturbances in neurotransmitter, amino acid, energy, lipid, and nucleotide metabolisms. Compared with GBE, DG better controlled the glutamate and aspartate excitotoxicity and the activation of NMDA receptor induced by rtPA. Through investigating the PFC metabolic profiles following a single administration of rtPA or of rtPA combined with DG or GBE, this study has offered important novel mechanistic insights into the adverse effects induced by rtPA and provided directions for future exploration on the thrombolytic effects of rtPA combined with DG or GBE in humans.
Acknowledgments
This work was supported by the National Basic Research Program of China (973 Program, grant no. 2009CB918300), National Key R&D Program of China (grant no. 2017YFA0505700), the National Natural Science Foundation of China (grant nos. 81371310, 81701360), the Natural Science Foundation of Inner Mongolia Autonomous Region of China (grant no. 2016MS0884), the Foundation Project of the Inner Mongolia Autonomous Region People’s Hospital (grant no. 201551), and the China Postdoctoral Science Foundation Funded Project (project no. 2015M570772).
Author contributions
All authors contributed toward data analysis, drafting and revising the paper and agree to be accountable for all aspects of the work.
Disclosure
The authors report no conflicts of interest in this work.
References
Emberson J, Lees KR, Lyden P, et al. Effect of treatment delay, age, and stroke severity on the effects of intravenous thrombolysis with alteplase for acute ischaemic stroke: a meta-analysis of individual patient data from randomised trials. Lancet. 2014;384(9958):1929–1935. | ||
Hacke W, Kaste M, Bluhmki E, et al. Thrombolysis with alteplase 3 to 4.5 hours after acute ischemic stroke. N Engl J Med. 2008;359(13):1317–1329. | ||
Dong MX, Hu QC, Shen P, et al. Recombinant tissue plasminogen activator induces neurological side effects independent on thrombolysis in mechanical animal models of focal cerebral infarction: a systematic review and meta-analysis. PLoS One. 2016;11(7):e0158848. | ||
Dong MX, Li CM, Shen P, et al. Recombinant tissue plasminogen activator induces long-term anxiety-like behaviors via the ERK1/2-GAD1-GABA cascade in the hippocampus of a rat model. Neuropharmacology. 2017;128:119. | ||
Pan C, Liu N, Zhang P, et al. EGb761 ameliorates neuronal apoptosis and promotes angiogenesis in experimental intracerebral hemorrhage via RSK1/GSK3beta pathway. Mol Neurobiol. 2018;55(2):1556–1567. | ||
Maclennan KM, Darlington CL, Smith PF. The CNS effects of Ginkgo biloba extracts and ginkgolide B. Prog Neurobiol. 2002;67(3):235–257. | ||
Snitz BE, O’Meara ES, Carlson MC, et al. Ginkgo biloba for preventing cognitive decline in older adults: a randomized trial. JAMA. 2009;302(24):2663–2670. | ||
Beek TAV. Ginkgolides and bilobalide: their physical, chromatographic and spectroscopic properties. Bioorg Med Chem. 2005;13(17):5001–5012. | ||
Prehn JH, Krieglstein J. Platelet-activating factor antagonists reduce excitotoxic damage in cultured neurons from embryonic chick telencephalon and protect the rat hippocampus and neocortex from ischemic injury in vivo. J Neurosci Res. 1993;34(2):179–188. | ||
Le Bars PL, Katz MM, Berman N, Itil TM, Freedman AM, Schatzberg AF. A placebo-controlled, double-blind, randomized trial of an extract of Ginkgo biloba for dementia. North American EGb Study Group. JAMA. 1997;278(16):1327–1332. | ||
Zeng X, Liu M, Yang Y, Li Y, Asplund K. Ginkgo biloba for acute ischaemic stroke. Cochrane Database Syst Rev. 2005;4:CD003691. | ||
Bai S, Zhang X, Chen Z, et al. Insight into the metabolic mechanism of Diterpene Ginkgolides on antidepressant effects for attenuating behavioural deficits compared with venlafaxine. Sci Rep. 2017;7(1):9591. | ||
Ma S, Liu X, Xu Q, Zhang X. Transport of ginkgolides with different lipophilicities based on an hCMEC/D3 cell monolayer as a blood-brain barrier cell model. Life Sci. 2014;114(2):93–101. | ||
Oberpichler H, Sauer D, Rossberg C, Mennel HD, Krieglstein J. PAF antagonist ginkgolide B reduces postischemic neuronal damage in rat brain hippocampus. J Cereb Blood Flow Metab. 1990;10(1):133–135. | ||
Liebgott T, Miollan M, Berchadsky Y, Drieu K, Culcasi M, Pietri S. Complementary cardioprotective effects of flavonoid metabolites and terpenoid constituents of Ginkgo biloba extract (EGb 761) during ischemia and reperfusion. Basic Res Cardiol. 2000;95(5):368–377. | ||
Liang Z, Bai S, Shen P, et al. GC-MS-based metabolomic study on the antidepressant-like effects of diterpene ginkgolides in mouse hippocampus. Behav Brain Res. 2016;314:116–124. | ||
Geng JL, Aa JY, Feng SQ, et al. Exploring the neuroprotective effects of Ginkgolides injection in a rodent model of cerebral ischemia-reperfusion injury by GC-MS based metabolomic profiling. J Pharm Biomed Anal. 2017;142:190. | ||
Kikuchi K, Tanaka E, Murai Y, Tancharoen S. Clinical trials in acute ischemic stroke. CNS Drugs. 2014;28(10):929–938. | ||
Lindon JC, Nicholson JK, Holmes E, et al. Contemporary issues in toxicology the role of metabonomics in toxicology and its evaluation by the COMET project. Toxicol Appl Pharmacol. 2003;187(3):137–146. | ||
Nicholson JK, Wilson ID. Understanding “global” systems biology: metabonomics and the continuum of metabolism. Nat Rev Drug Discov. 2003;2(8):668–676. | ||
Bai S, Zhou C, Cheng P, et al. 1H NMR-based metabolic profiling reveals the effects of fluoxetine on lipid and amino acid metabolism in astrocytes. Int J Mol Sci. 2015;16(4):8490–8504. | ||
Zheng P, Wang Y, Chen L, et al. Identification and validation of urinary metabolite biomarkers for major depressive disorder. Mol Cell Proteomics. 2013;12(1):207–214. | ||
Liu L, Zhou X, Zhang Y, et al. The identification of metabolic disturbances in the prefrontal cortex of the chronic restraint stress rat model of depression. Behav Brain Res. 2016;305:148–156. | ||
Chen G, Yang D, Yang Y, et al. Amino acid metabolic dysfunction revealed in the prefrontal cortex of a rat model of depression. Behav Brain Res. 2015;278:286–292. | ||
Gläscher J, Adolphs R, Damasio H, et al. Lesion mapping of cognitive control and value-based decision making in the prefrontal cortex. Proc Natl Acad Sci U S A. 2012;109(36):14681–14686. | ||
Warden MR, Selimbeyoglu A, Mirzabekov JJ, et al. A prefrontal cortex-brainstem neuronal projection that controls response to behavioural challenge. Nature. 2012;492(7429):428–432. | ||
Bai S, Hu Q, Chen Z, et al. Brain region-specific metabolite networks regulate antidepressant effects of venlafaxine. RSC Adv. 2017;7(73):46358–46369. | ||
Zheng P, Zeng B, Zhou C, et al. Gut microbiome remodeling induces depressive-like behaviors through a pathway mediated by the host’s metabolism. Mol Psychiatry. 2016;21(6):786–796. | ||
Clark JD, Gebhart GF, Gonder JC, Keeling ME, Kohn DF. The 1996 guide for the care and use of laboratory animals. ILAR J. 1997;38(1):41–48. | ||
Lapergue B, Dang BQ, Desilles JP, et al. High-density lipoprotein-based therapy reduces the hemorrhagic complications associated with tissue plasminogen activator treatment in experimental stroke. Stroke. 2013;44(3):699–707. | ||
Zuo W, Chen J, Zhang S, et al. IMM-H004 prevents toxicity induced by delayed treatment of tPA in a rat model of focal cerebral ischemia involving PKA-and PI3K-dependent Akt activation. Eur J Neurosci. 2014;39(12):2107. | ||
Wang Y, Pei DS, Ji HX, Xing SH. Protective effect of a standardized Ginkgo extract (ginaton) on renal ischemia/reperfusion injury via suppressing the activation of JNK signal pathway. Phytomedicine. 2008;15(11):923–931. | ||
Li J, Tang G, Cheng K, et al. Peripheral blood mononuclear cell-based metabolomic profiling of a chronic unpredictable mild stress rat model of depression. Mol Biosyst. 2014;10(11):2994–3001. | ||
Luedemann A, Strassburg K, Erban A, Kopka J. TagFinder for the quantitative analysis of gas chromatography–mass spectrometry (GC-MS)-based metabolite profiling experiments. Bioinformatics. 2008;24(5):732–737. | ||
Xia J, Wishart DS. Using MetaboAnalyst 3.0 for comprehensive metabolomics data analysis. Curr Protoc Bioinformatics. 2016;55:14 10 11-14 10 91. | ||
Yepes M, Sandkvist M, Moore EG, Bugge TH, Strickland DK, Lawrence DA. Tissue-type plasminogen activator induces opening of the blood-brain barrier via the LDL receptor-related protein. J Clin Invest. 2003;112(10):1533–1540. | ||
Yepes M, Roussel BD, Ali C, Vivien D. Tissue-type plasminogen activator in the ischemic brain: more than a thrombolytic. Trends Neurosci. 2009;32(1):48–55. | ||
Rothman SM, Olney JW. Glutamate and the pathophysiology of hypoxic–ischemic brain damage. Ann Neurol. 1986;19(2):105–111. | ||
Lau A, Tymianski M. Glutamate receptors, neurotoxicity and neurodegeneration. Pflügers Arch. 2010;460(2):525–542. | ||
Olney JW. Neurotoxicity of excitatory amino acids. Kainic Acid As A Tool in Neurobiology. 1978:95–121. | ||
Mangano RM, Schwarcz R. Chronic infusion of endogenous excitatory amino acids into rat striatum and hippocampus. Brain Res Bull. 1983;10(1):47–51. | ||
Albrecht J, Norenberg MD. Glutamine: a Trojan horse in ammonia neurotoxicity. Hepatology. 2006;44(4):788–794. | ||
Rao KR, Jayakumar A, Norenberg M. Induction of the mitochondrial permeability transition in cultured astrocytes by glutamine. Neurochem Int. 2003;43(4):517–523. | ||
Jayakumar AR, Rama Rao K, Schousboe A, Norenberg MD. Glutamine-induced free radical production in cultured astrocytes. Glia. 2004;46(3):296–301. | ||
McQuail JA, Frazier CJ, Bizon JL. Molecular aspects of age-related cognitive decline: the role of GABA signaling. Trends Mol Med. 2015;21(7):450–460. | ||
Bradford H. Glutamate, GABA and epilepsy. Prog Neurobiol. 1995;47(6):477–511. | ||
Taylor SF, Tso IF. GABA abnormalities in schizophrenia: a methodological review of in vivo studies. Schizophr Res. 2015;167(1–3):84–90. | ||
McNamara D, Dingledine R. Dual effect of glycine on NMDA-induced neurotoxicity in rat cortical cultures. J Neurosci. 1990;10(12):3970–3976. | ||
Patel J, Zinkand WC, Thompson C, Keith R, Salama A. Role of glycine in the N-methyl-d-aspartate-mediated neuronal cytotoxicity. J Neurochem. 1990;54(3):849–854. | ||
Carmona E, Gomes C, Trolin G. Effect of aminooxyacetic acid (AOAA) on GABA levels in some parts of the rat brain. Naunyn Schmiedebergs Arch Pharmacol. 1980;312(1):51–55. | ||
Davanzo JP, Greig ME, Cronin MA. Anticonvulsant properties of amino-oxyacetic acid. Am J Physiol. 1961;201:833–837. | ||
Li G-F, Zhang J-X, Luo H-K, et al. Effect of aminooxyacetic acid on focal cerebral ischemia injury in rats. Chin J Anesthesiol. 2011;31(8):984–986. | ||
Daniotti M, La MG, Fiorini P, Filippi L. New developments in the treatment of hyperammonemia: emerging use of carglumic acid. Int J Gen Med. 2011;4:21–28. | ||
Nedergaard M, Goldman SA, Desai S, Pulsinelli WA. Acid-induced death in neurons and glia. J Neurosci. 1991;11(8):2489–2497. | ||
Weimbs T, Stoffel W. Proteolipid protein (PLP) of CNS myelin: positions of free, disulfide-bonded, and fatty acid thioester-linked cysteine residues and implications for the membrane topology of PLP. Biochemistry. 1992;31(49):12289–12296. | ||
Hsiao G, Lin KH, Chang Y, et al. Protective mechanisms of inosine in platelet activation and cerebral ischemic damage. Arterioscler Thromb Vasc Biol. 2005;25(9):1998–2004. | ||
Shen H, Chen G-J, Harvey BK, Bickford PC, Wang Y. Inosine reduces ischemic brain injury in rats. Stroke. 2005;36(3):654–659. | ||
Gomes CV, Kaster MP, Tomé AR, Agostinho PM, Cunha RA. Adenosine receptors and brain diseases: neuroprotection and neurodegeneration. Biochim Biophys Acta. 2011;1808(5):1380–1399. |
Supplementary materials
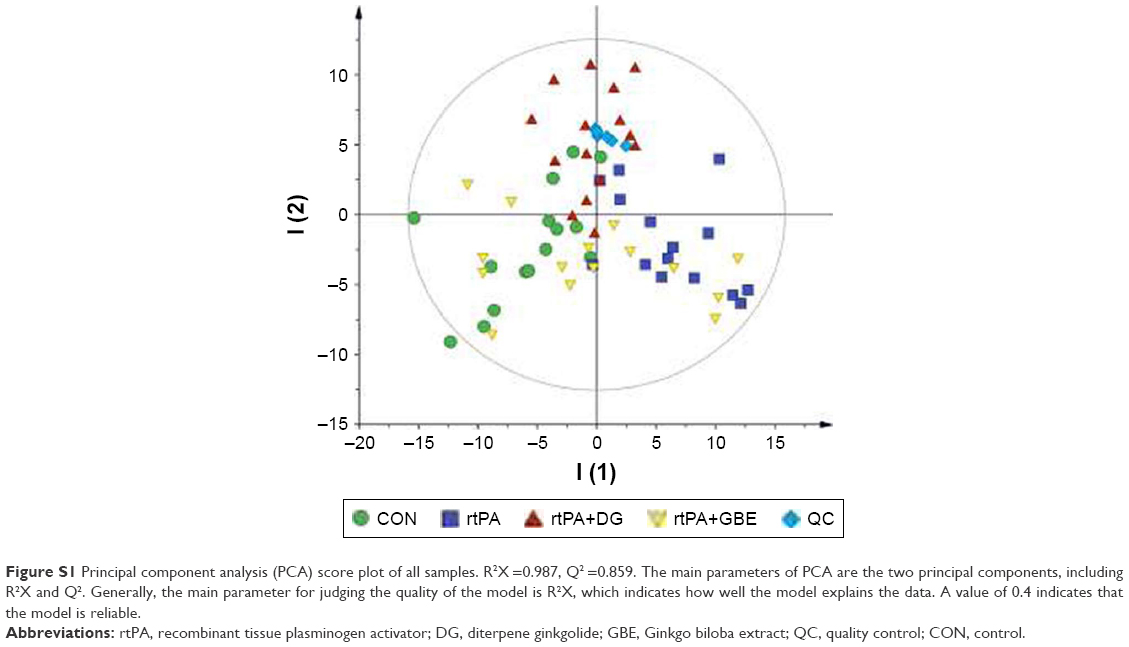 | Figure S1 Principal component analysis (PCA) score plot of all samples. R2X =0.987, Q2 =0.859. The main parameters of PCA are the two principal components, including R2X and Q2. Generally, the main parameter for judging the quality of the model is R2X, which indicates how well the model explains the data. A value of 0.4 indicates that the model is reliable. |
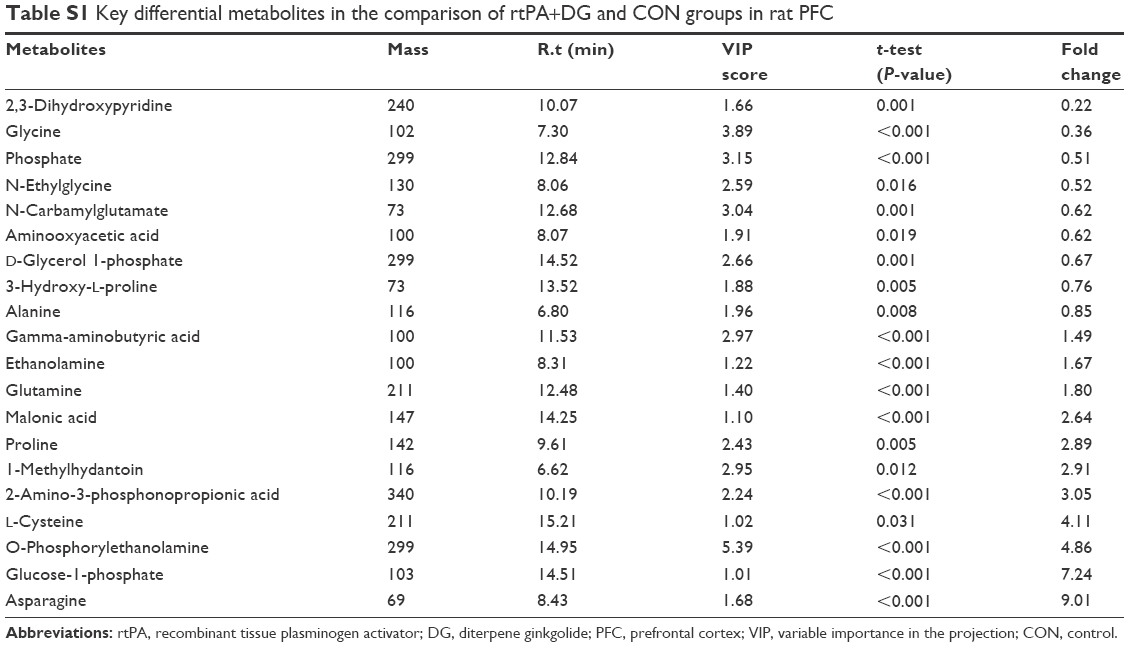 | Table S1 Key differential metabolites in the comparison of rtPA+DG and CON groups in rat PFC |
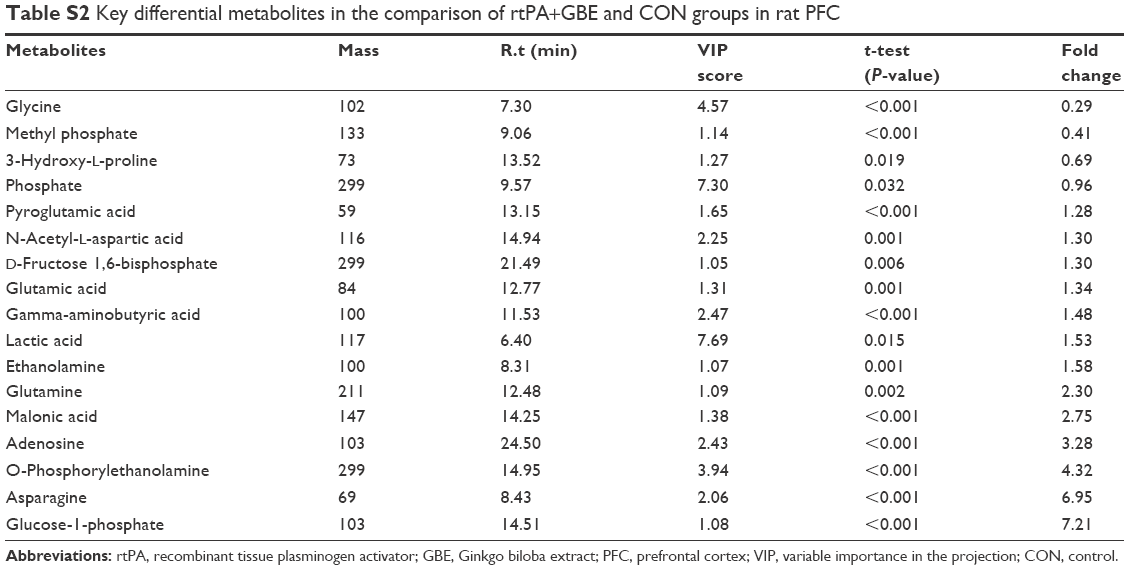 | Table S2 Key differential metabolites in the comparison of rtPA+GBE and CON groups in rat PFC |
 © 2018 The Author(s). This work is published and licensed by Dove Medical Press Limited. The full terms of this license are available at https://www.dovepress.com/terms.php and incorporate the Creative Commons Attribution - Non Commercial (unported, v3.0) License.
By accessing the work you hereby accept the Terms. Non-commercial uses of the work are permitted without any further permission from Dove Medical Press Limited, provided the work is properly attributed. For permission for commercial use of this work, please see paragraphs 4.2 and 5 of our Terms.
© 2018 The Author(s). This work is published and licensed by Dove Medical Press Limited. The full terms of this license are available at https://www.dovepress.com/terms.php and incorporate the Creative Commons Attribution - Non Commercial (unported, v3.0) License.
By accessing the work you hereby accept the Terms. Non-commercial uses of the work are permitted without any further permission from Dove Medical Press Limited, provided the work is properly attributed. For permission for commercial use of this work, please see paragraphs 4.2 and 5 of our Terms.