")
Back to Journals » International Journal of Chronic Obstructive Pulmonary Disease » Volume 15
Geographical Disparity and Associated Factors of COPD Prevalence in China: A Spatial Analysis of National Cross-Sectional Study
Authors Wang N , Cong S, Fan J, Bao H, Wang B, Yang T, Feng Y, Liu Y , Wang L, Wang C, Hu W , Fang L
Received 9 October 2019
Accepted for publication 16 January 2020
Published 13 February 2020 Volume 2020:15 Pages 367—377
DOI https://doi.org/10.2147/COPD.S234042
Checked for plagiarism Yes
Review by Single anonymous peer review
Peer reviewer comments 3
Editor who approved publication: Dr Chunxue Bai
Ning Wang,1,2 Shu Cong,1 Jing Fan,1 Heling Bao,1 Baohua Wang,1 Ting Yang,3 Yajing Feng,1 Yang Liu,4 Linhong Wang,1 Chen Wang,3,5 Wenbiao Hu,2 Liwen Fang1
1National Center for Chronic Non-Communicable Disease Control and Prevention, Chinese Center for Disease Control and Prevention, Beijing 100050, People’s Republic of China; 2School of Public Health and Social Work, Institute of Health and Biomedical Innovation, Queensland University of Technology, Brisbane, QLD 4059, Australia; 3Center of Respiratory Medicine, China–Japan Friendship Hospital, Beijing, People’s Republic of China; 4Department of Environmental Health, Rollins School of Public Health, Emory University, Atlanta, GA, USA; 5Chinese Academy of Medical Sciences and Peking Union Medical College, Beijing, People’s Republic of China
Correspondence: Liwen Fang
National Center for Chronic Non-Communicable Disease Control and Prevention, Chinese Center for Disease Control and Prevention, 27 Nanwei Road, Xicheng District, Beijing 100050, People’s Republic of China
Tel +86 135 5239 3376
Fax +86 010 6304 2350
Email [email protected]
Wenbiao Hu
School of Public Health and Social Work, Institute of Health and Biomedical Innovation, Queensland University of Technology, Brisbane, Queensland 4059, Australia
Tel/Fax +61 7 3138 5724
Email [email protected]
Purpose: COPD prevalence has rapidly increased in China, but the geographical disparities in COPD prevalence remain largely unknown. This study aimed to assess city-level disparities in COPD prevalence and identify the relative importance of COPD related risk factors in mainland China.
Patients and Methods: A nationwide cross-sectional study of COPD recruited 66,752 adults across the mainland China between 2014 and 2015. Patients with COPD were ascertained by a post-bronchodilator pulmonary function test. We estimated the city-specific prevalence of COPD by spatial kriging interpolation method. We detected spatial clusters with a significantly higher prevalence of COPD by spatial scan statistics. We determined the relative importance of COPD associated risk factors by a nonparametric and nonlinear classification and regression tree (CART) model.
Results: The three spatial clusters with the highest prevalence of COPD were located in parts of Sichuan, Gansu, and Shaanxi, etc. (relative risks (RRs)) ranging from 1.55 (95% CI 1.55– 1.56) to 1.33 (95% CI 1.33– 1.33)). CART showed that advanced age (≥ 60 years) was the most important factor associated with COPD in the overall population, followed by smoking. We estimated that there were about 28.5 million potentially avoidable cases of COPD among people aged 40 or older if they never smoked. PM2.5 was an important associated risk factor for COPD in the north, northeast, and southwest of China. After adjusting for age and smoking, the spatial cluster with the highest prevalence shifted to most of Sichuan, Gansu, Qinghai, and Ningxia, etc. (RR 1.65 (95% CI 1.63– 1.67)).
Conclusion: The spatial clusters of COPD at the city level and regionally varied important risk factors for COPD would help develop tailored interventions for COPD in China. After adjusting for the main risk factors, the spatial clusters of COPD shifted, indicating that there would be other potential risk factors for the remaining clusters which call for further studies.
Keywords: COPD, spatial clusters, kriging, classification and regression tree
Introduction
COPD is the third leading cause of mortality in China. The mortality rate of COPD was 68 per 100,000 population in 2017.1 Two recent investigations in mainland China reported that the prevalence of COPD among adults aged 40 or older was 13.6–13.7%,2,3 which increased by 66–67% compared with 10 years ago.4
To reduce the burden of morbidity and mortality from COPD, a better understanding of where has higher COPD prevalence is urgently needed. Our prior work has found that the prevalence of COPD in the southwest of China was the highest among seven subnational regions.2 However, given the vast territory of China, it is of great significance to characterize the geographical disparities in the prevalence of COPD at a much finer spatial resolution such as the city level and identify spatial clusters with significantly elevated COPD prevalence. These will greatly facilitate the government to precisely determine priority intervention areas. The higher prevalence of COPD may be attributed to a variety of local risk factors. A better knowledge of which risk factors play a more important role in different geographic regions would help health authorities implement tailored intervention strategies. Furthermore, after adjusting for the major known risk factors for COPD, the remaining spatial clusters would provide clues for other local underlying factors, which encourage further in-depth investigations. However, these spatial clusters with a higher prevalence of COPD before or after adjusting for the major risk factors have not been detected in mainland China to date.
To identify the major risk factors for COPD among the overall population and among populations in different regions, an analytic technique that is able to determine the relative importance of risk factors by comprehensively considering high-order interactions between them is required, because in reality, multiple factors tend to be present in the same person simultaneously. The classification and regression tree model (CART), one of the machine learning method, is able to deal with this.5,6 To our knowledge, the CART model has not been employed to investigate the risk factors for COPD in mainland China so far.
We used the data from a population-based nationwide cross-sectional study of COPD in mainland China to 1) estimate the distribution of COPD prevalence at city level and detect spatial clusters with high COPD prevalence; 2) identify the relative importance of COPD related risk factors among the overall population and among populations in different regions; and 3) detect the remaining spatial clusters after adjusting for the main COPD-related risk factors.
Methods
Participants and Study Design
Between December 2014 and December 2015, a sample of adults aged 40 or older was recruited based on the integrated National Disease Surveillance Point (DSP) System with national representativeness. The DSP system included 605 DSPs (counties/districts) across mainland China, covering 24% of the entire national population.7 From the DSPs, we used the probability sampling to extract 125 counties/districts (Figure 1) which distributed in all 31 provinces, autonomous regions, and municipalities. Then, we selected 600 individuals from each of the 125 counties/districts by 5-stage complex probability sampling. Detailed sampling methods were described in our prior papers.2,8
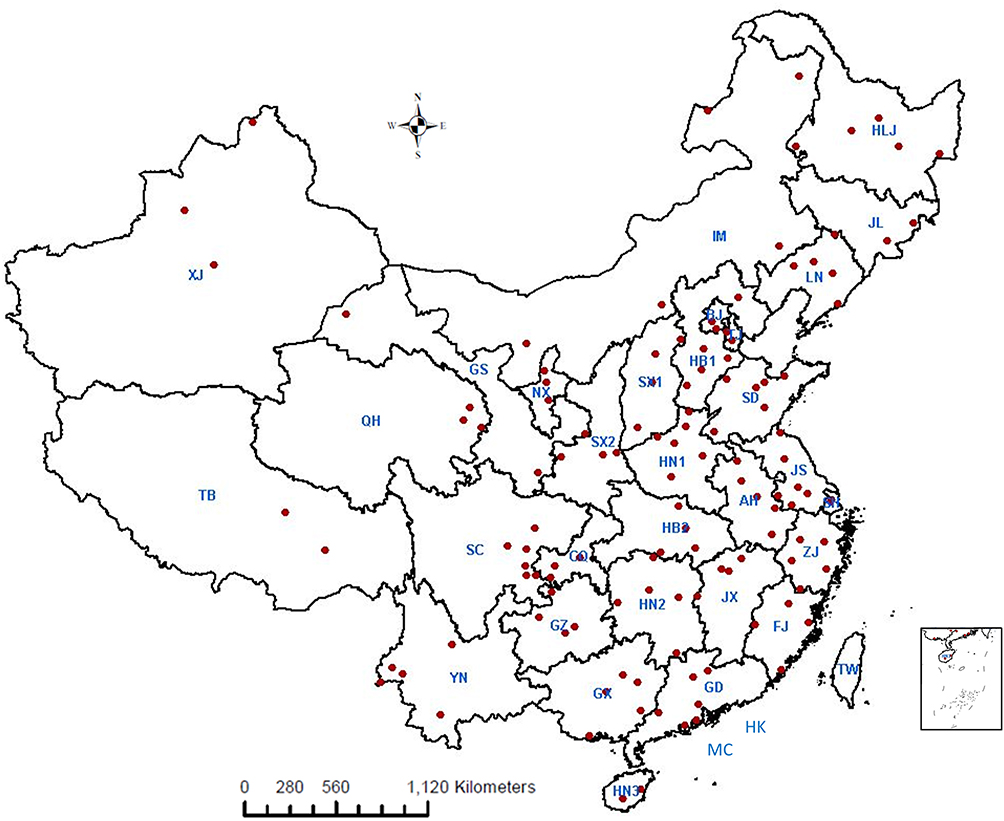 |
Figure 1 Locations of counties/districts involved in the study*. *East region: AH=Anhui, SH=Shanghai, JS=Jiangsu, ZJ=Zhejiang, FJ=Fujian, JX=Jiangxi, SD=Shandong; Middle region: HN1=Henan, HB2=Hubei, HN2=Hunan; North region: BJ=Beijing, TJ=Tianjin, SX1=Shanxi, HB1=Hebei, IM=Inner Mongolia; Northeast region: HLJ=Heilongjiang, JL=Jilin, LN=Liaoning; Northwest region: SX2=Shaanxi, GS=Gansu, QH=Qinghai, NX=Ningxia, XJ=Xinjiang; South region: GD=Guangdong, GX=Guangxi, HN3=Hainan; Southwest region: CQ=Chongqing, SC=Sichuan, GZ=Guizhou, YN=Yunnan, TB=Tibet; HK=Hong Kong; MC=Macau; TW=Taiwan. |
A total of 77,974 adults who had been living in the current address for at least 6 months in the year before the survey (permanent residents) were invited to participate. Individuals who were not able to be interviewed or did not provide informed consent were excluded.2 At last, we interviewed 75,107 adults. The overall response rate was 96.3%.2
The study protocol was approved by the Ethical Review Committee of the National Center for Chronic and Non-communicable Disease Control and Prevention, Chinese Center for Diseases Control and Prevention (No. 201410). The written informed consents were obtained from all participants.
Procedures
Trained interviewers interviewed individuals using a questionnaire on the tablet to collect data on demographic characteristics, COPD associated risk factors, medical history, and family history of respiratory diseases. Specifically, COPD associated risk factors included smoking history, exposure to second-hand smoking, hospital admission for severe pulmonary disease in childhood, smokers living at home in childhood, indoor exposure to biomass, indoor exposure to coal fuel, and exposure to dust or chemicals in the workplace. Medical history was defined as the diagnosis made by township hospitals or above. Other definitions can be found in our prior paper.2
We obtained the mean concentration of ambient PM2.5 for each of 125 counties/districts between 2004 and 2013 from satellite-driven data.9 We assumed that the participants living in the same county/district had the same level of ambient PM2.5 exposure.
Trained and qualified staff operated the pulmonary function tests on all eligible participants using the MasterScreen Pneumo spirometers (Jaeger, Germany) after the questionnaire interview. Both pre- and post-bronchodilator (15 mins after administration of 400 μg salbutamol) forced vital capacity (FVC) and forces expiratory volume in 1 s (FEV1) were obtained according to the recommendations by the American Thoracic Society.10 All results were graded as A, B, C, D, and F based on acceptable operation and repeatability of FVC and FEV1. Grades of A, B, and C were regarded as acceptable for analyses. We defined COPD by a post-bronchodilator FEV1/FVC <70% as per the recommendation of the 2018 Global Initiative for Chronic Obstructive Lung Disease (GOLD).11
All collected data were uploaded to a data management system in real time and were assessed by reviewers and experienced clinicians within 24 h after the investigation. For those that did not meet the quality requirements, re-interviews or re-pulmonary function tests were requested.
Statistical Analysis
The data were weighted to the study sampling scheme and non-response to represent the general population aged 40 or older in mainland China.2 We used t-test for continuous variables and Chi-square test for categorical variables to compare the characteristics of individuals with and without COPD. We used “survey” package in R (version 3.4.2). All p values were two-sided and a p-value of less than 0.05 was viewed as statistically significant.
We employed the CART model to produce a classification tree to identify the relative importance and thresholds of COPD-related risk factors and detect adults with the highest risk of developing COPD. The CART model uses recursive partitioning strategies to produce a classification tree comprised of progressive binary splits. It segments participants into subgroups that are most different regarding the dependent variable. The model examines all independent variables and all values of independent variables to select the optimal explanatory variables and the optimal splits based on impurity criterion. The most important independent variable associated with the dependent variable is selected first by the model to split participants into two branches. Within each of these two branches, the partitioning continues and the tree grows by examining the remaining independent variables to identify the variable that leads to the best split. The CART model is able to deal with the high-order interactions among multiple independent variables. It is a nonparametric statistical method that does not request assumptions about the distribution of the data.5,6,12 The factors significantly associated with COPD in univariate analysis (Table 1) and ambient PM2.5 (in the light of significant association between ambient PM2.5 and COPD reported by recent studies3) were put in the CART model. We calculated the weighted prevalence of COPD for each node in the classification tree and the odds ratio (OR) and 95% confidence interval (95% CI) of each identified variable under survey design. We limited the depth of the classification tree based on the statistical significance of the OR of each identified variable. We used “rpart” package in R (version 3.4.2).
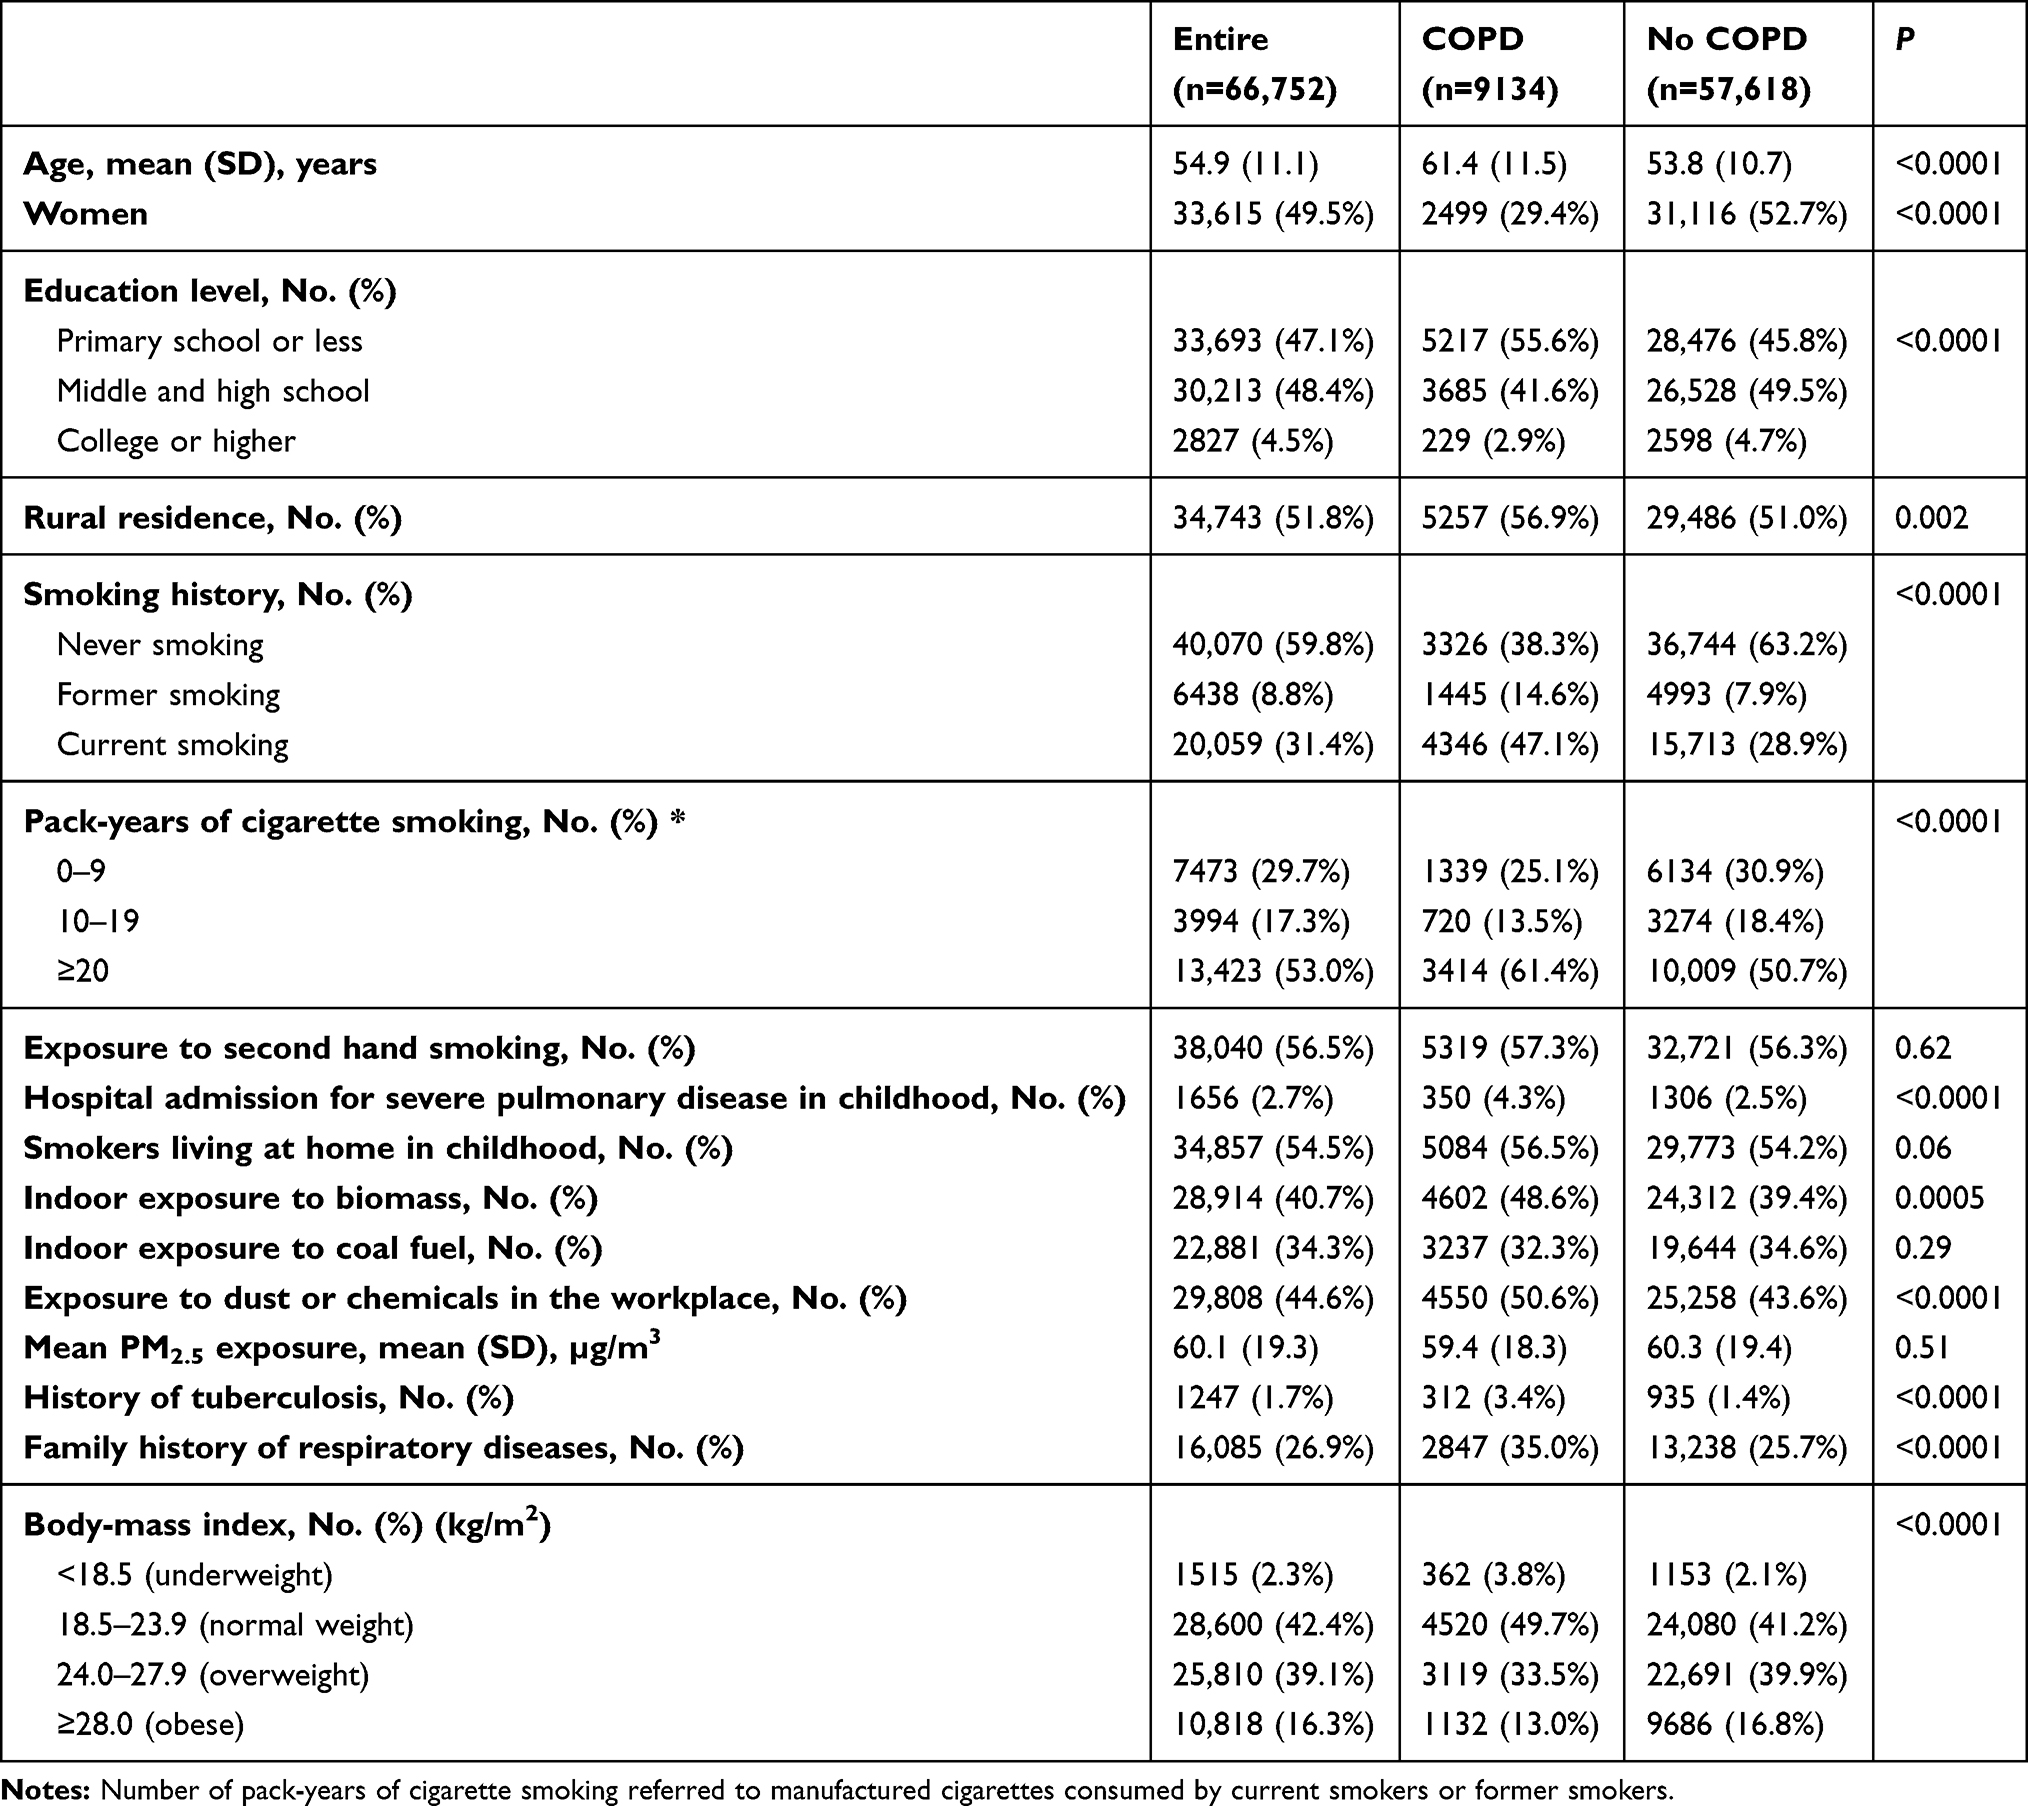 |
Table 1 Demographics, COPD Related Risk Factors, and Comorbidities Among Chinese Adults Aged 40 or Older in 2015 |
We used the ordinary kriging method to interpolate the continuous spatial surface of COPD prevalence based on the observed prevalence of COPD in all 125 counties/districts and their locations (displayed by the latitude and longitude). Ordinary kriging is a sophisticated geostatistical method based on regionalized variable theory13 that has been widely used to generate the continuous spatial surfaces of diseases (e-Method 1).14–17 We used the ArcGIS (version 10.3; ESRI Inc., Redlands, CA, USA) to perform interpolation. The spatial surface of the estimated prevalence of COPD was then converted to city-specific polygons using zonal function in ArcGIS.
We detected the geographic clusters with a significantly higher prevalence of COPD at city level using SaTScan software.18 The software gradually scans a circle across space and compares the number of observed with the number of expected cases inside the circle at each location. The number of expected cases is calculated when the null hypothesis is true, ie, the risk is the same inside and outside the circle.18,19 The discrete Poisson model was applied to identify statistically significant clusters (p<0.05) where higher than expected number of cases were observed. We used the default settings of the SaTScan software (e-Method 2).
Results
Descriptive Statistics
A total of 66,752 adults (33,137 men and 33,615 women; mean age 54.9 years (standard deviation (SD) 11.1)) were included in the analyses. Those excluded from the analyses included individuals who were ineligible for pulmonary function tests (2282), individuals who were ineligible for post-bronchodilator examinations (3841), and individuals with pulmonary function tests of grades D or F (2232). The differences in the characteristics of those included and excluded were described in our prior paper.2 We identified 9134 patients with COPD. The factors which were significantly different between those with and without COPD included age, sex, education, residence, smoking status, pack-years of cigarette smoking, hospitalization due to respiratory diseases in childhood, exposure to indoor biomass, exposure to dust or chemical in the workplace, medical history of tuberculosis, family history of respiratory diseases, and body-mass index (BMI) (Table 1).
Relative Importance of Risk Factors
As such, the above factors identified by univariate analysis and ambient PM2.5 were put in the CART model. Advanced age (≥60 years old) was identified as the most important risk factor for COPD (OR (95% CI): 3.3 (3.0, 3.7)) (Figure 2A). For people aged 40 to 59, smoking was the most important risk factor for COPD (OR (95% CI): 2.7 (2.3, 3.1)). Among people aged 40 to 59, those aged 54 or older, with a BMI of less than 23 kg/m2, and a smoking history of more than 33 pack-years had the highest prevalence of COPD (37.5%) (Figure 2B). For people aged 60 or older, smoking was also the most important risk factor for COPD (OR (95% CI): 3.1 (2.7, 3.5)). Among people aged 60 or older, those aged 70 or older, with a BMI of less than 25 kg/m2, had smoked for less than 28 pack-years, and lived in areas with PM2.5 concentration between 50 and 66 kg/m2 had the highest prevalence of COPD (56.5%). Those aged 70 or older, with a BMI of less than 25 kg/m2 and a smoking history of more than 28 pack-years had the second highest prevalence of COPD (53.9%) (Figure 2C).
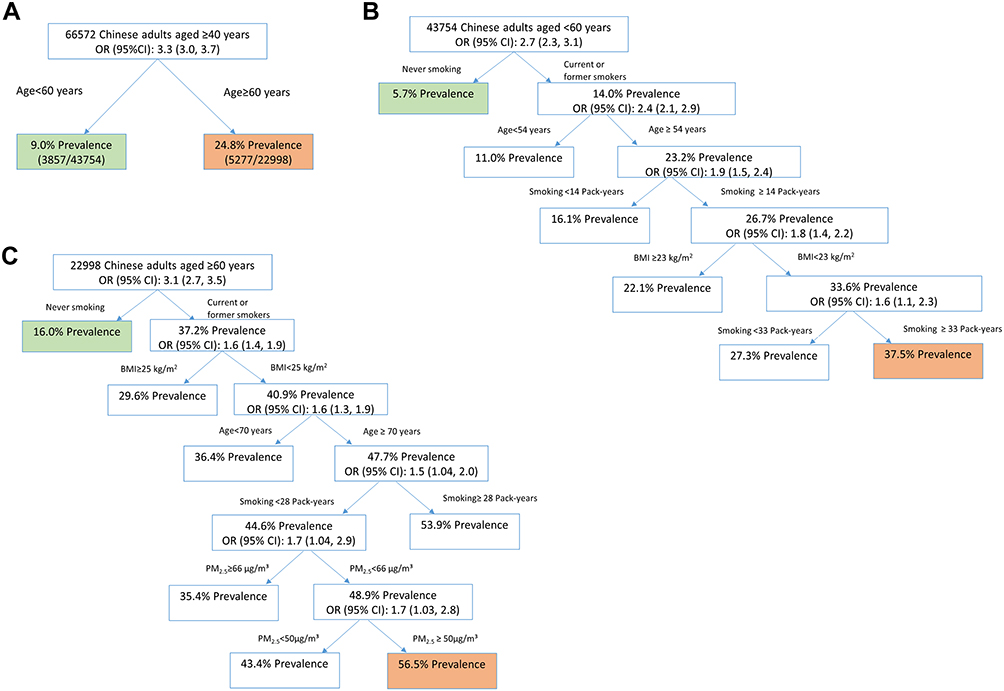 |
Figure 2 The relative importance of COPD-related risk factors among different subpopulations in mainland China, 2015. (A) Overall population. (B) Subpopulation aged 40 to 59. (C) Subpopulation aged 60 or older. |
CART models also identified important risk factors for COPD by geographic region in mainland China (e-Figure 1A–G). In all seven regions, smoking and advanced age were identified as important risk factors for COPD, but the age thresholds varied by region. For example, the age thresholds for the north and northeast were 54 and 57, respectively, while the age thresholds for the south and middle were 65 and 63, respectively. In addition to smoking and advanced age, PM2.5 was another important risk factor for COPD in the north, northeast, and southwest, and exposure to dust or chemical in the workplace was another important risk factor for COPD in the middle.
Spatial Clusters Before Adjustment
Among the overall population, the predicted city-specific prevalence of COPD by kriging analysis ranged from 8.7% (95% CI 8.6–8.8) in Ali prefecture, Tibet to 21.8% (95% CI 21.6–22.0) in Deyang city, Sichuan (Figure 3A and e-Table 1). Among 31 provincial capitals in mainland China, the predicted prevalence of COPD was highest in Chengdu, Hohhot, and Chongqing and lowest in Lhasa, Nanning, and Zhengzhou (Figure 4).
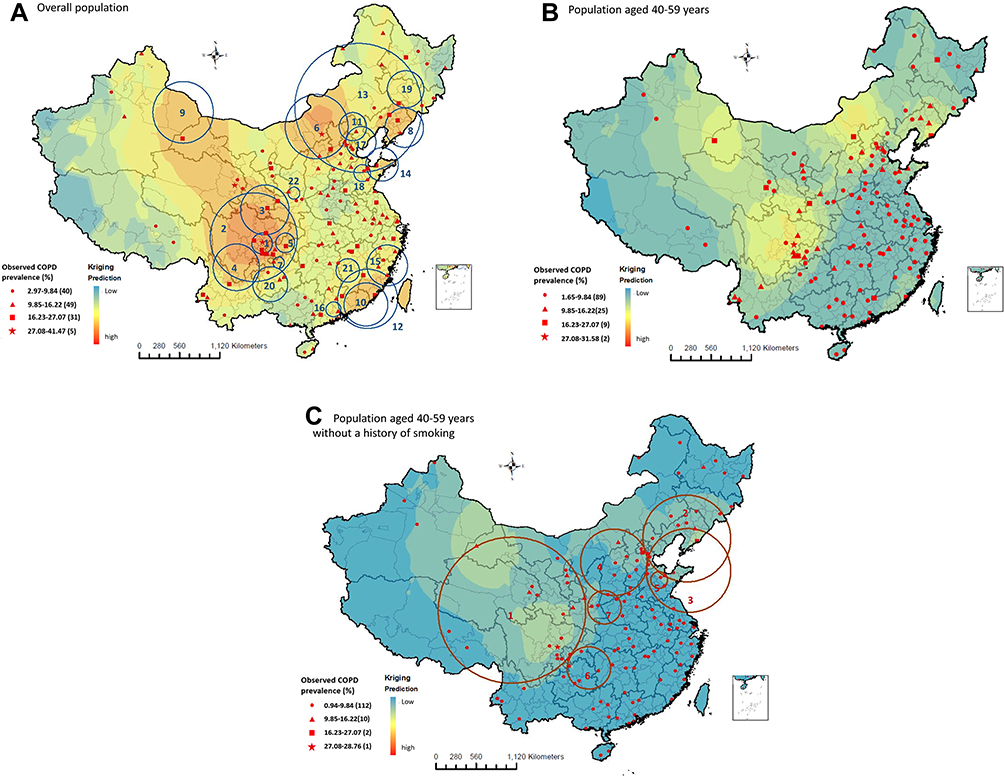 |
Figure 3 Geographical disparities and spatial clusters of COPD prevalence among different subpopulations in mainland China, 2015. (A) Overall population. (B) Subpopulation aged 40 to 59. (C) Subpopulation aged 40 to 59 without a history of smoking. |
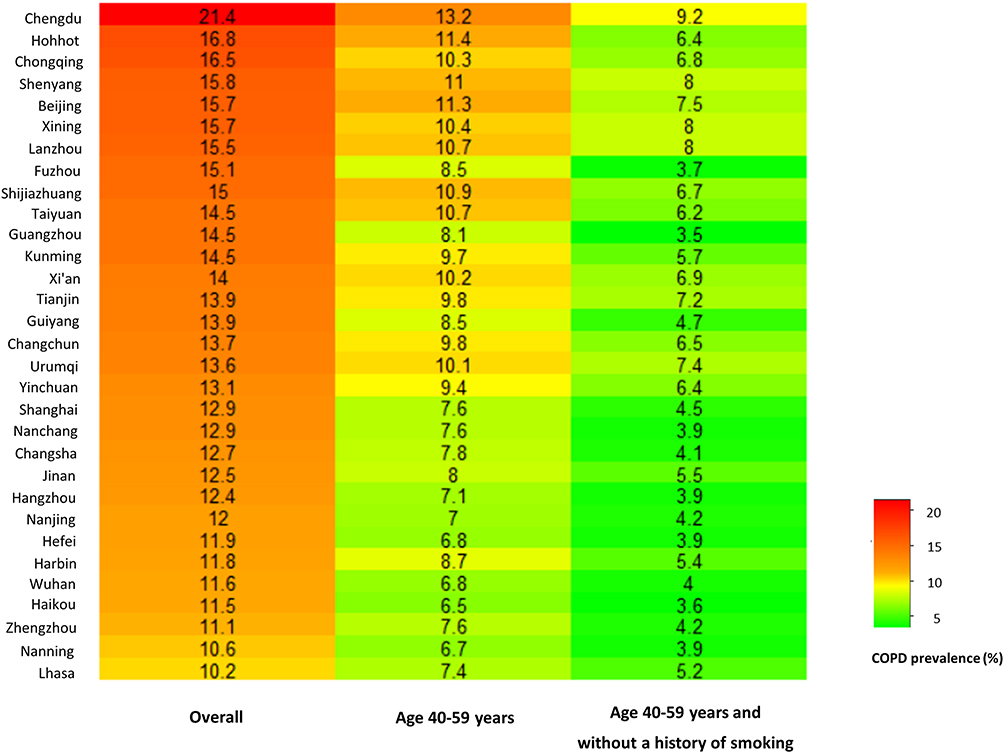 |
Figure 4 Predicted COPD prevalence among different subpopulations in 31 provincial capitals of mainland China, 2015. |
A total of 22 significant spatial clusters of COPD were detected among the overall population (Figure 3A and e-Table 2). The three clusters with the highest relative risk (RR) were located in parts of Sichuan, Gansu, Shaanxi, Chongqing, Guizhou, and Yunnan. People living inside the 22 clusters had a 1–55% increased prevalence of COPD compared to those living outside the cluster (RRs ranged from 1.01 (95% CI 1.00–1.01) to 1.55 (95% CI 1.55–1.56)) (e-Table 2).
Spatial Clusters After Adjustment
The classification tree showed that non-smokers under the age of 60 had the lowest prevalence of COPD (Figure 2). Therefore, we characterized the adjusted geographical distributions of COPD prevalence after controlling for advanced age (≥60 years old) and smoking. With the gradual control of these two factors, COPD prevalence decreased dramatically (Figure 3A–C).
The distribution of COPD prevalence among subpopulation aged 40 to 59 without a history of smoking is shown in Figure 3C. The predicted prevalence of COPD was highest in Mianyang city, Sichuan (9.7% (95% CI 9.5–9.9)) and lowest in Shanwei, Guangdong (3.3% (95% CI 3.3–3.3)) (e-Table 1) among this subpopulation. In 31 provincial capitals, the predicted prevalence of COPD was highest in Chengdu, Xining, and Lanzhou and lowest in Guangzhou, Haikou, and Fuzhou (Figure 4).
Seven significant spatial clusters of COPD prevalence among subpopulation aged 40 to 59 without a history of smoking were detected (Figure 3C and Table 2). Among them, the cluster with the highest risk covered most parts of Sichuan, Gansu, Qinghai, and Ningxia, the southwest of Shaanxi, and the east of Tibet (RR 1.65 (95% CI 1.63–1.67); P<0.0001). The RRs of the original clusters detected in the southeast of China (Guangzhou and Fujian) among the overall population were no longer statistically significant after adjusting for advanced age and smoking.
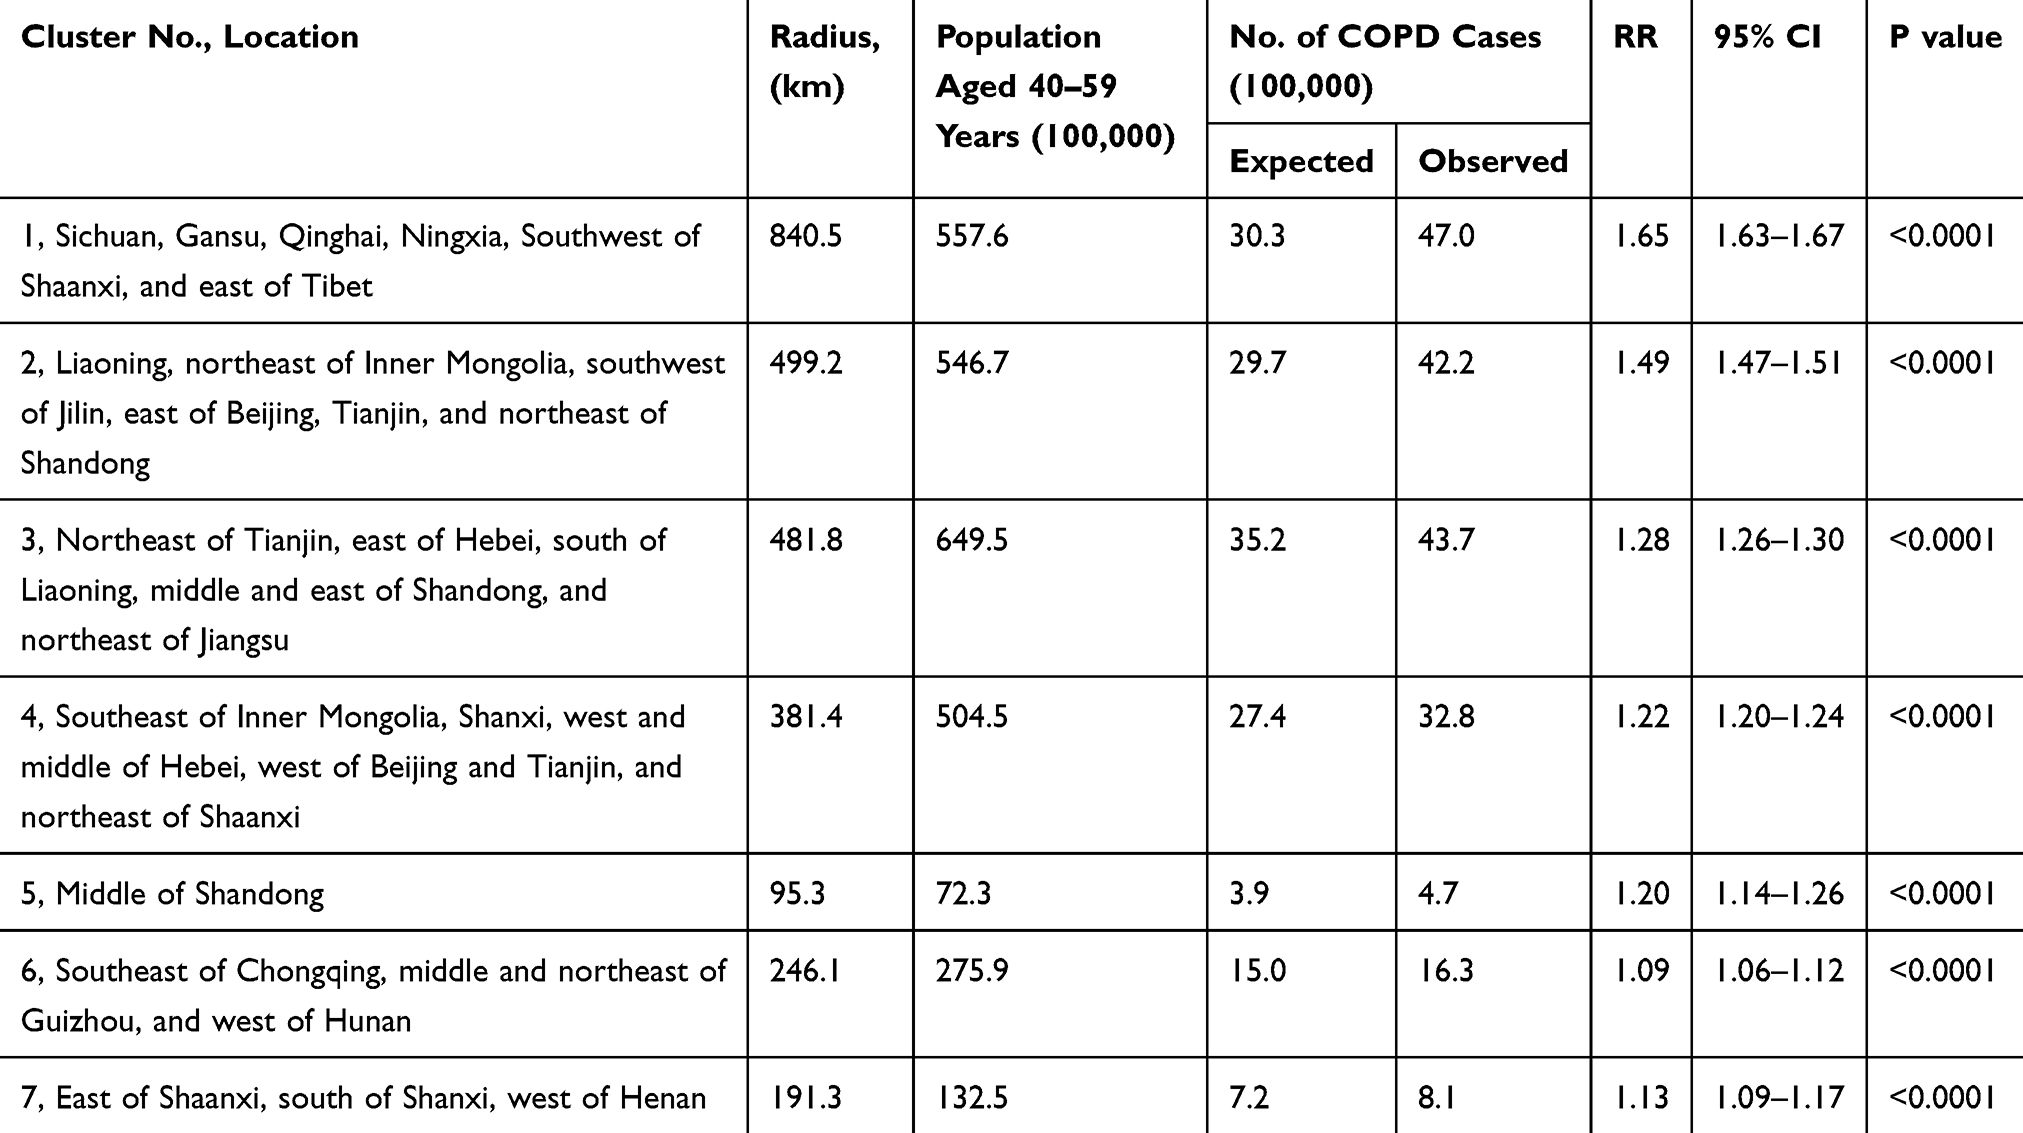 |
Table 2 Spatial Clusters of Predicted COPD Prevalence Among Chinese Adults Aged 40 to 59 Without a History of Smoking in 2015 |
Sensitivity Analysis
The predicted prevalence of COPD varied substantially by sex and smoking status (e-Figure 2A–D). We characterized the spatial distribution of smoking prevalence among people aged 40 or older, which indicated that Sichuan, Yunnan, Fujian, Guangzhou, Inner Mongolia, and Heilongjiang had a substantially higher level (e-Figure 3). We ranked 31 capital cities by COPD prevalence among subpopulation aged 60 or older and subpopulation aged 60 or older without a smoking history (e-Figure 4).
Discussion
Using data from a large nationwide survey in mainland China, we found a widespread and marked disparity in the prevalence of COPD at the city level, with the three spatial clusters with the highest prevalence located in parts of Sichuan, Chongqing, Gansu, Shaanxi, Guizhou, and Yunnan. Among the overall study population, advanced age (≥60 years old) was the most important risk factor for COPD. The subpopulation of non-smoking people under the age of 60 had the lowest risk of developing COPD. However, a notable geographical disparity in COPD prevalence across China among this subpopulation still existed, with the spatial cluster of the highest COPD prevalence shifting to the most of Sichuan, Gansu, Qinghai, and Ningxia, the southwest of Shaanxi, and the east of Tibet. The classification tree found that in addition to advanced age (with different thresholds) and smoking as two common risk factors, other important risk factors for COPD differed by geographical region.
Previous studies on geographical disparities in COPD prevalence in mainland China have been limited to regional (east, central, and west) or provincial level.20,21 Additionally, these studies used self-reported COPD cases or were conducted in a few provinces.4,20,21 Our previous study compared the prevalence of COPD in the seven subnational regions and reported that the prevalence in the southwest was the highest, but a further revelation of the disparity at a much finer spatial resolution is still lacking.2 Taking advantage of GIS and spatial scan statistics, our study is the first to reveal marked geographical disparity in COPD prevalence at the city level and the first to detect 22 significant spatial clusters of COPD among the overall population. In China, a vast country with one-fifth of the world’s population, health resources are relatively stretched and unequally allocated.22 Identifying these spatial clusters would help health authorities to effectively and efficiently target COPD screening and treatment efforts to those areas most in need.
These spatial clusters may be due to a variety of risk factors for COPD. Our study found that smoking was the most important modifiable risk factor for COPD in mainland China. The prevalence of COPD was 5.7% and 14.0% among current or former smokers and never-smokers in people aged 40 to 59, respectively, while the prevalence of COPD was 16.0% and 37.2% among current or former smokers and never-smokers in people aged 60 or older. With around 390.0 million residents aged 40 to 59 and 177.6 million residents aged 60 or older in mainland China in 2010 (population size from the most recent national census), the number of patients with COPD would decrease by 28.5 million among people aged 40 or older if they never smoked. Notably, spatial clusters of high COPD prevalence in Guangdong and Fujian dropped out from the original clusters after controlling for advanced age and smoking. Besides, our sensitivity analyses revealed that smoking prevalence was substantially higher in these two provinces than other areas, suggesting that smoking may play a more pivotal role in Guangdong and Fujian. These findings imply that implementing more intensified tobacco control strategies would substantially curb the COPD epidemic in China, especially in Guangdong and Fujian.
Our study found that geographical disparity in COPD prevalence across China still existed after adjusting for advanced age and smoking and the spatial cluster with the highest COPD prevalence enlarged to most parts of Sichuan, Gansu, Qinghai, Ningxia, the southwest of Shaanxi, and the east of Tibet, etc., indicating that, in these areas, there were other important factors contributing to the local high prevalence of COPD. Further studies are warranted to investigate the drivers behind these remaining spatial clusters of high COPD prevalence.
Some studies have found a significant relationship between air pollution and COPD.23,24 We found that those lived in the areas with PM2.5 concentration of 50 to 65 µg/m3 had a substantially higher prevalence of COPD among adults aged 60 or older, while the classification tree did not identify PM2.5 as an important risk factor for COPD among adults aged 40 to 59. This implies that the effect of PM2.5 on COPD may be more pronounced in the elderly and there may be a non-linear relationship between PM2.5 and COPD. Previous studies also found a non-linear relationship between PM2.5 and mortality from respiratory diseases.25,26 This non-linear relationship might be due to the change in people’s behaviors in areas with the highest concentration of PM2.5, ie, wearing masks and avoiding outdoor activities.26 Classification trees in different regions present that PM2.5 was one of the important risk factors for COPD in the north, northeast, and southwest, but not in other regions. One possible explanation is that PM2.5 concentration was relatively higher in these three regions.9 Another explanation is that the composition and toxicity of PM2.5 probably varied by region.25 Regardless of the reasons behind this regional disparity, our study finding suggests that ambient air pollution control would have important implications to reduce the prevalence of COPD in the north, northeast and southwest.
Age thresholds with substantially higher COPD prevalence identified by classification tree were much younger in the north and northeast than other regions, indicating that residents in the north and northeast may develop COPD at a much earlier age. Our previous study showed that the proportion of hospital admissions for severe pulmonary disease in childhood and the proportion of family history of lung diseases were slightly higher in these two regions.2 This may suggest multiple reasons including genetic and environmental factors play a role in the younger age threshold in these regions. More attention should be paid to relatively younger population during the process of case finding of COPD in clinical settings in the north and northeast of China.
Our study has several strengths. First, based on the large randomly selected samples over mainland China, this is the first study to detect spatial clusters with a significantly higher prevalence of COPD at the city level before and after adjusting for the important risk factors. Second, the application of the CART model allows us to determine the relative importance and thresholds of COPD-related risk factors in view of the high-order interactions between them. Third, the large sample size enables us to assess the regional difference in the important risk factors for COPD. Fourth, strict quality control measures including pre- and post-bronchodilator FEV1 and FVC measurements and data collection and management system ensure the reliability of the data.
The limitations of our study could not be ignored. First, the cross-sectional study design limited our ability to determine the causal relationships between risk factors and COPD. Second, we only enrolled permanent residents without a floating population. However, COPD mainly occurs in the population over the age of 40, among which the proportion of the floating population is relatively low. Therefore, the study results are unlikely to be affected.
Conclusion
We detected 22 spatial clusters of COPD at the city level in mainland China, which will help target efforts on prevention, diagnosis, and treatment for COPD to those areas most in need. Tobacco control would be the most effective measure to reduce the burden of COPD among the overall population in mainland China, especially in Guangdong and Fujian. Around 28.5 million cases of COPD could be prevented across mainland China if people aged 40 or older never smoked. Ambient PM2.5 control would be of particular importance in reducing the prevalence of COPD in the north, northeast and southwest. The remaining spatial clusters after controlling for the important risk factors provide information about other potential local risk factors, calling for further investigations.
Acknowledgments
We thank participants and the research staff from local Centers for Disease Control and Prevention and local hospitals for the data collection. For advice and support on the work, we thank Kewu Huang and Yong Lu (Beijing Chao-Yang Hospital), Yahong Chen (Peking University Third Hospital), Yumin Zhou and Yi Gao (Guangzhou Institute of Respiratory Disease), Yanfei Guo (Beijing Hospital), Binmiao Liang (West China Hospital, Sichuan University), and Xuhua Zhang (General Hospital of Ningxia Medical University). N Wang was supported by the Queensland University of Technology Postgraduate Research Award and Queensland University of Technology Higher Degree Research International Tuition Fee Sponsorship. W Hu is supported by Australian Research Council future fellowship (FT140101216).
Author Contributions
LF, WH, NW, and LW contributed to study conception and design. NW, SC, HB, BW, JF, YF, YL, LW, and LF considerably contributed to participant recruitment and data acquisition. NW, WH, SC, JF, and HB analyzed the data. LF, WH, LW, CW, and TY interpreted the results. NW wrote the manuscript. LF, LW, and CW obtained funding for the study. All authors contributed to data analysis, drafting and revising the article, gave final approval of the version to be published, and agree to be accountable for all aspects of the work.
Disclosure
The authors declare no conflicts of interest in this work.
References
1. Zhou M, Wang H, Zeng X, et al. Mortality, morbidity, and risk factors in China and its provinces, 1990-2017: a systematic analysis for the Global Burden of Disease Study 2017. Lancet. 2019;394:1145–1158. doi:10.1016/S0140-6736(19)30427-1
2. Fang L, Gao P, Bao H, et al. Chronic obstructive pulmonary disease in China: a nationwide prevalence study. Lancet Respir Med. 2018;6(6):421–430. doi:10.1016/S2213-2600(18)30103-6
3. Wang C, Xu J, Yang L, et al. Prevalence and risk factors of chronic obstructive pulmonary disease in China (the China Pulmonary Health [CPH] study): a national cross-sectional study. Lancet. 2018;391(10131):1706–1717. doi:10.1016/S0140-6736(18)30841-9
4. Zhong N, Wang C, Yao W, et al. Prevalence of chronic obstructive pulmonary disease in China: a large, population-based survey. Am J Respir Crit Care Med. 2007;176(8):753–760. doi:10.1164/rccm.200612-1749OC
5. Loh WY. Classification and regression trees. Wires Data Min Knowl. 2011;1(1):14–23. doi:10.1002/widm.8
6. Lemon SC, Roy J, Clark MA, Friedmann PD, Rakowski W. Classification and regression tree analysis in public health: methodological review and comparison with logistic regression. Ann Behav Med. 2003;26(3):172–181. doi:10.1207/S15324796ABM2603_02
7. Liu S, Wu X, Lopez AD, et al. An integrated national mortality surveillance system for death registration and mortality surveillance, China. Bull World Health Organ. 2016;94(1):46–57. doi:10.2471/BLT.15.153148
8. Fang LW, Bao HL, Wang BH, et al. [A summary of item and method of national chronic obstructive pulmonary disease surveillance in China]. Zhonghua Liu Xing Bing Xue Za Zhi. 2018;39(5):546–550. doi:10.3760/cma.j.issn.0254-6450.2018.05.002
9. Ma ZW, Hu XF, Sayer AM, et al. Satellite-based spatiotemporal trends in PM2.5 concentrations: China, 2004–2013. Environ Health Persp. 2016;124(2):184–192. doi:10.1289/ehp.1409481
10. Miller MR, Hankinson J, Brusasco V, et al. Standardisation of spirometry. Eur Respir J. 2005;26(2):319–338. doi:10.1183/09031936.05.00034805
11. Global Initiative for Chronic Obstructive Lung Disease. Global Strategy for Diagnosis, Management and Prevention of Chronic Obstructive Pulmonary Disease 2018 Report; 2018.
12. Fonarow GC, Adams KF
13. Oliver MA, Webster R. Kriging: a method of interpolation for geographical information systems. Int J Geogr Inf Syst. 1990;4(3):313–332. doi:10.1080/02693799008941549
14. Coburn BJ, Blower S. Mapping HIV epidemics in sub-Saharan Africa with use of GPS data. Lancet Glob Health. 2013;1(5):e251–e253. doi:10.1016/S2214-109X(13)70084-6
15. Li XX, Wang LX, Zhang H, et al. Spatial variations of pulmonary tuberculosis prevalence co-impacted by socio-economic and geographic factors in People’s Republic of China, 2010. BMC Public Health. 2014;14:257. doi:10.1186/1471-2458-14-257
16. Carrat F, Valleron AJ. Epidemiologic mapping using the “kriging” method: application to an influenza-like illness epidemic in France. Am J Epidemiol. 1992;135(11):1293–1300. doi:10.1093/oxfordjournals.aje.a116236
17. Duncombe J, Clements A, Davis J, Hu W, Weinstein P, Ritchie S. Spatiotemporal patterns of Aedes aegypti populations in Cairns, Australia: assessing drivers of dengue transmission. Trop Med Int Health. 2013;18(7):839–849. doi:10.1111/tmi.2013.18.issue-7
18. Kulldorff M, Huang L, Pickle L, Duczmal L. An elliptic spatial scan statistic. Stat Med. 2006;25(22):3929–3943. doi:10.1002/sim.2490
19. Ray GT, Kulldorff M, Asgari MM. Geographic clusters of basal cell carcinoma in a Northern California health plan population. JAMA Dermatol. 2016;152(11):1218–1224. doi:10.1001/jamadermatol.2016.2536
20. Yin P, Wang H, Vos T, et al. A subnational analysis of mortality and prevalence of COPD in China from 1990 to 2013: findings from the Global Burden of Disease Study 2013. Chest. 2016;150(6):1269–1280. doi:10.1016/j.chest.2016.08.1474
21. Yin P, Zhang M, Li Y, Jiang Y, Zhao W. Prevalence of COPD and its association with socioeconomic status in China: findings from China Chronic Disease Risk Factor Surveillance 2007. BMC Public Health. 2011;11:586. doi:10.1186/1471-2458-11-586
22. Sun J, Luo H. Evaluation on equality and efficiency of health resources allocation and health services utilization in China. Int J Equity Health. 2017;16(1):127. doi:10.1186/s12939-017-0614-y
23. Atkinson RW, Carey IM, Kent AJ, van Staa TP, Anderson HR, Cook DG. Long-term exposure to outdoor air pollution and the incidence of chronic obstructive pulmonary disease in a national English cohort. Occup Environ Med. 2015;72(1):42–48. doi:10.1136/oemed-2014-102266
24. Lin HL, Qian ZM, Guo YF, et al. The attributable risk of chronic obstructive pulmonary disease due to ambient fine particulate pollution among older adults. Environ Int. 2018;113:143–148. doi:10.1016/j.envint.2018.01.029
25. Chen RJ, Yin P, Meng X, et al. Fine particulate air pollution and daily mortality a nationwide analysis in 272 Chinese cities. Am J Resp Crit Care. 2017;196(1):73–81. doi:10.1164/rccm.201609-1862OC
26. Yan M, Wilson A, Bell M, et al. The shape of the concentration-response association between fine particulate matter pollution and human mortality in Beijing, China, and its implications for health impact assessment. Environ Health Perspect. 2019;127(6):67007. doi:10.1289/EHP4464
 © 2020 The Author(s). This work is published and licensed by Dove Medical Press Limited. The full terms of this license are available at https://www.dovepress.com/terms.php and incorporate the Creative Commons Attribution - Non Commercial (unported, v3.0) License.
By accessing the work you hereby accept the Terms. Non-commercial uses of the work are permitted without any further permission from Dove Medical Press Limited, provided the work is properly attributed. For permission for commercial use of this work, please see paragraphs 4.2 and 5 of our Terms.
© 2020 The Author(s). This work is published and licensed by Dove Medical Press Limited. The full terms of this license are available at https://www.dovepress.com/terms.php and incorporate the Creative Commons Attribution - Non Commercial (unported, v3.0) License.
By accessing the work you hereby accept the Terms. Non-commercial uses of the work are permitted without any further permission from Dove Medical Press Limited, provided the work is properly attributed. For permission for commercial use of this work, please see paragraphs 4.2 and 5 of our Terms.