")
Back to Journals » Journal of Pain Research » Volume 15
Geographic Variation in the Use of Gabapentinoids and Opioids for Pain in a Commercially Insured Adult Population in the United States
Authors Zhao D , Baek J, Hume AL, McPhillips EA, Lapane KL
Received 21 October 2021
Accepted for publication 18 January 2022
Published 11 February 2022 Volume 2022:15 Pages 443—454
DOI https://doi.org/10.2147/JPR.S345521
Checked for plagiarism Yes
Review by Single anonymous peer review
Peer reviewer comments 2
Editor who approved publication: Dr Timothy Atkinson
Danni Zhao,1 Jonggyu Baek,1 Anne L Hume,2,3 Emily A McPhillips,1 Kate L Lapane1
1Department of Population and Quantitative Health Sciences, UMass Chan Medical School, Worcester, MA, USA; 2Department of Family Medicine, Alpert Medical School, Brown University, Memorial Hospital of Rhode Island, Providence, RI, USA; 3Department of Pharmacy Practice, College of Pharmacy, University of Rhode Island, Kingston, RI, USA
Correspondence: Kate L Lapane, Department of Population and Quantitative Health Sciences, UMass Chan Medical School, Worcester, MA, USA, Email [email protected]
Background: Gabapentinoids have been prescribed off-label for almost all types of pain. The geographic variation in the use of gabapentinoids as analgesics remains unknown.
Objective: To describe the geographic variation in gabapentinoids, opioids and concurrent use of both for pain by US state and metropolitan statistical area (MSA).
Methods: We conducted a cross-sectional study on December 1, 2018, among commercially insured adults aged 18– 64 years without epilepsy or opioid use disorders using IBM® MarketScan® Research Databases. We described the geographic variation in the analgesic regimens (gabapentinoids, opioids and concurrent use of both) by state and MSA, and assessed factors associated with the geographic variation using multilevel logistic regression.
Results: We included 9,314,197 beneficiaries; 1.4% had gabapentinoids, 1.5% had opioids and 0.3% had concurrent use of both. The majority of gabapentinoid use lacked an FDA-approved indication. Use of the analgesic regimens varied across states (gabapentinoids (median (interquartile range)): 1.4% (1.2– 1.7%); opioids: 1.5% (1.2– 1.9%); both: 0.3% (0.2– 0.4%)) and MSAs (gabapentinoids: 1.6% (1.3– 2.0%); opioids: 1.8% (1.3– 2.3%); both: 0.3% (0.2– 0.5%)). Demographics explained the largest proportion of the between-state and between-MSA variation. The pattern of the geographic variation in gabapentinoids was similar to that of opioids across states and MSAs.
Conclusion: Gabapentinoids were as commonly used as opioids for pain in a commercially insured population (mostly off-label). The geographic variation in gabapentinoids was similar to that of opioids, which suggests that gabapentinoids may be widely used as alternatives or adjuvants to opioids across the US.
Keywords: gabapentinoids, opioids, pain, geographic variation
Introduction
Between 2001 and 2017, approximately one trillion dollars were spent on the opioid epidemic and costs continue to increase.1 Approximately 450,000 overdose deaths involving prescription or illicit opioids occurred between 1999 and 2018,2 with the number of opioid-related deaths four times higher in 2018 than 1999.2 The Center for Disease Control and Prevention (CDC) recommends that clinicians consider alternative therapies to opioids for pain management.3 Although acetaminophen and nonsteroidal anti-inflammatory drugs (NSAIDs) are commonly used to treat mild-to-moderate pain, acetaminophen is usually ineffective in alleviating severe pain, and NSAIDs have contraindications when used among patients with multiple comorbidities.4
Gabapentinoids (gabapentin and pregabalin), a class of FDA-approved antiepileptic medications with expanded indications for certain neuropathic pain conditions, have been prescribed off-label for the treatment of pain.4–6 Between 2002 and 2015, the dispensed prescriptions of gabapentinoids tripled, likely driven by off-label use for pain.7 With 68 million dispensed prescriptions in 2017, gabapentin was the 10th most commonly prescribed medication in the US.8 Gabapentinoids are commonly used as alternatives or adjuvants to opioids.4,5,9 Among commercially insured individuals, 60.8% of the patients who were prescribed with gabapentin had filled one or more opioid prescriptions.10 Real-world evidence from large-scale observational studies on prescribing gabapentinoids as analgesics is limited.
The geographic variation in opioids is known, with the highest rate of opioids prescribed for duration ≥30 days observed in Alabama (47.7/100 persons).11 Less is known about gabapentinoids. One recent study reported the variation of gabapentin by state in a commercially insured population from 2009 to 2016 (highest prevalence in Kentucky: 43.9/1000 beneficiaries; lowest in Washington DC: 12.7/1000 beneficiaries); however, it included gabapentin use for any indications and excluded pregabalin.10 This study addresses this research gap by describing geographic variation in gabapentinoid and/or opioid use for pain as well as identifying factors that drive geographic variation.
Methods
Data Source
We used the IBM® MarketScan® Research Databases (2017–2018), a large US commercial claims database. It includes employer-sponsored commercial insurance plans covering 40 million employees, their spouses and children each year,12 and captures information on patients’ demographics, enrollment of insurance plans, medical/pharmacy claims, outpatient office visits, inpatient hospital stays and specialty care. The IBM® MarketScan® Research Databases are considered nationally representative of Americans with employer-sponsored health insurance.12
Study Design and Sample
We conducted a nationwide cross-sectional study. The prevalence of gabapentinoid and/or opioid use for pain was identified on December 1, 2018 (index date). We included beneficiaries aged ≥18 years with continuous insurance enrollment between December 1, 2017, and December 1, 2018 (eFigure 1 in the Supplement). We excluded patients diagnosed with epilepsy13,14 or opioid use disorder (OUD)15 between December 1, 2017, and December 1, 2018 (eTable 1). We assumed that gabapentinoids and/or opioids were for pain management. We excluded beneficiaries lacking valid information on state or metropolitan statistical area (MSA). The characteristics of the beneficiaries with missing geographic information were similar to that of the final study sample except that most also had unknown employment status (eTable 2).
Analgesic Regimens
We included gabapentinoids and oral-administered opioids. Gabapentinoid use (ie, gabapentin and pregabalin) and opioid use were ascertained in outpatient drug claims using generic names, generic identifiers, and national drug codes outlined in the IBM Micromedex® RED BOOK® (2018). Patients were classified as gabapentinoid and/or opioid users if their prescription fill date plus days of supply overlapped with December 1, 2018.
Gabapentinoid Use
We created binary variables indicating the use of gabapentin, pregabalin and gabapentinoids on the index date and excluded the few gabapentinoid users (<0.8%) taking both. We calculated daily dose and categorized daily-dose strength as low (gabapentin <900 mg/day, pregabalin <150 mg/day), medium (gabapentin 900–1800 mg/day, pregabalin 150–300 mg/day) or high (gabapentin ≥1800 mg/day, pregabalin ≥300 mg/day). We created a binary variable to indicate whether the users of gabapentinoids had labeled indications (gabapentin: postherpetic neuralgia (PHN); pregabalin: PHN, neuropathic pain associated with diabetic peripheral neuropathy (DPN), fibromyalgia and neuropathic pain associated with spinal cord injury) or not.19,20
Opioid Use
Opioids include oral short-acting formulas and long-acting preparations (ie, codeine, fentanyl, hydrocodone, hydromorphone, levorphanol, methadone, morphine, oxycodone, oxymorphone, tapentadol and tramadol). We excluded buprenorphine as it is used to treat OUD.42 We created a binary variable indicating the use of opioids on the index date. We converted the dose of all opioids used on the index date to morphine milligram equivalents (MME) using opioid morphine equivalent conversion factors and calculated daily MME (eTable 3).17,18 We categorized the daily dose of opioids as low (<50 MME/day), medium (50–90 MME/day) or high (≥90 MME/day). We created a binary variable to flag the concurrent use of opioids and gabapentinoids on the index date.
Geographic Variation
The December 2018 enrollment file provided two geographic variables: state (52 states including the District of Columbia and Puerto Rico) and MSA (410-level categorical variable representing 409 MSAs and the non-MSA region). We matched the 409 MSAs available in the initial enrollment data to 390 (out of 392) census MSAs according to the 2018 US census (except for “Guayama, PR” and “York-Hanover, PA Metro Area”)27 (eTable 4). The final MSA variable included 390 census MSAs and the non-MSA region. MSA refers to a geographic region comprising a city or town with high population at its core, and a few smaller cities/towns in the surrounding area, with a minimum population of 50,000. Cities/towns in an MSA are strongly tied economically and can cross state lines. Social and economic factors among MSAs can influence prescribing cultures.
Covariates
Covariates include demographic variables (ie, age, sex, employment status from enrollment file), painful conditions (injuries (excludes poisonings), chronic pain, abdominal pain, head pain, psychogenic pain, musculoskeletal pain and neuropathic pain) (eTable 5),21–26 and adjuvant analgesics (eg, tricyclic antidepressants, serotonin-norepinephrine reuptake inhibitors (SNRIs), muscle relaxants and cannabinoids) (eTable 6). Painful conditions were ascertained over the one-year lookback period before the index using both inpatient and outpatient claims. Analgesic use was identified on the index date using outpatient drug claims based on the prescription fill date and days of supply.
Statistical Analysis
The point prevalence for the analgesic regimens (gabapentinoids, opioids and concurrent use of both) was calculated by the number of people with evidence of dispensed prescriptions divided by all eligible beneficiaries. We geographically depicted the observed variations in prevalence and average daily dose of the analgesic regimens across states and MSAs using ArcGIS Pro.41 To estimate the factors associated with the geographic variations in gabapentinoids and/or opioids use, we sequentially fitted three sets of cross-classified multilevel logistic regression models – one for each analgesic regimen, with the following covariates included 1) none (ie, the null model); 2) demographics; 3) painful conditions; 4) adjuvant analgesic use; 5) demographics + painful conditions + adjuvant analgesic use. Demographics, painful conditions and adjuvant analgesic use were included as beneficiary-level variables; state and MSA were included as area-based variables. To examine factors associated with the geographic variations in gabapentinoids, opioids and concurrent use of both, odds ratios (ORs) with 95% confidence intervals (CIs) were estimated for the beneficiary-level variables. The ORs were interpreted as prevalence ratios. Variance components of random effects of states and MSAs were rescaled to be compared across models.16 To quantify the proportion of variations in the use of gabapentinoids, opioids, and concurrent use of both explained by states and MSAs, proportion changes in variance (PCV) and variance partition coefficient (VPC) were calculated for the two area-based variables from the above models. The SAS (version 9.4) command “Proc Glimmix” was used to run the above cross-classified multilevel logistic regression models.
Results
Study Sample Characteristics
We included 9,314,197 beneficiaries (Table 1). The mean age was 42.1 years, with a similar proportion of women and men. Most were full-time employees. Two-fifths had painful conditions; the most prevalent types were musculoskeletal pain, abdominal pain and neuropathic pain. Among the users of gabapentinoids, opioids and both medications, the mean age was >50 years. There was a higher proportion of women than men among the analgesic users. Painful conditions were present among nearly all analgesic users, especially among concurrent users of a gabapentinoid and opioids (97.6%). Musculoskeletal and neuropathic pain was prevalent among the gabapentinoid users and concurrent users of both medications. About one-third to two-fifths of the analgesic users were using adjuvant analgesics, with SNRIs and muscle relaxants being most frequently used.
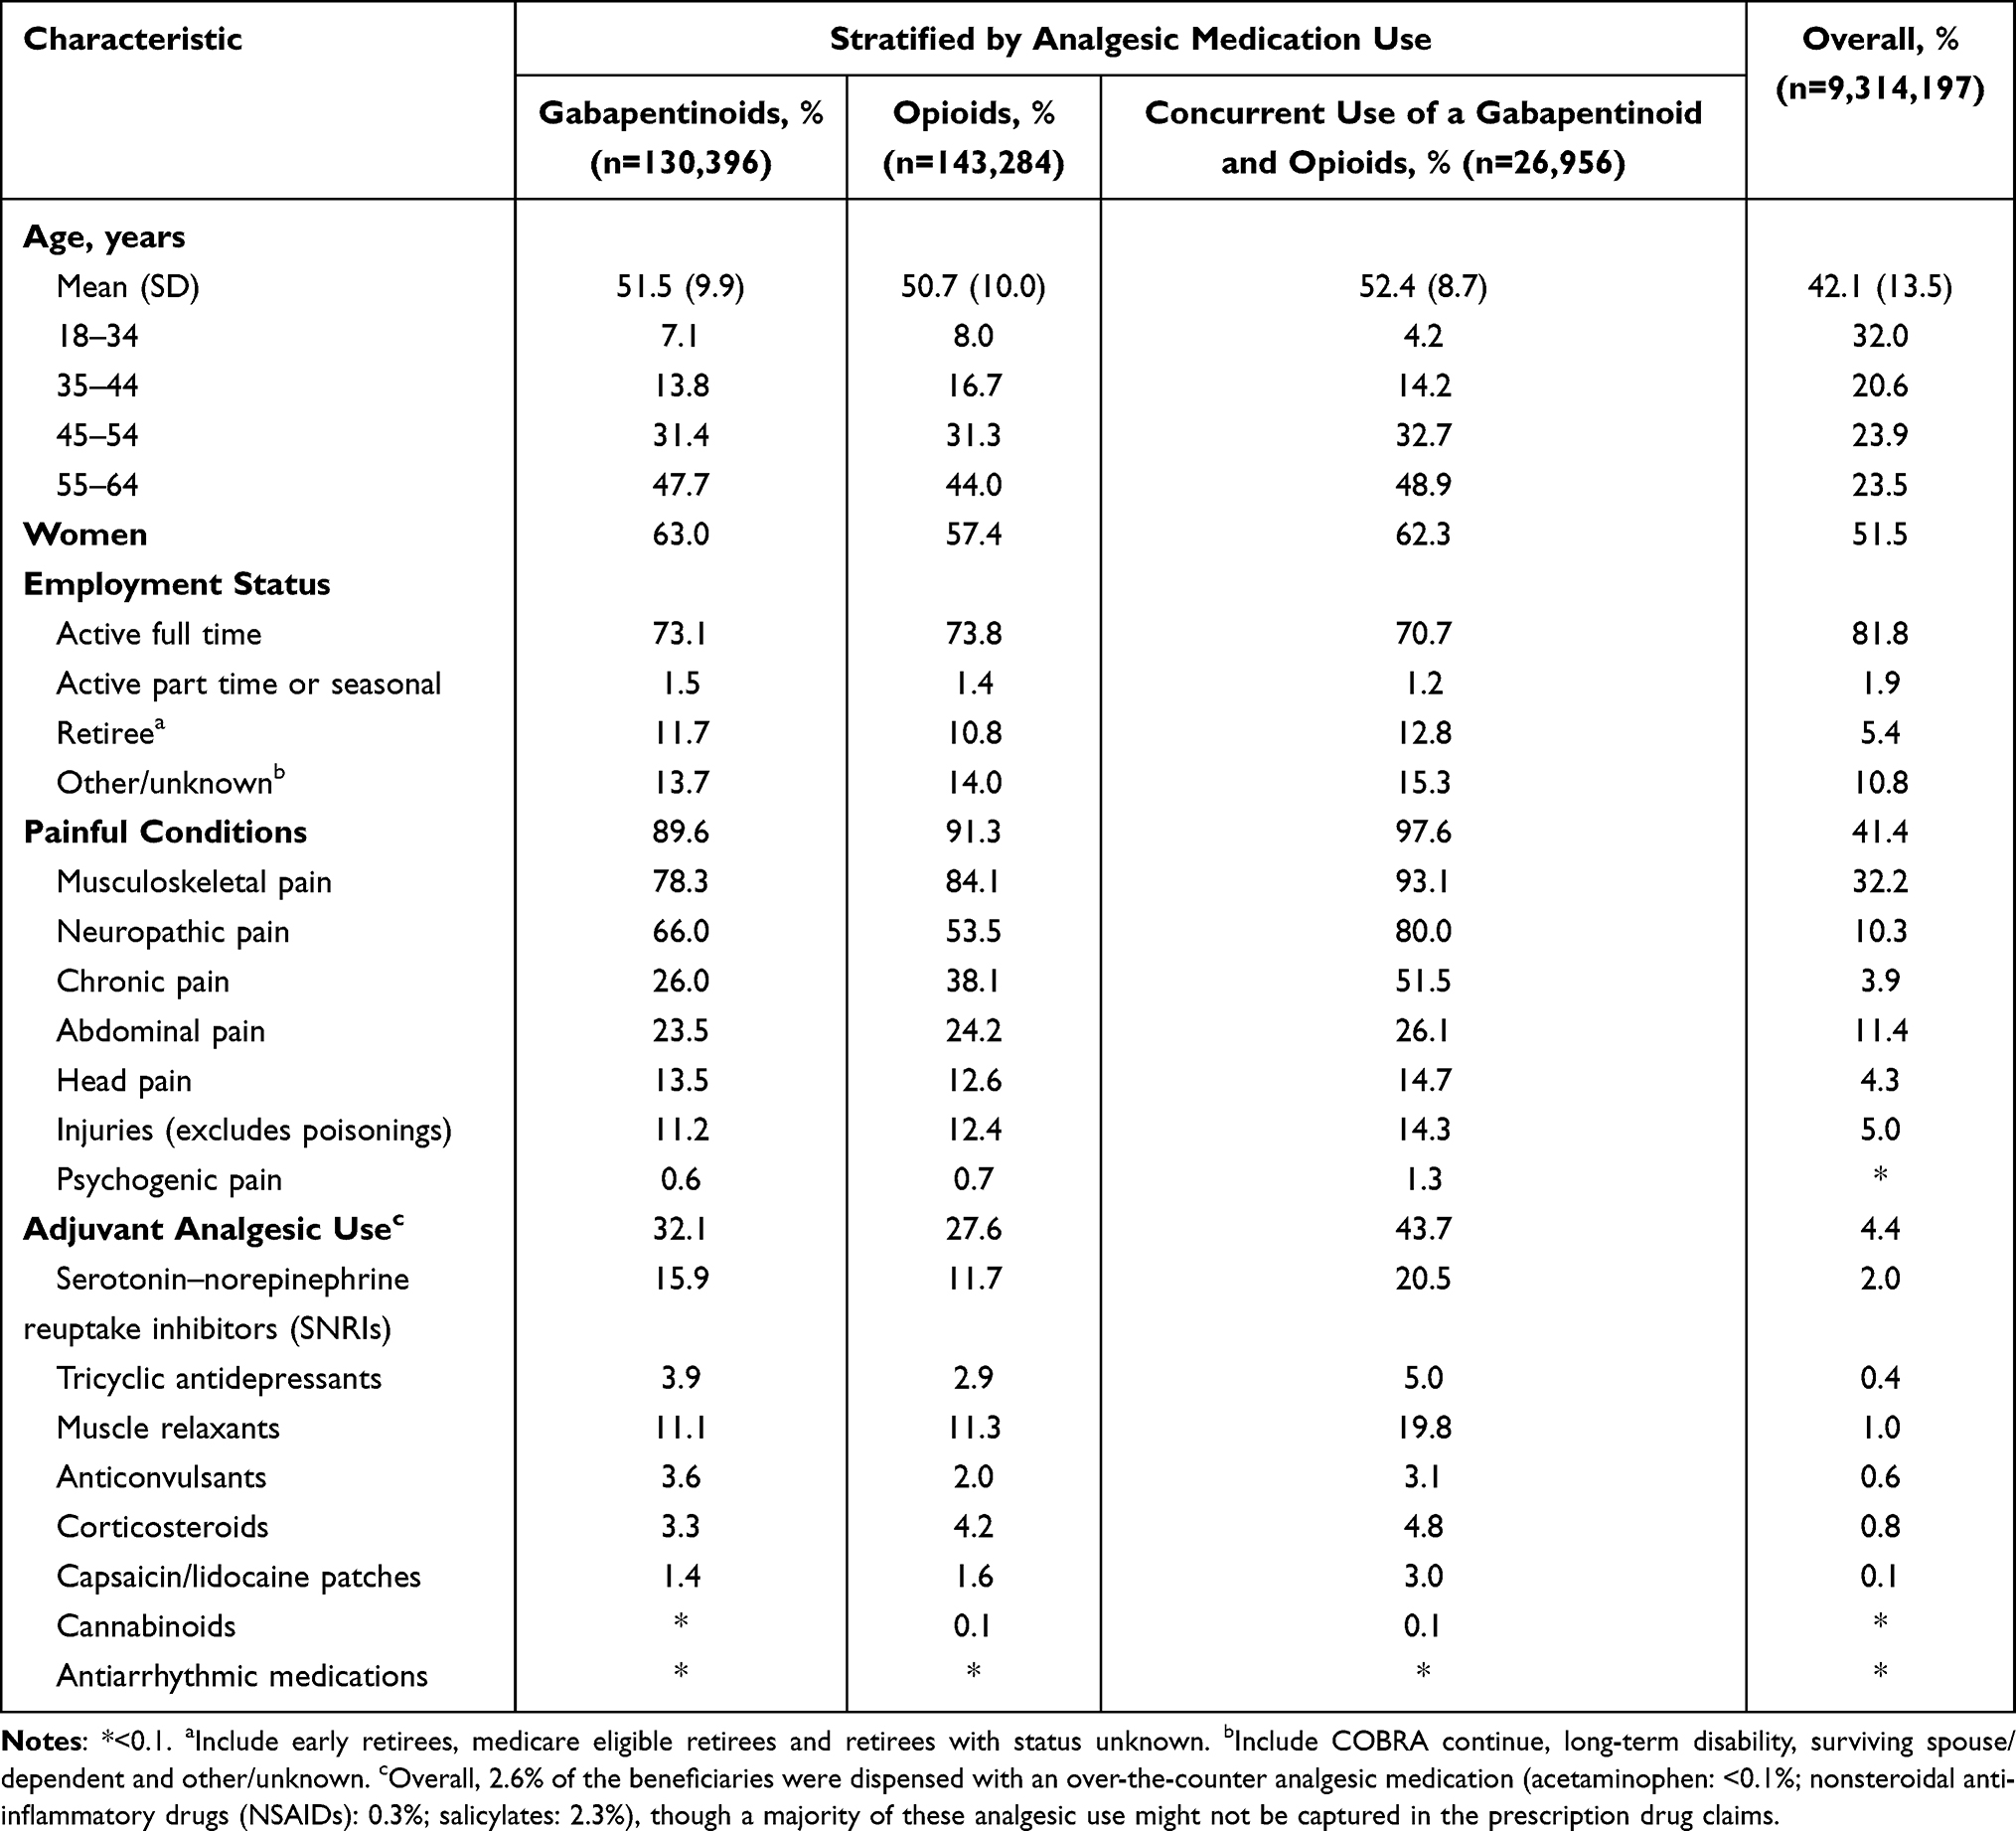 |
Table 1 Characteristics of the Study Population on December 1, 2018 (n=9,314,197) |
Geographic Variation in Gabapentinoids
Of all beneficiaries, 1.4% used gabapentinoids (gabapentin: 1.2% (average daily dose: 375 mg (SD=229.5), 80.1% off-label); pregabalin: 0.2% (average daily dose: 124 mg (SD=76.8), 59.6% off-label)). Gabapentinoid use varied across states (median: 1.4%; interquartile range (IQR): 1.2–1.7%) and MSAs (median: 1.6%; IQR: 1.3–2.0%) (Figures 1 and 2). The states with the top 10 highest and lowest prevalence of gabapentinoids (as well as opioids and concurrent use of both) were included in eTable 7. States and MSAs with relatively low prevalence of gabapentinoids could have relatively high doses of gabapentinoids and vice versa (eFigures 2 and 3). For example, though the prevalence of gabapentinoids was low in the District of Columbia, it had the highest daily dose of pregabalin use (153 mg/day) (eFigure 2). The high dose of pregabalin use in the District of Columbia was not matched to greater concomitant opioid use (Figure 1).
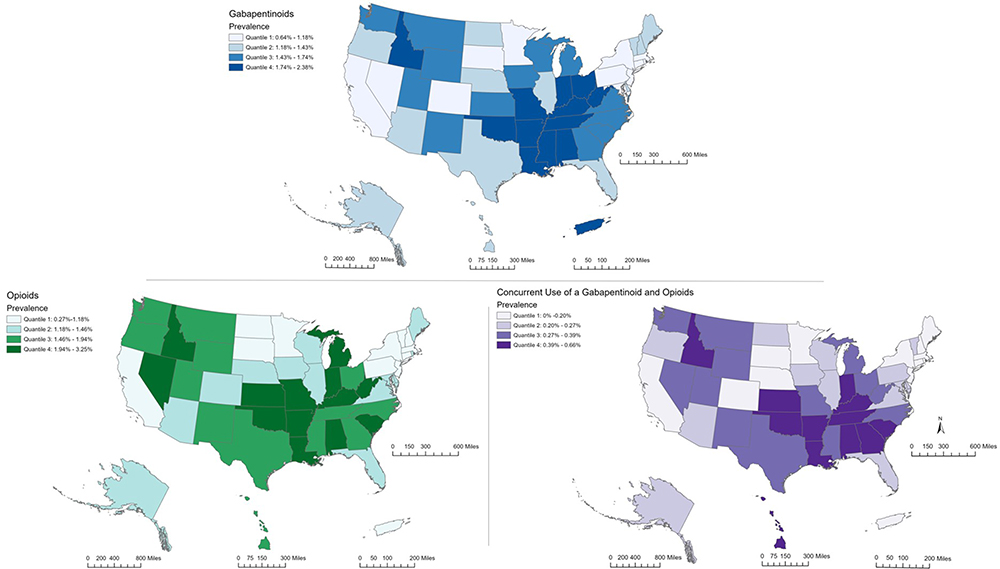 |
Figure 1 The prevalence of gabapentinoids and/or opioids for pain in the US by state. Data were calculated from the IBM® MarketScan® Research Databases on December 1, 2018. The figures were generated from ArcGIS Pro. Shape data of 2018 US states and metropolitan statistical areas from IPUMS National Historical Geographic Information System (NHGIS) were used: Manson, S., Schroeder, J., Van Riper, D., Kugler, T., and Ruggles, S., (2020). IPUMS National Historical Geographic Information System (15.0) [Computer software]. Minneapolis, MN: IPUMS. http://doi.org/10.18128/D050.V15.0.41 |
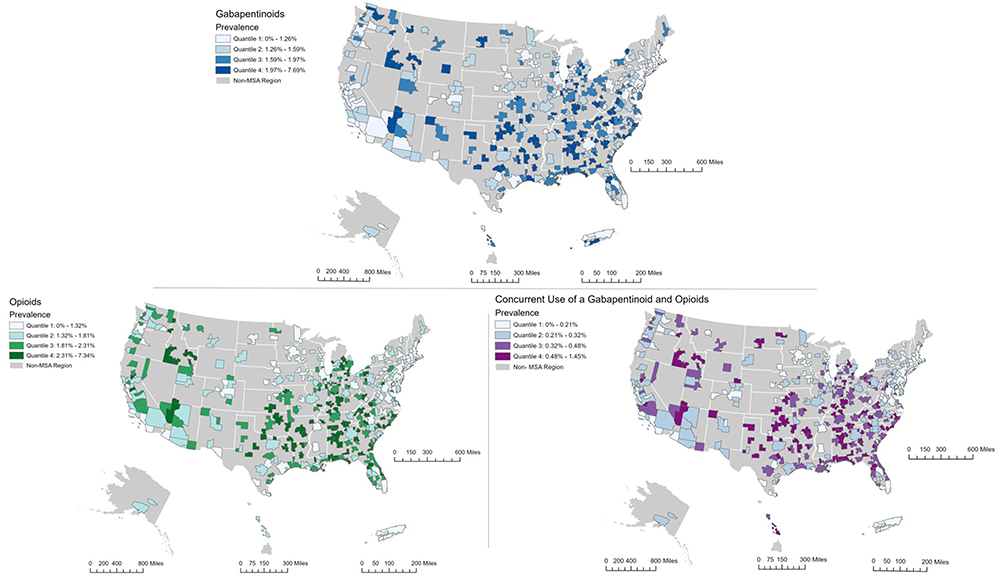 |
Figure 2 The prevalence of gabapentinoids and/or opioids for pain in the US by metropolitan statistical areas. Data were calculated from the IBM® MarketScan® Research Databases on December 1, 2018. The figures were generated from ArcGIS Pro. Shape data of 2018 US states and metropolitan statistical areas from IPUMS National Historical Geographic Information System (NHGIS) were used: Manson, S., Schroeder, J., Van Riper, D., Kugler, T., and Ruggles, S. (2020). IPUMS National Historical Geographic Information System (15.0) [Computer software]. Minneapolis, MN: IPUMS. http://doi.org/10.18128/D050.V15.0.41 |
Geographic Variation in Opioids
In total, 1.5% of the beneficiaries used opioids (average daily dose: 13 MME/day (SD=18.5)). The prevalence of opioids varied across states (median: 1.5%; IQR: 1.2–1.9%) and MSAs (median: 1.8%; IQR: 1.3–2.3%) in a similar fashion to gabapentinoids (Figures 1 and 2). The states with the higher and lower prevalence of opioids also had, in general, higher and lower prevalence of gabapentinoids, respectively (Figures 1 and 2). One exception was Puerto Rico, which had one of the highest prevalence of gabapentinoids but the lowest prevalence of opioids in the nation. Similarly to gabapentinoids, higher prevalence of opioid use did not necessarily lead to higher daily dose of opioids within a state or MSA and vice versa (eFigure 4).
Geographic Variation in Concurrent Use of a Gabapentinoid and Opioids
Concurrent users of a gabapentinoid and opioids made up 0.3% of the sample. For this analgesic regimen, the average daily dose was low for opioids and gabapentin but medium for pregabalin (opioids: 16 MME (SD=21.2); gabapentin: 352 mg (SD=26.8); pregabalin: 288 mg (SD=63.6)). Concurrent use of both a gabapentinoid and opioids varies across states (median: 0.3%; IQR: 0.2–0.4%) and MSAs (median: 0.3%; IQR: 0.2–0.5%) in a similar way to gabapentinoids and opioids (Figures 1 and 2). In parallel with gabapentinoids and opioids, higher prevalence of concurrent use within a state/MSA did not necessarily lead to higher daily dose used within a state/MSA and vice versa (eFigure 5 and 6). The following MSAs had high daily doses of pregabalin use (≥300 mg/day): Santa Rosa-CA, Florence-Muscle Shoals-AL, Dubuque-IA, Harrisonburg-VA, Barnstable Town-MA, Bellingham-WA, Fargo-ND-MN, Merced-CA and Farmington-NM (eFigure 6).
Factors Associated with Gabapentinoids and/or Opioids
For gabapentinoids, as compared to beneficiaries aged 18–34 years, beneficiaries in the older age groups had higher prevalence of gabapentinoid use after adjusting for covariates (adjusted OR (aOR)gabapentinoids (55–64 vs 18–34)=4.17, 95% CI = (4.07–4.26) (Table 2). Similar trends were observed for opioids (aOR opioids (55–64 vs 18–34)= 3.48, 95% CI = (3.41–3.55)) and concurrent use of both medications (aOR both (55–64 vs 18–34)= 4.63, 95% CI = (4.35–4.94)). Women had higher prevalence of gabapentinoid use compared to men (aORgabapentinoids=1.11, 95% CI = (1.10–1.13)) but lower prevalence of opioid use (aORopioids=0.88, 95% CI = (0.87–0.89)) and concurrent use of both (aORboth=0.95, 95% CI = (0.93–0.98)). Among painful conditions, the factor most strongly associated with gabapentinoids and concurrent use of both was neuropathic pain (aORgabapentinoids=7.35, 95% CI = (7.24–7.46); aORboth=7.16, 95% CI = (6.92–7.41)), and that strongly associated with opioids was chronic pain (aORopioids=5.20, 95% CI = (5.14–5.27)). Among all adjuvant analgesics, adjuvant muscle relaxant use was the strongest predictor of gabapentinoids use (aORgabapentinoids=3.37, 95% CI = (3.29–3.44)) and concurrent use of both (aORboth=4.03, 95% CI = (3.89–4.17)), and cannabis use was the strongest predictor of opioid use (aORopioids=8.42, 95% CI = (6.32–11.22)).
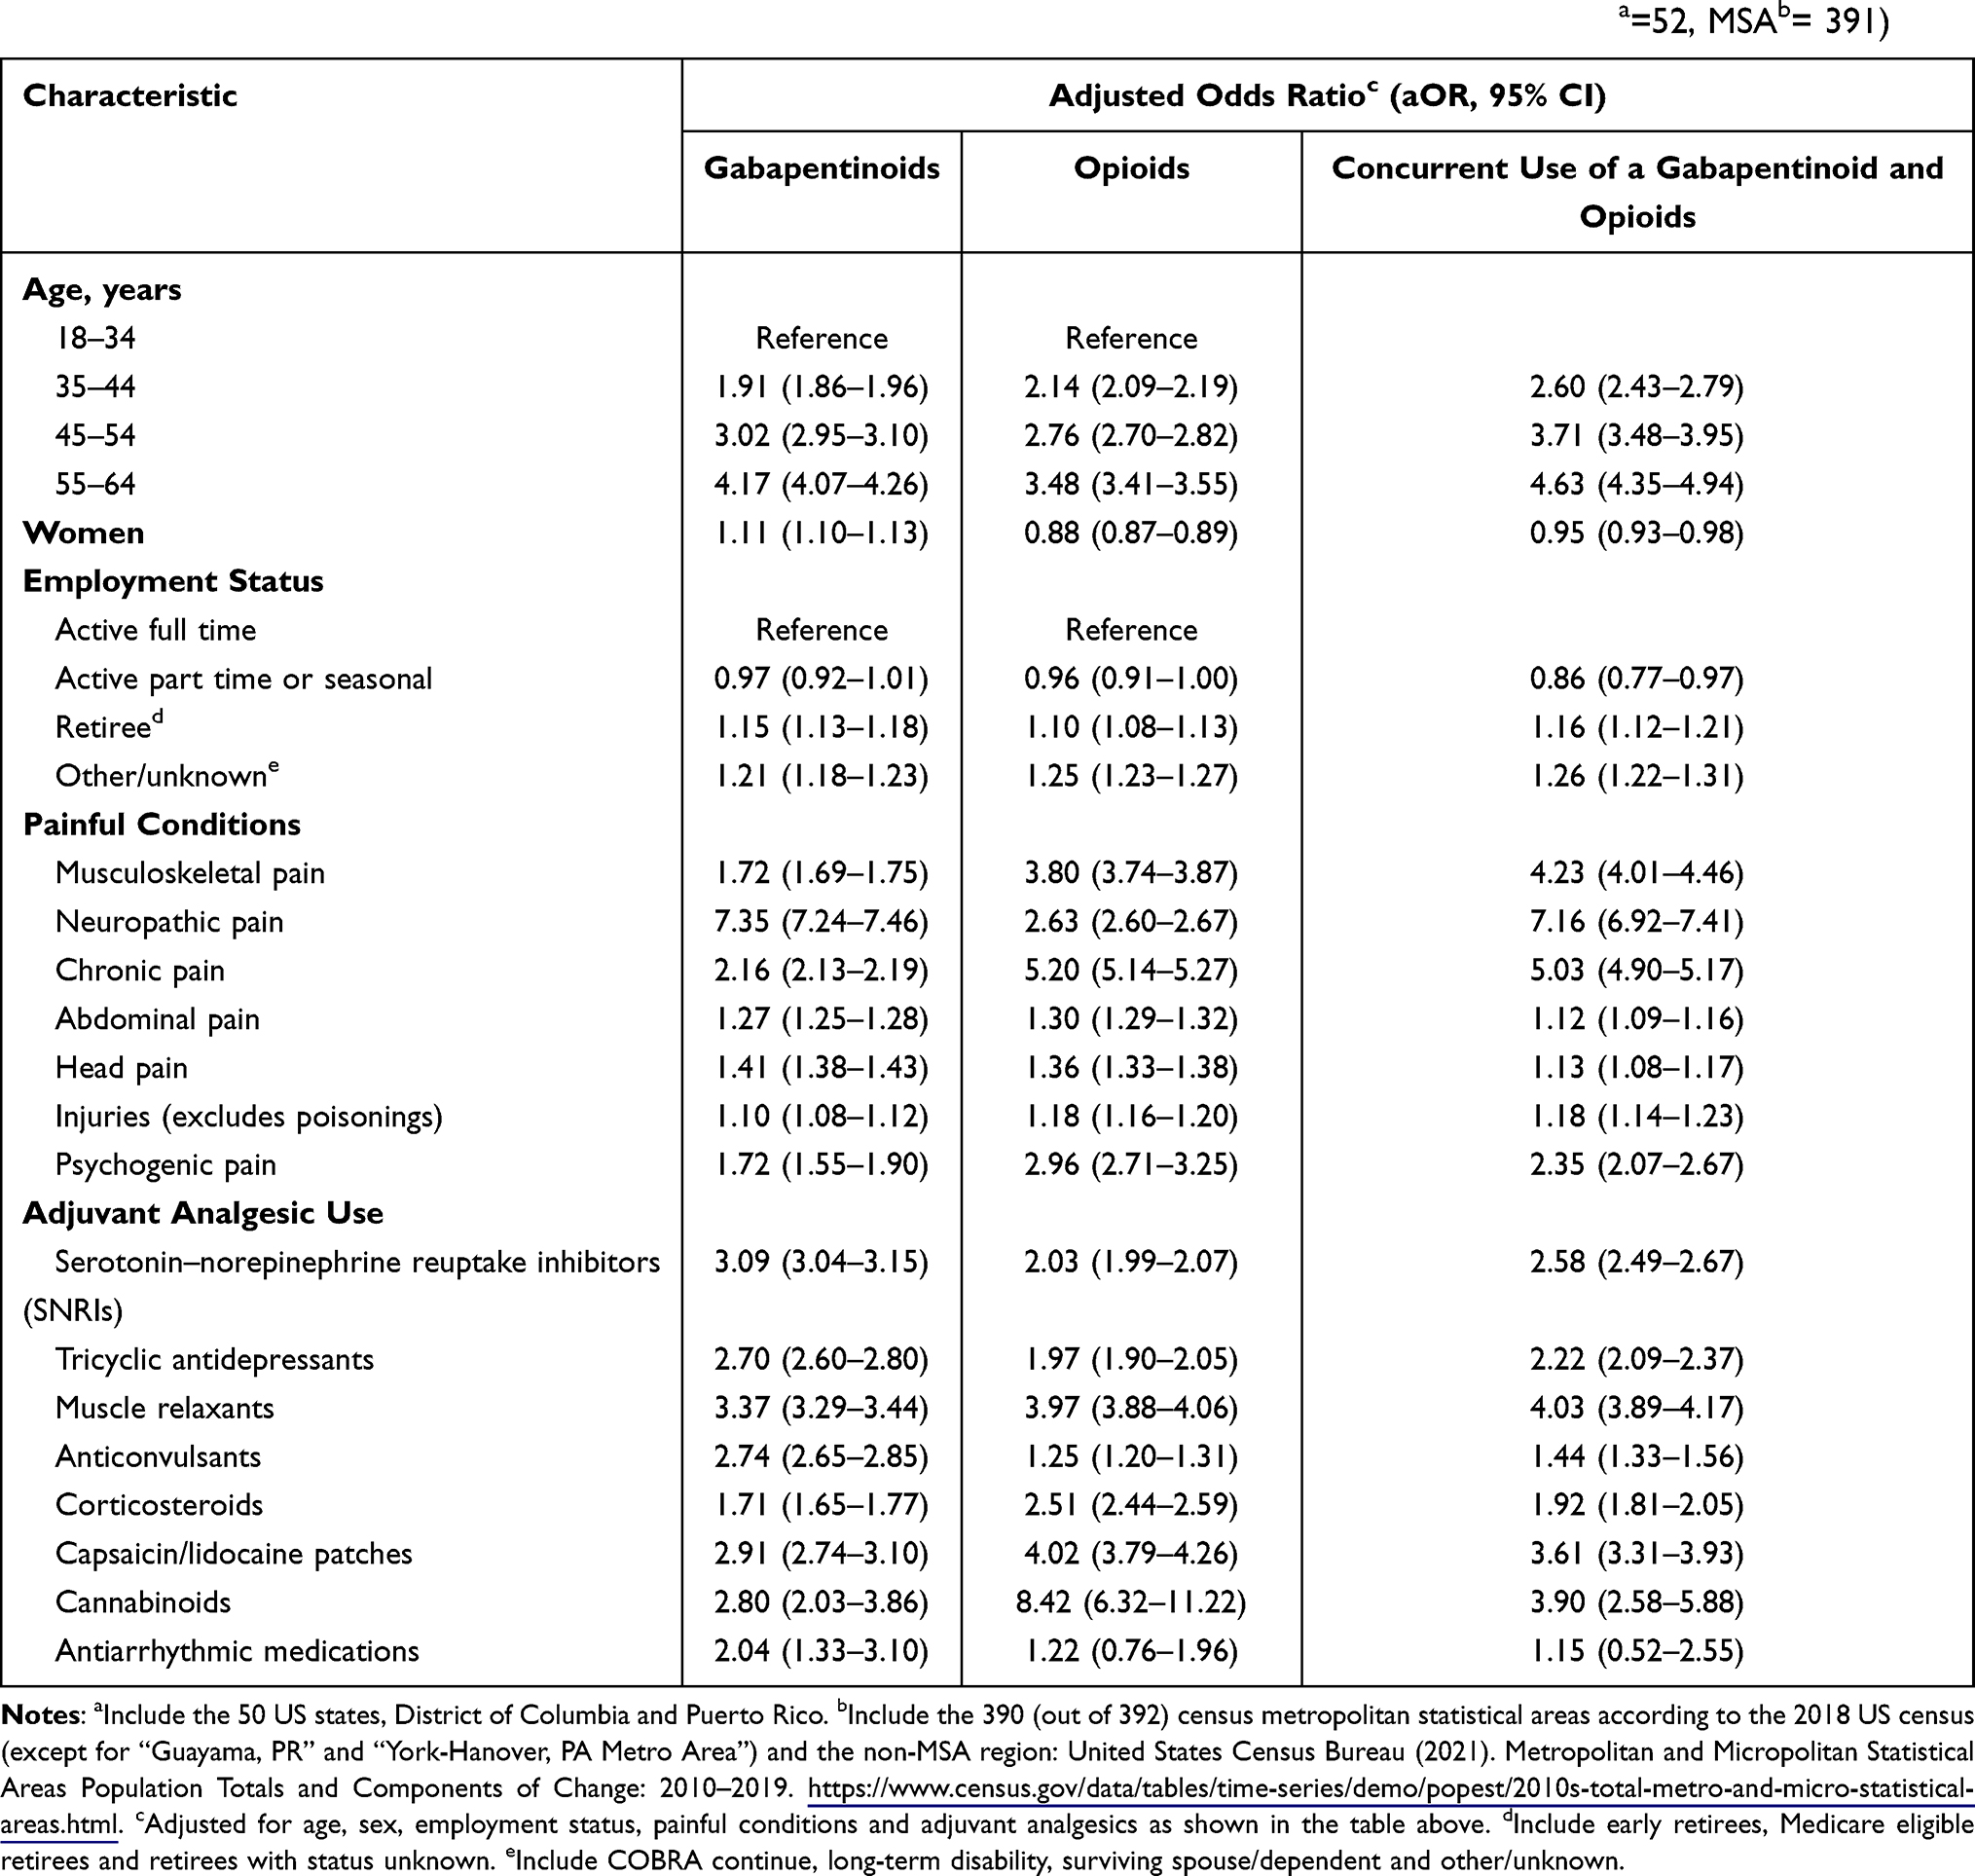 |
Table 2 Factors Associated with Gabapentinoids, Opioids and Concurrent Use of Both (n=9,314,197, Statea=52, MSAb= 391) |
Factors Explaining the Geographic Variation
Demographics, painful conditions and adjuvant analgesic use together explained the majority of the between-state and between-MSA variation for gabapentinoids (PCVstate=86.5%; PCVMSA = 86.9%), opioids (PCVstate=80.4%; PCVMSA=80.3%), and concurrent use of both medications (PCVstate = 91.0%; PCVMSA = 89.9%) (Table 3). Demographics explained the largest proportion of the between-state and between-MSA variations (opioids: PCVstate=78.1%, PCVMSA=78.9%; gabapentinoids: PCVstate=79.5%, PCVMSA = 82.3%; both: PCVstate=87.2%, PCVMSA=87.6%). The total variance in the analgesic regimens explained by states was similar to that explained by MSAs (eg, gabapentinoids: VPCstate = 0.0020, VPCMSA = 0.0018).
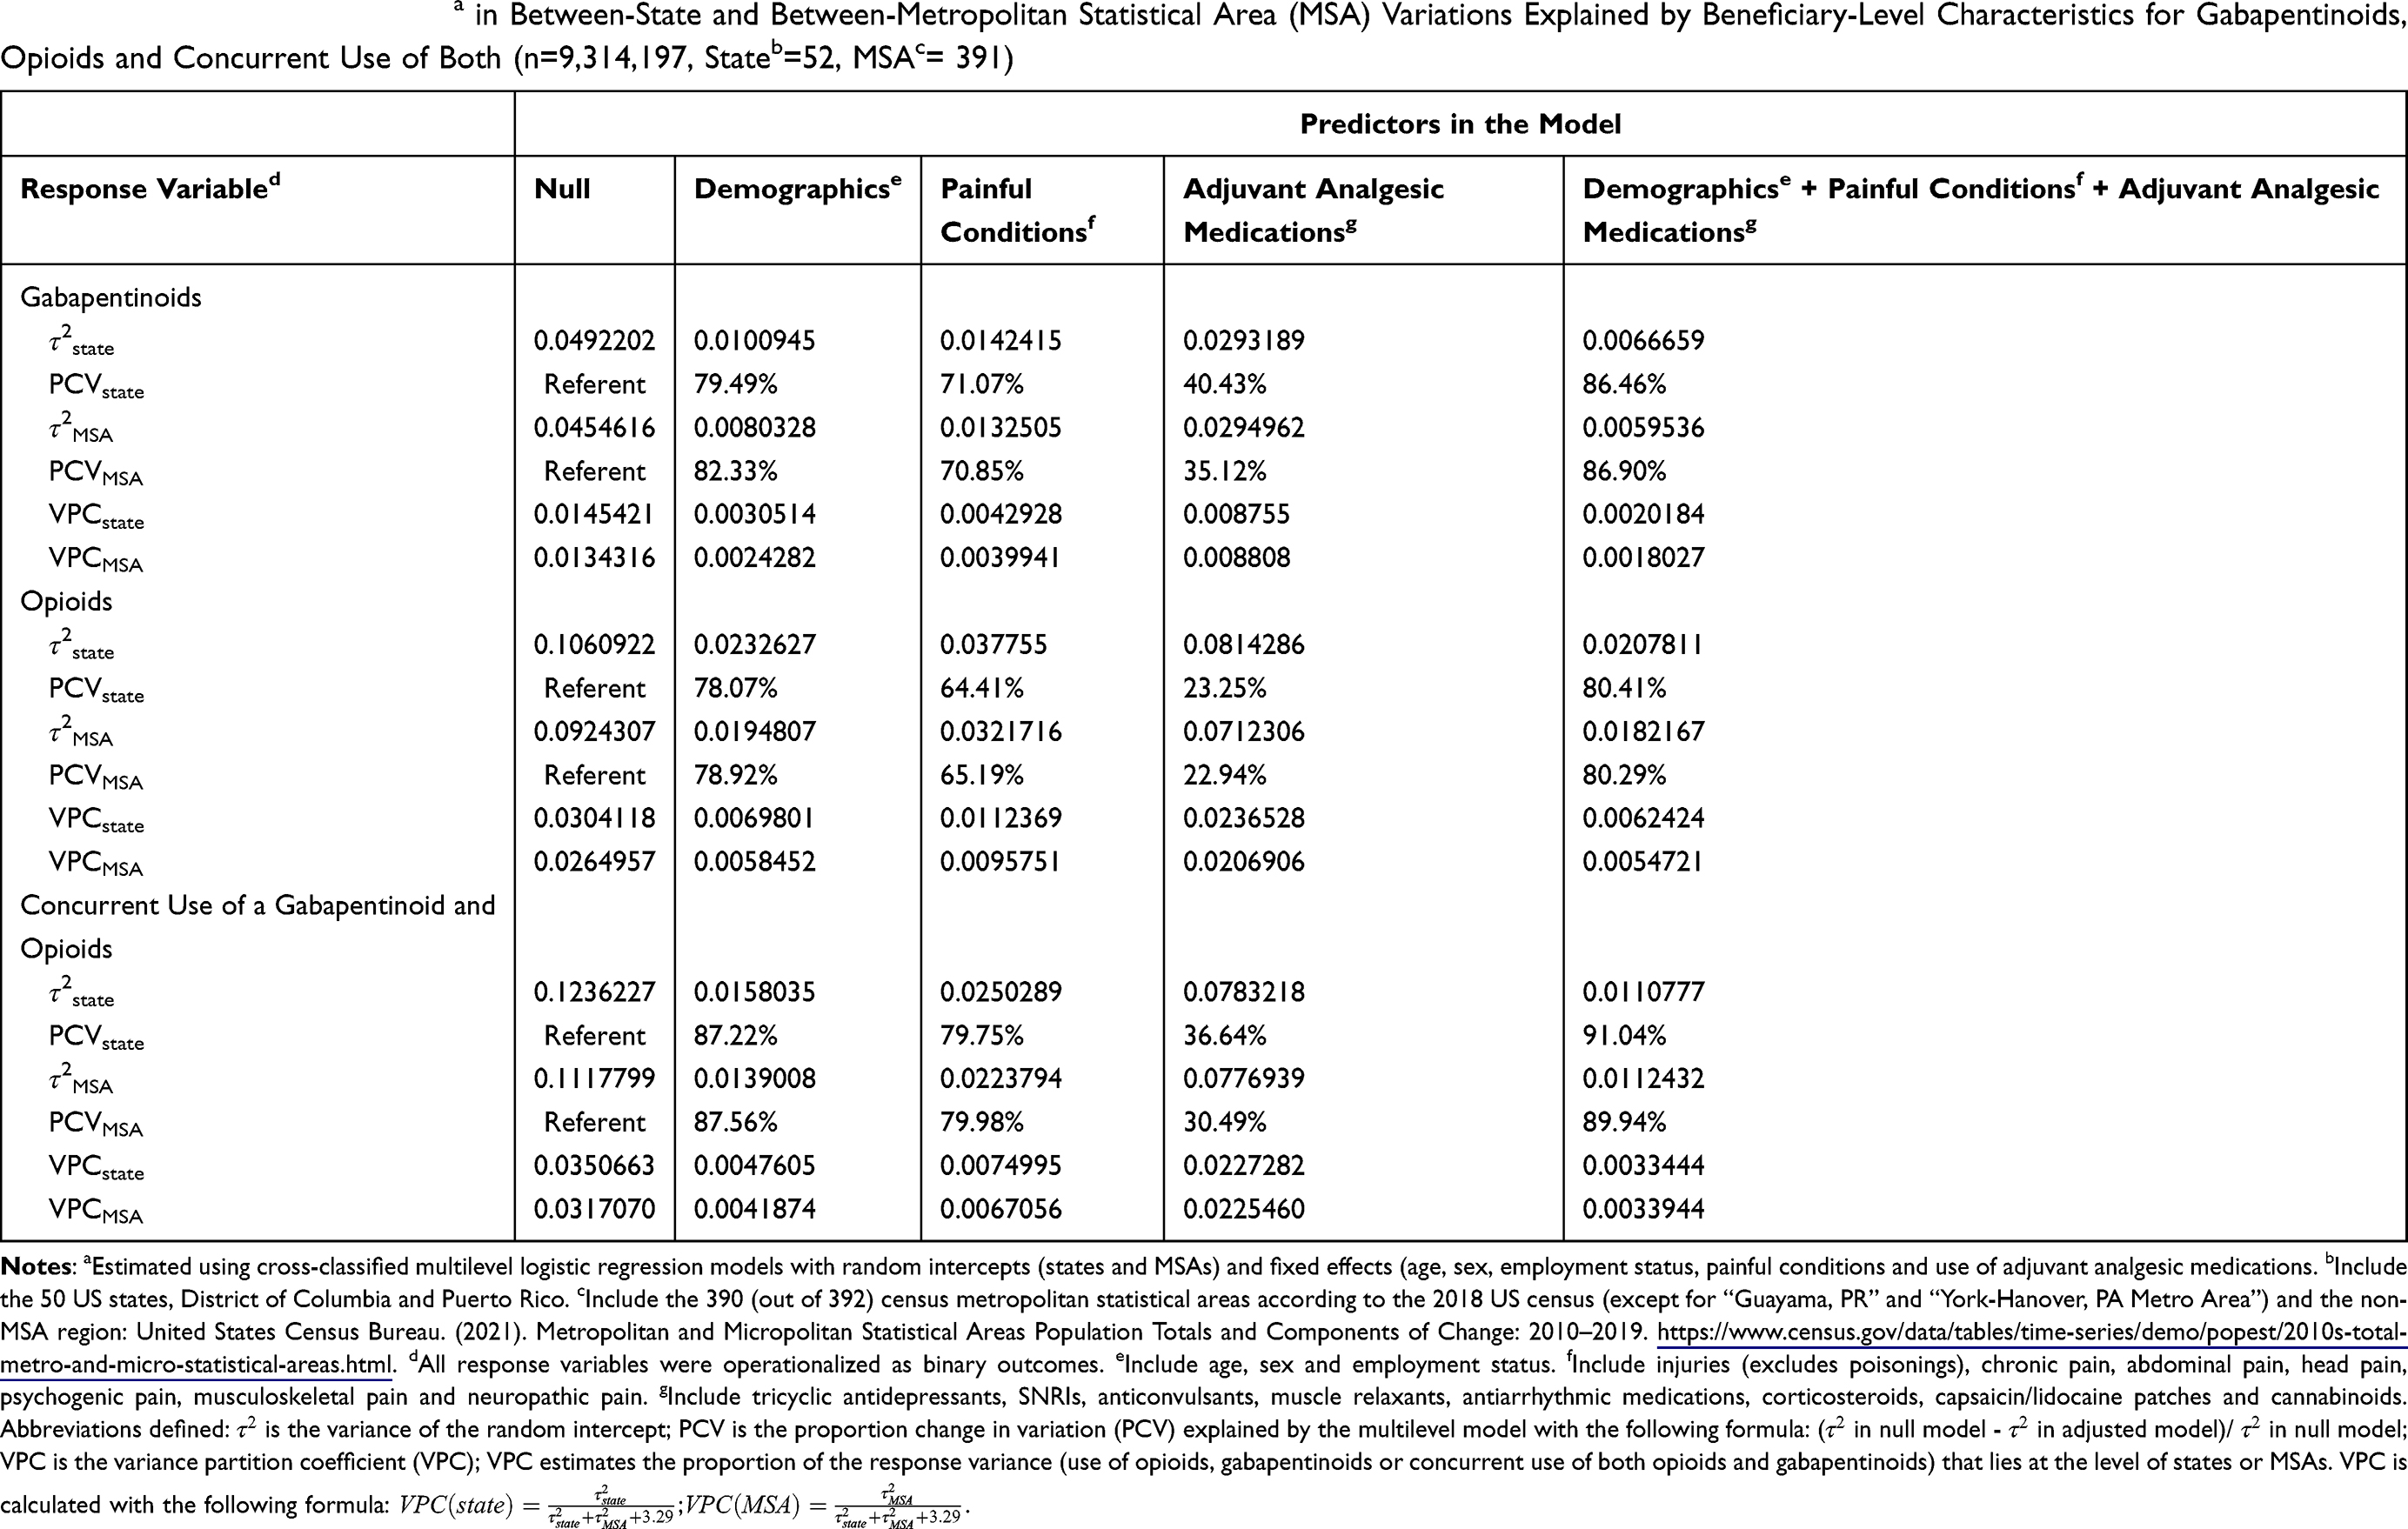 |
Table 3 The Proportion Changesa in Between-State and Between-Metropolitan Statistical Area (MSA) Variations Explained by Beneficiary-Level Characteristics for Gabapentinoids, Opioids and Concurrent Use of Both (n=9,314,197, Stateb=52, MSAc= 391) |
Discussion
We found that gabapentinoids were as commonly used as opioids for pain in a commercially insured population, potentially for a variety of painful conditions including musculoskeletal, neuropathic, chronic, abdominal, head pain and injuries. The pattern of the between-state and between-MSA variations in gabapentinoids and concurrent use of a gabapentinoid and opioids was similar to that of opioids alone.
The majority of the gabapentinoid use appeared to be for off-label indications, despite lacking evidence to support the off-label prescribing of gabapentinoids for pain management.5,6 A Cochrane review concluded that gabapentin therapy for neuropathic pain other than PHN (an approved indication) and diabetic neuropathy had limited evidence.32 Existing evidence on gabapentin’s benefits in alleviating pain for those with diabetic neuropathy was mixed, with limited support for beneficial effects for other pain types.5,28–31,33,48–50 One study found that preventive use of gabapentin during chemoradiation was effective in reducing pain in patients with head and neck cancers.48 Recent clinical studies assessing preoperative use of gabapentinoids on postoperative pain relief had mixed findings.49,50 Nevertheless, both pre-procedure and perioperative use of gabapentinoids were irrelevant to outpatient settings where gabapentinoids might be commonly prescribed.5 Due to the lack of evidence on the effectiveness and safety of the off-label use of gabapentinoids for pain, their use bears potential safety concerns. Besides gabapentinoids’ common sides effects and addiction potential,6,34 concurrent use of gabapentinoids and opioids is associated with increased risks of opioid-related adverse events such as opioid-related deaths9 and elevated risk of respiratory depression36 as compared to opioids alone. Without clear evidence supporting the off-label use and dosing of gabapentinoids for painful indications, this usage of gabapentinoids can carry substantial risks for patients.
We documented geographic variations in the prevalence and average daily dose of gabapentinoids, opioids, and concurrent use of both across the US states and MSAs. Few studies on geographic variation in gabapentinoids were available in the US. One nationwide study on gabapentin prescribing among commercially insured individuals in 2016 found that states in the southern regions tended to have the highest prevalence of gabapentin, including Kentucky, Alabama, Louisiana, Oklahoma and Mississippi.10 These findings were generally consistent with ours, and the discrepancy was likely due to the authors including gabapentin alone. Our findings on the geographic variation of opioid use across states was in parallel with previous research.11 Significant disparities in key opioid prescribing measures existed across the US in 2017, including annual opioid prescriptions and annual mean MME per person.11 Furthermore, we observed a similar pattern of geographic variations in the prevalence of gabapentinoids to that of opioids. The high prevalence of gabapentinoids was observed in states where high prevalence of opioids and concurrent use of both analgesics were also seen. The consistency in the pattern of geographic variations in gabapentinoids and opioids may indicate that gabapentinoids were used as pain medications in a fashion that resembles opioids. Adding to the existing evidence in clinical settings,4,5,9 our findings provided real-world evidence suggesting that gabapentinoids may be widely used as alternatives or adjuvants to opioids for pain management across the US. This can represent an unmet need in pharmacological pain management using opioids alone. Further research should be conducted to evaluate the appropriate use of gabapentinoids as analgesics.
Reasons underlying the observed geographic variations in gabapentinoids and/or opioids were likely multifactorial. Our analyses suggested that the geographic variations in the analgesic regimens were mostly caused by differences in demographics, prevalence of painful comorbidities, and use of adjuvant analgesics across states and MSAs. Among all these factors, the differences in demographics (age, sex and employment status) across geographic regions accounted for the largest proportion of the between-state and between-MSA variations in the analgesic regimens. Specifically, we found that older age was positively associated with the use of gabapentinoids and concurrent use of both analgesics. Women were more likely than men to use of gabapentinoids but less likely to use opioids and concurrent use of both analgesics. Our finding relating to gender and gabapentinoid use was consistent with some,38–40 but not all studies.35 One UK study found that the higher the proportions of women in a general practice region, the lower the use of gabapentinoids.35 This contradicts our finding; however, the discrepancy was likely caused by the differences in handling aggregated data and that their study population may have been different from a US commercially insured population. Furthermore, there may be an overlap of geographic variations in the analgesic regimens explained by disparities in demographic profiles and prevalence of painful conditions, for example, an aging population would likely have higher prevalence of painful comorbidities.43 Studies on factors driving high use of gabapentinoids and/or opioids in specific states/MSAs could be an important next step in further research.
A few other factors could have also driven the observed geographic variations in the analgesic regimens but were not examined in the study due to limitations of the data source, which warrant future research. First, legislations and policies on gabapentinoids and opioids varied by state. Gabapentin, the mainly prescribed gabapentinoid in the US, is an uncontrolled substance at the federal substance and in most states.37 By December 2018, only 12 states included gabapentin in prescription drug monitoring programs (PDMP) and/or made gabapentin a Schedule V controlled substance.37 These measures were effective in curbing gabapentin use and the effects varies by states (Unpublished under review document). Similarly, differences in state interventions on opioid prescribing might in part explain the observed between-state variations in opioids. These included passes of pain clinic laws, use of PDMPs, adoption of guidelines on reduced opioids prescribing related to dose and duration, requirements of opioid-related education among clinicians and pharmacists, and reimbursement systems within states.11,44–46 Additionally, although we did not have information on beneficiaries’ race/ethnicity, prior research demonstrated that prescriber bias may affect prescribing opioids for chronic pain to black patients.47 As compared to white patients, black patients reported higher level of pain but were prescribed with lower maximum daily dose of opioids.47 Different racial/ethnic profiles across geographic regions could potentially contribute to the disparity in gabapentinoid and opioid use for pain.
Limitations
The study population was commercially insured adults. Our findings cannot be generalized to the pediatric population, older adults, and those who were enrolled in Medicare/Medicaid plans. Over-the-counter pain medications and non-pharmacological pain treatment are typically not available in claims databases, nor were indications for medications. We used well-defined proxy measures to assess the proportion of gabapentinoids that were used off-label for pain. We believed the magnitude of such measurement errors should be minor. Although we assumed that most off-label gabapentinoid use in our study was for painful conditions, a small proportion can be used for non-painful conditions such as for vasomotor symptoms associated with the menopause, restless leg syndrome, and bipolar disorder. We were unable to adjust for measures of socioeconomic status, race/ethnicity, and pain severity.
Conclusion
Gabapentinoids were as commonly used as opioids for pain management in a commercially insured population despite that the majority of gabapentinoid use appeared to be off-label, with little evidence supporting their safety and effectiveness. We documented between-state and between-MSA variations in opioids, gabapentinoids and concurrent use of both for pain where a majority of the observed variations was explained by differences in demographics across states or MSAs, rather than painful conditions. The pattern of the geographic variation in gabapentinoids was similar to that of opioids across states and MSAs, suggesting they may be widely used as alternatives or adjuvants to opioids across the country.
Data Sharing Statement
Data are not publicly available and per terms of our data use agreement, we are unable to share the data. Data are available from IBM through licensing and data use agreements.
Ethics Approval
This study was exempt from UMass Chan Medical School Institutional Review Board review because it was classified as non-human subject research.
Acknowledgments
We thank Dr Robin E. Clark (UMass Chan Medical School) for his help in providing feedback on the manuscript.
Disclosure
This study did not receive any specific grant from funding agencies in the public, commercial, or not-for-profit sectors. All authors declare no conflicts of interest.
References
1. Economic toll of opioid crisis in U.S. exceeded $1 trillion since 2001. Altarum; 2018. Available from: https://altarum.org/news/economic-toll-opioid-crisis-us-exceeded-1-trillion-2001.
2. Wide-ranging online data for epidemiologic research (WONDER). Atlanta, GA: CDC, National Center for Health Statistics; 2020. Available from: http://wonder.cdc.gov.
3. Dowell D, Haegerich TM, Chou R. CDC guideline for prescribing opioids for chronic pain - United States, 2016. MMWR Recomm Rep. 2016;65(1):1–49. doi:10.15585/mmwr.rr6501e1
4. Goodman CW, Brett AS. A clinical overview of off-label use of gabapentinoid drugs. JAMA Intern Med. 2019;179(5):695–701. doi:10.1001/jamainternmed.2019.0086
5. Goodman CW, Brett AS. Gabapentin and pregabalin for pain — is increased prescribing a cause for concern? N Engl J Med. 2017;377(5):411–414. doi:10.1056/NEJMp1704633
6. Radley DC, Finkelstein SN, Stafford RS. Off-label prescribing among office-based physicians. Arch Intern Med. 2006;166(9):1021–1026. doi:10.1001/archinte.166.9.1021
7. Johansen ME. Gabapentinoid use in the United States 2002 through 2015. JAMA Intern Med. 2018;178(2):292–294. doi:10.1001/jamainternmed.2017.7856
8. IQVIA Institute for human data science. Medicine use and spending in the U.S.: a review of 2017 and outlook to 2022; 2018. Available from: https://www.iqvia.com/institute/reports/medicine-use-and-spending-in-the-us-review-of-2017-outlook-to-2022.
9. Gomes T, Juurlink DN, Antoniou T, Mamdani MM, Paterson JM, van den Brink W. Gabapentin, opioids, and the risk of opioid-related death: a population-based nested case–control study. PLoS Med. 2017;14:10. doi:10.1371/journal.pmed.1002396
10. Pauly NJ, Delcher C, Slavova S, Lindahl E, Talbert J, Freeman PR. Trends in gabapentin prescribing in a commercially insured U.S. adult population, 2009–2016. J Manag Care Spec Pharma. 2020;26(3):246–252. doi:10.18553/jmcp.2020.26.3.246
11. Schieber LZ, Guy GP, Seth P, et al. Trends and patterns of geographic variation in opioid prescribing practices by state, United States, 2006–2017. JAMA Netw Open. 2019;2(3):e190665–e190665. doi:10.1001/jamanetworkopen.2019.0665
12. IBM Watson Health. White paper: IBM marketscan research databases for health services researchers. 2018.
13. Kalilani L, Faught E, Kim H, et al. Assessment and effect of a gap between new-onset epilepsy diagnosis and treatment in the US. Neurology. 2019;92(19):e2197–e2208. doi:10.1212/WNL.0000000000007448
14. American Academy of Neurology. ICD-9 to ICD-10 conversion of epilepsy; 2021. Available from: https://www.aan.com/siteassets/home-page/tools-and-resources/practicing-neurologist–administrators/billing-and-coding/icd-10-cm/16aanepilepsycrosswalk_tr.pdf.
15. Orhurhu V, Olusunmade M, Urits I, et al. Trends of opioid use disorder among hospitalized patients with chronic pain. Pain Pract. 2019;19(6):656–663. doi:10.1111/papr.12789
16. Weinmayr G, Dreyhaupt J, Jaensch A, et al. Multilevel regression modelling to investigate variation in disease prevalence across locations. Int J Epidemiol. 2017;46(1):336–347. doi:10.1093/ije/dyw274
17. U.S. Center for Disease Control and Prevention. Calculating total daily dose of opioids for safer dosage. Available from: https://www.cdc.gov/drugoverdose/pdf/calculating_total_daily_dose-A.pdf.
18. Center for Medicare and Medicaid Services. Opioid oral Morphine Milligram Equivalent (MME) conversion factors; 2017. Available from: https://www.cms.gov/Medicare/Prescription-Drug-coverage/PrescriptionDrugCovContra/Downloads/Opioid-Morphine-EQ-Conversion-Factors-Aug-2017.pdf.
19. Lyrica (Pregabalin): FDA label. U.S. Food and Drug Administration. Available from: https://www.accessdata.fda.gov/drugsatfda_docs/label/2018/021446s035,022488s013lbl.pdf.
20. Neurontin (Gabapentin): FDA label. U.S. Food and Drug Administration. Available from: https://www.accessdata.fda.gov/drugsatfda_docs/label/2017/020235s064_020882s047_021129s046lbl.pdf.
21. Shaping long term care in America project at Brown University funded in part by the National Institute on Aging. 1P01AG027296. Available from: http://ltcfocus.org/.
22. Kuzucan A. Optimizing pain management in medically complex long-term care residents; 2021. Available from: https://archive.hshsl.umaryland.edu/bitstream/handle/10713/15781/Kuzucan_umaryland_0373D_11238.pdf?sequence=1&isAllowed=y.
23. Owen-Smith A, Stewart C, Sesay MM, et al. Chronic pain diagnoses and opioid dispensings among insured individuals with serious mental illness. BMC Psychiatry. 2020;20. doi:10.1186/s12888-020-2456-1
24. Berger A, Dukes EM, Oster G. Clinical characteristics and economic costs of patients with painful neuropathic disorders. J Pain. 2004;5(3):143–149. doi:10.1016/j.jpain.2003.12.004
25. Hunnicutt JN, Baek J, Alcusky M, et al. Geographic variation in the initiation of commonly used opioids and dosage strength in United States nursing homes. Med Care. 2018;56(10):847–854. doi:10.1097/MLR.0000000000000972
26. Hunnicutt JN, Ulbricht CM, Tjia J, et al. Pain and pharmacologic pain management in long-stay nursing home residents. Pain. 2017;158(6):1091–1099. doi:10.1097/j.pain.0000000000000887
27. Metropolitan and micropolitan statistical areas population totals and components of change: 2010–2019. United States Census Bureau; 2010. Available from: https://www.census.gov/data/tables/time-series/demo/popest/2010s-total-metro-and-micro-statistical-areas.html.
28. Rauck R, Makumi CW, Schwartz S, et al. A randomized, controlled trial of gabapentin enacarbil in subjects with neuropathic pain associated with diabetic peripheral neuropathy. Pain Pract. 2013;13(6):485–496. doi:10.1111/papr.12014
29. Sandercock D, Cramer M, Biton V, et al. A gastroretentive gabapentin formulation for the treatment of painful diabetic peripheral neuropathy: efficacy and tolerability in a double-blind, randomized, controlled clinical trial. Diabetes Res Clin Pract. 2012;97(3):438–445. doi:10.1016/j.diabres.2012.03.010
30. Backonja M, Beydoun A, Edwards KR, et al. Gabapentin for the symptomatic treatment of painful neuropathy in patients with diabetes mellitus: a randomized controlled trial. JAMA. 1998;280(21):1831–1836. doi:10.1001/jama.280.21.1831
31. Gorson KC, Schott C, Herman R, et al. Gabapentin in the treatment of painful diabetic neuropathy: a placebo controlled, double blind, crossover trial. J Neurol Neurosurg Psychiatry. 1999;66(2):251–252. doi:10.1136/jnnp.66.2.251
32. Wiffen PJ, Derry S, Bell RF, et al. Gabapentin for chronic neuropathic pain in adults. Cochrane Database Syst Rev. 2017;6:CD007938. doi:10.1002/14651858.CD007938.pub4
33. Mathieson S, Maher CG, McLachlan AJ, et al. Trial of pregabalin for acute and chronic sciatica. N Engl J Med. 2017;376(12):1111–1120. doi:10.1056/NEJMoa1614292
34. Schifano F. Misuse and abuse of pregabalin and gabapentin: cause for concern? CNS Drugs. 2014;28(6):491–496. doi:10.1007/s40263-014-0164-4
35. Gu X, Chen TC, Su TL, et al. Investigating the prescribing trajectory and geographical drug utilisation patterns of gabapentinoids in primary care in England: an ecological study. Br J Clin Pharmacol. 2021;87(10):4001–4012. doi:10.1111/bcp.14827
36. Ongley D, Hayward AK, Allan C.Severe respiratory depression associated with perioperative opioid-sparing gabapentin use. Anaesth Intensive Care. 2014;42(1):136–137.
37. Peckham AM, Ananickal MJ, Sclar DA. Gabapentin use, abuse, and the US opioid epidemic: the case for reclassification as a controlled substance and the need for pharmacovigilance. Risk Manag Healthc Policy. 2018;11:109–116. doi:10.2147/RMHP.S168504
38. Appleyard T, Ashworth J, Bedson J, et al. Trends in gabapentinoid prescribing in patients with osteoarthritis: a United Kingdom national cohort study in primary care. Osteoarthritis Cartilage. 2019;27(10):1437–1444. doi:10.1016/j.joca.2019.06.008
39. Asomaning K, Abramsky S, Liu Q, et al. Pregabalin prescriptions in the United Kingdom: a drug utilisation study of The Health Improvement Network (THIN) primary care database. Int J Clin Pract. 2016;70(5):380–388. doi:10.1111/ijcp.12791
40. Torrance N, Veluchamy A, Zhou Y, et al. Trends in gabapentinoid prescribing, co-prescribing of opioids and benzodiazepines, and associated deaths in Scotland. Br J Anaesth. 2020;125(2):159–167. doi:10.1016/j.bja.2020.05.017
41. Manson S, Schroeder J, Van Riper D, Kugler T, Ruggles S. IPUMS National Historical Geographic Information System: Version 15.0 [Dataset]. Minneapolis, MN: IPUMS; 2020. doi:10.18128/D050.V15.0
42. National Institute on Drug Abuse. Effective treatments for opioid addiction; 2016. Available from https://www.drugabuse.gov/publications/effective-treatments-opioid-addiction.
43. Tsang A, Von Korff M, Lee S, et al. Common chronic pain conditions in developed and developing countries: gender and age differences and comorbidity with depression-anxiety disorders. J Pain. 2008;9(10):883–891. doi:10.1016/j.jpain.2008.05.005
44. Brandeis University. The prescription drug monitoring program training and technical assistance center; 2018. Available from: http://www.pdmpassist.org/.
45. Rutkow L, Vernick JS, Alexander GC. More states should regulate pain management clinics to promote public health. Am J Public Health. 2017;107(2):240–243. doi:10.2105/AJPH.2016.303568
46. National Conference of State Legislatures. Prescribing policies: states confront opioid overdose epidemic; 2018. Available from: http://www.ncsl.org/research/health/prescribing-policies-states-confront-opioid-overdose-epidemic.aspx.
47. Haq N, McMahan VM, Torres A, et al. Race, pain, and opioids among patients with chronic pain in a safety-net health system. Drug Alcohol Depend. 2021;222:108671. doi:10.1016/j.drugalcdep.2021.108671
48. Smith DK, Cmelak A, Niermann K, et al. Preventive use of gabapentin to decrease pain and systemic symptoms in patients with head and neck cancer undergoing chemoradiation. Head Neck. 2020;42(12):3497–3505. doi:10.1002/hed.26407
49. Hah J, Mackey SC, Schmidt P, et al. Effect of perioperative gabapentin on postoperative pain resolution and opioid cessation in a mixed surgical cohort: a randomized clinical trial. JAMA Surg. 2018;153(4):303–311. doi:10.1001/jamasurg.2017.4915
50. Rai AS, Khan JS, Dhaliwal J, et al. Preoperative pregabalin or gabapentin for acute and chronic postoperative pain among patients undergoing breast cancer surgery: a systematic review and meta-analysis of randomized controlled trials. J Plast Reconstr Aesthet Surg. 2017;70(10):1317–1328. doi:10.1016/j.bjps.2017.05.054
 © 2022 The Author(s). This work is published and licensed by Dove Medical Press Limited. The full terms of this license are available at https://www.dovepress.com/terms.php and incorporate the Creative Commons Attribution - Non Commercial (unported, v3.0) License.
By accessing the work you hereby accept the Terms. Non-commercial uses of the work are permitted without any further permission from Dove Medical Press Limited, provided the work is properly attributed. For permission for commercial use of this work, please see paragraphs 4.2 and 5 of our Terms.
© 2022 The Author(s). This work is published and licensed by Dove Medical Press Limited. The full terms of this license are available at https://www.dovepress.com/terms.php and incorporate the Creative Commons Attribution - Non Commercial (unported, v3.0) License.
By accessing the work you hereby accept the Terms. Non-commercial uses of the work are permitted without any further permission from Dove Medical Press Limited, provided the work is properly attributed. For permission for commercial use of this work, please see paragraphs 4.2 and 5 of our Terms.