")
Back to Journals » OncoTargets and Therapy » Volume 9
Genetic variation rs7930 in the miR-4273-5p target site is associated with a risk of colorectal cancer
Authors Lee AR, Park J, Jung KJ, Jee SH, Kim-Yoon SJ
Received 18 March 2016
Accepted for publication 20 May 2016
Published 7 November 2016 Volume 2016:9 Pages 6885—6895
DOI https://doi.org/10.2147/OTT.S108787
Checked for plagiarism Yes
Review by Single anonymous peer review
Peer reviewer comments 2
Editor who approved publication: Dr William C. Cho
Ah-Reum Lee,1 Jongkeun Park,1 Keum Ji Jung,2 Sun Ha Jee,2 Sungjoo Kim-Yoon1
1Department of Medical Life Sciences, The Catholic University of Korea, Seoul, South Korea; 2Department of Epidemiology and Health Promotion, Institute for Health Promotion, Graduate School of Public Health, Yonsei University, Seoul, Republic of Korea
Purpose: MicroRNAs (miRNAs) are noncoding RNAs that play roles as tumor suppressors or oncogenes by regulating the expression of target genes via binding to seed-match sequences. Polymorphisms in the miRNA-binding site of a target gene can alter miRNA binding and potentially affect the risk of cancer. The objective of this study was to identify single-nucleotide polymorphisms (SNPs) in miRNA-binding sites and assess their involvement in the risk of colorectal cancer (CRC).
Materials and methods: SNPs in the 3' untranslated regions of genes were selected and assessed for their effects on CRC risk in Korean population using participants in Korean Cancer Prevention Study-II. A detailed study was carried out with the SNP rs7930 in the 3' untranslated region of the translocase of outer mitochondrial membrane 20 (TOMM20) gene. A case–control study (1,545 controls and 620 CRC cases) was conducted to analyze the relationship between polymorphism at rs7930 and the risk of CRC. An interacting miRNA was predicted using web-based software programs, and its interaction with rs7930 in CRC cell lines was investigated by using a luciferase assay.
Results: Individuals carrying the rs7930 AG genotype (G allele) had a 1.721-fold increased risk for CRC in comparison with those with the AA genotype (A allele). The miRNA miR-4273-5p was found to specifically interact with the A allele of rs7930 and to suppress the expression of the target gene (TOMM20) in CRC cell lines.
Conclusion: rs7930 is an independent genetic risk factor for CRC susceptibility. Our study suggests a mechanism of how this SNP contributes to CRC carcinogenesis.
Keywords: colorectal cancer, miR-4273-5p, SNP, rs7930, frequency, susceptibility
Introduction
Colorectal cancer (CRC) is the third most common cancer and the fourth leading cause of cancer-related deaths, accounting for 1–2 million new cases and 600,000 deaths per year worldwide.1,2 Like most other cancers, no single risk factor accounts for most CRC cases.3,4 A significant proportion of cases are attributed to heritable genetic conditions that influence not only cancer susceptibility but also its clinical course.5
Single-nucleotide polymorphisms (SNPs) can be used not only as markers for high-throughput screening in genome-wide association studies but also as markers for personalized diagnosis and prediction of disease risks. Furthermore, SNPs can have functional consequences, thus providing a means to understand the mechanism(s) of how genetic factors contribute to disease development.
Functional SNPs can be found in regions where they affect gene structure or expression; such regions include coding sequences, splice junctions, 5′ and 3′ untranslated regions (UTRs), and promoters. SNPs located in the 3′ UTRs of the genes have recently attracted attention because they may affect interactions with microRNAs (miRNAs), whose relationship with tumorigenesis is currently a hot topic of research.6,7
miRNAs affect gene expression by binding to the 3′ UTR of the target mRNA through a seed-match region, leading to translational repression or cleavage of the target mRNA. The same mRNA can be regulated by more than one miRNA, and one miRNA can target and regulate the levels of numerous mRNAs. Thus, functional variations such as SNPs located in the miRNA seed-match region can affect binding affinity of miRNAs to target mRNAs causing differential regulation of target gene expression and alter many molecular pathways simultaneously. As some of these pathways may be associated with tumorigenesis,8 the interaction between miRNAs and SNP-bearing seed-match sequences can eventually affect individual’s cancer risk and can be used for prognostic prediction. A number of such miRNA–SNP pairs have been found for various cancers and some of those are as follows: pre-miR-146a–rs2910164 for thyroid cancer;9 miR-107–rs2296616 and miR-146a–rs2910164 for gastric cancer;10,11 miR-199a–rs2057482 for pancreatic cancer;12 miR-196a-2–rs11614913, miR-520a–rs141178472, and miR-27a–rs895819 for CRC;13–15 miR-196a–rs11614913 for lung cancer;16 and miR-125b–rs1434536 for breast cancer.17
In this study, we sought to find the SNPs that are located in the 3′ UTRs of genes and to assess their effects on susceptibility to CRC. Among the identified SNPs, we further investigated the relationship between rs7930 and the putative interacting miRNA miR-4273-5p. We demonstrated that this SNP located in the 3′ UTR changed the expression of the target gene, which may affect CRC risk of an individual.
Materials and methods
Cell culture
Human colorectal carcinoma cell lines (DLD1, HCT-116, SW620, SNUC4, SNUC5, and LoVo) were cultured in RPMI-1640 medium supplemented with 10% fetal bovine serum (FBS) and 100 U/mL penicillin and streptomycin. CCD18CO, a human colon fibroblast cell line, was cultured in minimum essential medium with 10% FBS and 100 U/mL penicillin and streptomycin. Cells were grown in a 37°C incubator with 5% CO2. The biospecimens for this study were provided by the Ajou Human Bio-Resource Bank, a member of the National Biobank of Korea, which is supported by the Ministry of Health and Welfare. All samples derived from the National Biobank of Korea were obtained with written informed consent under the institutional review board of each member of the National Biobank of Korea.
Study population
The study population in the initial analysis has been described previously.18 Briefly it is composed of 325 patients with confirmed CRC from Korean Cancer Prevention study II and 977 normal individuals as the control group. The genotypes of the patients and the control participants were previously determined using the Affymetrix Human SNP Array 5.0 (Affymetrix, Santa Clara, CA, USA),19 and the demography of the study subjects have been described previously.18
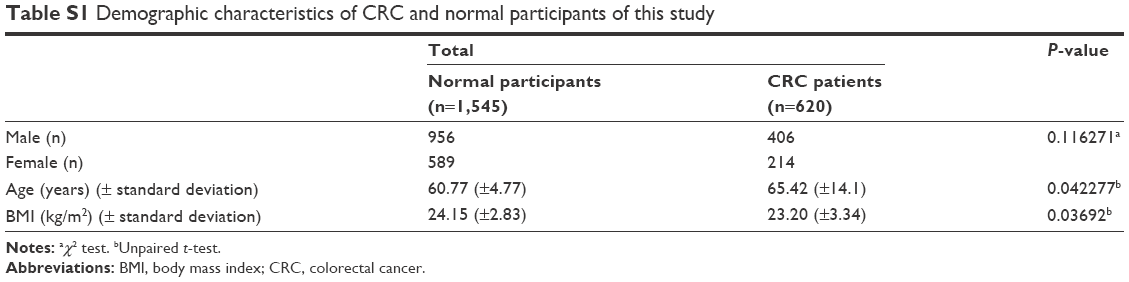
For rs7930 analysis, 297 confirmed CRC patients and 600 normal individuals were added to the already existing study population, resulting in a total of 620 CRC patients and 1,545 controls (Table S1). The cases were obtained from the Ajou Human Bio-Resource Bank (Suwon, Republic of Korea). CRC patients were diagnosed based on the International Classification of Disease for Oncology at Ajou Hospital. The control participants were selected from the Ansung–Ansan cohort study population20 of the Biobank for Health Science of Center for Genome Science in Korea National Institute of Health, and the following criteria were applied: 1) age between 50 and 70 years old, 2) no past medical history of any carcinomas, and 3) no family history of cancers. The genotypes of the control participants for rs7930 were obtained from the previously determined genotypes using the Affymetrix Human SNP Array 5.0 (Affymetrix) – the same platform as in the initial analysis.21,22
Genotyping
Genomic DNA was extracted from cells or tissues from CRC patients using the QIAamp DNA Mini Kit (QIAGEN, Valencia, CA, USA). Genomic DNA was used for genotyping of rs7930 by the SNaPshot method using SNaPshot kit or by sequencing using 3730XL DNA analyzer (Applied Biosystems, Foster City, CA, USA).
Statistical analysis
The χ2 test was used to examine the differences in the distribution of genotype and allele frequencies between cases and controls. Hardy–Weinberg equilibrium (HWE) was also tested in the total study participants using χ2 analysis. A logistic regression analysis was used to evaluate the CRC risk associated with the genotype and alleles of SNPs in comparison to control participants. The odds ratio (OR) and 95% confidence intervals (CIs) of CRC associated with rs7930 genotype was computed and adjusted for age, sex, and body mass index (BMI). Missing data were present only in genotypes, and the individuals with missing genotypes were excluded from the analysis (Table 1). We applied Bonferroni correction to adjust the P-values for the multiple comparisons in all analysis. Using the online power and sample size calculators (http://powerandsamplesize.com), we analyzed the power of this study and found that this sample size had power of 0.7 with χ2 test of two-sided and false discovery rate =0.05. Statistical analysis for the other experiments was carried out using a one-way analysis of variance. All tests were considered statistically significant at P<0.05.
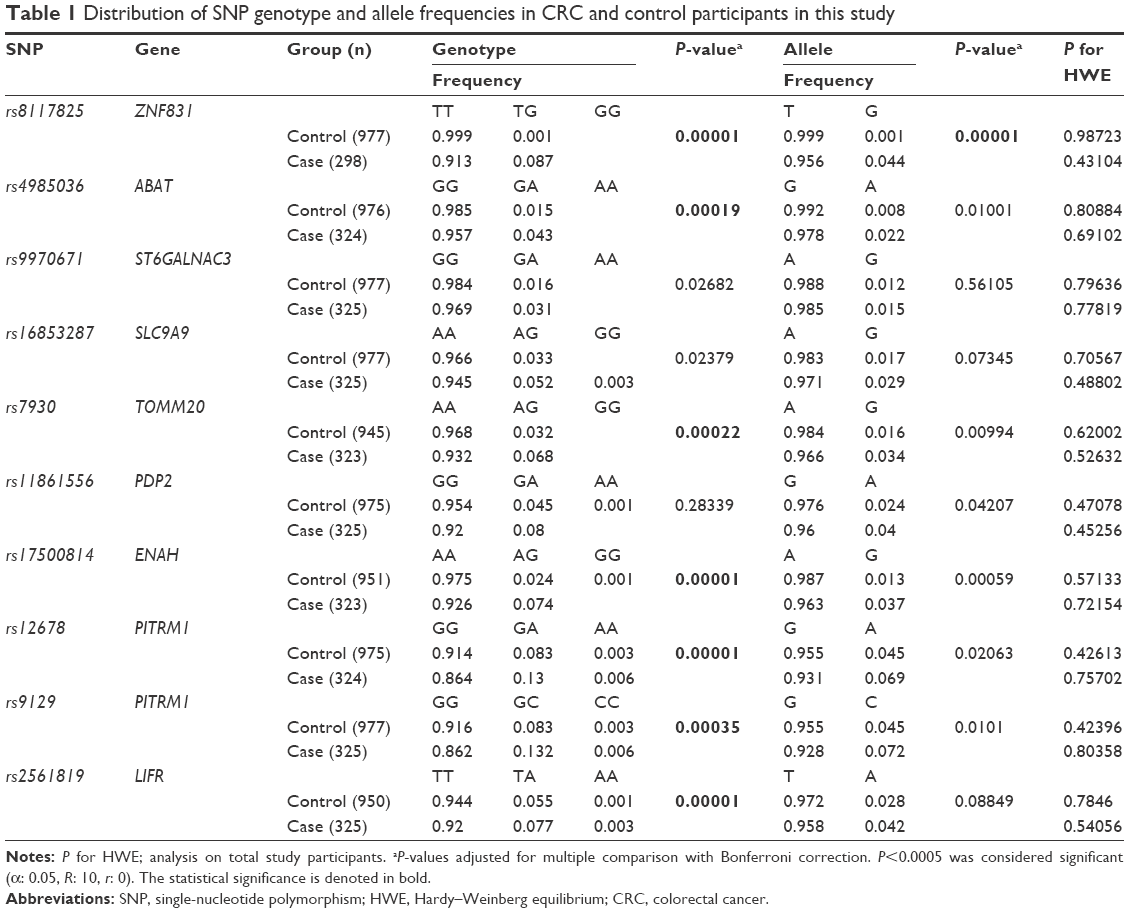 | Table 1 Distribution of SNP genotype and allele frequencies in CRC and control participants in this study |
Construction of reporter plasmid
To construct the luciferase reporter plasmids, the full-length 3′ UTR fragment of human TOMM20 was amplified from genomic DNA of AG genotype cell line because TOMM20 3′ UTR was contained in a single exon. The amplified fragment was cloned in pGEM-T easy vector (Promega Corporation, Fitchburg, WI, USA) and further cloned by inserting the fragment into psiCEHCK-2 dual luciferase vector (Promega Corporation) using the EcoRI restriction site. The A or G allele was verified by sequencing, and the A allele bearing construct was named psiCHECK/h_TOMM20_3′ UTR_A and the G allele bearing construct psiCHECK/h_TOMM20_3′ UTR_G. The sequences for oligonucleotides used for cloning are as follows: F: 5′-GGC CCT TTT CAT TGG GTA CT3′; R: 5′GAA AGC CCA GCT CTC TCC TT-3′. The reporter construct in a dual luciferase reporter vector was used for luciferase assay in the presence of a miR-4273-5p mimic or a negative control RNA.
Transfection and luciferase assay
For transfection of a reporter plasmid, cells were plated on a six-well plate at a density of 1.5×10⁵ cells/well for DLD1, and 2×10⁵ cells/well for HCT116, SW620, and SNUC4 cell lines. Cells were grown overnight and transfected with 25 nM of miRNA mimic using DharmaFECT transfection reagent (Thermo Fisher Scientific, Waltham, MA, USA) following the manufacturer’s instructions. After 24 hours, 1 μg of the reporter plasmid was introduced to the cells using lipofectamine2000 transfection reagent (Thermo Fisher Scientific). The firefly luciferase and renilla luciferase activities were measured at 48 hours after reporter plasmid transfection using the Dual-Luciferase Reporter Assay System (Promega Corporation) and a Luminometer (SpectraMax L, Sunnyvale, CA, USA). Activity of constitutive firefly luciferase in a separate operon served as a transfection control. The renilla luciferase activity was normalized against firefly luciferase activity. The activities are the average of three experiments performed in triplicates.
Western blot analysis
Cells were grown and transfected with 25 nM of miRNA mimic or negative control RNA using DharmaFECT reagent. At 72 hours after transfection, cells were harvested and proteins extracted using radio immunoprecipitation assay lysis buffer (150 mM NaCl, 1% NP-40, 0.5% Na-DCA, 0.1% SDS, 50 mM Tris-HCl [pH 8.0], and protease inhibitor) and quantified by the Bradford assay method (Quick Start™ Bradford Protein Assay; Bio-Rad Laboratories Inc., Hercules, CA, USA). Thirty micrograms of protein was separated on 12% SDS-polyacrylamide gel and then transferred to nitrocellulose membrane (GE Healthcare Life Sciences Whatman™, Little Chalfont, Buckinghamshire, UK). The membrane was incubated with a mouse anti-TOMM20 monoclonal antibody (dilution, 1:5,000, Abcam, Cambridge, UK), or a mouse anti-β-actin monoclonal antibody (dilution, 1:5,000, ABM, Vancouver, BC, Canada,) overnight at 4°C and further incubated with a HRP-conjugated secondary antibody (goat anti-mouse 1:5,000, Santa Cruz Biotechnology Inc., Dallas, TX USA) for 1 hour at room temperature. Signals were detected using a enhanced chemiluminescence solution (Thermo Fisher Scientific). The β-actin gene (ACTB) was used as a loading control. The band intensity was analyzed using ImageJ software (version 1.49; National Institutes of Health, Bethesda, MD, USA) and defined as the ratio of target protein relative to β-actin gene.
Results
Association between SNPs in 3′ UTRs and CRC
To search for SNPs associated with CRC, we selected SNPs located in the 3′ UTRs of genes in the Genome-Wide Human SNP Array 5.0 (Affymetrix), and the χ2 and logistic regression analyses were carried out using the genotype data from the Korean Cancer Prevention Study-II.23 We found 123 SNPs in 111 genes with statistically significant OR (P<0.05) for CRC risk without adjustment for confounding factors. Of these, the top ten risk SNPs were found in nine genes, which encode zinc finger protein 831 (ZNF831), 4-aminobutyrate aminotransferase (ABAT), ST6 (α-N-acetyl-neuraminyl-2,3-β-galactosyl-1,3)-N-acetylgalactosaminide α-2,6-sialyltransferase 3 (ST6GALNAC3), solute carrier family 9, subfamily A, member 9 (SLC9A9), translocase of outer mitochondrial membrane 20 (TOMM20), pyruvate dehydrogenase phosphatase catalytic subunit 2 (PDP2), enabled homologue (ENAH), pitrilysin metallopeptidase 1 (PITRM1), and leukemia inhibitory factor receptor α (LIFR). With the exception of rs4985036 whose minor allele frequency was 0.6%, minor allele frequencies of all the other SNPs were higher than 1% in the study population. All SNPs were in HWE in both controls and cases. The distributions of genotypes and allele frequency for these SNPs in the study population are summarized in Table 1. The genotypes of rs8117825, rs4985036, rs7930, rs17500814, rs12678, rs9129, and rs2561819 SNPs showed significant association with CRC.
Because homozygous individuals were either not found or rarely present for these SNPs in the study population, the logistic regression analysis was performed in dominant model. As listed in Table 2, adjusted logistic regression analyses of ten SNPs showed that only six SNPs (rs8117825, rs7930, rs17500814, rs12678, rs9129, and rs2561819) were associated with elevated risk for CRC. Affected genotypes of six SNPs showed increased risks ranging from 30.12 to 1.262 compared with the other homozygote genotype (Table 2). However, after Bonferroni correction, only rs8117825 and rs7930 remained significant. After adjustment for age, sex, and BMI (the variables that affect the risk of CRC and that hold in our laboratory), rs8117825 TG and GG genotype showed a 30-fold increased risk (95% CI: 4.22–310.2, P=0.0011) compared with the TT genotype. Also, the AG genotype of rs7930 showed a 1.72-fold increased risk for CRC (95% CI: 1.11–3.24, P=0.00623) compared with the AA genotype.
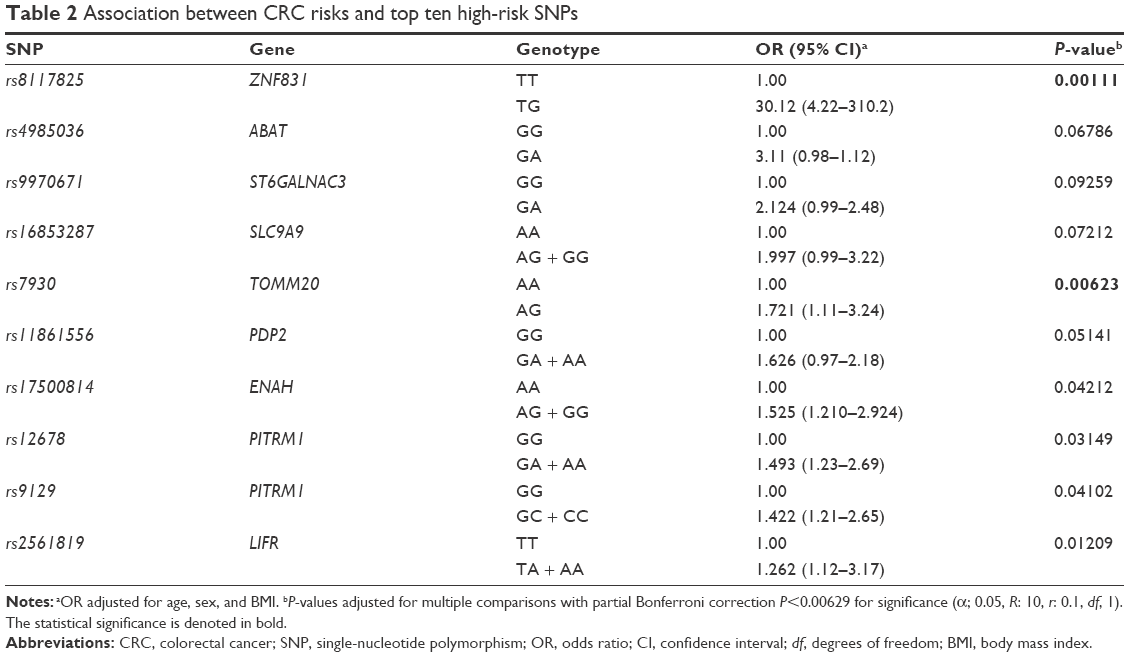 | Table 2 Association between CRC risks and top ten high-risk SNPs |
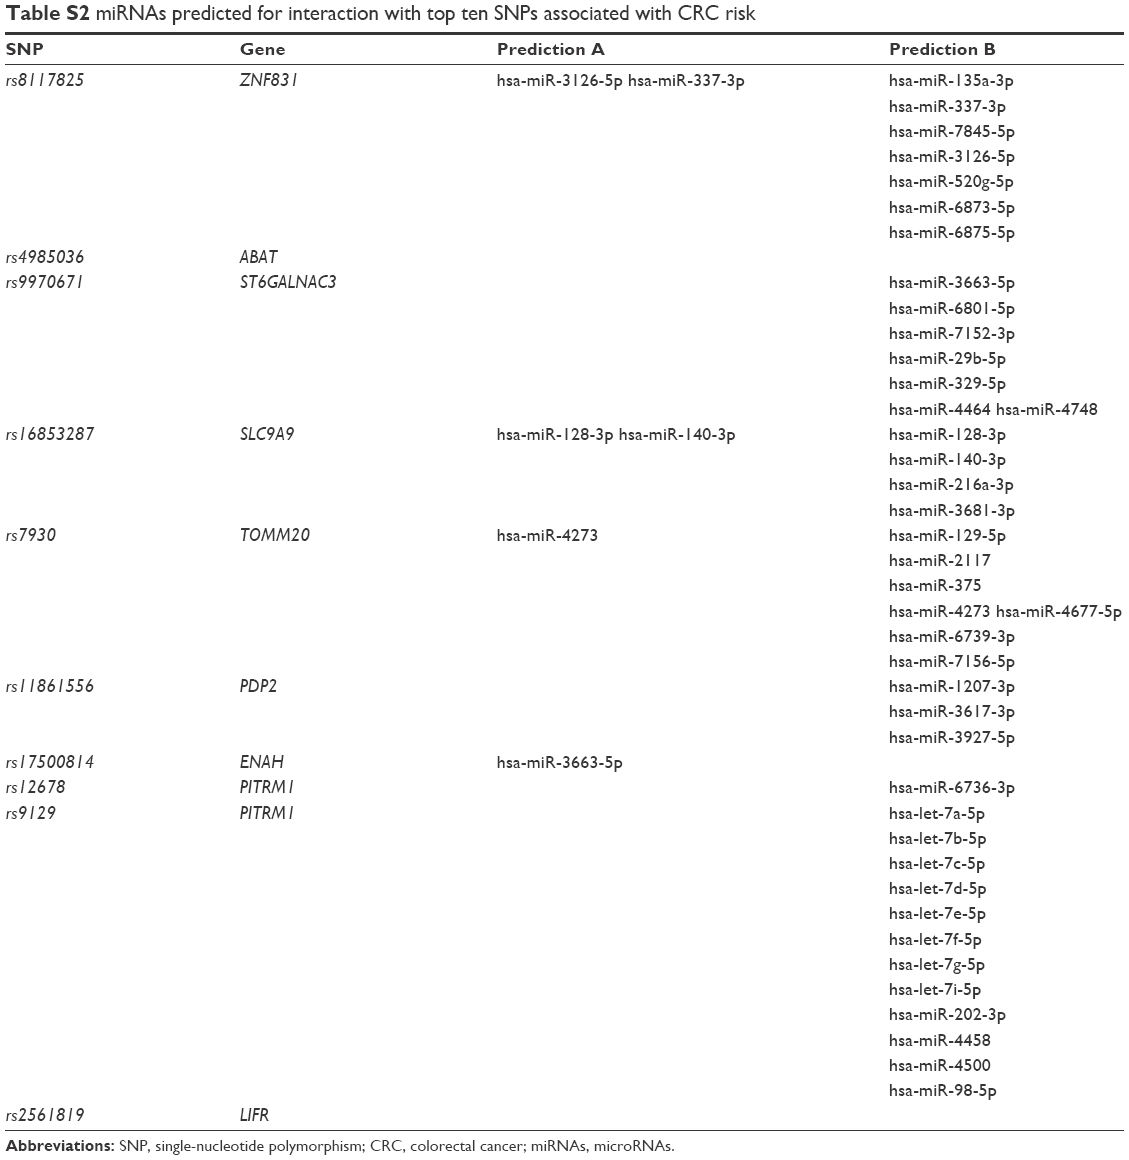
To identify miRNAs interacting with these ten SNPs, two online software programs (http://www.bioguo.org/miRNASNP/ and http://compbio.uthsc.edu/miRSNP/) were used. Among the ten SNPs, rs8117825, rs1685328, and rs7930 were the only ones for which both programs predicted the same interacting miRNAs (Table S2). In this study, we focused only on rs7930 because it is located in the 3′ UTR of TOMM20, the role of which in tumorigenesis has not been studied extensively.
Rs7930 is an independent genetic factor for CRC risk
Initial analysis of the association of rs7930 with CRC risk was carried out in 323 CRC patients and 945 normal individuals by the χ2 test as previously reported.18 A significant association was found between rs7930 and CRC. The frequencies of rs7930 AA and AG genotypes were 0.932 and 0.068 in CRC patients and 0.968 and 0.032 in controls, respectively (P=0.00022; Table 1).
Logistic regression analysis revealed that the AG and GG genotype was associated with a 1.721-fold increased CRC risk compared with the AA genotype after adjustment for age, sex, and BMI (95% CI: 1.11–3.24, P=0.0062; Table 2). There was no individual with the GG genotype in the study population.
We additionally analyzed 297 patients and 600 normal individuals to increase our confidence in this finding (thus, 620 CRC patients and 1,545 controls were evaluated in total) and found similar results (Table 3). Distribution of the rs7930 genotypes and alleles was in HWE for both controls and cases. Individuals with the AG genotype had a 1.9-fold (95% CI: 1.191–3.034, P=0.0084) higher risk for CRC development after adjustment for age, sex, and BMI than individuals with the AA genotype. There were no individuals with the GG genotype in this expanded study population. Thus, the G allele in heterozygous individuals was sufficient to increase CRC susceptibility (OR =2.535, 95% CI: 1.501–3.126, P=0.0005) after adjustment for age, sex, and BMI (Table 3). These results suggest that the SNP rs7930 is an independent genetic factor for CRC susceptibility and that G is the risk allele.
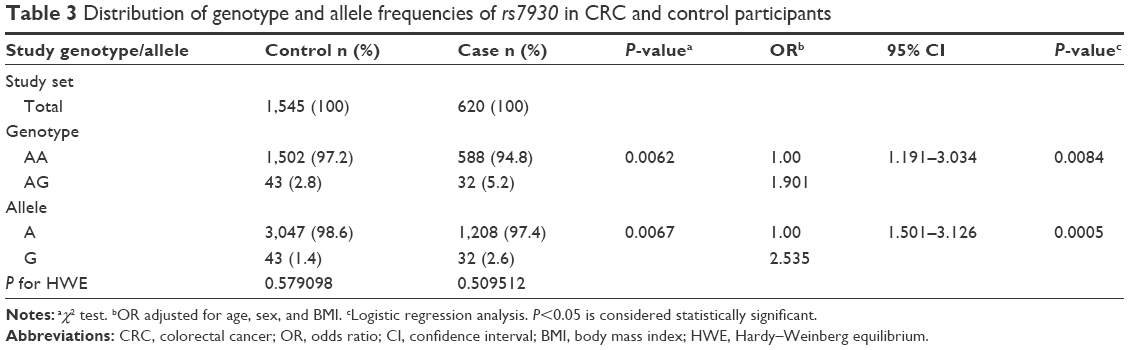 | Table 3 Distribution of genotype and allele frequencies of rs7930 in CRC and control participants |
Allele-dependent interaction of miR-4273-5p with its target
The miRNA miR-4273-5p was predicted to interact with rs7930 (Figure 1A). We investigated whether miR-4273-5p directly interacts with rs7930 using a luciferase assay in the CRC cell lines SW620, SNUC4, DLD1, and HCT116. Although the negative control RNA had no effect on luciferase activity regardless of the allele of the reporter construct, the miR-4273-5p mimic affected luciferase activity differently depending on the allele of the reporter construct (Figure 1B): the G allele plasmid had no effect, whereas the A allele plasmid significantly suppressed luciferase activity in comparison with the control RNA in three cell lines (by 60%–80%; SW620, P<0.001; DLD1, P=0.019; HCT116, P=0.021) and tended to decrease luciferase activity in one cell line (SNUC4, P=0.074).
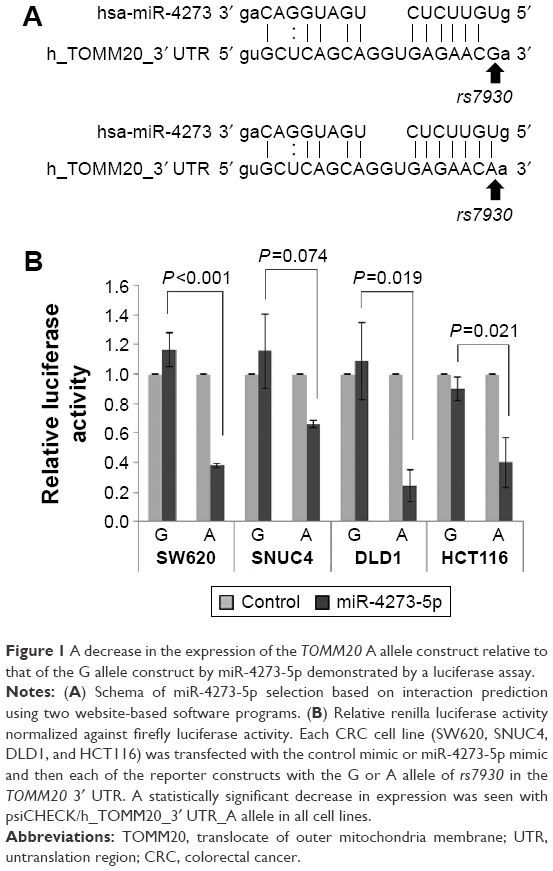 | Figure 1 A decrease in the expression of the TOMM20 A allele construct relative to that of the G allele construct by miR-4273-5p demonstrated by a luciferase assay. |
Genotype-dependent regulation of TOMM20 expression by miR-4273-5p in CRC cell lines
To investigate the effect of the rs7930 genotype on the regulation of TOMM20 expression by miR-4273-5p, we first determined the rs7930 genotypes of various cell lines by polymerase chain reaction on genomic DNA, followed by sequencing. The cell lines CCD18CO, SW620, SNUC4, and SNUC5 had the AA genotype, whereas DLD, HCT116, and LoVo had the AG genotype. Unfortunately, we did not find a CRC cell line with the GG genotype (Table S3). TOMM20 expression was determined at the protein level by Western blot analysis. The TOMM20 levels were higher in all CRC cell lines than in CCD18CO (Figure 2).
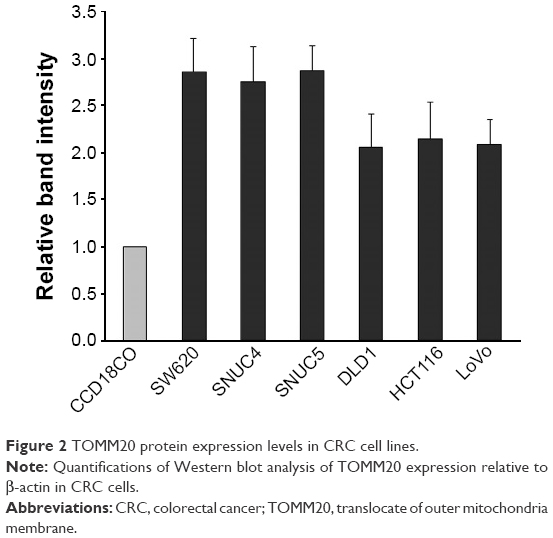 | Figure 2 TOMM20 protein expression levels in CRC cell lines. |
Regulation of TOMM20 expression by the miR-4273-5p mimic depended on rs7930 genotype (P=0.043). Cell lines with the AA genotype showed a considerably stronger reduction in TOMM20 levels (SNUC4 and SNUC5, both by 60%) than those with the AG genotype (DLD1, by 24.3%; HCT116, 37%; LoVo, 31%) in comparison with the control (Figure 3A). Transfection with the miR-4273-5p inhibitor resulted in a more than 1.76-fold increase in TOMM20 expression in all CRC cell lines in comparison with that in cells transfected with the control RNA (Figure 3B).
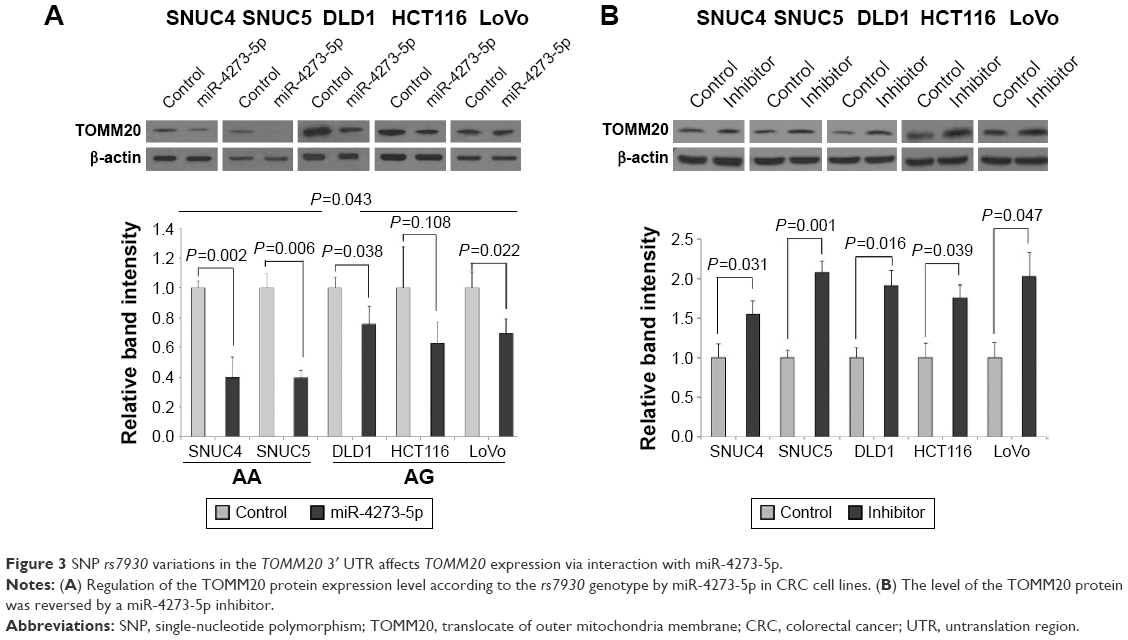 | Figure 3 SNP rs7930 variations in the TOMM20 3′ UTR affects TOMM20 expression via interaction with miR-4273-5p. |
Discussion
The SNPs and associated genes identified in this study may function in CRC and provide opportunities to understand carcinogenesis, to develop diagnostic and prognostic markers, and to discover therapeutic approaches. The six risk SNPs in five genes we detected have not been previously implicated in any cancers, including CRC. However, some of these genes associated with high risk for CRC have been implicated in cancers. ENAH and LIFR have been previously shown to be related to CRC. Increased expression of ENAH, a transcriptional target of the Wnt/β-catenin pathway, was correlated with advanced CRC stages.24 Downregulated LIFR expression was shown in primary CRC tissues. Both genes have also been implicated in many other carcinomas such as myeloid leukemia or breast cancer.25–27 Therefore, the SNPs rs17500814 and rs2561819 can be candidate susceptibility markers, and interactions of the ENAH and LIFR mRNAs with miRNAs should be further investigated.
Although rs4985036 (in ABAT) and rs16853287 (in SLC9A9) were not significantly associated with CRC risk, nevertheless they show tendency for increased CRC risk. It is worthy to note that decreased ABAT expression was observed in breast cancer;28 SLC9A9 expression was downregulated in prostate cancer, and this gene was suggested as a prognostic marker for esophageal squamous cell cancer.29 TOMM20 is suggested as a prognostic marker for patients with gastric cancer30 and as a specific therapeutic target for anaplastic thyroid cancer cells.31 Therefore, the relevance of these genes to CRC should be established. Establishment of interactions of ABAT and SLC9A9 mRNAs with miRNAs may lead to new pairs of SNP–miRNA indicator for CRC risk. ZNF831, ST6GALNAC3, PDP2, and PITRM1 have not been specifically associated with any cancers. rs8117825 (in ZNF831) and rs12678 and rs9129 (in PITRM1) were found significantly associated with increased CRC risk. However, rs9970671 (in ST6GALNAC3) and rs11861556 (in PDP2) only showed marginal tendency for CRC risk. Interestingly, these genes show variable expression in tumors (from the public data posted by the Broad Institute; http://firebrowse.org/). In CRC, the expression of ZNF831 and ST6GALNAC3 was found to be lower than in normal tissues (Table S4). ABAT expression was slightly decreased in colon cancer but not in rectal cancer, whereas the expression of SLC9A9 was markedly lower in CRC than in normal tissues. Therefore, the SNPs in these genes are attractive candidates for the development of biomarkers for diagnosis and prognosis of CRC. However, currently, the functional relevance of PITRM1 and PDP2 to CRC is not clear. The expression of PITRM1 was slightly higher (by 20%) in CRC than in normal tissues, whereas PDP2 expression was similar in normal and tumor tissues, as shown in the public data (Table S4: data from http://firebrowse.org/). Thus, SNPs in the 3′ UTRs of these genes may act simply as surrogate markers of genetic contributors to CRC rather than play a role in CRC carcinogenesis. It may be that rs11861556 in PDP2 was not associated with CRC risk at all. Obviously, further study is required to understand their relationship (if any) to CRC.
Accumulating evidence has explained the specificity of miRNAs for different cancers and suggested that miRNAs can potentially be used as biomarkers for the diagnosis and prognosis of cancers. SNPs in the seed-match regions of miRNAs are a hot topic of research because of their potential usefulness as markers of noninvasiveness, their availability, and the ease of their detection. miRNA–SNP pairs have been implicated in cancer risk and suggested as prognostic markers. For CRC, an SNP in the let-7 miRNA-binding site that is present in the KRAS 3′ UTR is a prognostic biomarker, and rs895819 in the miR-27a binding site is associated with increased genetic susceptibility in Han Chinese.32,33 rs2910164 in miR-146a binding site is associated with CRC susceptibility in Han Chinese,34 and rs141178472 in the PIK3CA 3′ UTR and miR-520a was implicated in CRC risk in Han Chinese population.35
This study identified rs7930–miR-4273-5p, a new SNP–miRNA pair, as an indicator of CRC risk; this pair has never been studied in any cancers. Our study clearly showed that miR-4273-5p interacted differentially with rs7930 alleles and regulated expression of the target gene TOMM20 in CRC cells. Thus, both rs7930 and miR-4273-5p and their interaction itself have potential to be genetic contributors of CRC risks.
Our study has a few limitations. First, variables were limited to age, sex, and BMI, and so only limited analyses were possible. Since the analysis was carried out using a data set merged from various sources whose common variables were limited to age, sex, and BMI, further multivariable analysis was not possible. Although this presents a limitation for our study, the direction or the size of effect would not be affected considerably even if environmental factors are added because this study was a genetic analysis. Second, the power of our study is slightly less than optimal condition, although fairly good number of samples were analyzed. The sample size of our study gives the power of 0.7 with the genotype frequencies of controls and CRC cases, which warrants cautious interpretation of the results. Our study result suggested that individuals with the AG genotype of rs7930 have a 1.9-fold higher risk for CRC development. This OR was calculated with 95% CI of 1.19–3.03, which gives best guess for the size of the population effect 95% of time. With regard to clinical consideration, an individual with AG genotype may have CRC risk of anywhere between 1.19 and 3.03, which is rather wide. Thus, a larger sample size is needed to obtain more reliable result with an improved estimate, or a narrower CI.
Since TOMM20 expression is essential for cell viability, it is critically important to dissect its function in CRC carcinogenesis. Although a rigorous validation process with a larger sample size must precede its application, this SNP has a potential to be utilized for detection of high-risk group as well as early detection of CRC development, which may provide a practical means for preventive medicine.
Conclusion
In summary, we identified SNPs that have not been previously implicated in etiology of any tumors including CRC. We also demonstrated that miR-4273-5p specifically interacts with the A allele of the SNP rs7930, which suggests a mechanism for the association of the G allele (which is not targeted by miR-4273-5p) with an increased CRC risk. Thus, the A allele is protective, whereas G allele is a risk allele, that is, patients with the G allele have a higher risk for CRC development. Therefore, we provide a diagnostic biomarker for CRC with the rs7930 SNP_G allele. Our study found SNPs that may be useful for CRC risk assessment and provided opportunity to elucidate the biological importance of these SNPs, which may be accomplished by dissecting the relationship between the SNPs and miRNAs.
Acknowledgments
This research was supported by the Basic Science Research Program through the National Research Foundation of Korea (NRF) funded by the Ministry of Education, Science and Technology (2012R1A5A2047939 and 2015R1D1A1A2061749).
Author contributions
ARL and SJKY designed the experiments. ARL, JP, KJ, SHJ, and SJKY conducted the experiments. ARL and SJKY wrote the paper. All authors contributed toward data analysis, drafting and critically revising the paper and agree to be accountable for all aspects of the work.
Disclosure
The authors report no conflicts of interests in this work.
References
Cyhaniuk A, Coombes ME. Longitudinal adherence to colorectal cancer screening guidelines. Am J Manag Care. 2016;22(2):105–111. | ||
Moravkova P, Kohoutova D, Rejchrt S, Cyrany J, Bures J. Role of S100 proteins in colorectal carcinogenesis. Gastroenterol Res Pract. 2016;2016:2632703. | ||
Hsueh YM, Cheng GS, Wu MM, Yu HS, Kuo TL, Chen CJ. Multiple risk factors associated with arsenic-induced skin cancer: effects of chronic liver disease and malnutritional status. Br J Cancer. 1995;71(1): 109–114. | ||
Kendzor DE, Costello TJ, Li Y, et al. Race/ethnicity and multiple cancer risk factors among individuals seeking smoking cessation treatment. Cancer Epidemiol Biomarkers Prev. 2008;17(11):2937–2945. | ||
Mohammed AA, El-Tanni H, El-Khatib HM, Mirza AA, El-Kashif AT. Molecular classification of colorectal cancer: current perspectives and controversies. J Egypt Natl Cancer Inst. 2016. doi:10.1016/ j.jnci.2015.11.004. Epub ahead of print. | ||
Song T, Zhang X, Yang G, Song Y, Cai W. Decrement of miR-199a-5p contributes to the tumorigenesis of bladder urothelial carcinoma by regulating MLK3/NF-kappaB pathway. Am J Transl Res. 2015; 7(12):2786–2794. | ||
Zheng N, Yang P, Wang Z, Zhou Q. OncomicroRNAs-mediated tumorigenesis: implication in cancer diagnosis and targeted therapy. Curr Cancer Drug Targets. 2016. Epub ahead of print. | ||
Yin Z, Li H, Cui Z, et al. Polymorphisms in pre-miRNA genes and cooking oil fume exposure as well as their interaction on the risk of lung cancer in a Chinese nonsmoking female population. OncoTargets Ther. 2016;9:395–401. | ||
Jazdzewski K, Murray EL, Franssila K, Jarzab B, Schoenberg DR, de la Chapelle A. Common SNP in pre-miR-146a decreases mature miR expression and predisposes to papillary thyroid carcinoma. Proc Natl Acad Sci U S A. 2008;105(20):7269–7274. | ||
Fu B, Song P, Lu M, Wang B, Zhao Q. The association between miR-146a gene rs2910164 polymorphism and gastric cancer risk: a meta-analysis. Biomed Pharmacother. 2014;68(8):923–928. | ||
Wang S, Lv C, Jin H, et al. A common genetic variation in the promoter of miR-107 is associated with gastric adenocarcinoma susceptibility and survival. Mutat Res. 2014;769:35–41. | ||
Wang X, Ren H, Zhao T, et al. Single nucleotide polymorphism in the microRNA-199a binding site of HIF1A gene is associated with pancreatic ductal adenocarcinoma risk and worse clinical outcomes. Oncotarget. 2016;7(12):13717–13729. | ||
Ding L, Jiang Z, Chen Q, Qin R, Fang Y, Li H. A functional variant at miR-520a binding site in PIK3CA alters susceptibility to colorectal cancer in a Chinese Han population. Biomed Res Int. 2015;2015: 373252. | ||
Uvirova M, Simova J, Kubova B, et al. Comparison of the prevalence of KRAS-LCS6 polymorphism (rs61764370) within different tumour types (colorectal, breast, non-small cell lung cancer and brain tumours). A study of the Czech population. Biomed Pap Med Fac Univ Palacky Olomouc Czech Repub. 2015;159(3):466–471. | ||
Xu L, Tang W. Associations of polymorphisms in mir-196a2, mir-146a and mir-149 with colorectal cancer risk: a meta-analysis. Pathol Oncol Res. 2016;22(2):261–267. | ||
Hu Z, Chen J, Tian T, et al. Genetic variants of miRNA sequences and non-small cell lung cancer survival. J Clin Invest. 2008;118(7):2600–2608. | ||
Saetrom P, Biesinger J, Li SM, et al. A risk variant in an miR-125b binding site in BMPR1B is associated with breast cancer pathogenesis. Cancer Res. 2009;69(18):7459–7465. | ||
Park J, Kim I, Jung KJ, Kim S, Jee SH, Yoon SK. Gene-gene interaction analysis identifies a new genetic risk factor for colorectal cancer. J Biomed Sci. 2015;22:73. | ||
Jo J, Nam CM, Sull JW, et al. Prediction of colorectal cancer risk using a genetic risk score: the Korean Cancer Prevention Study-II (KCPS-II). Genomics Inform. 2012;10(3):175–183. | ||
Cho NH, Kim JY, Kim SS, Shin C. The relationship of metabolic syndrome and constitutional medicine for the prediction of cardiovascular disease. Diabetes Metab Syndr. 2013;7(4):226–232. | ||
Cha S, Park AY, Kang C. A genome-wide association study uncovers a genetic locus associated with thoracic-to-hip ratio in Koreans. PloS One. 2015;10(12):e0145220. | ||
Cha SW, Choi SM, Kim KS, et al. Replication of genetic effects of FTO polymorphisms on BMI in a Korean population. Obesity (Silver Spring, Md.). 2008;16(9):2187–2189. | ||
Jung KW, Park S, Kong HJ, et al. Cancer statistics in Korea: incidence, mortality, survival, and prevalence in 2008. Cancer Res Treat. 2011;43(1):1–11. | ||
Toyoda A, Kawana H, Azuhata K, et al. Aberrant expression of human ortholog of mammalian enabled (hMena) in human colorectal carcinomas: implications for its role in tumor progression. Int J Oncol. 2009;34(1):53–60. | ||
Bruce AG, Hoggatt IH, Rose TM. Oncostatin M is a differentiation factor for myeloid leukemia cells. J Immunol. 1992;149(4):1271–1275. | ||
Estrov Z, Samal B, Lapushin R, et al. Leukemia inhibitory factor binds to human breast cancer cells and stimulates their proliferation. J Interferon Cytokine Res. 1995;15(10):905–913. | ||
Hudson KR, Vernallis AB, Heath JK. Characterization of the receptor binding sites of human leukemia inhibitory factor and creation of antagonists. J Biol Chem. 1996;271(20):11971–11978. | ||
Jansen MP, Sas L, Sieuwerts AM, et al. Decreased expression of ABAT and STC2 hallmarks ER-positive inflammatory breast cancer and endocrine therapy resistance in advanced disease. Mol Oncol. 2015;9(6):1218–1233. | ||
Chen J, Wen J, Zheng Y, et al. Prognostic significance of SLC9A9 in patients with resectable esophageal squamous cell carcinoma. Tumour Biol. 2015;36(9):6797–6803. | ||
Zhao Z, Han F, He Y, et al. Stromal-epithelial metabolic coupling in gastric cancer: stromal MCT4 and mitochondrial TOMM20 as poor prognostic factors. Eur J Surg Oncol. 2014;40(10):1361–1368. | ||
Johnson JM, Lai SY, Cotzia P, et al. Mitochondrial metabolism as a treatment target in anaplastic thyroid cancer. Sem Oncol. 2015;42(6): 915–922. | ||
Jiang Y, Lin DH, Xu JP, Chen WX, Zheng SJ, Song L. Genotype GG of rs895819 functional polymorphism within miR-27a might increase genetic susceptibility to colorectal cancer in Han Chinese population. J Clin Lab Analysis. 2016;30(4):351–355. | ||
Smits KM, Paranjape T, Nallur S, et al. A let-7 microRNA SNP in the KRAS 3′UTR is prognostic in early-stage colorectal cancer. Clin Cancer Res. 2011;17(24):7723–7731. | ||
Hu X, Li L, Shang M, et al. Association between microRNA genetic variants and susceptibility to colorectal cancer in Chinese population. Tumour Biol. 2014;35(3):2151–2156. | ||
Ding L, Jiang Z, Chen Q, Qin R, Fang Y, Li H. A functional variant at miR-520a binding site in PIK3CA alters susceptibility to colorectal cancer in a Chinese Han population. Biomed Res Int. 2015;2015:373252. |
Supplementary materials
 | Table S1 Demographic characteristics of CRC and normal participants of this study |
 | Table S2 miRNAs predicted for interaction with top ten SNPs associated with CRC risk |
 | Table S3 rs7930 genotypes of CRC cell lines |
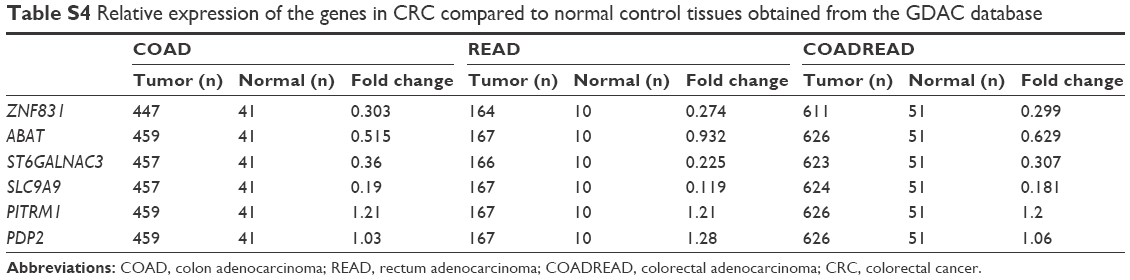 | Table S4 Relative expression of the genes in CRC compared to normal control tissues obtained from the GDAC database |
 © 2016 The Author(s). This work is published and licensed by Dove Medical Press Limited. The full terms of this license are available at https://www.dovepress.com/terms.php and incorporate the Creative Commons Attribution - Non Commercial (unported, v3.0) License.
By accessing the work you hereby accept the Terms. Non-commercial uses of the work are permitted without any further permission from Dove Medical Press Limited, provided the work is properly attributed. For permission for commercial use of this work, please see paragraphs 4.2 and 5 of our Terms.
© 2016 The Author(s). This work is published and licensed by Dove Medical Press Limited. The full terms of this license are available at https://www.dovepress.com/terms.php and incorporate the Creative Commons Attribution - Non Commercial (unported, v3.0) License.
By accessing the work you hereby accept the Terms. Non-commercial uses of the work are permitted without any further permission from Dove Medical Press Limited, provided the work is properly attributed. For permission for commercial use of this work, please see paragraphs 4.2 and 5 of our Terms.