")
Back to Journals » Pharmacogenomics and Personalized Medicine » Volume 14
Genetic Diversity of Drug-Related Genes in Native Americans of the Brazilian Amazon
Authors Fernandes MR , Rodrigues JCG , Maroñas O , Latorre-Pellicer A , Cruz R , Guerreiro JF , Burbano RMR , Assumpção PP, Ribeiro-dos-Santos A , Santos SEB, Carracedo A, Santos NPC
Received 30 July 2020
Accepted for publication 23 October 2020
Published 22 January 2021 Volume 2021:14 Pages 117—133
DOI https://doi.org/10.2147/PGPM.S274741
Checked for plagiarism Yes
Review by Single anonymous peer review
Peer reviewer comments 4
Editor who approved publication: Dr Martin H Bluth
Marianne Rodrigues Fernandes,1,2 Juliana Carla Gomes Rodrigues,1 Olalla Maroñas,3 Ana Latorre-Pellicer,3,4 Raquel Cruz,5 João Farias Guerreiro,6 Rommel Mario Rodriguez Burbano,1,2 Paulo Pimentel de Assumpção,1 Andrea Ribeiro-dos-Santos,1,6 Sidney Emanuel Batista dos Santos,1,6 Angel Carracedo,3,5,7 Ney Pereira Carneiro dos Santos1
1Núcleo de Pesquisas em Oncologia, Universidade Federal do Pará, Belém, Pará, Brazil; 2Departamento de ensino e pesquisa, Hospital Ophir Loyola, Belém, Pará, Brazil; 3Grupo de Medicina Xenómica, Centro Nacional de Genotipado (CEGEN-PRB3), Universidade de Santiago de Compostela, Santiago de Compostela, España; 4Unidad de Genética Clínica y Genómica Funcional, Departamento de Farmacología-Fisiología, Escuela de Medicina, Universidad de Zaragoza, IIS-Aragón, E-50009 Zaragoza, España; 5Centro de Investigación Biomédica en Enfermedades Raras (CIBERER), Grupo de Medicina Genómica, CIMUS, Universidad de Santiago de Compostela, Santiago de Compostela, España; 6Laboratório de Genética Humana e Médica, Universidade Federal do Pará, Belém, Pará, Brazil; 7Fundación Pública de Medicina Xenómica, Instituto de Investigación Sanitaria de Santiago de Compostela (FIDIS), Universidade de Santiago de Compostela, Santiago de Compostela, España
Correspondence: Ney Pereira Carneiro dos Santos
Hospital Universitário João de Barros Barreto, Núcleo de Pesquisa em Oncologia, 2º Floor of the Unidade de Alta Complexidade em Oncologia. Av. Mundurucus, 4487, Guamá, Belém 66073-005, PA, Brazil
Tel +55 (91) 99113-9221
Email [email protected]
Introduction: The genetic admixture of the Brazilian population has considerable relevance to the implementation of the principles of pharmacogenomics (PGx), as it may compromise the extrapolation of data obtained in more homogeneous world populations.
Purpose: This study aims to investigate a panel of 117 polymorphisms in 35 pharmacogenes, which contains label recommendations or clinical evidence by international drug regulatory agencies, in Amazonian Native American populations, and compare the results obtained with continental population data from the 1000 Genomes Project Consortium.
Patients and Methods: The study population is composed of 109 Native American individuals from three Brazilian Amazon groups. The genotyping of the PGx polymorphisms was performed by allelic discrimination using TaqMan® OpenArray Genotyping with a panel of 120 customized assays on the QuantStudio™ 12K Flex Real-Time PCR System.
Results: Statistical differences within the Native American populations were observed regarding both genotypes and phenotypes of some genes of the CYP family. The discriminant analysis of principal components (DAPCs) between the NAM group and the continental populations of the 1000 Genomes Project resulted in the clustering of the three Native American populations. Additionally, in general, the NAM group was determined to be closely situated between East Asia, America, and South Asia groups, which enabled us to infer a genetic similarity between these populations. The DAPC analysis further demonstrated that eight polymorphisms and six polymorphisms were more relevant in differentiating the NAM from the continental populations and the NAM populations among themselves, respectively.
Conclusion: Some investigated polymorphisms show differences among world populations, particularly with populations of European origin, for whom precision medicine protocols are primarily designed. The accumulated knowledge regarding these variations may assist in the design of specific protocols for Native American populations and populations admixed with them.
Keywords: Native Americans, pharmacogenomics, polymorphisms, population, genetic admixture, Brazil
Introduction
The Brazilian population is one of the most heterogeneous in the world, showing considerable genetic admixture among Europeans, Africans, and Native Americans.1 Among the three main groups forming the Brazilian population, Native Americans have the scarcest genetic data.
The Amazon region concentrates a greater part of the Native American populations of Brazil: there are more than 180 communities, apart from several isolated groups living in the biome, which represents approximately 200 thousand people, 86 languages, and 650 dialects.2 Specifically addressing the state of Pará, the second largest state in the Brazilian Amazon region, the last census reported more than 50 thousand indigenous people and 42 different Native American groups.3
The epidemiological profile of Native American populations is very little known, which stems from the scarcity of investigations, the absence of surveys and censuses, as well as the precariousness of information systems on morbidity and mortality, which complicates any discussion about the health/disease process of indigenous peoples.4 As far as information on genetic data for that population, data availability is even more scarce.
The population paradigm of PGx is based on the frequency of numerous polymorphisms in “pharmacogenes” that vary widely among human populations (Suarez-Kurtz, 2010). The guidelines formulated by regulatory drug agencies for the accuracy of therapies cannot be fully applied to Native Americans or even to populations with a high degree of genetic admixture with this group, such as the Brazilian population.5 This study aims to investigate a panel of 117 polymorphisms in 35 pharmacogenes, including label recommendations or clinical evidence from international drug regulatory agencies in an Amazonian Native American population, and to compare the results obtained with global population data. Relevant pharmacogenetic biomarkers were selected from the Pharmacogenomics Knowledge Base database.7
Patients and Methods
Population Study
A total of 109 Native American individuals from the Brazilian Amazon region were selected from a database of an epidemiological study investigating indigenous populations of Pará. The study population was composed of 65 men and 44 women and collected from adult individuals (between 18 and 50 years old). Twenty-five samples were obtained from Asurini do Koatinemo (KOA), 41 Asurini do Trocará (ASU), and 43 Kayapó-Xicrin (KAY). All the Native Americans groups are in the state of Pará: the Kayapó-Xikrin is located in the Cateté and Trincheira Bacajá regions, both indigenous protective lands (geographic coordinates: −6.241917, −50.804833), it counts with a total population of 1800 individuals; the Asurini do Trocará settlement is located east of the Tocantins River (geographic coordinates: −3.567694, −49.711039), summing a total population of 546 individuals; and, Asurini do Koatinemo is situated on the right bank of the Xingu River (geographic coordinates: −4.230970, −52.298335), with a total population of 182 individuals. The three Native American groups are isolated from each other, located at a mean distance of 390 km between them, and do not share family relationships. For some analyses, the three Amazonian Native American populations were gathered in a group called Native Americans (NAM). The genomic data for each marker investigated in the continental populations were obtained from the Ensembl Phase 3 Project.8
Selection of PGx Biomarkers
Relevant pharmacogenetic biomarkers were selected from the database of the Pharmacogenomics Knowledge Base,9 a publicly available online knowledgebase website whose main objective is collecting, curating, integrating, and disseminating basic pharmacogenetic data. Here, we define “biomarker” as the function of a gene to code enzymes responsible for processes of pharmacokinetics or pharmacodynamics that may interfere in drug pathways, consequently affecting drug response.10
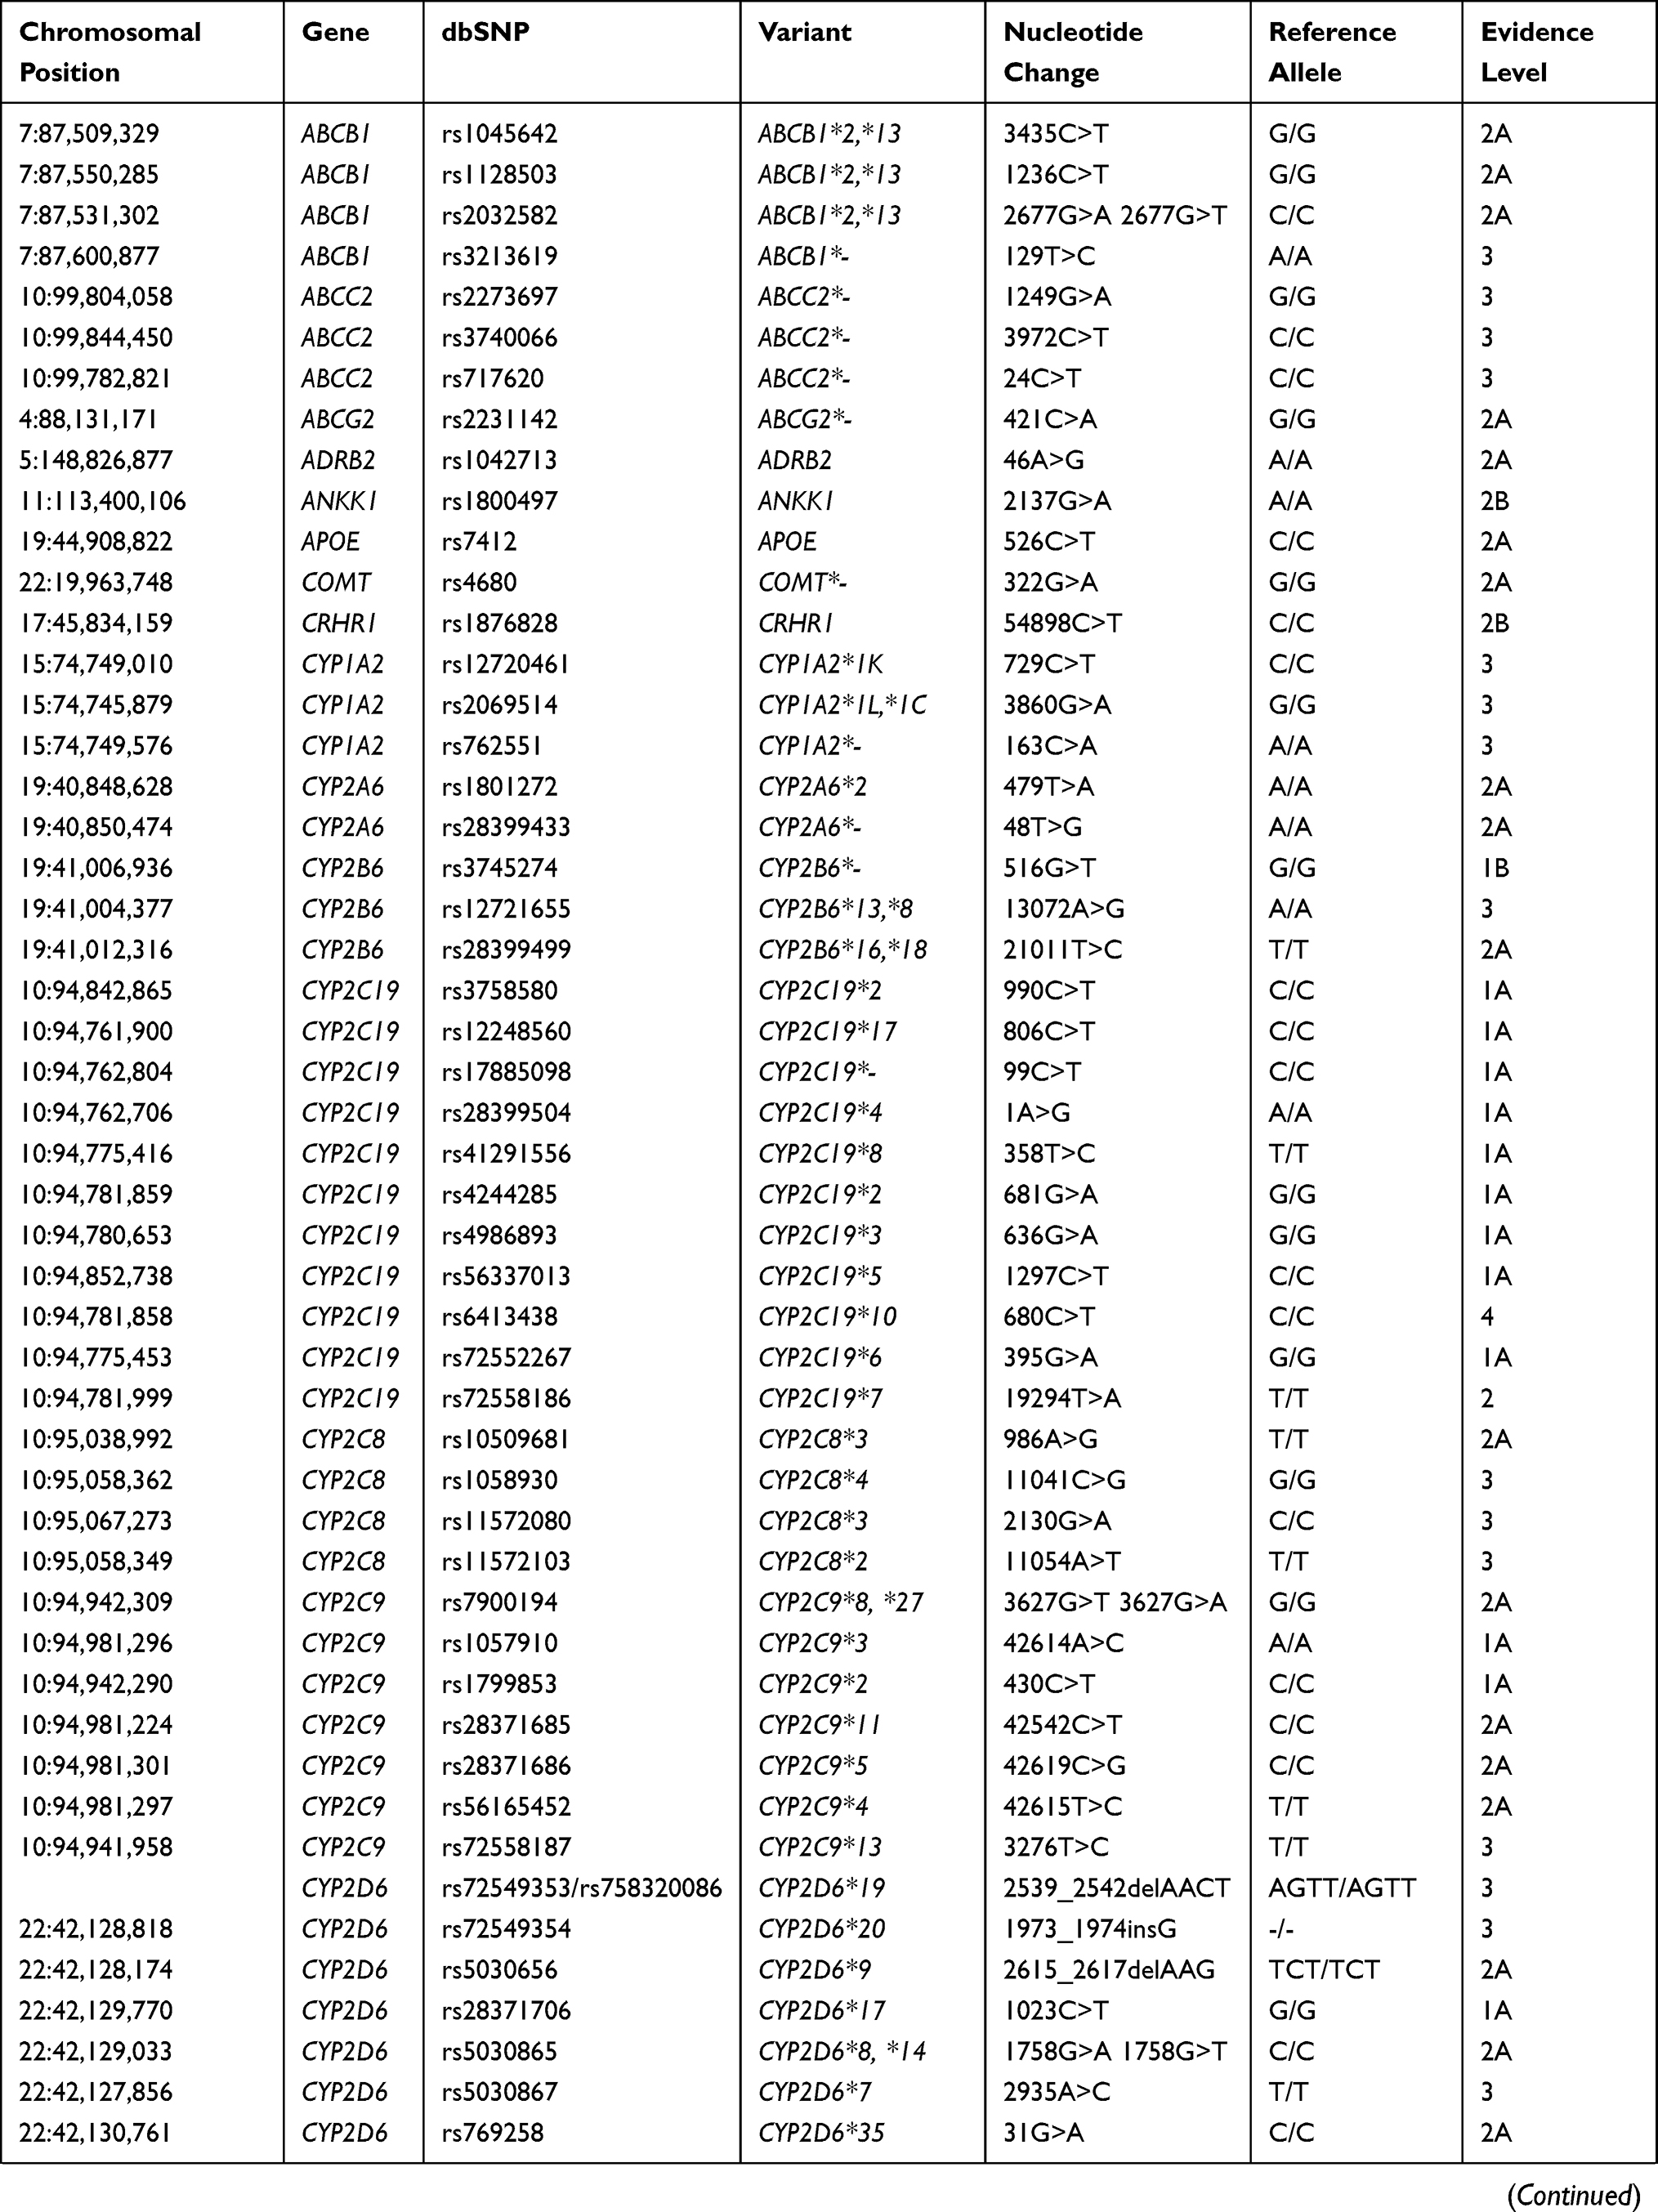
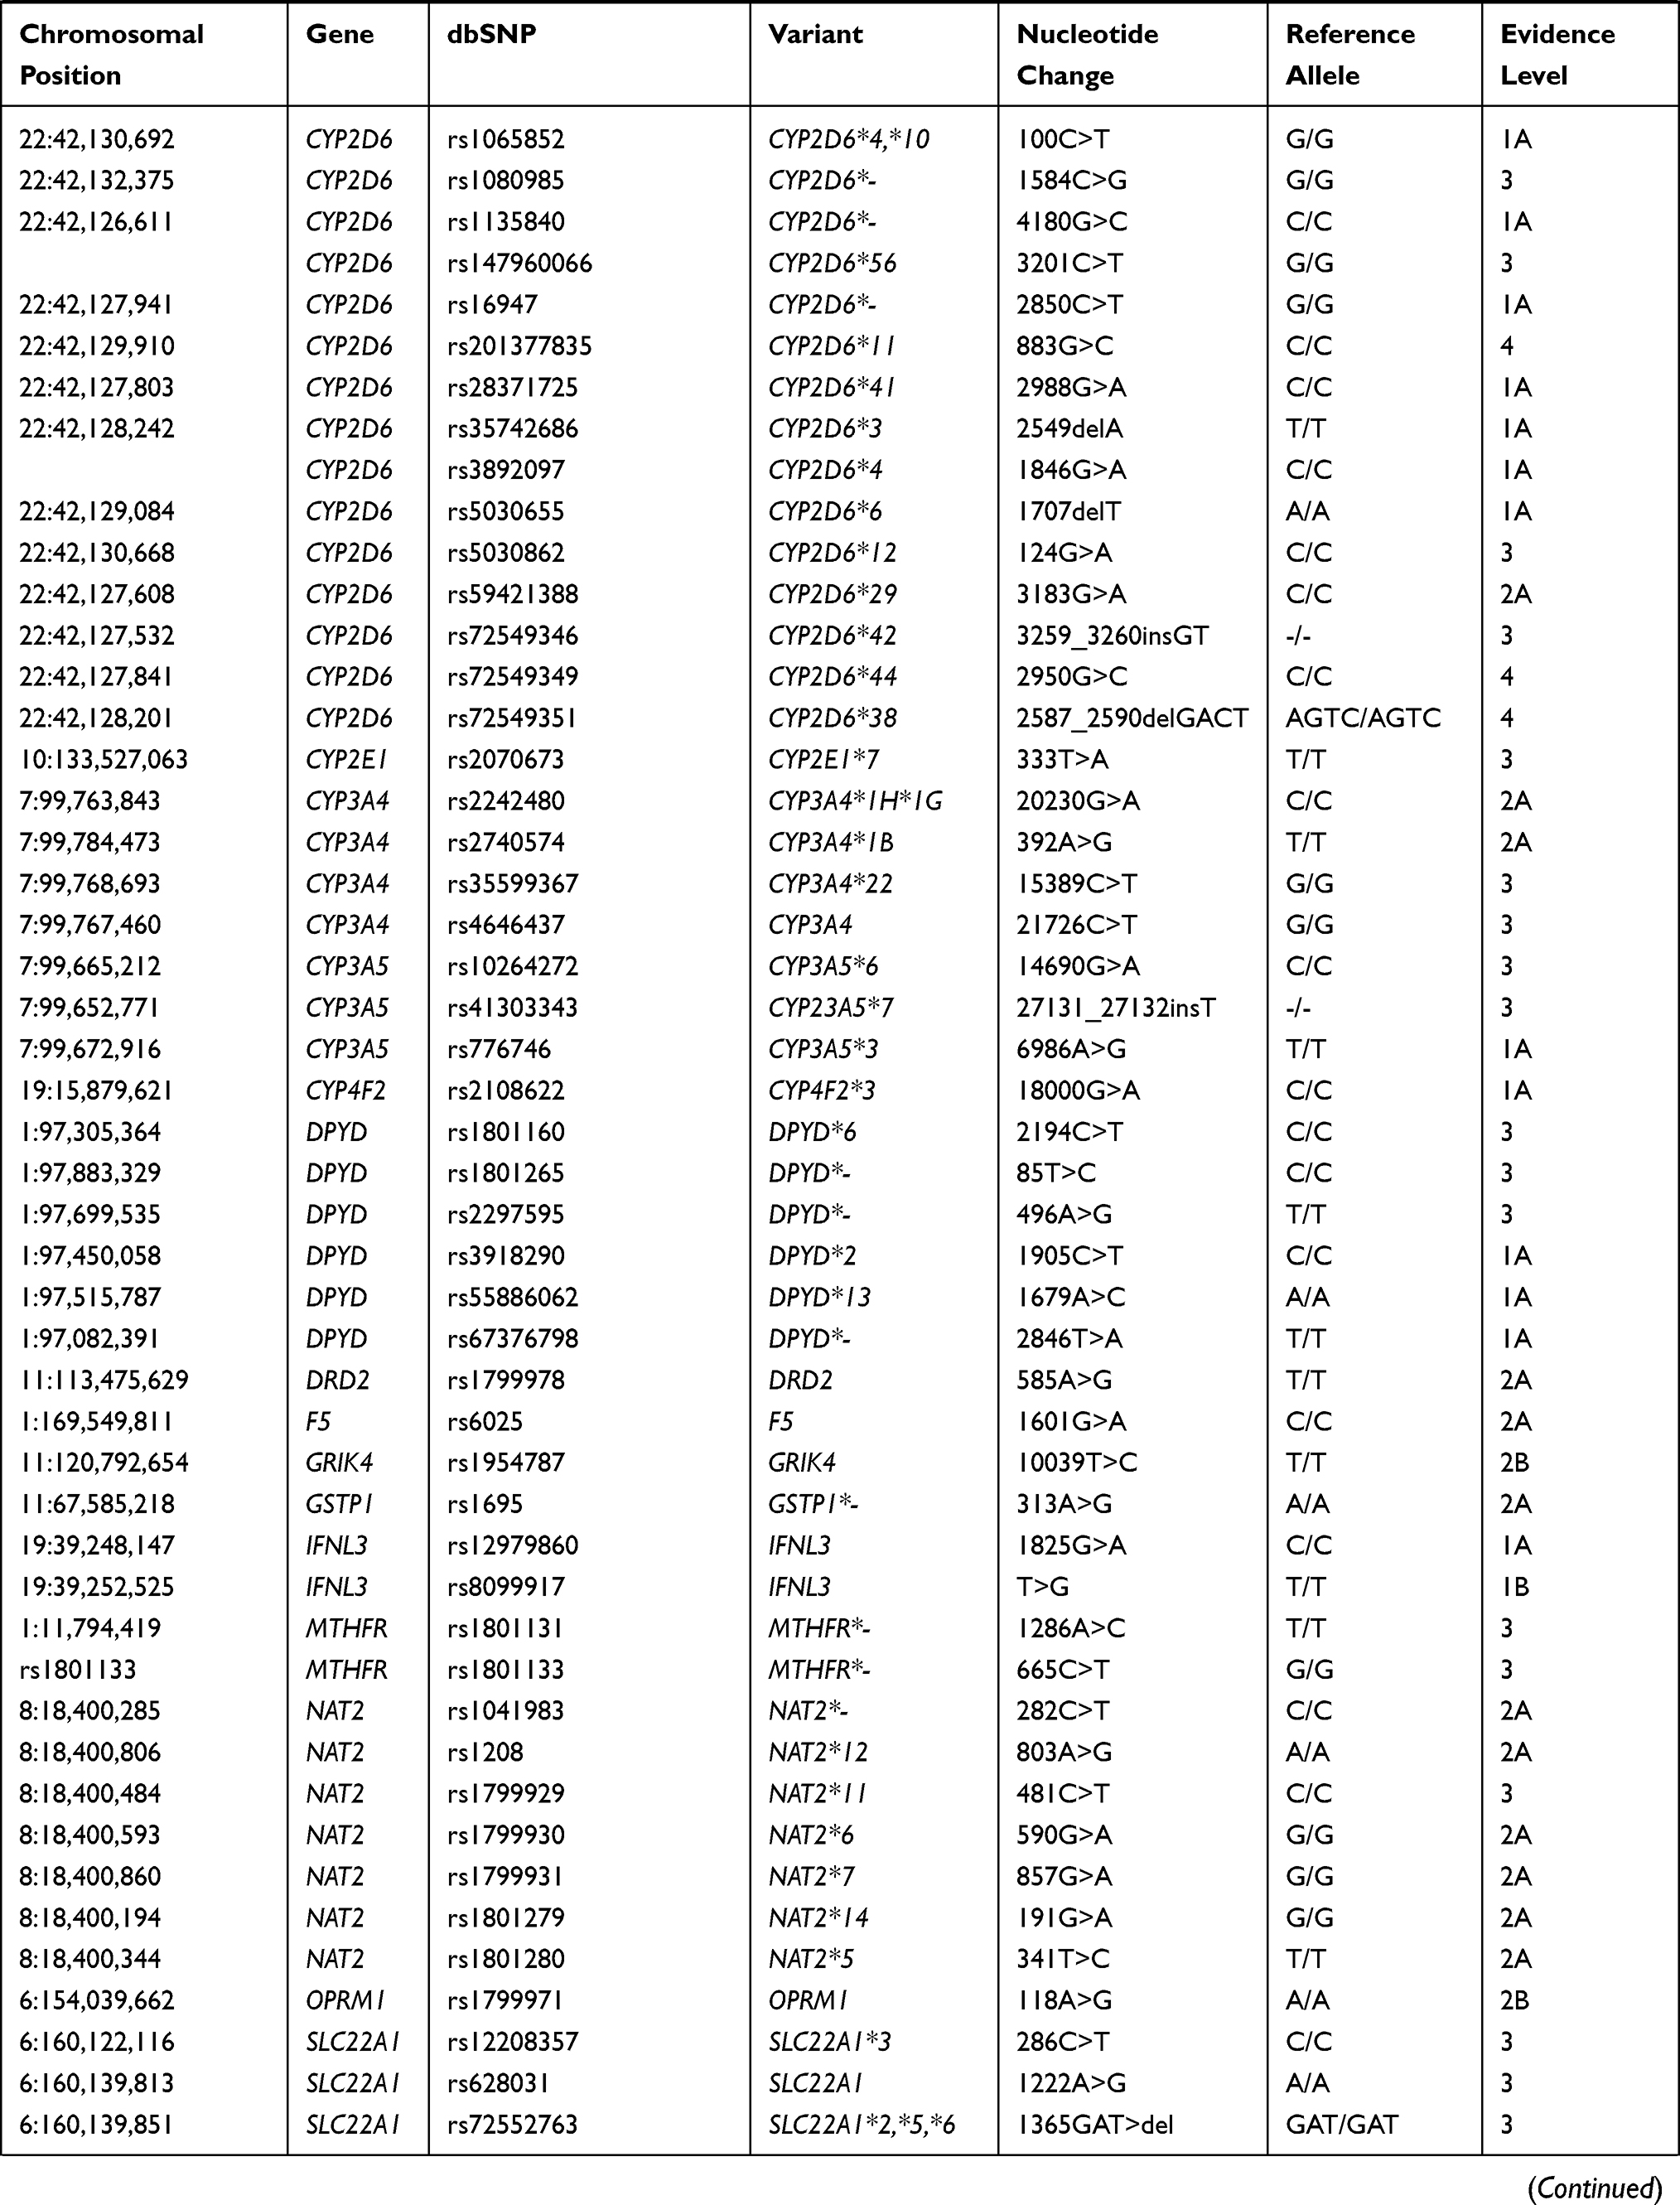
Pharmacogenetic biomarkers are labeled by levels of evidence regarding their importance to drug response. Levels of evidence rank from 1A, which denotes a variant-drug combination in a medical society-endorsed PGx guideline, or already implemented in a major health system, to level 4, which denotes annotation based on a case report, nonsignificant study or in vitro, molecular or functional assay evidence only. For the current analysis of the Native American populations, 117 biomarkers (ranked from level 1A to 2A and 3) from a total of 35 different genes, including absorption, distribution, metabolism, and excretion genes (ADME) and pharmacodynamic genes, were selected. All the biomarkers selected for this study are shown in Table 1.
 |
 |
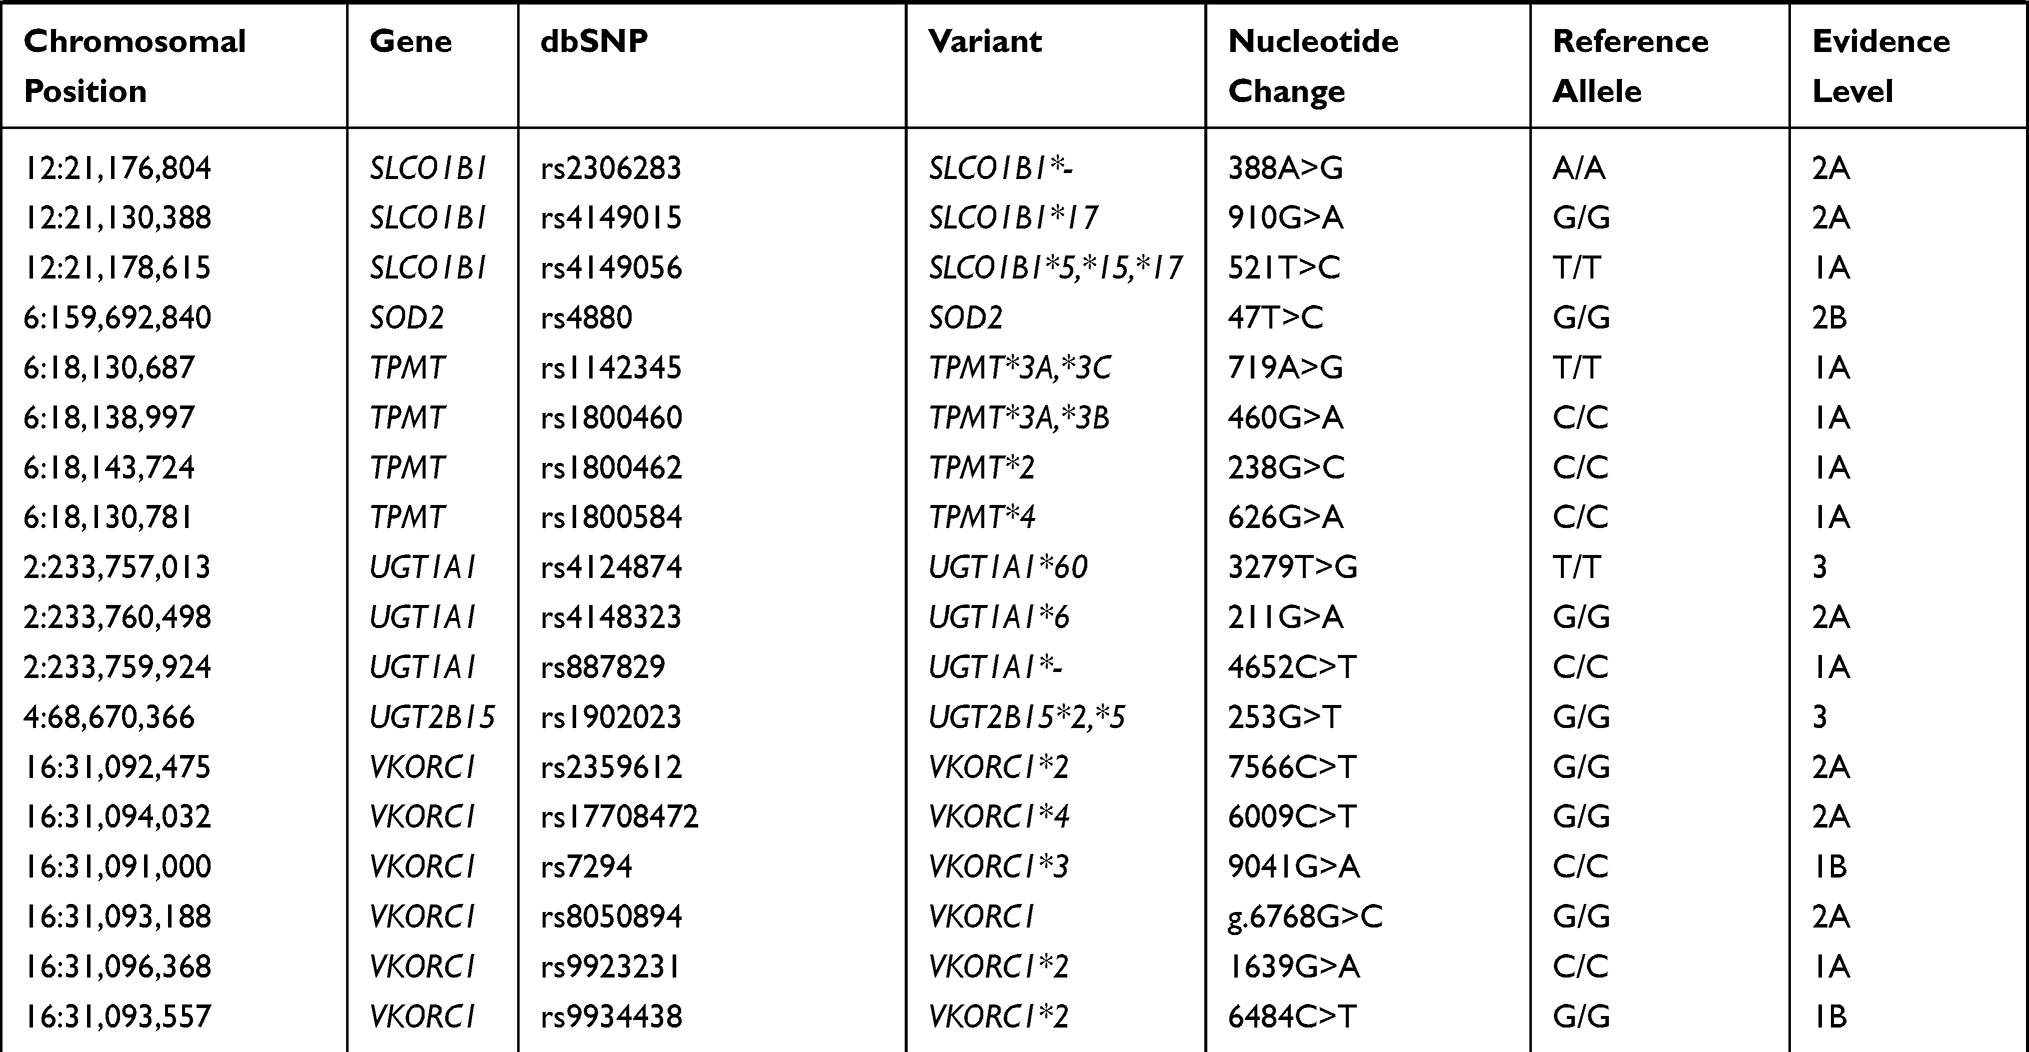 |
Table 1 Biomarkers Analyzed in the Three Native American Populations |
DNA Isolation/Genotyping and Quality Control
Genetic material was extracted from peripheral blood using the BiopurKit Mini Spin Plus-250 commercial kit (Biopur, Brazil) according to the manufacturer’s recommendations. DNA concentration and purity were measured with a NanoDrop 1000 Spectrophotometer (Thermo Fisher Scientific, Wilmington, DE). The genotyping of single nucleotide polymorphisms (SNPs) was performed by allelic discrimination using TaqMan® OpenArray Genotyping with a panel of 120 customized assays on the QuantStudio™ 12K Flex Real-Time PCR System (Applied Biosystems, Life Technologies, Carlsbad, USA) according to the protocol recommended by Applied Biosystems. Three of the 117 selected biomarkers were triallelic, specifically rs2032582 for ABCB1, rs5030865 for CYP2D6, and rs7900194 for CYP2C9, requiring two different probes per biomarker in the array, making a total of 120 assays to be analyzed (Table 1). To ensure the correct assessment of the genotypes, native samples were analyzed together with negative and positive internal quality controls. Data were analyzed with TaqMan® Genotyper software v1.2.2. Copy number variation for CYP2D6 was analyzed by using TaqMan® commercial probes according to the TaqMan® Copy Number assay protocol recommended by Applied Biosystems and to a final volume of 10 µL per reaction. Three different regions were analyzed, intron 2, intron 6, and exon 9, together with an internal 2-copy control (RNAse P). Analysis of the three regions allowed us to detect hybrids CYP2D6/2D7 and CYP2D6*36. Data were analyzed with CopyCaller® software v.2 by using a two-copy as a positive control. The predicted copy number was assessed for the three probes, and the mean and standard deviation were also calculated.
Genomic Ancestry Analysis
Ancestry analysis was performed as described by Ramos et al 2016,11 using 61 autosomal ancestry informative markers (AIMs). Three multiplex PCR reactions were performed using the insertion/deletion markers (INDEL) and the PCR amplifications were analyzed by electrophoresis using the ABI Prism 3130 sequencer and the GeneMapper ID v.3.2 software. The individual proportions of European, African, and Native Americans’ genetic ancestries were estimated using the STRUCTURE v.2.3.3 software, assuming three parental populations (European, African, and Native Americans).
Statistical Analyses
To compare genetic frequencies for the genes involved in the ADME processes between the three Native American populations and other reference populations, data from the 1000 Genomes Project Consortium6 were downloaded from the website, and pharmacogenetic biomarkers were carefully selected. A total of 2.613 individuals from Africa (AFR), Europe (EUR), East Asia (EAS), South Asia (SAS), and America (AMR) were used to perform discriminant analysis of principal components (DAPC) using R software with the Adegenet package.12
DAPC maximizes discrimination between the populations included in the analysis and, in this way, enables us to characterize the proximity of the NAM populations to the reference populations. Moreover, DAPC provided an informative description of the contribution of the alleles to the discriminant functions used to differentiate the populations. Two R libraries were used to obtain summary tables with descriptive information for each SNP: SNPassoc (Minor Allele Frequency, Hardy-Weinberg Equilibrium, and call rate) and GenABEL (Minor Allele Frequency, Hardy-Weinberg Equilibrium, call rate, and genotype frequencies).13,14
Haplotypes were inferred by using Pharmgkb website and the software AlleleTyper™ v1.0. This software interprets the real-time PCR analysis data and determines the star-allele results based on specific tables designed from haplotypes tables from Pharmgkb website. Allele Typer software allows to encompass results from SNPs and copy number variation to give a joint genotype prediction.
Furthermore, frequencies of genotypes, haplotypes, and metabolizer phenotypes were compared by Fisher’s exact tests. Call rates higher than 90% were obtained when analyzed with OpenArray.15
Results
Pharmacogenetic Variants Observed in the Native American Populations
The distribution of 12 haplotypes in the three representative groups of the Native American populations of Brazil is shown in Figure 1. Of these genes, five had a significantly different distribution among the three Native Americans groups: CYP2D6 (p = 0.0047), CYP3A5 (p = 0.043), CYP4F2 (p = 0.0105), CYP2B6 (p = 0.00018), and DPYD (p = 0.0012) (Figure 1). To define the possible CYP2D6 genotypes, 22 polymorphisms were investigated, determining 11 different genotypes, of which *1/*1, *2A/*2A, *1/*4, and *1/*2A were present in all three populations investigated. The wild-type homozygous genotype (*1/*1) was the most frequently found (33%) followed by the *1/*2A genotype (32%). Wild-type homozygotes (*1/*1) were highly common in ASU (17%) and KAY (14%), while KOA presented a considerably lower frequency (4%). Some of the genotypes were detected at low frequencies and in only one of the three populations investigated, such as *2A/*9 and *1/*5 genotypes that occurred only in ASU; *1/*1xN found only in KAY; *4/*29 and *2A/*29 only in KOA. The haplotypes *9 (present in genotype *2A/* 9) and *5 (*1/*5) were exclusive in the ASU.
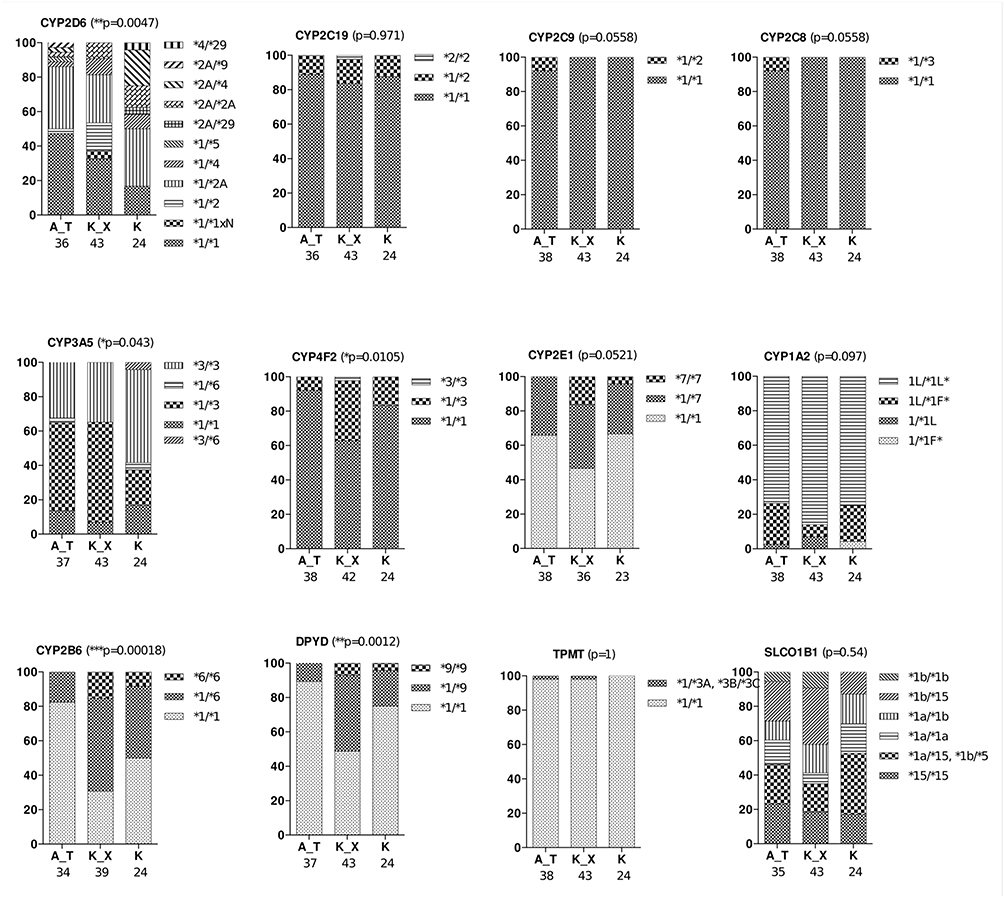 |
Figure 1 Genotype distribution of haplotype-forming genes in the three Native American populations of Brazil. Abbreviations: A_T, Asurini do Trocará (ASU); K_X, Kayapó-Xikrin (KAY); (K), Koatinemo (KOA). Notes: *p<0.05; **p<0.01; ***p<0.001. |
Another gene that also presented a distribution of genotypes with significant differences in the three indigenous communities was CYP3A5, which has five possible genotypes. Haplotype *3 was the most frequent in the Native Americans. The *1/*3 genotype was observed with high frequencies in ASU and KAY (42% and 58% individuals, respectively), in contrast with the frequency values observed in the KOA community (20% of individuals). Another genotype that confirms the prevalence of haplotype *3 in the groups is the *3/*3 genotype, which has a relatively more frequent frequency in the groups, summing 32%, 35%, and 56% of individuals in the ASU, KAY, and KOA communities, respectively. On the other hand, the*3/*6 genotype presented a rare frequency, being observed only in 4% of KOA individuals.
The CYP4F2 gene has three possible genotypes, which also presented significant differences regarding its distribution in the Brazilian Native American populations. The wild-type genotype *1/*1 was the most frequent in the groups, being found in 93%, 63%, and 84% of individuals of the ASU, KAY, and KOA communities, respectively. The genotype *1/*3 had a high frequency in the KAY population (35% individuals), whereas in the ASU, it was only found in 7% of individuals and the KOA group in 16% of individuals. Regarding the *3/*3 genotype, it was observed only in 2% of the individuals in the KAY group.
The CYP2B6 gene also presents three possibilities of genotypes, which were also different in the Native Americans evaluated. In general, the wild-type genotype (*1/*1) was observed most frequently, being observed in 68%, 28%, and 48% of individuals of the ASU, KAY, and KOA groups, respectively. The haplotype *6 presented a high frequency, mainly in the Kay population, being found in the genotypes *1/*6 (49% individuals) and *6/*6 (14% individuals).
Finally, the DPYD gene also presented three genotypes with significant differences in the studied populations. The most common genotype was the wild-type genotype (*1/*1), summing 59% of individuals in the ASU group, 49% of individuals in the KAY group, and 76% of individuals in the KOA community. The haplotype *9 was observed in both genotypes *1/*9 and *9/*9. The *1/*9 genotype was frequent in the KAY group (44% of individuals) and was also found in 12% and 20% of individuals from the ASU and KOA groups. The genotype *9/*9 exhibited low frequency, being observed only in 7% and 2% of KAY and ASU populations.
Figure 2 shows the distribution of the metabolization profile of eight genes found in the Brazilian Native American populations. For seven genes, CYP2C19, CYP2C9, CYP3A5, CYP4F2, DPYD, TPMT, and SLCOB1, we considered the assignment of phenotype-based on genotypes: poor function, decreased function, and normal function.7 For the CYP2D6 gene, the activity score (AS) classification was considered.16,17 Two genes had a significantly different profile distribution among the three communities analyzed: CYP2D6 (p = 0.0306) and CYP4F2 (p = 0.0105).
 |
Figure 2 Metabolism profile distribution for the genes investigated in Native American populations of Brazil. For CYP2C19, CYP2C9, CYP3A5, CYP4F2, DPYD, TPMT, and SLCOB1, we considered the assignment of genotypes poor metabolizers (PM), intermediate metabolizers (IM), and extensive metabolizers (EM). For the CYP2D6 gene, the activity score (AS) classification was considered. Abbreviations: A_T, Asurini do Trocará (ASU); K_X, Kayapó-Xikrin (KAY); (K), Koatinemo (KOA). Note: *p<0.05. |
According to the combination of the CYP2D6 genotypes, we can determine the enzyme metabolic profile and classify the predictive phenotype of each individual by the activity score (AS) rate, as defined previously by Gaedigk et al, 2008,16 associating this information with the efficacy of drugs or adverse reactions during pharmacological therapies.
For the other seven genes, the normal function profiles were the most frequent in the Native Americans. The KAY population was the only one to have two individuals with AS 3, equivalent to ultrafast metabolism classification, representing approximately 5% of the total group. In the KOA, it was possible to exclusively observe one individual with poor function. The CYP4F2 gene also showed significant differences in metabolization profiles. In all the Native Americans studied, the most frequently observed profile was normal function followed by decreased function. The KAY group was the only one to present a single individual classified as poor function.
Although the distribution of the phenotypes was not statistically significant regarding the differences presented by the Native American groups, it is important to highlight the data found in two genes: CYP3A5 and SLCO1B1. Both genes showed high frequencies of poor function individuals. The poor function profile of the CYP3A5 gene was observed in 60% of individuals in the KOA community, 35% of individuals in the KAY group, and 32% of individuals in the ASU population. Regarding the SLCO1B1 gene, there were also high frequencies of poor function, approximately 20% and 19% of individuals in the ASU and the KAY communities and 16% of individuals in the KOA group.
Comparative Analysis Between Brazilian Native American Populations and 1000 Genomes Project
The scatterplot shown in Figure 3 was obtained with a DAPC for the 117 PGx markers in 2613 individuals from eight global populations (EUR, AFR, EAS, SAS, AMR, KOA, ASU, and KAY). X- and Y-axis of the scatterplot describe the first and second linear discriminant (LD) function (LD1 and LD2 respectively). The AFR group formed an isolated cluster, clearly genetically differentiated from the rest of the world (x-axis). In the y-axis of the diagram, the divergence between the EUR and EAS cluster was highlighted. The SAS and AMR populations formed close clusters between themselves and the EUR cluster, demonstrating similarity between these populations for the PGx markers evaluated.
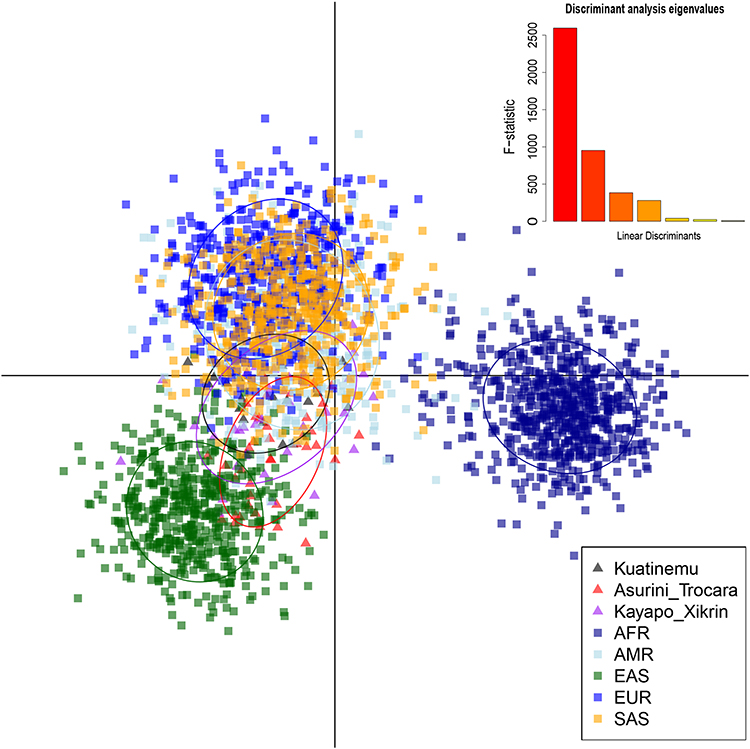 |
Figure 3 Discriminant analysis of principal components (DAPC) of 117 PGx. Scatterplot for the five groups of continental populations described in the 1000 Genomes Project (EUR, AFR, EAS, SAS, and AMR) and three populations of Native Americans of Brazil (KOA, ASU, and KAY). |
The Native American populations formed close clusters among themselves and were closely situated between the EAS, AMR, and SAS groups, even though the ASU was the closest to the EAS group. The DAPC assigned 51% of individuals belonging to the ASU population to the EAS cluster, while the percentage of EAS-assigned individuals was lower in the other two Amerindians populations (37% for KAY and 20% for KOA). This result is in keeping with the highest percentage of Native American ancestry shown by ASU (mean value 97.4%), which was significantly higher than that shown by KOA (94.9%).
Because of the lack of clear discrimination between native American populations of Brazil in the previous analysis (Figure 3), DAPC was also performed using only the three Native American populations of Brazil (Figure 4). The ASU population forms a cluster isolated from the other two Native American populations in the x-axis (LD1) and consequently has more differences. KOA and KAY, although still forming different clusters (y-axis, LD2), have some intercession between them that shows a greater similarity of these regarding the ASU group.
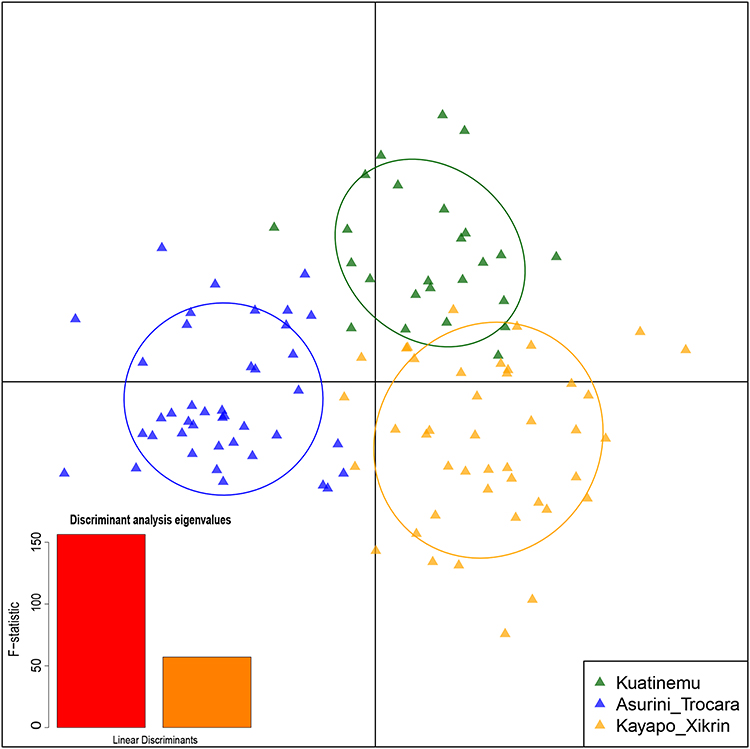 |
Figure 4 Discriminant analysis of principal components (DAPC) of 117 PGx markers. Scatterplot for the three Native American populations of Brazil (KOA, ASU, and KAY). |
Table 2 shows the list of the most contributing PGx markers to each discriminant function (LD1 and LD2) in both DAPC analysis. The first section of Table 2 shows the most important markers in the discrimination shown in Figure 3. LD1 corresponds to the x-axis demonstration of the scatterplot; this discriminant function allows differentiate the AFR population (Figure 3). Among the markers listed in LD1, we highlight CYP3A4 (rs2740574), GRIK4 (rs1954787), and OPRM1 (rs1799971), which are more relevant in differentiating AFR from other populations. The second linear discriminant (LD2) corresponds to the scatterplot demonstrative y-axis (Figure 3); along this axis, the rest of the populations are distributed. Among the markers listed in LD2, we highlight CYP1A2 (rs2069514), CYP2A6 (rs28399433), CYP2E1 (rs2070673), SLCO1B1 (rs2306283), and SOD2 (rs4880), which have been shown to have greater relevance in differentiating EUR from EAS.
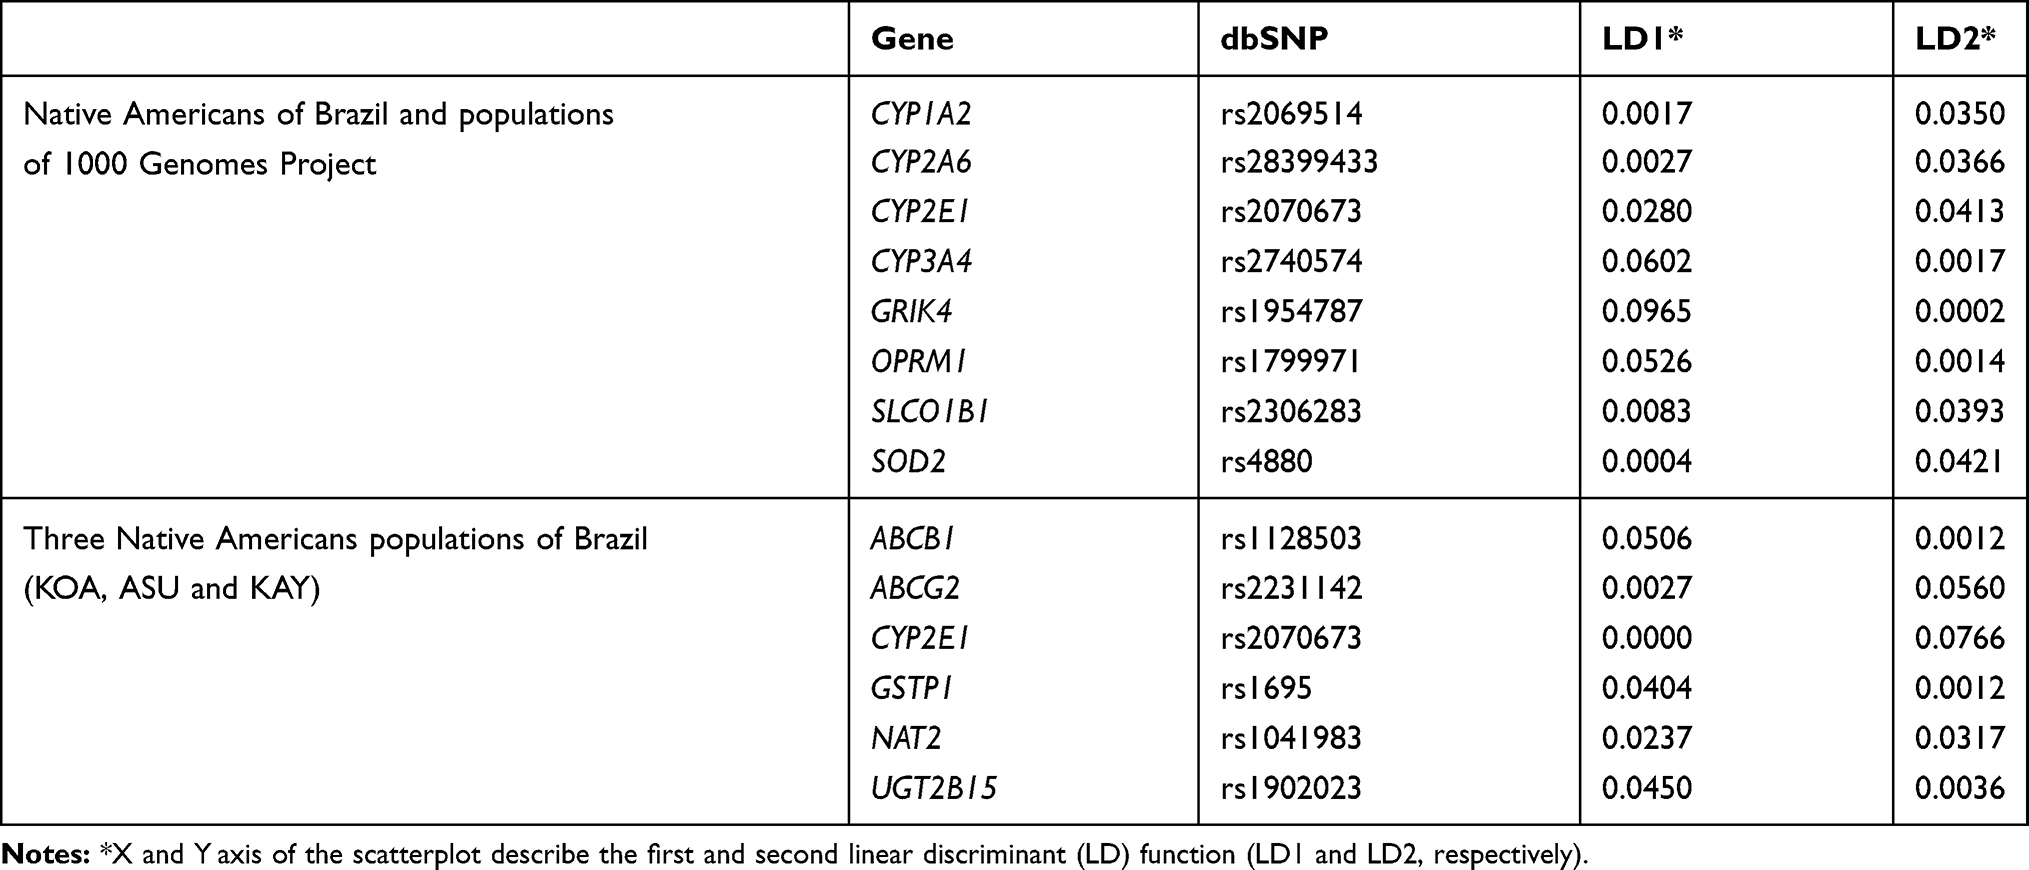 |
Table 2 List of Most Contributing PGx Markers to Each Linear Discriminant Function (LD1 and LD2) in DAPC for Nam and 1000 Genome Populations (Top) and for the Three Native American Populations of Brazil (Bottom) |
The second section of Table 2 shows the most important markers to differentiate the Brazilian Native American populations among themselves (KOA, ASU, and KAY). LD1 corresponds to scatterplot’s x-axis demonstration (Figure 4). Among the markers listed in LD1, we highlight ABCB1 (rs1128503), GSTP1 (rs1695), and UGT2B15 (rs1902023), which are of greater relevance in differentiating the ASU population from the other Native American populations investigated. LD2 corresponds to scatterplot’s y-axis demonstration (Figure 4). Among the markers listed in LD2, we highlight ABCG2 (rs2231142), CYP2E1 (rs2070673), and NAT2 (rs1041983), which are more relevant to differentiate KOA from the other Native American populations in Brazil.
Discussion
The Amazonian Native American populations present low degrees of genetic admixture with non-indigenous population, a fact that is highly important for studies involving these groups, which remain genetically isolated from others and may offer advantages in genome-wide studies of hereditary diseases.18,19 The Amazonian Native Americans of this study presented mean values of Native American’s genomic ancestry of 96.2%, which confirms the low genetic admixture of these populations.
Several studies have shown large genetic variation for important PGx biomarkers between distinct populational groups.20–22 The knowledge obtained to date in PGx genes in Native American populations is very limited to specific genes, failing to reach a wider genome context.23,24 The investigation of important PGx polymorphisms in the genes selected by our panel has the potential to provide powerful information regarding the predictivity of therapeutic response to the use of different drugs and xenobiotics in Amazonian Native Americans and/or admixed populations with this ethnic group. Although PGx biomarkers genotyping is useful to guarantee a more accurate prediction of the response to drugs in Amazonian Native Americans, it is also necessary to consider other factors such as ethnic origin and environmental factors of each population.
The pharmacogenomic data obtained from populations were compared to global populations from the 1000 Genomes Project Consortium.8 In our analyses, the DAPC identified a set of SNPs in PGx genes that most contributed to grouping global populations into clusters, making it possible to infer which populations have the highest level of similarity regarding PGx genes (Figure 1).
The distancing of AFR in the plot is due to the “out-of-Africa” hypothesis, in which modern human populations originated in Africa and migrated to other continents in the world; thus, the African populations show a greater genetic diversity that was reflected in the PGx data evaluated.25 The data demonstrate the formation of relatively close clusters among the three Amazonian Native American populations.
The SAS and AMR groups formed similar clusters regarding the PGx data evaluated. Our results showed that Amazon Native American populations are located between this cluster and the EAS grouping. The formation of the AMR population (Peru, Mexico, Puerto Rico, and Colombia) occurred through abundant mixing between European, African, and Native American groups.26,27 Therefore, the similarity between Amazonian Native American groups and AMR is possible due to the high level of admixture of these populations with indigenous peoples.19,27 Several authors have demonstrated genetic affinities between Native American and Asian populations,28,29 which corroborates the findings of our study. This similarity of PGx genes is based on the hypothesis of migration of Asian populations to the Americas through the Bering Strait.30
The DAPC analysis revealed in LD1 the most important polymorphisms capable of differentiating AFR and the rest of the world in the CYP3A4, GRIK4, and OPRM1 genes. The divergence found for these polymorphisms in AFR may influence the therapy of different drugs for the populations formed and derived from them. The CYP3A4 gene presents genetic information referenced by FDA and EMA agencies in package inserts of different drug classes, such as antineoplastics, antipsychotics, and antiretrovirals (Food and Drug Administration, n.d.; For et al, n.d.). Polymorphisms in the GRIK4 and OPRM1 genes are strongly associated with an altered response upon treatment with antidopaminergic and opioid-based drugs.32–34
We observed that the PGx locus investigated could also separate EUR and EAS clusters (LD2) through the P450 family represented by three genes: CYP1A2, CYP2A6, and CYP2E1. The polymorphism in the CYP2A6 gene is particularly important because it defines the interindividual variability in the tolerability of the S1 antineoplastic therapy between European and Asian populations, which is considered a genetic-dependent scheme.35 Other genes that strongly contributed to differentiating global populations (EUR x EAS) were the SLCO1B1 and SOD2 genes. The FDA warns that higher plasma concentrations of the rosuvastatin have been seen in small groups of patients homozygous for the SLCO1B1 rs4149056 variant.31 The polymorphism in SOD2 is associated with adverse effects observed during the use of asparaginase in patients with acute lymphoid leukemia and cyclophosphamide as antineoplastic.36,37
Genotype/Phenotype Relationship
Here, we will discuss the genotype/phenotype relationship of important PGx genes evaluated in Figures 3 and 4. Our results demonstrated significant differences at the genotype level of five genes among the Brazilian Native American groups (CYP4F2, CYP2D6, CYP2B6, DPYD, and CYP3A5) and the phenotypic profile of two genes (CYP2D6 and CYP4F2).
CYP4F2
The CYP4F2 gene has great relevance in the evaluation of metabolism and dose adjustment of warfarin.38 A polymorphism (rs2108622) was investigated in this gene to define haplotype *3. The three Native American populations of the study demonstrated a high frequency of the wild-type homozygous genotype (*1/*1) followed by the heterozygous genotype (*1/*3). The KAY population demonstrated a differentiated metabolization profile since it was the only one to present the mutant homozygous genotype (*3/*3), which is determinant to define the PM profile. Moreover, this group also showed higher frequencies of the heterozygote genotype in comparison with the other populations investigated.
Populations from EUR, EAS, and AMR have frequencies of the CYP4F2*3 haplotype similar to the corresponding global population (24%), as described in the design from 1000 Genomes Project Consortium.8 AFR presented low frequencies of this haplotype (8%), which was similar to that found in our study for Native American populations (11%). Shendre et al showed that the warfarin dose varies according to ancestry background by the influence of the CYP4F2 gene.39 These researchers reported that the CYP4F2*3 variant was associated with higher doses of warfarin in European/American, Asian, and Hispanic populations, while Africans, Americans, and Brazilians, especially self-declared blacks, presented low frequencies of this mutation and therefore showed no need for warfarin dose adjustment.39
CYP2D6
The CYP2D6 gene plays an important role in the metabolism of approximately 25% of clinically important drugs, including antidepressants, antipsychotics, antiarrhythmic drugs, antihistamines, β-blockers, and antineoplastics.40 Polymorphisms of this gene have been extensively studied in several population groups; however, little is known about this gene in indigenous populations.41
Different studies in world populations describe a similar profile of CYP2D6 gene activity to that found in Amazonian Native Americans, with high frequencies of extensive metabolizer (EM) and low frequencies of ultra-rapid metabolizers (UM) or poor metabolizers (PM).27,40,42 In the Native American populations investigated, the alleles *1 and *2 (including *2A) were the most observed with frequencies of 58% and 32%, respectively. These alleles are associated with the normal metabolic function of the enzyme and therefore are decisive for the definition of EM, which was also the most frequent metabolic profile in the sample investigated (97%).43 These results are similar to other populations from the 1000 Genomes Project Consortium, except for AFR and EAS, which have lower frequencies of this metabolic profile.
The alleles associated with null enzyme activity (*4 and *5) were found in approximately 7% of the Native Americans, presenting in the heterozygous genotype. The PM profile was not found in any of the three Native American groups studied. This metabolic profile is considered rare in continental populations, except in Europeans.43 The frequency of PM described in the admixed population of Brazil is 4%.44 Studies have reported that other Native American populations have reduced frequencies of nonfunctional alleles in the CYP2D6 gene. In Venezuela and Mexico, mean frequencies of 3% of the *4 allele were reported,23,45 while in Costa Rica, the observed mean frequency was 7%.27 There were exceptions in Native Americans: Bribri, and Cabebar from Costa Rica, Bari from Venezuela, and Seris from Mexico presented high frequencies of the referred allele (31, 27, 42, and 21%, respectively).41,45
The intermediate metabolizer (IM) profile is defined by the presence of genotypes with reduced function alleles (*9 and *29). Data estimated by the 1000 Genomes Project demonstrate low frequencies of these alleles in world populations except for AFR, SAS, and EAS.8,43 In Native populations of the Brazilian Amazon, the IM profile was rare (1%), found exclusively in the KOA group. Our results differ from other studies with Native Americans that determined high frequencies of these alleles in Seris (41.2%) and Mayos (22.7%) from Mexico and Bari (35%) from Venezuela.41,45 Perez-Paramo et al have suggested that differentiated profiles of the null/reduced metabolic activity in the CYP2D6 gene in other indigenous populations of South America are the result of food selection and lifestyle processes that these populations have undergone.46 Patients with PM and IM profiles have a higher risk of developing adverse reactions to CYP2D6-substrate treatments.41 Therefore, the lack of PM and the low frequency of IMs in the Amazonian Native Americans of Brazil may represent a lower risk of toxicity development during these therapeutic schemes.41,45
The UM profile is determined by the presence of functional allele duplications, increasing the enzyme’s mechanism of action on metabolism. In the investigation of Amazonian Native Americans, the UM profile was found exclusively in the KAY population at low frequencies (2%). In the admixed population of Brazil, frequencies similar to the Amazonian Native Americans were reported (5%).16 In contrast, high percentages of UMs were described in Native Mexican populations (20%) and Guatuso from Costa Rica (18.8%).27 According to Lazalde-Ramos, the probable cause for the gain of active genes in these indigenous populations could be natural selection.41 Environmental factors, such as diet, could have exerted a selective advantage over duplicate CYP2D6 genes, increasing the survival rate of these individuals. It is believed that a similar phenomenon occurred in Ethiopia and Saudi Arabia, where the highest frequency of multiple active CYP2D6 genes has been described.41 Individuals with multiple active CYP2D6 copies metabolize drugs more rapidly; therefore, the therapeutic effect in standard doses is not achieved. For instance, reduced concentrations of drugs, such as tramadol, venlafaxine, morphine, and mirtazapine, were reported in patients with UM profiles.41
In conclusion, the Amazon Native Americans of Brazil presented high frequencies of EMs (97%), absence of PM, and low frequencies of IM (1%) and UM (2%). This population, thus, has a metabolic profile with normal CYP2D6 enzyme, mostly resulting in reduced adverse reactions and the obtention of adequate concentrations of drugs, thereby achieving the desired therapeutic effect.
CYP2B6
The CYP2B6 gene is involved in the metabolism of several drugs, including antiretrovirals and opioids, such as efavirenz and methadone.47,48 The most frequently deficient allele of this gene is CYP2B6*6 (rs3745274), where homozygous and heterozygous carriers for this nonfunctional allele have demonstrated PM phenotypes for various drugs, such as those mentioned above.
In the Brazilian Native American populations, a relatively high frequency of the *6 alleles was observed in both the heterozygous genotype (*1/*6) and the homozygous genotype (*6/*6). The mean frequency of the *6 allele in the Amazonian indigenous populations was 27%. According to data from the 1000 Genomes Project Consortium, the mean frequency of this allele in continental populations is 32%, which is similar to the value found in the Native Americans of this study.
Due to the frequency of the *6, determinant allele for PM profile, found in the Amazonian Native American populations, it can be inferred that this population presents greater risks of developing toxicities if they are submitted to antiretroviral and opioid treatments. There are no studies investigating the CYP2B6*6 genotype in other Native American populations.
DPYD
The DPYD gene is a biomarker for predicting severe toxicity in chemotherapeutic treatments, specifically fluoropyrimidine-based therapies. The guidelines of the Clinical Pharmacogenetics Implementation Consortium (CPIC) describe three DPYD haplotypes as the major nonfunctional variants (*2A [rs3918290], *13 [rs55886062], and rs67376798) and strongly recommend the use of alternative drugs or the reduction (in 50%) of the standard dose of fluoropyrimidines for patients who are homozygous or heterozygous for any of these variants.49,50 These polymorphisms were investigated in the Amazonian Native American populations, but their deleterious alleles were not observed.
Another polymorphic variant of DPYD is the *9 allele (rs1801265). This mutation induces an exchange of amino acids in the gene product (dihydropyrimidine dehydrogenase [DPD]), which can affect the enzymatic activity of the protein. The allele *9 was observed in both genotypes *1/*9 and *9/*9 in our Native American populations with an average allelic frequency of 16%. This frequency is not in agreement with that found in the continental populations described in the 1000 genomes database, where the MAF is 26%. Despite the change in amino acids in the DPD protein caused by the *9 allele, there are still divergences in the literature regarding the possible alterations that this allele may cause to the metabolizing phenotypes of the DPYD gene.49,51
Thus, as the Amazonian Native Americans investigated do not have deleterious alleles of the three main polymorphic variants of the DPYD gene and as the *9 allele has not been correlated as a potential interference in therapeutic conducts, they are classified as extensive metabolizer and may, if needed, benefit from fluoropyrimidine-based treatments.
CYP3A5
The CYP3A5 gene is highly relevant to immunosuppressive therapies (Tacrolimus, Sirolimus, s and Everolimus), and dose adjustment is recommended for these drugs based on rs776746 SNP genotyping that characterizes the *3 allele.52 Amazonian Native Americans have a high frequency of the *3 allele in the three populations evaluated and, consequently, a large number of individuals with a PM profile. Data from the 1000 Genomes Project confirm that the deleterious allele *3 in the CYP3A5 gene is strongly influenced by population groups. The frequency of this polymorphism in Amazonian Native Americans (63%) resembles SAS and EAS populations with a frequency of 69%; however, it shows divergence with the EUR (94%) and AFR (18%) populations.8
A recent study evaluated the frequency of the rs776746 polymorphism and its association with hypertension in eight indigenous populations from Mexico.53 The analysis report that the CYP3A5*3/*3 genotype frequencies ranged from 23.5% in Mexicaneros to 93.3% in Mayos, and the mean observed in the Mexican indigenous groups was 67.5% (very similar to the frequency found in the Native Americans of our study). Also, Galaviz-Hernandez et al found that the CYP3A5*3/*3 genotype was more frequent in indigenous women with higher systolic and diastolic blood pressures values.
Birdwell et al have shown an increase in the chances of having the *3 allele for individuals with greater European ancestry and a reduction for those with a greater African ancestry influence.54 A study with miscegenated transplant recipients in Brazil identified benefit when adjusting tacrolimus dose according to the genotypes *3, *6, and *7.55 The Brazilian protocol is based on the European protocol, which considers the high frequencies of the *3 allele in its population. The design of the protocol for individuals carrying the *1 allele requires an increase in the dose of tacrolimus since this allele characterizes the extensive metabolism phenotype.54,56 The Native American populations combined showed a frequency of 12% of this phenotype; consequently, these individuals may have low therapeutic efficacy with the use of tacrolimus through a standard protocol.
SLCO1B1
Although the SLCO1B1 variants did not show significant differences between the Native Americans populations, they have high frequencies of phenotypes that confer decreased or poor function of the SLCO1B1 protein-coding, which is extremely important from the pharmacogenomic point of view. The FDA and EMA have clinical recommendations based on SLCO1B1 genotyping in the use of statin therapies.57 The FDA recommends against 80 mg daily simvastatin dosage.31 In patients with the C allele at SLCO1B1 rs4149056, there are modest increases in myopathy risk, even at lower simvastatin doses (40 mg daily); if optimal efficacy is not achieved with a lower dose, alternate agents should be considered.58
Our results indicate a high frequency of the PM phenotype in samples of Amazonian Native Americans. The PM profile was characterized in our study by the high frequency of the mutant allele in the 521T> C polymorphism (defined as haplotype *5 or *15) of 43% in Amazonian Native Americans, which differs from the frequency found in other world populations from the 1000 Genomes Project (9%).6 The high frequency of this allele in Native American populations may have an important impact on the therapeutic course with the use of different statin-based drugs in these populations due to the risk of myopathies and other adverse effects resulting from therapeutic conduction.
Conclusion
Finally, it is well-known that important PGx loci have great variation among world populations. Therefore, investigations that analyze the pharmacogenomic profile of understudied ancestral population groups, such as Native Americans and, consequently, populations admixed with them, will facilitate the implementation of protocols of precision medicine for these populations.
Most protocols of therapeutic conduct used in Brazilian populations are based on recommendations for populations of European origin. Thus, studies that show population differences for these important loci can assist in the design of targeted protocols for Native American populations and the populations admixed with them, as these groups are commonly underrepresented in pharmacogenomic studies.
Ethics Approval and Informed Consent
The study was approved by the National Committee for Ethics in Research (CONEP) and by the Ethics and Research Committee of the Federal University of Pará, with CAAE number 20,654,313.6.0000.5172. The informed consent was obtained from each study participant, as well as the ethnic group leaders, and all research methods in this study were performed in accordance with the Declaration of Helsinki.
Acknowledgments
The authors thank the Center for Research in Molecular Medicine and Chronic Diseases (CiMUS), Universidade de Santiago de Compostela (USC), Núcleo de Pesquisas em Oncologia and Laboratório de Genética Humana e Médica (both from the Universidade Federal do Pará) for collaborating in the development of the study; the Coordenação de Aperfeiçoamento de Pessoal de Nível Superior (CAPES) for financing the first author’s scholarship in Brazil and in the Doctorate Sandwich Program.
Funding
The authors acknowledge funding from the Research Support Program - Projetos temáticos da Fundação Amazônia de Amparo a Estudos e Pesquisa do Pará: Saúde, Nº 006/2014 (FAPESPA/CNPq) and the Pró-Reitoria de Pesquisa e Pós-Graduação (PROPESP) of the Universidade Federal do Pará (UFPA). The first author’s scholarship in Brazil and the Doctorate Sandwich Program were financed by CAPES (N process: 99999.003676/2015-03). The funders had no role in the design of the study; in the collection, analyses, or interpretation of data; in the writing of the manuscript, or in the decision to publish the results.
Disclosure
The authors declare no conflicts of interest in this work.
References
1. Santos NPC, Ribeiro-Rodrigues EM, Ribeiro-dos-Santos ÂKC, et al. Assessing individual interethnic admixture and population substructure using a 48-insertion-deletion (INSEL) ancestry-informative marker (AIM) panel. Hum Mutat. 2010;31(2):184–190. doi:10.1002/humu.21159
2. Comissão de Integração Nacional, Desenvolvimento Regional e da Amazônia. Available from: www2.camara.leg.br/atividade-legislativa/comissoes/comissoes-permanentes/cindra/amazonia-legal/mais-informacoes-sobre-a-amazonia-legal.
3. Instituto Brasileiro de Geografia e Estatística (IBGE). No Title. Available from: https://indigenas.ibge.gov.br/images/pdf/indigenas/folder_indigenas_web.pdf.
4. Carlos EA, Ricardo Ventura Santos ALE. Epidemiologia e Saúde Dos Povos Indígenas No Brasil. Editora Fiocruz; 2003.
5. Suarez-Kurtz G. Pharmacogenetics in the Brazilian population. Front Pharmacol. 2010;1:118. doi:10.3389/fphar.2010.00118
6. Suarez-Kurtz G, Paula DP, Struchiner CJ. Pharmacogenomic implications of population admixture: brazil as a model case. Pharmacogenomics. 2014;15(2):209–219. doi:10.2217/pgs.13.238
7. Whirl-Carrillo M, McDonagh EM, Hebert JM, et al. Pharmacogenomics knowledge for personalized medicine. Clin Pharmacol Ther. 2012;92(4):414–417. doi:10.1038/clpt.2012.96
8. Auton A, Abecasis GR, Altshuler DM, et al. A global reference for human genetic variation. Nature. 2015;526(7571):68–74. doi:10.1038/nature15393
9. The pharmacogenomics knowledgebase. PharmGK. Available from: https://www.pharmgkb.org/.
10. U.S. Department of Health and Human Services FaDA. Available from: http://www.fda.gov/downloads/Drugs/GuidanceComplianceRegulatoryInformation/Guidances/ucm073162.pdf.
11. de Ramos BRA, MPB D, Amador MAT, et al. Neither self-reported ethnicity nor declared family origin are reliable indicators of genomic ancestry. Genetica. 2016;144(3):259–265. doi:10.1007/s10709-016-9894-1
12. Jombart T, Devillard S, Balloux F. Discriminant analysis of principal components: A new method for the analysis of genetically structured populations. BMC Genet. 2010;11:11. doi:10.1186/1471-2156-11-94
13. González JR, Armengol L, Solé X, et al. SNPassoc: an R package to perform whole genome association studies. Bioinformatics. 2007;23(5):644–645. doi:10.1093/bioinformatics/btm025
14. Aulchenko YS, Ripke S, Isaacs A, van Duijn CM. GenABEL: an R library for genome-wide association analysis. Bioinformatics. 2007;23(10):1294–1296. doi:10.1093/bioinformatics/btm108
15. Hartshorne T, Scientific TF, Le F, et al. A high-throughput real-time pcr approach to pharmacogenomics studies. J Pharmacogenomics amp. 2013;05. doi:10.4172/2153-0645.1000133
16. Gaedigk A, Simon SD, Pearce RE, Bradford LD, Kennedy MJ, Leeder JS. The CYP2D6 activity score: translating genotype information into a qualitative measure of phenotype. Clin Pharmacol Ther. 2008;83(2). doi:10.1038/sj.clpt.6100406
17. Gaedigk A, Sangkuhl K, Whirl-Carrillo M, Klein T, Steven Leeder J. Prediction of CYP2D6 phenotype from genotype across world populations. Genet Med. 2017;19(1):69–76. doi:10.1038/gim.2016.80
18. Kuhn PC, Horimoto ARVR, Sanches JM, Vieira Filho JPB, Franco L, Fabbro AD. Genome-wide analysis in Brazilian Xavante Indians reveals low degree of admixture. PLoS One. 2012;7(8):e42702. doi:10.1371/journal.pone.0042702
19. Salzano FM, Sans M. Interethnic admixture and the evolution of Latin American populations. Genetics Molecular Biol. 2014;37(1 suppl 1):151–170. doi:10.1590/s1415-47572014000200003
20. Mizzi C, Dalabira E, Kumuthini J, Dzimiri N, Balogh I, Başak NA. European spectrum of pharmacogenomic biomarkers: implications for clinical pharmacogenomics. PLoS One. 2016;11(9):e0162866. doi:10.1371/journal.pone.0162866
21. Jittikoon J, Mahasirimongkol S, Charoenyingwattana A, Chaikledkaew U, Tragulpiankit P, Mangmool S. Comparison of genetic variation in drug ADME-related genes in Thais with Caucasian, African and Asian HapMap populations. J Hum Genet. 2016;61(2):119–127. doi:10.1038/jhg.2015.115
22. Rodrigues JCG, Fernandes MR, Guerreiro JF, Ribeiro-dos-Santos  C, Santos S. Polymorphisms of ADME-related genes and their implications for drug safety and efficacy in Amazonian Amerindians. Sci Rep. 2019;9(1):7201. doi:10.1038/s41598-019-43610-y
23. Cuautle-Rodríguez P, Llerena A, Molina-Guarneros J. Present status and perspective of pharmacogenetics in Mexico. Drug Metabol Drug Interact. 2014;29(1):37–45. doi:10.1515/dmdi-2013-0019
24. Chiurillo MA, Griman P, Santiago L, Torres K, Moran Y, Borjas L. Distribution of GSTM1, GSTT1, GSTP1 and TP53 disease-associated gene variants in native and urban Venezuelan populations. Gene. 2013;531(1):106–111. doi:10.1016/j.gene.2013.08.055
25. Rito T, Vieira D, Silva M, Conde-Sousa E, Pereira L, Mellars P. A dispersal of Homo sapiens from southern to eastern Africa immediately preceded the out-of-Africa migration. Sci Rep. 2019;9(1):4728. doi:10.1038/s41598-019-41176-3.
26. Bryc K, Durand EY, Macpherson JM, Reich D, Mountain JL. The genetic ancestry of african americans, latinos, and european Americans across the United States. Am J Hum Genet. 2015;96(1):37. doi:10.1016/j.ajhg.2014.11.010
27. Céspedes-Garro C, Naranjo MEG, Ramírez R, Serrano V, Fariñas H, Barrantes R. Pharmacogenetics in Central american healthy volunteers: interethnic variability. Drug Metab Pers Ther. 2015;30(1):19–31. doi:10.1515/dmdi-2014-0025
28. Shriner D, Tekola-Ayele F, Adeyemo A, Rotimi CN. Ancient human migration after out-of-Africa. Sci Rep. 2016;6:26565. doi:10.1038/srep26565
29. DM RR, DQB V, Crovella S, Brandão LAC. On the use of Chinese population as a proxy of Amerindian ancestors in genetic admixture studies with Latin American populations. Eur J Hum Genet. 2016;24:326–327. doi:10.1038/ejhg.2015.184
30. Sosa-Macías M, Lazalde-Ramos BP, Galaviz-Hernández C, Rangel-Villalobos H, Salazar-Flores J, Martínez-Sevilla VM. Influence of admixture components on CYP2C9*2 allele frequency in eight indigenous populations from Northwest Mexico. Pharmacogenomics J. 2013;13(6):567–572. doi:10.1038/tpj.2012.52
31. Food and Drug Administration. Table of Pharmacogenomics Biomarkers in Drug Labeling. Available from: https://www.fda.gov/drugs/science-and-research-drugs/table-pharmacogenomic-biomarkers-drug-labeling.
32. Horstmann S, Lucae S, Menke A, Hennings JM, Ising M, Roeske D. Polymorphisms in GRIK4, HTR2A, and FKBP5 show interactive effects in predicting remission to antidepressant treatment. Neuropsychopharmacology. 2010;35(3):727–740. doi:10.1038/npp.2009.180
33. Matic M, De Wildt SN, Tibboel D, Van Schaik RHN. Analgesia and opioids: a pharmacogenetics shortlist for implementation in clinical practice. Clin Chem. 2017;63(7):1204–1213. doi:10.1373/clinchem.2016.264986
34. Baber M, Bapat P, Nichol G, Koren G. The pharmacogenetics of opioid therapy in the management of postpartum pain: a systematic review. Pharmacogenomics. 2016;17(1):75–93. doi:10.2217/pgs.15.157
35. Chuah B, Goh BC, Lee SC, et al. Comparison of the pharmacokinetics and pharmacodynamics of S-1 between Caucasian and East Asian patients. Cancer Sci. 2011;102(2):478–483. doi:10.1111/j.1349-7006.2010.01793.x
36. Alachkar H, Fulton N, Sanford B, Malnassy G, Mutonga M, Larson RA. Expression and polymorphism (rs4880) of mitochondrial superoxide dismutase (SOD2) and asparaginase induced hepatotoxicity in adult patients with acute lymphoblastic leukemia. Pharmacogenomics J. 2017;17(3):274–279. doi:10.1038/tpj.2016.7
37. Chan SL, Samaranayake N, Ross CJD, Toh MT, Carleton B, Hayden MR. Genetic diversity of variants involved in drug response and metabolism in Sri Lankan populations: implications for clinical implementation of pharmacogenomics. Pharmacogenet Genomics. 2016;26(1):28–39. doi:10.1097/FPC.0000000000000182
38. Sun X, Yu WY, Le MW, Huang LH, Yang GP. Impact of the CYP4F2 gene polymorphisms on the warfarin maintenance dose: A systematic review and meta-analysis. Biomed Reports. 2016;4(4):498–506. doi:10.3892/br.2016.599
39. Shendre A, Brown TM, Liu N, Hill CE, Beasley TM, Nickerson DA. Race-specific influence of CYP4F2 on dose and risk of hemorrhage among warfarin users. Pharmacotherapy. 2016;36(3):263–272. doi:10.1002/phar.1717
40. LLerena A, Naranjo MEG, Rodrigues-Soares F, Penas-LLedó EM, Fariñas H, Tarazona-Santos E. Interethnic variability of CYP2D6 alleles and of predicted and measured metabolic phenotypes across world populations. Expert Opin Drug Metab Toxicol. 2014;10(11):1569–1583. doi:10.1517/17425255.2014.964204
41. Lazalde-Ramos BP, Martínez-Fierro MDLL, Galaviz-Hernández C, Garza-Veloz I, Naranjo MEG, Sosa-Macías M. CYP2D6 gene polymorphisms and predicted phenotypes in eight indigenous groups from northwestern Mexico. Pharmacogenomics. 2014;15(3):339–348. doi:10.2217/pgs.13.203
42. Fricke-Galindo I, Jung-Cook H, Llerena A, López-López M. Interethnic variability of pharmacogenetic biomarkers in mexican healthy volunteers: a report from the RIBEF (Ibero-American Network of Pharmacogenetics and Pharmacogenomics. Drug Metab Pers Ther. 2016;31(2):61–81. doi:10.1515/dmpt-2015-0030
43. Gaedigk A, Dinh JC, Jeong H, Prasad B, Leeder JS. Ten years’ experience with the CYP2D6 activity score: a perspective on future investigations to improve clinical predictions for precision therapeutics. J Pers Med. 2018;8(2):15. doi:10.3390/jpm8020015
44. Perez-Paramo YX, Hernandez-Cabrera F, Rojas-Martinez A, Ortiz-Lopez R. CYP2D6 in amerindians from southern mexico: low variability and higher frequency of functional alleles. Drug Metab Pers Ther. 2015;30(4):231–238. doi:10.1515/dmpt-2015-0017
45. Moreno N, Flores-Angulo C, Villegas C, Mora Y. CYP2D6 variability in populations from venezuela. Drug Metab Pers Ther. 2016;31(4):181–189. doi:10.1515/dmpt-2016-0023
46. Chen GL, Liu F-Q, Yang L. The P450 oxidoreductase (POR) rs2868177 and cytochrome P450 (CYP) 2B6*6 polymorphisms contribute to the interindividual variability in human CYP2B6 activity. Eur J Clin Pharmacol. 2016;72(10):1205–1213. doi:10.1007/s00228-016-2095-0
47. Queiroz MAF, Laurentino RV, da Silva Graça Amoras E. The CYP2B6 G516T polymorphism influences CD4+ T-cell counts in HIV-positive patients receiving antiretroviral therapy in an ethnically diverse region of the Amazon. Int J Infect Dis. 2017;55:4–10. doi:10.1016/j.ijid.2016.12.002
48. Amstutz U, Henricks LM, Offer SM, Barbarino J, Schellens JHM, Swen JJ. Clinical Pharmacogenetics Implementation Consortium (CPIC) Guideline for dihydropyrimidine dehydrogenase genotype and fluoropyrimidine dosing: 2017 update. Clin Pharmacol Ther. 2018;103(2):210–216. doi:10.1002/cpt.911
49. Henricks LM, Lunenburg CATC, Man FM, Meulendijks D, Frederix GWJ, Kienhuis E. DPYD genotype-guided dose individualisation of fluoropyrimidine therapy in patients with cancer: a prospective safety analysis. Lancet Oncol. 2018;19(11):1459–1467. doi:10.1016/S1470-2045(18)30686-7.
50. Gentile G, Botticelli A, Lionetto L, Mazzuca F, Simmaco M, Marchetti P. Genotype-phenotype correlations in 5-fluorouracil metabolism: A candidate DPYD haplotype to improve toxicity prediction. Pharmacogenomics J. 2016;16(4):320–325. doi:10.1038/tpj.2015.56
51. Hesselink DA, Bouamar R, Elens L, Van Schaik RHN, Van Gelder T. The role of pharmacogenetics in the disposition of and response to tacrolimus in solid organ transplantation. Clin Pharmacokinet Clin Pharmacokinet. 2014;53:123–139. doi:10.1007/s40262-013-0120-3
52. Rodrigues-Soares F, Suarez-Kurtz G. Pharmacogenomics research and clinical implementation in Brazil. Basic Clin Pharmacol Toxicol. 2019;124(5):538–549. doi:10.1111/bcpt.13196
53. Galaviz-Hernández C, Lazalde-Ramos BP, Lares-Assef I, et al. Influence of genetic admixture components on CYP3A5*3 Allele-associated hypertension in amerindian populations from northwest mexico. Front Pharmacol. 2020:11. 10.3389/fphar.2020.00638.
54. Birdwell KA, Decker B, Barbarino JM, et al. Clinical Pharmacogenetics Implementation Consortium (CPIC) guidelines for CYP3A5 genotype and tacrolimus dosing. Clin Pharmacol Ther. 2015;98(1):19–24. doi:10.1002/cpt.113
55. Santoro A, Felipe CR, Tedesco-Silva H, Medina-Pestana JO, Struchiner CJ, Ojopi EB. Pharmacogenetics of calcineurin inhibitors in Brazilian renal transplant patients. Pharmacogenomics. 2011;12(9):1293–1303. doi:10.2217/pgs.11.70
56. Tonk ECM, Gurwitz D, Maitland-van der Zee A-H, Janssens ACJW. Assessment of pharmacogenetic tests: presenting measures of clinical validity and potential population impact in association studies. Pharmacogenomics J. 2017;17(4):386–392. doi:10.1038/tpj.2016.34
57. Ramsey LB, Johnson SG, Caudle KE, Haidar CE, Voora D, Wilke RA. The clinical pharmacogenetics implementation consortium guideline for SLCO1B1 and Simvastatin-Induced Myopathy: 2014 Update. Clin Pharmacol Ther. 2014;96(4):423–428. doi:10.1038/clpt.2014.125
58. Linskey DW, English JD, Perry DA, et al. Association of SLCO1B1 c.521T>C (rs4149056) with discontinuation of atorvastatin due to statin-associated muscle symptoms. Pharmacogenet Genomics. 2020:22. 10.1097/FPC.0000000000000412.
 © 2021 The Author(s). This work is published and licensed by Dove Medical Press Limited. The full terms of this license are available at https://www.dovepress.com/terms.php and incorporate the Creative Commons Attribution - Non Commercial (unported, v3.0) License.
By accessing the work you hereby accept the Terms. Non-commercial uses of the work are permitted without any further permission from Dove Medical Press Limited, provided the work is properly attributed. For permission for commercial use of this work, please see paragraphs 4.2 and 5 of our Terms.
© 2021 The Author(s). This work is published and licensed by Dove Medical Press Limited. The full terms of this license are available at https://www.dovepress.com/terms.php and incorporate the Creative Commons Attribution - Non Commercial (unported, v3.0) License.
By accessing the work you hereby accept the Terms. Non-commercial uses of the work are permitted without any further permission from Dove Medical Press Limited, provided the work is properly attributed. For permission for commercial use of this work, please see paragraphs 4.2 and 5 of our Terms.