")
Back to Journals » OncoTargets and Therapy » Volume 8
Gene expression profile analysis of colorectal cancer to investigate potential mechanisms using bioinformatics
Authors Kou Y, Zhang S, Chen X, Hu S
Received 9 December 2014
Accepted for publication 14 February 2015
Published 8 April 2015 Volume 2015:8 Pages 745—752
DOI https://doi.org/10.2147/OTT.S78974
Checked for plagiarism Yes
Review by Single anonymous peer review
Peer reviewer comments 3
Editor who approved publication: Dr Faris Farassati
Yubin Kou,1,2* Suya Zhang,3* Xiaoping Chen,2 Sanyuan Hu1
1Department of General Surgery, Qilu Hospital of Shandong University, Jinan, People’s Republic of China; 2Department of General Surgery, 3Department of Neurology, Shuguang Hospital Baoshan Branch, Shanghai, People’s Republic of China
*These authors contributed equally to this work
Abstract: This study aimed to explore the underlying molecular mechanisms of colorectal cancer (CRC) using bioinformatics analysis. Using GSE4107 datasets downloaded from the Gene Expression Omnibus, the differentially expressed genes (DEGs) were screened by comparing the RNA expression from the colonic mucosa between 12 CRC patients and ten healthy controls using a paired t-test. The Gene Ontology (GO) functional and pathway enrichment analyses of DEGs were performed using the Database for Annotation, Visualization and Integrated Discovery (DAVID) software followed by the construction of a protein–protein interaction (PPI) network. In addition, hub gene identification and GO functional and pathway enrichment analyses of the modules were performed. A total of 612 up- and 639 downregulated genes were identified. The upregulated DEGs were mainly involved in the regulation of cell growth, migration, and the MAPK signaling pathway. The downregulated DEGs were significantly associated with oxidative phosphorylation, Alzheimer’s disease, and Parkinson’s disease. Moreover, FOS, FN1, PPP1CC, and CYP2B6 were selected as hub genes in the PPI networks. Two modules (up-A and up-B) in the upregulated PPI network and three modules (d-A, d-B, and d-C) in the downregulated PPI were identified with the threshold of Molecular Complex Detection (MCODE) Molecular Complex Detection (MCODE) score ≥4 and nodes ≥6. The genes in module up-A were significantly enriched in neuroactive ligand–receptor interactions and the calcium signaling pathway. The genes in module d-A were enriched in four pathways, including oxidative phosphorylation and Parkinson’s disease. DEGs, such as FOS, FN1, PPP1CC, and CYP2B6, may be used as potential targets for CRC diagnosis and treatment.
Keywords: molecular mechanisms, network module, enrichment analysis
Introduction
Colorectal cancer (CRC) is a leading cause of cancer-related deaths worldwide, accounting for more than 1 million cases and 600,000 deaths every year.1 CRC is a cancer mostly due to uncontrolled cell growth in the colon, rectum, or appendix. Many factors may cause CRC including smoking, obesity, alcohol, older age, high fat intake, and a lack of physical exercise.2 For patients in the age range of 55–64 years, flexible sigmoidoscopic screening has been used to treat CRC and could reduce its incidence and mortality by 33% and 43%, respectively.3 Although colonoscopic screening has become a reliable screening tool for treatment of CRC, it has the shortcomings of bleeding and perforations, as well as a tendency to cause acute diverticulitis.4 Therefore, the identification of reliable, accurate, and sensitive biomarkers to improve the detection of CRC is imperative.
Over the past decades, various genetic studies have been established, which are associated with the accumulated process and progress of CRC. For example, a recent study identified that the microRNA-126 that targets CXCR4 was downregulated in CRC tissue and was involved in distant metastasis, clinical tumor–node–metastasis staging, and poor survival.5 Xu et al6 reported that downregulated microRNA-375 in tissue and plasma was matched in CRC and associated with some critical signal pathways, such as MAPK, Wnt, and TGF-beta signal pathways in the development and progression of CRC. In addition, based on gene/exon/network-level analysis tools, ATP8B1 was found to be a novel gene associated with CRC, which changed at the cytogenetic, gene, and exon levels.7 After implementing a computational compilation of protein conformational changes and the probable CRC-associated phenotype, Kumar et al8 found that the E403K mutation in the mitotic centromere-associated kinesis protein could produce CRC-associated phenotypic affects by producing a major impact on the structural conformation of the protein. Recent evidence generated from an experimental interleukin-10-deficient mouse model using microbial genomic analysis showed that inflammation played an important role in bacteria-induced CRC.9 Although these expanded efforts studied the genetic bases of CRC, the molecular mechanisms of the development and progress are not fully understood.
Recently, gene expression profile data associated with CRC have been studied by many researchers. For example, Liu et al10 downloaded the microarray data of GSE4107 and GSE8671, screened common differentially expressed genes (DEGs) between CRC and healthy controls (HC), and performed Gene Ontology (GO) functional and Kyoto Encyclopedia of Genes and Genomes (KEGG) pathway enrichment analyses. However, they did not perform further study of DEGs, such as the construction of a protein–protein interaction (PPI) network and module analysis of the PPI network.
In the present study, using the same microarray data (GSE4107), we compared RNA expression from colonic mucosa between 12 patients with CRC and ten HC samples to identify the DEGs. In addition, we constructed the PPI network of the DEGs and performed hub gene identification and module analysis of the PPI network. The findings of this study may provide an improved understanding of and lead to an improved diagnosis of CRC.
Materials and methods
Affymetrix chip data
The Gene Expression Omnibus (GEO) (http://www.ncbi.nlm.nih.gov/geo/) database at the National Center for Biotechnology Information (NCBI) is currently the largest fully public gene expression resource, which includes 214,268 samples and 4,500 platforms.11 The chip dataset GSE4107, which included 12 CRC patients and ten HC samples, was downloaded from GEO.12 The HC and CRC samples were age- (50 years or less), ethnicity- (Chinese), and tissue-matched. The RNA extracted from the colonic mucosa of the HC and CRC samples was analyzed using the GPL570 (HG-U133_Plus_2) Affymetrix Human Genome U133 Plus 2.0 Array.
Data preprocessing and analysis of DEGs
The affy package is an R package of functions and classes for the analysis of oligonucleotide arrays.13 Data preprocessing was performed using robust multi-array average in the affy package in R, including background adjustment, normalization, and log transformation of the values.14 Then, the original CEL file data were transformed to probe-level data. Further, the probe-level data were converted to gene symbols using the Perl procedure given that when several probes corresponded to one gene symbol, the gene expression value was the mean of the probes. Multiple testing was corrected using the Benjamini–Hochberg15 procedure to obtain the adjusted P-value. Then, the log2-fold change (log2FC) was calculated. Only genes with an adjusted P-value <0.05 and |log2FC| >1 were regarded as DEGs.
Functional and pathway enrichment analysis
As a comprehensive set of functional annotation tools, the Database for Annotation, Visualization and Integrated Discovery (DAVID) has been used for systematic and integrative analysis of large gene lists.16 GO terms are significantly overrepresented in a set of genes from three aspects, including the cellular component, molecular function, and biological process.17 In our work, the significant GO biological process terms and KEGG pathway enrichment analyses of the identified DEGs were performed using DAVID with the thresholds of P-value <0.05 and enrichment gene count >2.
PPI network construction
The Search Tool for the Retrieval of Interacting Genes (STRING) database (http://www.bork.embl-heidelberg.de/STRING/)18 is a pre-computed global resource for the exploration and analysis of PPI information. In the present study, the STRING 9.0 online tool was used to screen the PPI of the DEGs. The DEGs with required confidence (combined score) >0.4 were selected, and then the PPI network was constructed and visualized using Cytoscape.19 Given that most of the networks were scale-free, the hub genes were then selected with a connectivity degree >10.
Module analysis of the PPI network
The module analysis was performed on the PPI network using the Molecular Complex Detection (MCODE) in Cytoscape with a degree cutoff =2, node score cutoff =0.2, k-core =2, and max depth =100.20 Then, the significant modules with MCODE score ≥4 and node ≥6 were selected. Next, GO functional and KEGG pathway enrichment analyses of the most significant module were performed with a threshold of P<0.05.
Results
Identification of DEGs
Using bioinformatics approaches, a total of 1,251 DEGs between ten HC and 12 CRC samples were identified, including 612 upregulated and 639 downregulated genes.
GO functional and pathway enrichment analysis
Based on DAVID software, a total of 29 GO functions were enriched. Among them, the upregulated DEGs were mainly enriched in 15 GO functions and the downregulated DEGs were mainly enriched in 14 GO functions. The top five GO terms in each are shown in Table 1. The most significant GO function in the upregulated DEGs was the regulation of cell growth, and the most significant one in the downregulated DEGs was Golgi vesicle transport.
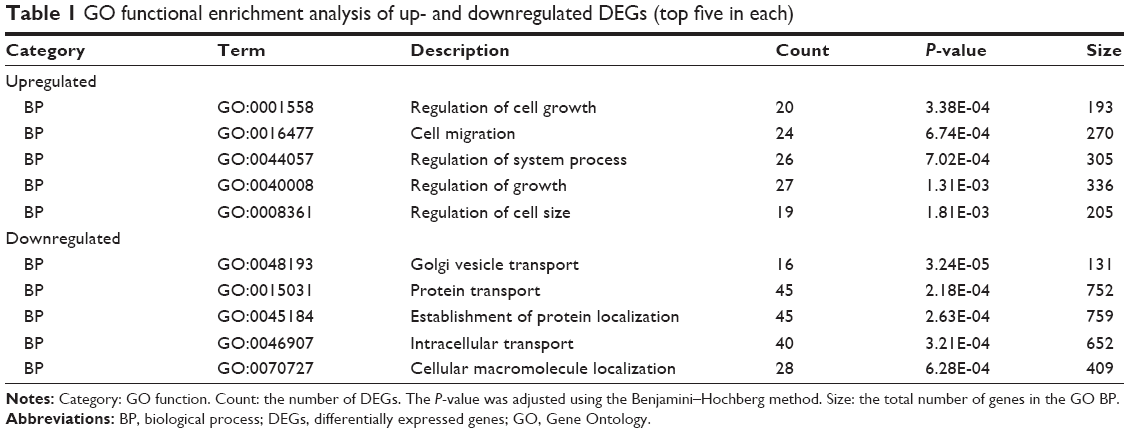 | Table 1 GO functional enrichment analysis of up- and downregulated DEGs (top five in each) |
After KEGG pathway enrichment analysis, the upregulated DEGs were mainly enriched in seven KEGG pathways including vascular smooth muscle contraction, axon guidance, and the MAPK signaling pathway. The downregulated DEGs were mainly enriched in ten pathways, such as oxidative phosphorylation and Parkinson’s disease (Table 2).
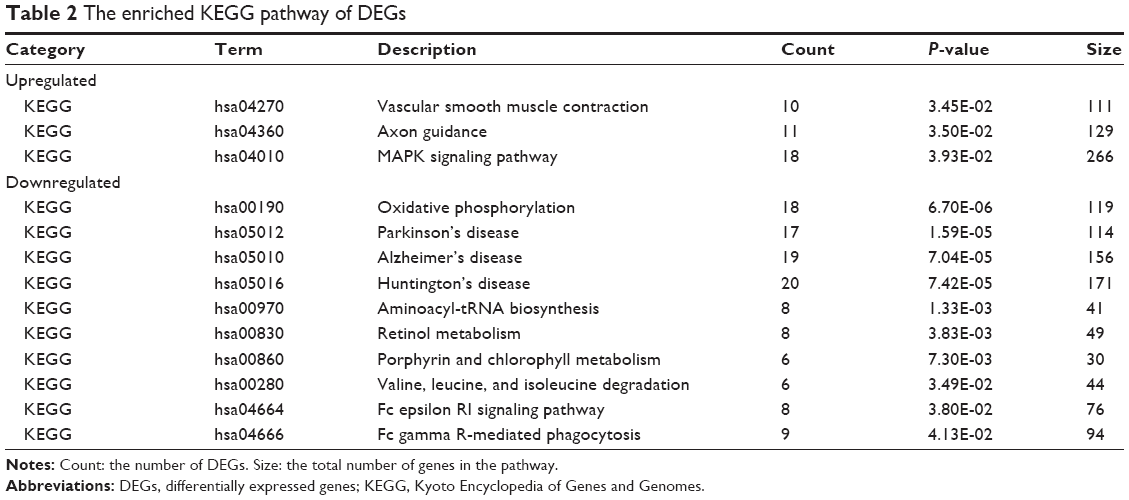 | Table 2 The enriched KEGG pathway of DEGs |
PPI network construction and hub gene identification
After the upregulated and downregulated DEGs were submitted into STRING, a total of 998 upregulated and 900 downregulated PPI relationships were obtained, respectively. Then, the hub genes or proteins in the networks with connectivity degree >10 were identified (Table 3). A total of 44 hub genes were selected from the upregulated PPI network, which included FBJ murine osteosarcoma viral oncogene homolog (FOS), fibronectin 1 (FN1), and CREB binding protein (CREBBP). Meanwhile, 43 hub genes, such as protein phosphatase 1, catalytic subunit, gamma isozyme (PPP1CC); ATP synthase, H+ transporting, mitochondrial Fo complex, subunit B1 (ATP5F1); and cytochrome P450, family 2, subfamily B, polypeptide 6 (CYP2B6), were identified from the downregulated PPI network.
 | Table 3 The hub proteins in the upregulated and downregulated protein–protein interaction network (top 20 in each) |
Module analysis
Two modules with MCODE scores ≥4 and nodes ≥6 were selected in the upregulated PPI networks: up-A (MCODE score =6.429) with 29 nodes and up-B (MCODE score =4.522) with 24 nodes (Figure 1). Meanwhile, there were three modules in the downregulated PPI network: d-A (MCODE score =14) with 15 nodes, d-B (MCODE score =7.75) with nine nodes, and d-C (MCODE score =7.714) with eight nodes (Figure 2).
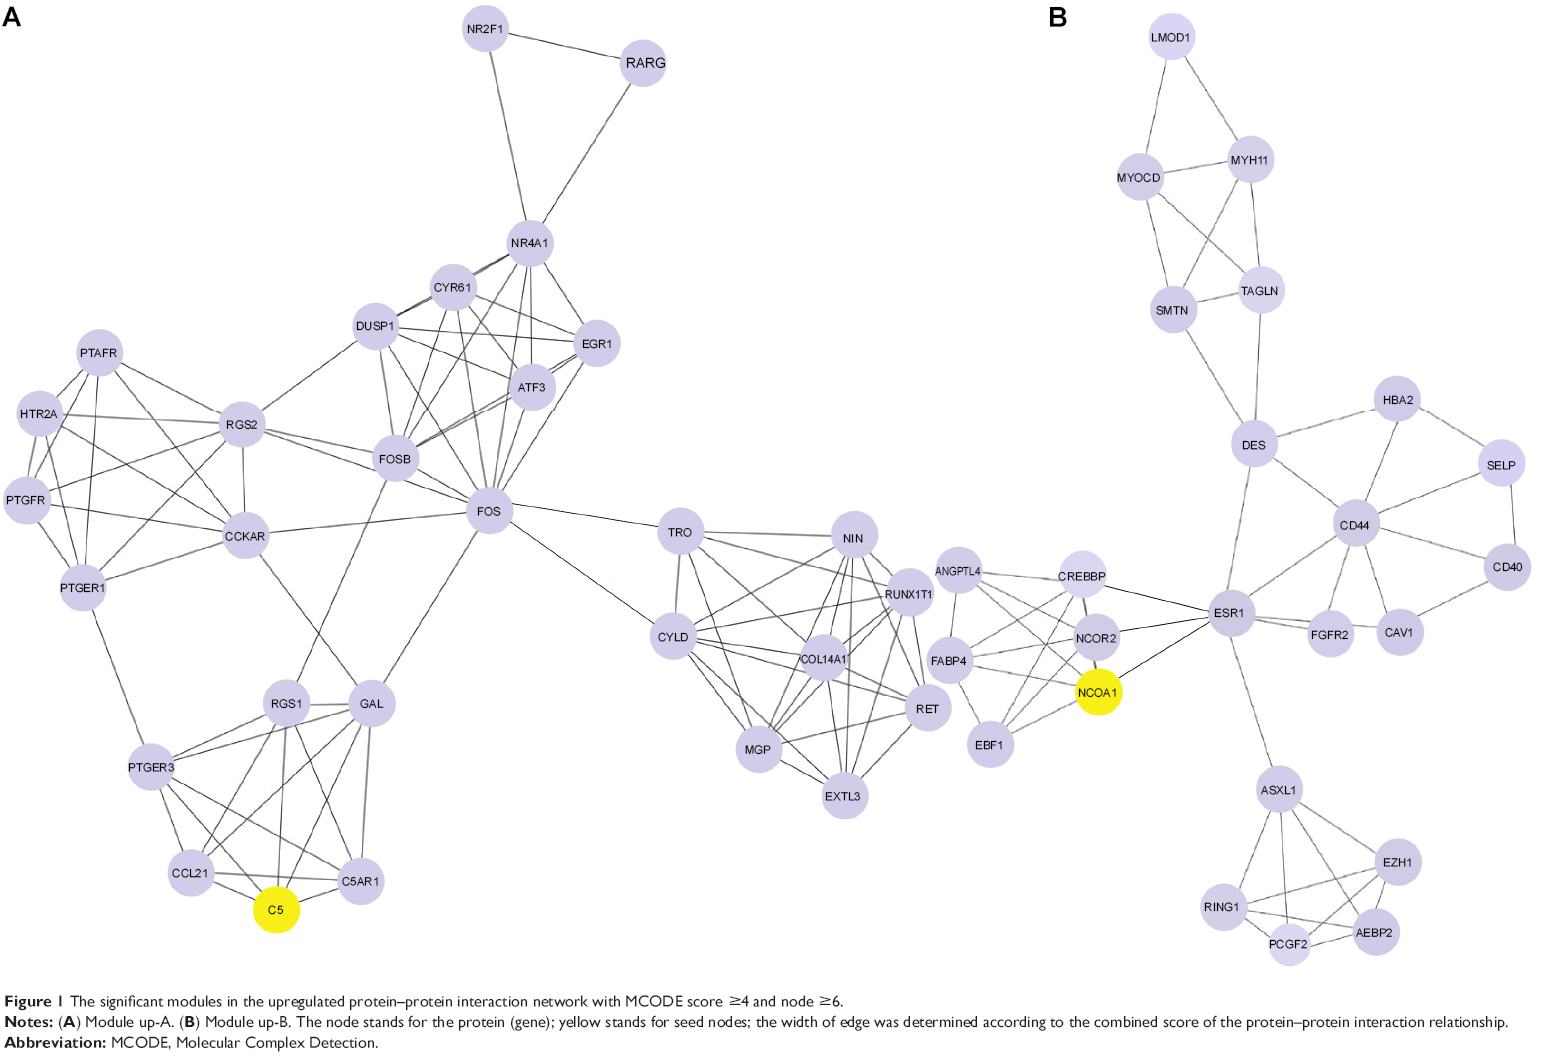 | Figure 1 The significant modules in the upregulated protein–protein interaction network with MCODE score ≥4 and node ≥6. |
 | Figure 2 The significant modules in the downregulated protein–protein interaction network with MCODE score ≥4 and node ≥6. |
The GO functional enrichment scores of modules up-A and d-A were 3.54 and 15.55, respectively. Module up-A was enriched in six functions such as behavior, taxis, and chemotaxis; module d-A was enriched in four functions such as oxidative phosphorylation and phosphorus metabolic process (Table 4). In addition, the KEGG pathway analysis revealed that the genes in module up-A were significantly enriched in pathways including neuroactive ligand–receptor interactions and the calcium signaling pathway; the genes in module d-A were significantly enriched in oxidative phosphorylation, Parkinson’s disease, Alzheimer’s disease, and Huntington’s disease (Table 5).
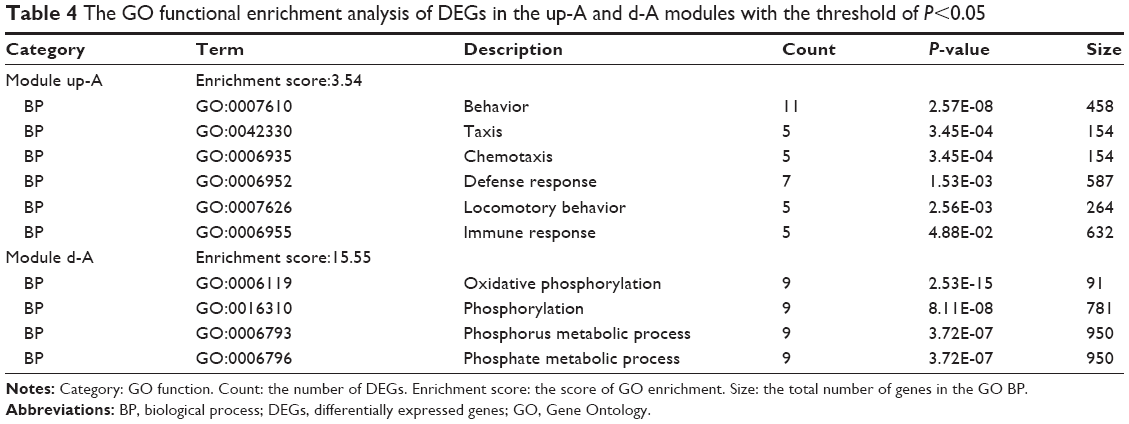 | Table 4 The GO functional enrichment analysis of DEGs in the up-A and d-A modules with the threshold of P<0.05 |
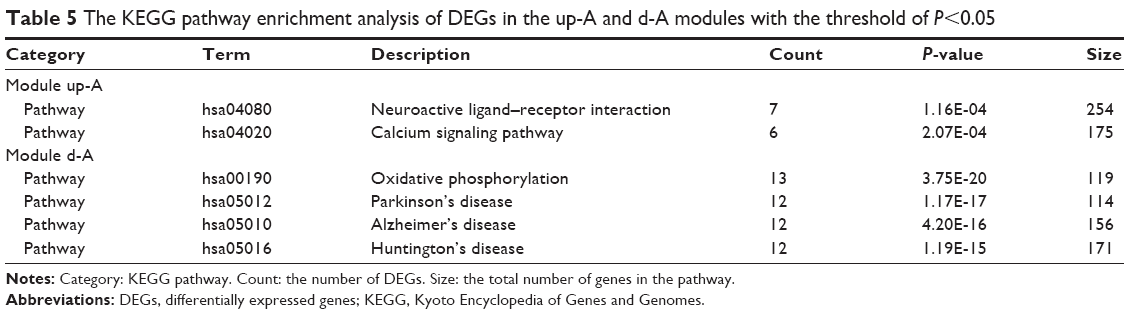 | Table 5 The KEGG pathway enrichment analysis of DEGs in the up-A and d-A modules with the threshold of P<0.05 |
Discussion
The analysis of gene expression profiling has been widely used to reveal the abnormally expressed genes associated with CRC and has enabled the identification of targets for therapeutic strategies. In our study, the CRC mechanism was analyzed by bioinformatics, including DEGs screening, PPI network construction, hub gene identification, and module analysis of the PPI network. Based on these results, the underlying molecular mechanisms of CRC were explored on genetic and molecular levels, which provided new insights into CRC diagnosis and treatment.
After analyzing the hub genes from the upregulated PPI network, FOS and FN1 were selected with the high connective degree. The FOS gene family was demonstrated to encode leucine zipper proteins and act as a regulator of cell proliferation, differentiation, and transformation.21 FOS was upregulated in the mucosa of CRC and participated in the biological processes of transcription regulation, cell growth, and inflammatory response in early-onset CRC.16 In addition, the overexpression of Fra-1, a member of the FOS family, played an essential role in tumorigenesis and was required for the motility and invasion of CRC cells through the downregulation of β1-integrin, resulting in decreased cell-substratum adhesion and cell inactivation of the Pho-ROCK pathway.22,23
FN1 has been found to play a major role in cell adhesion, growth, migration, differentiation, and wound healing.24 Increased expression of FN1 was found in node-positive CRC and mediated migration of CRC cells in vitro.25 Additionally, it is well established that FN expression is involved in the tissue remodeling processes that are associated with CRC progression.26 Together with the genes that participate as mediators of cytoskeletal organization and integrin signaling, they form a pattern of colon cancer-specific changes and particularly impact cell motility.27 In our study, FOS and FN1 were upregulated in the PPI network in CRC, suggesting that FOS and FN1 may be enrolled in the process and progress of CRC. However, further studies are needed to verify our hypothesis.
Additionally, PPP1CC and CYP2B6 were found as two hub genes in the downregulated PPI network. PPP1CC belongs to the protein phosphatase family, protein phosphatase 1 (PP1) subfamily. After analyzing the microarray data of colon cancer patients by using a Takagi-Sugeno-Kang (TSK)-type recurrent neural fuzzy network, Vineetha et al28 revealed that PPP1CC is associated with the GO term of proteolysis involved in cellular protein catabolic process and the insulin signaling pathway in CRC-related canonical pathways. In addition, PP1 was found to play an essential role in negatively regulating the extracellular signal-regulated kinase pathway in CRC cells.29 CYP2B6 encodes a member of the cytochrome P450 superfamily of enzymes. The cytochrome P450 enzymes play an important role in tumor development through their metabolism of many carcinogens.30 Several cytochrome P450s were found via immunohistochemistry to have increased expression in CRC and may act as independent markers of prognosis.31 Compounds associated with the etiology of CRC contain polycyclic aromatic hydrocarbons, in particular, heterocyclic amines, which require metabolic activation by the cytochrome P450 enzymes before exerting their genotoxic effect.32 In addition, many of the cytochrome P450 enzyme genes such as CYP1A2 and CYP1B1 play essential roles in CRC susceptibility.33 Taken together, these data support the hypothesis that PPP1CC and CYP2B6 may act as candidate molecular markers associated with CRC.
In the current study, our data were downloaded from the gene expression profile dataset GSE4107, which has been reported by Hong et al.12 As in Hong et al’s study, we also analyzed the DEGs between CRC samples and HC and performed GO functional and pathway enrichment analyses to explore the potential molecular mechanism of CRC. However, there are still some discrepancies. Based on Hong et al’s study, further studies using bioinformatics were performed, such as the construction of a PPI network, hub gene analysis, and module analysis of the PPI network. Then, 998 upregulated and 900 downregulated PPI relationships were obtained followed by the identification of 44 hub genes from the upregulated PPI network and 43 from the downregulated PPI network. Additionally, two modules (up-A and up-B) in the upregulated PPI network and three modules (d-A, d-B, and d-C) in the downregulated PPI network were identified.
However, there are some limitations in our study. First, the small amount of data used in the current study were downloaded from the GEO database, not generated by us. Because GEO is a huge data repository, a meta-analysis of the relevant datasets of CRC may be performed in future studies. Second, the results were web-based and were not verified by biological experiments. Thus, further experimental studies based on our findings are still needed.
In summary, our study provides a comprehensive bioinformatics analysis of DEGs which may be involved in the progression and development of CRC. The findings of this study may provide a basis for understanding the underlying molecular mechanisms of CRC. In addition, DEGs such as FOS, FNI, PPP1CC, and CYP2B6 may be used as potential therapeutic targets for CRC. However, further studies are necessary for improving the diagnosis and treatment of CRC through regulating DEGs.
Disclosure
The authors report no conflicts of interest in this work.
References
Goel A, Boland CR. Recent insights into the pathogenesis of colorectal cancer. Curr Opin Gastroenterol. 2010;26(1):47–52. | ||
Zauber AG, Winawer SJ, O’Brien MJ, et al. Colonoscopic polypectomy and long-term prevention of colorectal-cancer deaths. N Engl J Med. 2012;366(8):687–696. | ||
Atkin WS, Edwards R, Kralj-Hans I, et al; UK Flexible Sigmoidoscopy Trial Investigators. Once-only flexible sigmoidoscopy screening in prevention of colorectal cancer: a multicentre randomised controlled trial. Lancet. 2010;375(9726):1624–1633. | ||
Rutter CM, Johnson E, Miglioretti DL, Mandelson MT, Inadomi J, Buist DS. Adverse events after screening and follow-up colonoscopy. Cancer Causes Control. 2012;23(2):289–296. | ||
Liu Y, Zhou Y, Feng X, et al. Low expression of microRNA-126 is associated with poor prognosis in colorectal cancer. Genes Chromosomes Cancer. 2014;53(4):358–365. | ||
Xu L, Li M, Wang M, Yan D, Feng G, An G. The expression of microRNA-375 in plasma and tissue is matched in human colorectal cancer. BMC Cancer. 2014;14:714. | ||
Aziz MA, Periyasamy S, Al Yousef Z, et al. Integrated exon level expression analysis of driver genes explain their role in colorectal cancer. PLoS One. 2014;9(10):e110134. | ||
Kumar A, Rajendran V, Sethumadhavan R, Purohit R. Evidence of colorectal cancer-associated mutation in MCAK: a computational report. Cell Biochem Biophys. 2013;67(3):837–851. | ||
Arthur JC, Gharaibeh RZ, Mühlbauer M, et al. Microbial genomic analysis reveals the essential role of inflammation in bacteria-induced colorectal cancer. Nat Commun. 2014;5:4724. | ||
Liu YJ, Zhang S, Hou K, et al. Analysis of key genes and pathways associated with colorectal cancer with microarray technology. Asian Pac J Cancer Prev. 2013;14(3):1819–1823. | ||
Barrett T, Wilhite SE, Ledoux P, et al. NCBI GEO: archive for functional genomics data sets – update. Nucleic Acids Res. 2013;41(Database issue):D991–D995. | ||
Hong Y, Ho KS, Eu KW, Cheah PY. A susceptibility gene set for early onset colorectal cancer that integrates diverse signaling pathways: implication for tumorigenesis. Clin Cancer Res. 2007;13(4):1107–1114. | ||
Gautier L, Cope L, Bolstad BM, Irizarry RA. Affy – analysis of Affymetrix GeneChip data at the probe level. Bioinformatics. 2004;20(3):307–315. | ||
Irizarry RA, Hobbs B, Collin F, et al. Exploration, normalization, and summaries of high density oligonucleotide array probe level data. Biostatistics. 2003;4(2):249–264. | ||
Benjamini Y, Hochberg Y. Controlling the false discovery rate: a practical and powerful approach to multiple testing. Journal of the Royal Statistical Society. Series B (Methodological). 1995;57(1):289–300. | ||
Huang da W, Sherman BT, Lempicki RA. Systematic and integrative analysis of large gene lists using DAVID bioinformatics resources. Nat Protoc. 2009;4(1):44–57. | ||
Ashburner M, Ball CA, Blake JA, et al. Gene ontology: tool for the unification of biology. The Gene Ontology Consortium. Nat Genet. 2000;25(1):25–29. | ||
von Mering C, Huynen M, Jaeggi D, Schmidt S, Bork P, Snel B. STRING: a database of predicted functional associations between proteins. Nucleic Acids Res. 2003;31(1):258–261. | ||
Smoot ME, Ono K, Ruscheinski J, Wang PL, Ideker T. Cytoscape 2.8: new features for data integration and network visualization. Bioinformatics. 2011;27(3):431–432. | ||
Rhrissorrakrai K, Gunsalus KC. MINE: Module Identification in Networks. BMC Bioinformatics. 2011;12:192. | ||
Ely HA, Mellon PL, Coss D. GnRH induces the c-Fos gene via phosphorylation of SRF by the calcium/calmodulin kinase II pathway. Mol Endocrinol. 2011;25(4):669–680. | ||
Milde-Langosch K. The Fos family of transcription factors and their role in tumourigenesis. Eur J Cancer. 2005;41(16):2449–2461. | ||
Vial E, Sahai E, Marshall CJ. ERK-MAPK signaling coordinately regulates activity of Rac1 and RhoA for tumor cell motility. Cancer Cell. 2003;4(1):67–79. | ||
White ES, Muro AF. Fibronectin splice variants: understanding their multiple roles in health and disease using engineered mouse models. IUBMB Life. 2011;63(7):538–546. | ||
Gulubova M, Vlaykova T. Immunohistochemical assessment of fibronectin and tenascin and their integrin receptors alpha5beta1 and alpha9beta1 in gastric and colorectal cancers with lymph node and liver metastases. Acta Histochem. 2006;108(1):25–35. | ||
Hanamura N, Yoshida T, Matsumoto E, Kawarada Y, Sakakura T. Expression of fibronectin and tenascin-C mRNA by myofibroblasts, vascular cells and epithelial cells in human colon adenomas and carcinomas. Int J Cancer. 1997;73(1):10–15. | ||
Gardina PJ, Clark TA, Shimada B, et al. Alternative splicing and differential gene expression in colon cancer detected by a whole genome exon array. BMC Genomics. 2006;7:325. | ||
Vineetha S, Chandra Shekara Bhat C, Idicula SM. Gene regulatory network from microarray data of colon cancer patients using TSK-type recurrent neural fuzzy network. Gene. 2012;506(2):408–416. | ||
Lee JH, Lee JS, Kim SE, et al. Tautomycetin inhibits growth of colorectal cancer cells through p21cip/WAF1 induction via the extracellular signal-regulated kinase pathway. Mol Cancer Ther. 2006;5(12):3222–3231. | ||
Guengerich FP, Shimada T. Activation of procarcinogens by human cytochrome P450 enzymes. Mutat Res. 1998;400(1–2):201–213. | ||
Kumarakulasingham M, Rooney PH, Dundas SR, et al. Cytochrome p450 profile of colorectal cancer: identification of markers of prognosis. Clin Cancer Res. 2005;11(10):3758–3765. | ||
Windmill KF, McKinnon RA, Zhu X, Gaedigk A, Grant DM, McManus ME. The role of xenobiotic metabolizing enzymes in arylamine toxicity and carcinogenesis: functional and localization studies. Mutat Res. 1997;376(1–2):153–160. | ||
Bethke L, Webb E, Sellick G, et al. Polymorphisms in the cytochrome P450 genes CYP1A2, CYP1B1, CYP3A4, CYP3A5, CYP11A1, CYP17A1, CYP19A1 and colorectal cancer risk. BMC Cancer. 2007;7:123. |
 © 2015 The Author(s). This work is published and licensed by Dove Medical Press Limited. The full terms of this license are available at https://www.dovepress.com/terms.php and incorporate the Creative Commons Attribution - Non Commercial (unported, v3.0) License.
By accessing the work you hereby accept the Terms. Non-commercial uses of the work are permitted without any further permission from Dove Medical Press Limited, provided the work is properly attributed. For permission for commercial use of this work, please see paragraphs 4.2 and 5 of our Terms.
© 2015 The Author(s). This work is published and licensed by Dove Medical Press Limited. The full terms of this license are available at https://www.dovepress.com/terms.php and incorporate the Creative Commons Attribution - Non Commercial (unported, v3.0) License.
By accessing the work you hereby accept the Terms. Non-commercial uses of the work are permitted without any further permission from Dove Medical Press Limited, provided the work is properly attributed. For permission for commercial use of this work, please see paragraphs 4.2 and 5 of our Terms.