")
Back to Journals » Neuropsychiatric Disease and Treatment » Volume 13
Gene expression-based biological test for major depressive disorder: an advanced study
Authors Watanabe S, Numata S, Iga J , Kinoshita M, Umehara H, Ishii K, Ohmori T
Received 18 August 2016
Accepted for publication 11 November 2016
Published 21 February 2017 Volume 2017:13 Pages 535—541
DOI https://doi.org/10.2147/NDT.S120038
Checked for plagiarism Yes
Review by Single anonymous peer review
Peer reviewer comments 3
Editor who approved publication: Dr Taro Kishi
Shin-ya Watanabe,1 Shusuke Numata,1 Jun-ichi Iga,2 Makoto Kinoshita,1 Hidehiro Umehara,1 Kazuo Ishii,3 Tetsuro Ohmori1
1Department of Psychiatry, Institute of Biomedical Sciences, Tokushima University Graduate School, Tokushima, 2Department of Neuropsychiatry, Molecules and Function, Ehime University Graduate School of Medicine, Ehime, 3Department of Applied Biological Science, Faculty of Agriculture, Tokyo University of Agriculture and Technology, Tokyo, Japan
Purpose: Recently, we could distinguished patients with major depressive disorder (MDD) from nonpsychiatric controls with high accuracy using a panel of five gene expression markers (ARHGAP24, HDAC5, PDGFC, PRNP, and SLC6A4) in leukocyte. In the present study, we examined whether this biological test is able to discriminate patients with MDD from those without MDD, including those with schizophrenia and bipolar disorder.
Patients and methods: We measured messenger ribonucleic acid expression levels of the aforementioned five genes in peripheral leukocytes in 17 patients with schizophrenia and 36 patients with bipolar disorder using quantitative real-time polymerase chain reaction (PCR), and we combined these expression data with our previous expression data of 25 patients with MDD and 25 controls. Subsequently, a linear discriminant function was developed for use in discriminating between patients with MDD and without MDD.
Results: This expression panel was able to segregate patients with MDD from those without MDD with a sensitivity and specificity of 64% and 67.9%, respectively.
Conclusion: Further research to identify MDD-specific markers is needed to improve the performance of this biological test.
Keywords: depressive disorder, biomarker, gene expression, schizophrenia, bipolar disorder
Introduction
Major depressive disorder (MDD) is a highly prevalent psychiatric disorder1 and a leading cause of disease burden.2 Currently, a diagnosis of MDD is made on the basis of clinical symptoms that are exhibited by patients. There are no established practical laboratory tests that can be used to discriminate patients with MDD from those without MDD.
Gene expression profiling of peripheral blood has emerged as a useful method not only to investigate the pathogenesis of MDD, but also to identify relevant biomarkers.3–5 Recently, we examined the diagnostic performance of a multi-assay leukocyte gene expression-based test comprising 40 candidate genes, and developed a panel of 5 gene expression markers (ARHGAP24, HDAC5, PDGFC, PRNP, and SLC6A4), which are able to distinguish patients with MDD from nonpsychiatric control subjects with high accuracy in discriminant analysis.6 However, it is not clear whether this panel of gene expression markers is useful when subjects with other psychiatric disorders, such as those with schizophrenia and bipolar disorder, are included. In some cases, it may be difficult for clinicians to accurately diagnose MDD at the patient’s first visit. Li et al7 have reported that a diagnosis of MDD was changed to bipolar disorder in 7.6%–12% of patients initially diagnosed with MDD, with a mean time to change of 1.89–2.98 years.7 Ruggero et al8 have reported that 16.4% of participants classified as having MDD with psychosis at baseline were later rediagnosed with schizophrenia or schizoaffective disorder.
In the present study, we measured five gene expression levels of subjects with schizophrenia and bipolar disorder, and we evaluated whether our gene expression-based markers for MDD are able to discriminate patients with MDD from those without MDD (controls, schizophrenia, and bipolar disorder) in the combined dataset of our previous study6 and the present study.
Materials and methods
Subjects
Seventeen medication-free patients with schizophrenia and 39 patients with bipolar disorder were recruited from the Tokushima University Hospital in Japan. Diagnoses of schizophrenia and bipolar disorder were made by at least two experienced psychiatrists according to DSM-IV criteria on the basis of extensive clinical interviews and a review of medical records. All of the patients with bipolar disorder were treated with lithium, anticonvulsants, atypical antipsychotics, antidepressants, or combinations of the above. None of the patients had any other medical disorder. The patients had not used nonsteroidal anti-inflammatory agents or steroids within at least 2 months before the study initiation. Demographic data for the participants are shown in Table 1. All subjects who participated in this study were of unrelated Japanese origin and signed written informed consent forms, this study was also approved by the Institutional Ethics Committee of the University of Tokushima Graduate School.
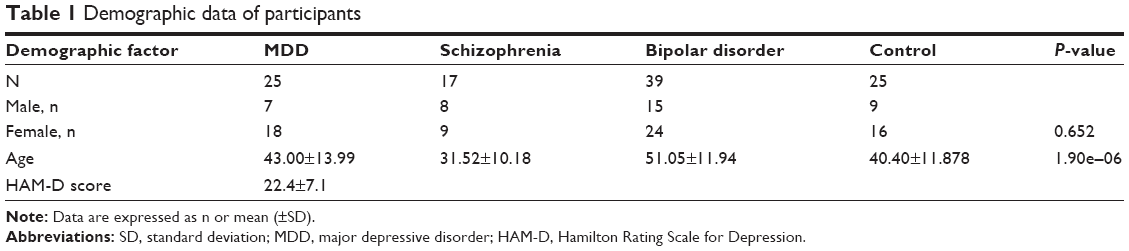 | Table 1 Demographic data of participants |
Tissue processing, RNA purification, and sample preparation for real-time PCR analysis
PAX gene blood ribonucleic acid (RNA) tubes (Qiagen, Tokyo, Japan) and PAX gene Blood RNA kits (Qiagen) were used according to the manufacturer’s recommendations to extract total RNA from peripheral leukocytes taken from whole blood samples. After assessing RNA quality and quantity, individual total RNA samples (2 μm each), random (N6) primers, and Quantiscript Reverse Transcriptase (Qiagen, Tokyo, Japan) were used to synthesize complementary deoxyribonucleic acids (cDNAs).
Gene expression analysis
Quantitative real-time polymerase chain reaction (RT-PCR) analysis was performed using an ABI 7500 Fast Real-Time PCR System (Applied Biosystems, Foster City, CA, USA) using the TaqMan gene expression probes (Applied Biosystems) Hs00229928_mL (ARHGAP24), Hs00608366_m1 (HDAC5), Hs00211916_m1 (PDGFC), Hs01920617_s1 (PRNP), Hs00984356_m1 (SLC6A4), and Hs99999905_m1 (GAPDH). GAPDH was used as the reference gene, as in our previous study.6 All measurements were performed in duplicate. The ΔΔCt method was used to determine relative expression of each gene in the subjects. The obtained value for each gene (Ctx) was used to calculate the relative level of gene expression (ΔCtx) by normalization to the reference gene, GAPDH. For validation of our expression data, we used 10 samples from the current study and measured GAPDH expression according to the same protocol, and we observed a high correlation between the two datasets (r2=0.986, P=1.11e-08). Expression data for 25 patients with MDD and 25 controls were obtained from our previous study.6
Statistical analyses and construction of the discrimination score
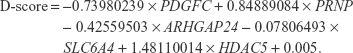
Statistical analyses were performed using R ver3.1.1. One-way analysis of variance (ANOVA) was used to test for differences in age among the groups, and Fisher’s exact test was used to examine differences in sex distribution among the groups. The significance of differential expression among groups was examined using Kruskal–Wallis one-way ANOVA and the Bonferroni test was used for post hoc comparisons. A linear discriminant function was developed for discrimination between patients with MDD and without MDD, as in our previous study.6 A discrimination score (D-score) was calculated for each subject by multiplying the coefficients of the linear discriminants, obtained using the lda() function of the MASS package in R, to the standardized values of expression after Z-score transformation of the five selected genes. A D-score was calculated for each subject. The D-score indicates the probability of membership to the group of patients with MDD or the group of subjects without MDD (schizophrenia or bipolar disorder or controls). The highest membership probability for each subject determined their classification into the MDD group or the other groups. A D-score was calculated for each sample as follows:
|
In this plot, as an aid in understanding the discriminant, to set a linear decision boundary at the zero level, the value of the constant term was adjusted. Any subject whose D-score >0 was identified as “patients with MDD”, and those with a D-score <0 was identified as “subjects without MDD”.
Results
Demographic data of the participants are shown in Table 1. There were no significant differences among the groups in terms of sex distribution, while there were significant differences in age among the groups. We measured mRNA expression levels of five genes (ARHGAP24, HDAC5, PDGFC, PRNP, and SLC6A4) using quantitative RT-PCR. The expression levels of each of these five genes are shown in Table 2. The expression levels of these five genes were not associated with sex or age in multivariable analyses.
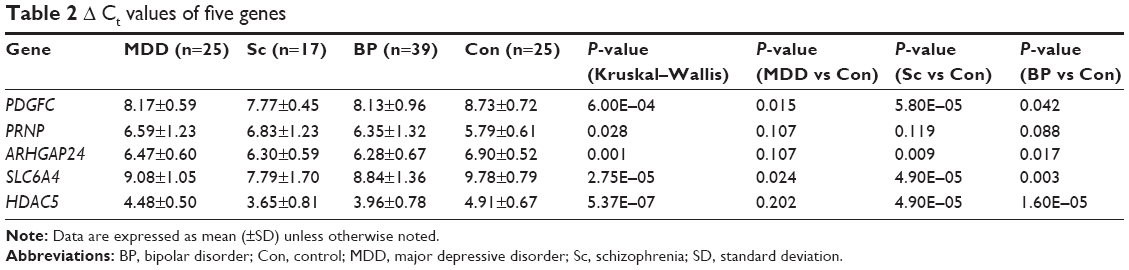 | Table 2 Δ Ct values of five genes |
All of the aforementioned five genes had similar changes in expression in MDD, schizophrenia, and bipolar disorder compared to controls and significantly changed among the groups. Compared to controls, significantly increased mRNA levels of the ARHGAP24 gene were observed in schizophrenia and bipolar disorder (P=8.5×10⁻³, 0.017, respectively). Compared to controls, significantly increased mRNA levels of the HDAC5 gene were observed in schizophrenia and bipolar disorder (P=4.9×10⁻⁵, 1.6×10⁻⁵, respectively). Significantly increased mRNA levels of the PDGFC gene were observed in MDD, schizophrenia, and bipolar disorder compared to controls (P=0.015, 5.8×10⁻⁵, 0.042, respectively). Although mRNA levels of the PRNP gene significantly changed among groups, the significant differences in the comparison between each patient group and control group were not observed. Significantly increased mRNA levels of the SLC6A4 gene were seen in MDD, schizophrenia, and bipolar disorder compared to controls (P=0.0238, 4.9×10⁻⁵, 0.003, respectively).
The D-scores for each subject are graphically depicted in Figure 1. The index in Figure 1 indicates the order of the samples sorted by their D-scores. Of the 25 patients with MDD, 16 had an MDD-positive D-score test. Of the other 81 subjects (17 with schizophrenia, 39 with bipolar disorder, and 25 controls), 52 had an MDD-negative D-score. We were thus able to segregate the patients with MDD from those without MDD with a sensitivity of 64% and specificity of 67.9%. The discriminating capacities of each single gene and a combination of five genes are shown in Tables S1 and S2.
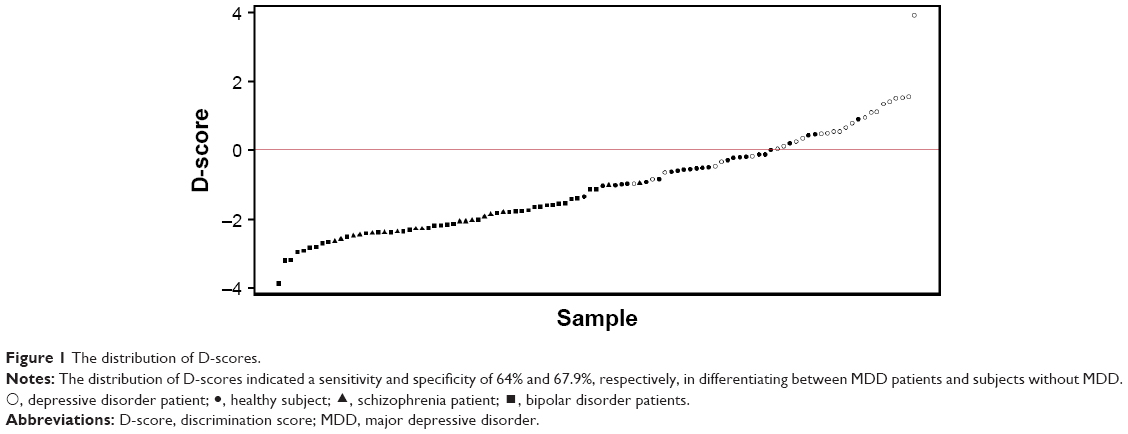 | Figure 1 The distribution of D-scores. |
Discussion
We recently developed a multiplex expression-based biological test for MDD, which demonstrated good sensitivity, and specificity exceeding 80% in a cohort comprising patients with MDD and nonpsychiatric controls.6 In the preset study, we examined the diagnostic performance of this panel in a cohort, including subjects with other psychiatric disorders, and demonstrated moderate diagnostic performance with a sensitivity and specificity of 64% and 67.9%, respectively, in differentiating patients with MDD from those without MDD.
Multiple biomarkers can serve better than a single marker in reducing the impact of the variation between populations and subgroups.9 Several blood-based multiplex diagnostic biomarkers for MDD have been reported. Spijker et al10 demonstrated that 7 lipopolysaccharide stimulation-based gene expression markers discriminated 16 patients with MDD from 13 controls with a sensitivity and specificity of 87.5% and 61.5%, respectively. This result was replicated in an independent set of samples with a sensitivity and specificity of 76.9% and 71.4%, respectively (13 patients with MDD and 14 controls).10 Numata et al11 demonstrated that the top 18 DNA methylation markers of peripheral leukocytes distinguished 20 patients with MDD from 19 controls. This result was replicated in an independent set of samples with high accuracy (12 patients with MDD and 12 controls).11 Zheng et al12 demonstrated that 17 plasma nuclear magnetic resonance-based markers distinguished 58 patients with MDD from 42 control subjects. This result was replicated in an independent set of samples with a sensitivity and specificity of 92.8% and 83.3%, respectively (14 patients with MDD and 12 controls).12 The same group also demonstrated that 17 gas chromatography–mass spectrometry-based markers of peripheral mononuclear cells discriminated 50 subjects with MDD from 50 controls, yielding an area under the curve (AUC) of 0.93. This result was replicated in an independent set of samples with an AUC of 0.87 (58 patients with MDD and 56 controls).13 Liu et al14 demonstrated that 4 plasma ultra-high-performance liquid chromatography equipped with quadrupole-time-of-flight mass spectrometry-based markers distinguished 60 patients with MDD from 59 control subjects with good sensitivity and specificity. This result was replicated in an independent set of samples with an AUC exceeding 0.8 (75 patients with MDD and 52 controls).14 Papakostas et al15 demonstrated that 9 serum protein-based markers, which were measured using ELISA, distinguished 36 patients with MDD from 43 nondepressed subjects with high accuracy. This result was replicated in an independent set of samples with a sensitivity and specificity of 91.1% and 81%, respectively (34 patients with MDD and 43 controls).15 Furthermore, the authors later conducted a test using an improved model and confirmed their results in a larger independent sample set with an AUC of 0.96.9 These results suggest that multiple blood biomarkers can be useful tools for diagnosing MDD. However, previous biological tests for MDD have examined whether biomarkers can distinguish individuals with MDD from nonpsychiatric controls. To our knowledge, this is the first study to evaluate the utility of a biological diagnostic test for MDD in the condition where not only controls, but also subjects with other psychiatric disorders are included in the analysis. As expected, we found that the sensitivity of the test in discriminating patients with MDD from those without MDD, including those with schizophrenia and bipolar disorder, was lower in the present study compared to its sensitivity in discriminating between patients with MDD and controls in our previous study. On the other hand, the best AUCs of MDD, schizophrenia, and bipolar disorder in the combined dataset were 0.87, 0.97, and 0.84, suggesting that this expression panel was not specific to MDD. Further research to identify MDD-specific markers is needed to improve the performance of this biological test.16
Our expression panel consisted of five genes, ARHGAP24, HDAC5, PDGFC, PRNP, and SLC6A4. Altered expressions of the ARHGAP24, PDGFC, and PRNP genes in MDD were originally discovered using cDNA microarray in our previous studies.17,18 The ARHGAP24 gene encodes a GTPase-activating protein, and dysregulation of this gene inhibits axon and dendrite outgrowth and branching.19 PDGFC is a member of the platelet-derived growth factor (PDGF) family and is critical for neuronal survival in the central nervous system.20 PDGF is involved in disrupted-in-schizophrenia-1 expression,21 gamma aminobutyric acid dysfunction,22 and white matter integrity in bipolar disorder.23 The PRNP gene encodes the prion protein, which has a protective role in several neurological conditions and affects N-methyl-D-aspartate receptor function in hippocampal neurons.24 Mice with disruptions of this gene show depressive-like behavior.25 In addition, cellular prion protein-positive glial cells have been shown to be significantly reduced in the cingulate gyrus of patients with bipolar disorder or MDD.26 HDAC5 is a member of the histone deacetylase family, which remove acetyl groups from histones to produce a less-accessible chromatin structure. Chronic administration of imipramine reversed downregulation of brain-derived neurotrophic factor (BDNF) expression and increased histone acetylation at the BDNF gene promoters in social defeat stress mice, which was associated with a selective downregulation of HDAC5 expression.27 Previous reports have indicated increased HDAC5 expression in leukocytes of patients with MDD.28,29 Furthermore, HDAC5 expression was also associated with the treatment efficacy or clinical improvement in MDD.30 The SLC6A4 gene is one of the most investigated genes in relation to MDD. 5HTTLPR polymorphisms are candidate genetic polymorphisms for development and interactions between gene and environment of MDD.31,32 Several studies have consistently demonstrated increased expressions of the SLC6A4 gene in leukocytes of MDD33–35 and schizophrenia.36 In PET imaging studies, SLC6A4-binding potential has been shown to be elevated in subjects with MDD who have more severe symptoms.37
There are several limitations to the present study. First, our sample size was not large, and we did not confirm our results in an independent cohort. Second, the patients with bipolar disorder were receiving various medications. In addition, we did not evaluate the mood status of these patients with bipolar disorder as well as that of the patients with schizophrenia. Further studies will be needed in consideration of medications and mood status. Third, we did not take physical conditions, such as body mass index and smoking status, into consideration, due to lack of information. Fourth, we combined our previous expression data of subjects with MDD and controls with the present expression data of schizophrenia and bipolar disorder although we conducted experiments according to the same protocol. Fifth, all subjects who participated in this study were of Japanese origin. Further studies will be needed in other ethnic cohorts. Finally, we measured relative mRNA expression levels. An absolute quantitation across laboratories will be needed to develop a common and reliable biological test.38
Conclusion
We were able to differentiate patients with MDD from subjects without MDD, including those with schizophrenia and bipolar disorder, with moderate sensitivity and specificity using gene expression changes in our panel. As we developed this panel based on MDD candidate genes, further research to identify MDD-specific markers will be needed to improve the performance of this biological test.
Acknowledgments
This work was supported in part by Japan Agency for Medical Research and development, AMED (TO), Grant-in-Aid for Scientific Research (C) (No 15K098090) (SN), Grant-in-Aid for Scientific Research (C) (No 15K09808) (J-iI), Grant-in-Aid for Scientific Research (C) (No 26330325) (KI), and Grant-in-Aid for Young Scientists (B) (No 16K19769) (S-yW).
The authors would like to thank all the volunteers who understood the study purpose and participated in this study, and the physicians who helped them to collect clinical data and blood samples. The authors would also like to thank Mrs Akemi Okada for her technical assistance.
Author contributions
SN and TO designed the study and acquired the data. S-yW acquired the data, KI, MK, HU, and S-yW analyzed the data. J-iI, SN, and S-yW wrote the draft of this paper. All authors contributed toward data analysis, drafting and revising the paper and agree to be accountable for all aspects of the work.
Disclosure
The authors report no conflicts of interest in this work.
References
Kessler RC, Berglund P, Demler O, Jin R, Merikangas KR, Walters EE. Lifetime prevalence and age-of-onset distributions of DSM-IV disorders in the national comorbidity survey replication. Arch Gen Psychiatry. 2005;62(6):593–602. | ||
Ferrari AJ, Charlson FJ, Norman RE, et al. Burden of depressive disorders by country, sex, age, and year: findings from the global burden of disease study 2010. PLoS Med. 2013;10(11):e1001547. | ||
Iga J, Ueno S, Ohmori T. Molecular assessment of depression from mRNAs in the peripheral leukocytes. Ann Med. 2008;40(5):336–342. | ||
Hepgul N, Cattaneo A, Zunszain PA, Pariante CM. Depression pathogenesis and treatment: what can we learn from blood mRNA expression? BMC Med. 2013;11:28. | ||
Uddin M. Blood-based biomarkers in depression: emerging themes in clinical research. Mol Diagn Ther. 2014;18(5):469–482. | ||
Watanabe SY, Iga J, Ishii K, et al. Biological tests for major depressive disorder that involve leukocyte gene expression assays. J Psychiatr Res. 2015;66–67:1–6. | ||
Li CT, Bai YM, Huang YL, et al. Association between antidepressant resistance in unipolar depression and subsequent bipolar disorder: cohort study. Br J Psychiatry. 2012;200(1):45–51. | ||
Ruggero CJ, Kotov R, Carlson GA, Tanenberg-Karant M, Gonzalez DA, Bromet EJ. Diagnostic consistency of major depression with psychosis across 10 years. J Clin Psychiatry. 2011;72(9):1207–1213. | ||
Bilello JA, Thurmond LM, Smith KM, et al. MDDScore: confirmation of a blood test to aid in the diagnosis of major depressive disorder. J Clin Psychiatry. 2015;76(2):e199–e206. | ||
Spijker S, Van Zanten JS, De Jong S, et al. Stimulated gene expression profiles as a blood marker of major depressive disorder. Biol Psychiatry. 2010;68(2):179–186. | ||
Numata S, Ishii K, Tajima A, et al. Blood diagnostic biomarkers for major depressive disorder using multiplex DNA methylation profiles: discovery and validation. Epigenetics. 2015;10(2):135–141. | ||
Zheng P, Gao HC, Li Q, et al. Plasma metabonomics as a novel diagnostic approach for major depressive disorder. J Proteome Res. 2012;11(3):1741–1748. | ||
Zheng P, Fang Z, Xu XJ, et al. Metabolite signature for diagnosing major depressive disorder in peripheral blood mononuclear cells. J Affect Disord. 2016;195:75–81. | ||
Liu X, Zheng P, Zhao X. Discovery and validation of plasma biomarkers for major depressive disorder classification based on liquid chromatography-mass spectrometry. J Proteome Res. 2015;14(5):2322–2330. | ||
Papakostas GI, Shelton RC, Kinrys G, et al. Assessment of a multi-assay, serum-based biological diagnostic test for major depressive disorder: a pilot and replication study. Mol Psychiatry. 2013;18(3):332–339. | ||
Buoli M, Caldiroli A, Cumerlato Melter C, Serati M, de Nijs J, Altamura AC. Biological aspects and candidate biomarkers for psychotic bipolar disorder: a systematic review. Psychiatry Clin Neurosci. 2016;70(6):227–244. | ||
Ohmori T, Morita K, Saito T, Ohta M, Ueno S, Rokutan K. Assessment of human stress and depression by DNA microarray analysis. J Med Invest. 2005;52(Suppl):266–271. | ||
Ohmori T, Ueno S, Morita K, Rokutan K, Saito T. Microarray analysis of leukocyte mRNA in depression. World J Biol Psychiatry. 2005;(Suppl 1):116. | ||
Nguyen LS, Jolly L, Shoubridge C, et al. Transcriptome profiling of UPF3B/NMD-deficient lymphoblastoid cells from patients with various forms of intellectual disability. Mol Psychiatry. 2012;17(11):1103–1115. | ||
Lee C, Zhang F, Tang Z, Liu Y, Li X. PDGF-C: a new performer in the neurovascular interplay. Trends Mol Med. 2013;19(8):474–486. | ||
Hattori T, Shimizu S, Koyama Y, et al. DISC1 (disrupted-in-schizophrenia-1) regulates differentiation of oligodendrocytes. PLoS One. 2014;9(2):e88506. | ||
Subburaju S, Benes FM. Induction of the GABA cell phenotype: an in vitro model for studying neurodevelopmental disorders. PLoS One. 2012;7(3):e33352. | ||
Benedetti F, Poletti S, Hoogenboezem TA, et al. Inflammatory cytokines influence measures of white matter integrity in bipolar disorder. J Affect Disord. 2016;202:1–9. | ||
Khosravani H, Zhang Y, Tsutsui S, et al. Prion protein attenuates excitotoxicity by inhibiting NMDA receptors. J Cell Biol. 2008;181(3):551–565. | ||
Gadotti VM, Bonfield SP, Zamponi GW. Depressive-like behaviour of mice lacking cellular prion protein. Behav Brain Res. 2012;227(2):319–323. | ||
Weis S, Haybaeck J, Dulay JR, Llenos IC. Expression of cellular prion protein (PrP(c)) in schizophrenia, bipolar disorder, and depression. J Neural Transm (Vienna). 2008;115(5):761–771. | ||
Tsankova NM, Berton O, Renthal W, Kumar A, Neve RL, Nestler EJ. Sustained hippocampal chromatin regulation in a mouse model of depression and antidepressant action. Nat Neurosci. 2006;9(4):519–525. | ||
Iga J, Ueno S, Yamauchi K, et al. Altered HDAC5 and CREB mRNA expressions in the peripheral leukocytes of major depression. Prog Neuropsychopharmacol Biol Psychiatry. 2007;31(3):628–632. | ||
Hobara T, Uchida S, Otsuki K, et al. Altered gene expression of histone deacetylases in mood disorder patients. J Psychiatr Res. 2010;44(5):263–270. | ||
Belzeaux R, Formisano-Treziny C, Loundou A, et al. Clinical variations modulate patterns of gene expression and define blood biomarkers in major depression. J Psychiatr Res. 2010;44(16):1205–1213. | ||
Clarke H, Flint J, Attwood AS, Munafo MR. Association of the 5-HTTLPR genotype and unipolar depression: a meta-analysis. Psychol Med. 2010;40(11):1767–1778. | ||
Karg K, Burmeister M, Shedden K, Sen S. The serotonin transporter promoter variant (5-HTTLPR), stress, and depression meta-analysis revisited: evidence of genetic moderation. Arch Gen Psychiatry. 2011;68(5):444–454. | ||
Iga J, Ueno S, Yamauchi K, et al. Serotonin transporter mRNA expression in peripheral leukocytes of patients with major depression before and after treatment with paroxetine. Neurosci Lett. 2005;389(1):12–16. | ||
Tsao CW, Lin YS, Chen CC, Bai CH, Wu SR. Cytokines and serotonin transporter in patients with major depression. Prog Neuropsychopharmacol Biol Psychiatry. 2006;30(5):899–905. | ||
Iga J, Watanabe SY, Numata S, et al. Association study of polymorphism in the serotonin transporter gene promoter, methylation profiles, and expression in patients with major depressive disorder. Hum Psychopharmacol. 2016;31(3):193–199. | ||
Wang G, Hu C, Jiang T, et al. Overexpression of serotonin receptor and transporter mRNA in blood leukocytes of antipsychotic-free and antipsychotic-naive schizophrenic patients: gender differences. Schizophr Res. 2010;121(1–3):160–171. | ||
Meyer JH. Imaging the serotonin transporter during major depressive disorder and antidepressant treatment. J Psychiatry Neurosci. 2007;32(2):86–102. | ||
Cattaneo A, Ferrari C, Uher R, Bocchio-Chiavetto L, Riva MA, Pariante CM; MRC ImmunoPsychiatry Consortium. Absolute measurements of macrophage migration inhibitory factor and interleukin-1-β mRNA levels accurately predict treatment response in depressed patients. Int J Neuropsychopharmacol. 2016;19(10):pii: pyw045. |
Supplementary materials
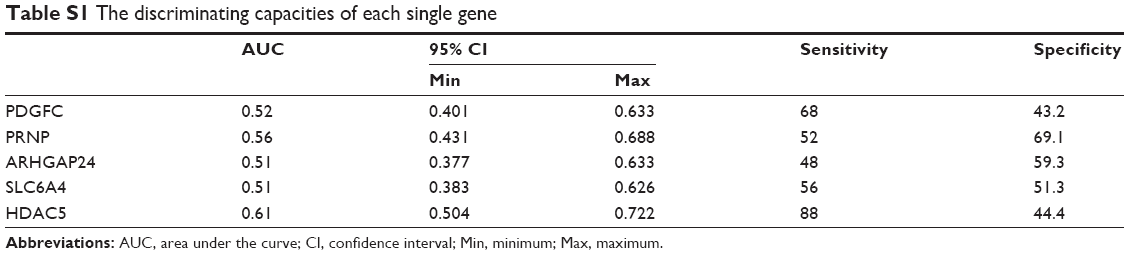 | Table S1 The discriminating capacities of each single gene |
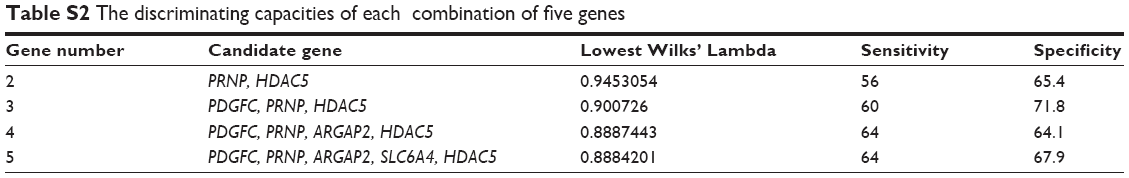 | Table S2 The discriminating capacities of each combination of five genes |
 © 2017 The Author(s). This work is published and licensed by Dove Medical Press Limited. The full terms of this license are available at https://www.dovepress.com/terms.php and incorporate the Creative Commons Attribution - Non Commercial (unported, v3.0) License.
By accessing the work you hereby accept the Terms. Non-commercial uses of the work are permitted without any further permission from Dove Medical Press Limited, provided the work is properly attributed. For permission for commercial use of this work, please see paragraphs 4.2 and 5 of our Terms.
© 2017 The Author(s). This work is published and licensed by Dove Medical Press Limited. The full terms of this license are available at https://www.dovepress.com/terms.php and incorporate the Creative Commons Attribution - Non Commercial (unported, v3.0) License.
By accessing the work you hereby accept the Terms. Non-commercial uses of the work are permitted without any further permission from Dove Medical Press Limited, provided the work is properly attributed. For permission for commercial use of this work, please see paragraphs 4.2 and 5 of our Terms.