")
Back to Journals » Journal of Inflammation Research » Volume 15
Gender-Specific Impact of Metabolic Obesity Phenotypes on the Risk of Hashimoto’s Thyroiditis: A Retrospective Data Analysis Using a Health Check-Up Database
Authors Yang H , Xia Q, Shen Y, Chen TL, Wang J, Lu YY
Received 10 December 2021
Accepted for publication 28 January 2022
Published 7 February 2022 Volume 2022:15 Pages 827—837
DOI https://doi.org/10.2147/JIR.S353384
Checked for plagiarism Yes
Review by Single anonymous peer review
Peer reviewer comments 2
Editor who approved publication: Professor Ning Quan
Hao Yang,1,* Qing Xia,2,* Yan Shen,2 Ting-Li Chen,3 Jing Wang,3 Ya-Yun Lu2
1Department of Stomatology, Huadong Sanatorium, Wuxi, 214065, People’s Republic of China; 2Health Examination Center, Huadong Sanatorium, Wuxi, 214065, People’s Republic of China; 3Department of Ophthalmology, Huadong Sanatorium, Wuxi, 214065, People’s Republic of China
*These authors contributed equally to this work
Correspondence: Ya-Yun Lu
Health Examination Center, Huadong Sanatorium, Wuxi, 214065, People’s Republic of China
, Tel +86 13763384379
, Email [email protected]
Background: Hashimoto’s thyroiditis (HT) is recognized as the most common autoimmune thyroid disease, often accompanied by the diffuse enlargement of thyroid with abundant blood flow and elevated level of thyroid autoantibodies. As obesity had a positive association with the risk of HT. Thus, this retrospective study was established to further explore the gender relationship between metabolic obesity phenotypes and the risk of Hashimoto’s thyroiditis (HT).
Materials and Methods: Data for 3697 subjects aged ≥ 18 years were randomly collected from a Health check-up database from April to December 2019. Obesity was defined by general obesity (GO; body mass index [BMI] ≥ 28 kg/m2) and abdominal obesity (AO; waist circumstance, male ≥ 90 cm, female ≥ 85 cm). Metabolic unhealthy was defined as having at least one metabolic syndrome component and a homeostasis model assessment of insulin resistance ≥ 2.5. Obesity phenotypes were divided into three groups: GO, AO, compound obesity (GO+AO). After adjustment for potential confounding factors, multivariate logistic regression was used to assess the association between metabolic obesity phenotypes and risk of HT by sex and explore the correlation between different obesity patterns and HT risk by metabolic health status.
Results: The incidence of HT was 23.5% and significantly higher among females than males with different metabolic phenotypes (26.2% vs 20.5%, p< 0.05), except metabolically healthy AO. Compared with non-obese subjects, different metabolic obesity phenotypes were independent risk factors among males (p< 0.05). Among females, unhealthy metabolic status with GO (adjusted odds ratio [OR]=2.62) or AO (adjusted OR=2.87) and metabolically healthy non-GO (adjusted OR=2.05) were risk factors of HT (p< 0.05). Increasing BMI categories and waist circumstance quartiles were positively correlated with HT risk (p for trend < 0.05). Subgroup analyses indicated that GO+AO (adjusted OR=2.52) or only AO (adjusted OR=2.41) were risk factors for HT for those with unhealthy metabolic status. Moreover, GO+AO (adjusted OR=2.37) was an independent risk factor for HT under healthy metabolic status.
Conclusion: GO+AO was associated with an increased risk of HT, identifying higher BMI/WC as a significant risk factor for HT. Males with unhealthy metabolic state or obesity and metabolically unhealthy females with obesity are high-risk group for HT. Additionally, only AO and GO+AO conferred increased risk of HT for individuals with metabolic abnormalities.
Keywords: Hashimoto’s thyroiditis, metabolic obesity phenotypes, general obesity, abdominal obesity, retrospective data
Introduction
Epidemiological studies have shown that obesity remains a serious public health concern worldwide. Various comorbidities are associated with obesity, including metabolic disorders such as insulin resistance, type 2 diabetes, and immune disease.1,2 It is worth noting that an increasing trend in thyroid autoimmunity is correlated with a high prevalence of obesity.3 With the high prevalence of obesity, more attention should also be paid to the occurrence of thyroid autoimmune diseases. To our knowledge, Hashimoto’s thyroiditis (HT), the most common autoimmune thyroid disease, ultimately leads to the destruction of thyroid tissue.4 HT is characterized by lymphocytic infiltration and the presence of autoantibodies against thyroid peroxidase (TPO-Ab) and/or thyroglobulin (Tg-Ab).5 A recent systematic review and meta-analysis demonstrated that obesity is an independent risk factor of HT, and it is supposed that a bilateral interaction exists between adiposity and thyroid autoimmune disease,6 as evidence indicates that excessive adipose tissues can induce immune system dysfunction and activate the inflammatory process in the thyroid among genetically predisposed individuals.7 A dramatic effect of obesity on the risk of thyroid autoimmune disease has been recognized in previous studies.
The risk of developing HT may differ between genders and obesity phenotypes. Considerable evidence has demonstrated that females are more susceptible to thyroid autoimmune diseases than males.5,8 In addition, based on fat distribution in the body, general obesity (GO) defined by body mass index (BMI) reflects the overall status of adipose distribution, and abdominal obesity (AO) defined by waist circumference (WC) represents the visceral adipose tissue. Evidence indicates that macrophage infiltration occurs in visceral fat, and AO is associated with chronic inflammation and affects the autoimmune process.9,10 Thus, obesity phenotypes comprise single GO, AO, and combined (compound obesity [GO+AO]). However, few studies have explored the effect of different obesity phenotypes on the risk of developing HT among males and females with different metabolic health states. Therefore, a retrospective study was performed to evaluate the association between different metabolic obesity phenotypes with the risk of developing HT among genders using a health check-up database.
Materials and Methods
Study Design and Subjects
Data were collected for subjects who underwent annual health check-ups at Huadong Sanatorium from April to December 2019. Inclusion criteria were as follows: subjects who completed the questionnaire regarding lifestyle and medical history; underwent thyroid ultrasound, and blood parameters included hematologic index of thyroid function (FT3, FT4 and TSH) and antithyroid antibody status (Tg-Ab, TPO-Ab). We excluded subjects who were less than 18 years old and those without information closely related to our research. A total of 3697 subjects were finally included in our study. The mean (standard deviation) age of subjects was 45.74 years (11.42). The percentage of males and females was 47.2% (n=1745) and 52.8% (n=1952), respectively.
Demographic characteristics included age, gender, smoking status, and alcohol consumption, and smoking was defined as at least three cigarettes per day for 12 sequential months, whereas alcohol consumption was defined as more than 3 drinks per week for 12 consecutive months. In addition, personal medical information included a diagnosis of chronic diseases, such as diabetes, hypertension, or cardiac-cerebral vascular disease.
Anthropometric Measurements
Body weight, height, WC, and hip circumference (HC) were measured by well-trained nurses; body height was measured in centimeters (cm) using a stadiometer. WC was measured to the nearest 0.1 cm around the horizontal level at the high point of the iliac crest. BMI was calculated as the body weight in kilograms divided by the square of the body height in meters (kg/m2).
Clinical Measurements
In the morning, blood specimens (8~10mL) were obtained from the antecubital vein of subjects after at least an overnight 8-h fast. The serum was placed at room temperature for 30 min and centrifuged at 3000 rpm for 10 min in a low-temperature high-speed centrifuge. The following biochemical parameters including serum levels of glucose, triglycerides (TGs), total cholesterol (TC), low-density-lipoprotein cholesterol, high-density-lipoprotein cholesterol (HDL-C) were measured by a Beckman Coulter AU5400 Automatic Biochemistry Analyzer (Beckman Coulter, USA). White blood cells, neutrophils, and lymphocytes were measured by Sysmex XE-5000 automatic blood analyzer (Sysmex, Japan). Additionally, laboratory indicators related to thyroid function including free triiodothyronine (FT3), free thyroxine (FT4), thyroid-stimulating hormone (TSH) were also tested by Beckman Coulter UniCel DxI 800 Chemiluminescence immunoassay analyzer (Beckman Coulter, USA). Thyroid autoimmune antibodies (TPO-Ab, Tg-Ab), were measured using Abbott I4000 Chemiluminescence immunoassay analyzer (Abbott, USA). All blood specimen were tested within 24 h at the Medical Laboratory Center of Huadong Sanatorium.
Definition of Metabolic Obesity Phenotypes
Metabolically unhealthy subjects were defined as those having at least one of the following metabolic abnormalities:11–13 (1) fasting blood glucose ≥100 mg/dL or currently receiving glucose-lowering therapy; (2) blood pressure ≥130/85 mmHg or currently receiving anti-hypertension treatment; (3) elevated TG level (≥1.7 mmol/L) or current lipid-lowering treatment; (4) low HDL-C level (<1.0 mmol/L in men or <1.3 mmol/L in women); or (5) insulin resistance, defined as a HOMA-IR score ≥2.5. Conversely, metabolically healthy subjects were defined as having none of the metabolic abnormalities mentioned above, as previously applied.11,14
The definition of obesity was in accordance with the Chinese standard of BMI and WC:15,16 as underweight (BMI <18.5 kg/m2), normal-weight (BMI 18.5–23.9 kg/m2), overweight (BMI 24.0–27.9 kg/m2). GO was defined as BMI ≥28.0 kg/m2, whereas AO was defined as WC ≥90 cm for men and ≥85 cm for women.
According to metabolic health status and obesity patterns, metabolic obesity phenotypes were divided into eight categories as follows:17 (1) MHNGO, metabolically healthy non-GO; (2) MHGO, metabolically healthy GO; (3) MUNGO, metabolically unhealthy non-GO; (4) MUGO, metabolically unhealthy GO; (5) MHNAO, metabolically healthy non-AO; (6) MHAO, metabolically healthy AO; (7) MUNAO, metabolically unhealthy non-AO; and (8) MUAO, metabolically unhealthy AO.
In addition, obesity was classified into three phenotypes, as follows: GO without AO (Go[+]AO[−]), AO without GO (GO[−]AO[+]), compound obesity (GO[+]AO[+]).
Assessment of HT and Thyroid Function
The diagnosis of HT was based on ultrasound characteristics of the thyroid and an elevated level of Tg-Ab or TPO-Ab. Specifically, the ultrasound Examination indicated diffuse enlargement of the thyroid with abundant blood supply combined with TPO-Ab >5.61 IU/mL or Tg-Ab >4.11 IU/mL. Thyroid function parameters included TSH (reference: 0.56–5.91 μIU/mL), FT3 (reference: 3.28–6.47 pmol/L), FT4 (reference: 7.64–16.03 pmol/L), Tg-Ab (reference: 0–4.11 IU/mL), and TPO-Ab (reference: 0–5.61 IU/mL).
Statistical Analysis
All statistical analyses were performed using SPSS 25.0 software package (SPSS Institute, Chicago, IL). Continuous variables are expressed as mean ± standard deviation or median (interquartile range) based on evaluation of the normal distribution by Shapiro–Wilk test, whereas categorical variables are presented as the frequency with percentages. Comparisons of basic characteristics specified by gender were conducted using the t-test or Mann–Whitney U-test for continuous variables, whereas the chi-square test was used for categorical variables. To evaluate the correlations between metabolic obesity phenotypes and the risk of HT, multiple logistic regression was used after adjustment for potential confounding factors, including age, smoking, alcohol consumption, hypertension, TGs, HDL-C, FT4, and TSH. Non-obese subjects with healthy metabolism were treated as a reference group. In addition, a comparison of different metabolic status combined with obesity defined by BMI or WC with the risk of HT was conducted in males and females separately. Meanwhile, WC was categorized into the following quartiles: Q1 (<73 cm), Q2 (73–79.9 cm), Q3 (80–87.9 cm), and Q4 (≥88 cm). We performed a test for linear trends by entering the median value of each quartile interval of WC as a continuous variable in the adjusted models, and linear trend analysis for BMI was conducted based on the different ranges of values described above. A two-tailed p-value <0.05 was considered statistically significant.
Results
Baseline Characteristics of the Study Population
The study included 3697 subjects (age: 45.74±11.42 years, range: 18~95 years), of which 1745 were males and 1952 females. The prevalence of HT was 20.5% in males and 26.2% in females (χ2=16.72, p<0.001). In addition, the prevalence of HT was significantly higher in females than males in different metabolic obesity phenotypes, except for MHAO (Figures 1 and 2). Baseline characteristics of the subjects are shown according to the presence of HT separately in males and females (Table 1). Males diagnosed with HT tended to have higher WC, HC, WHR (waist to hip ratio), BMI, incidence of hypertension, TGs, TSH and lower FT4. Females diagnosed with HT were more likely to be older and to have high WC, HC, WHR, BMI, incidence of hypertension, TGs, HDL-C, and TSH.
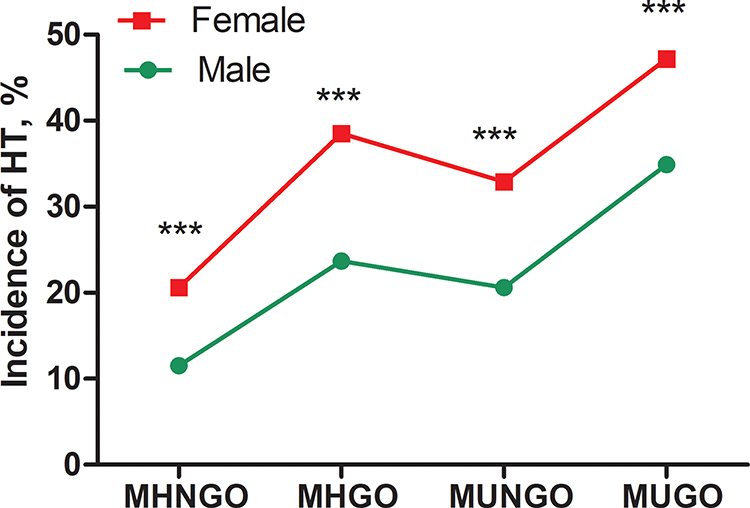 |
Figure 1 Comparison of HT incidence between males and females with different metabolic status and obesity defined by BMI. ***:p<0.001. |
 |
Figure 2 Comparison of HT incidence between males and females with different metabolic status and obesity defined by WC. ***:p<0.001. |
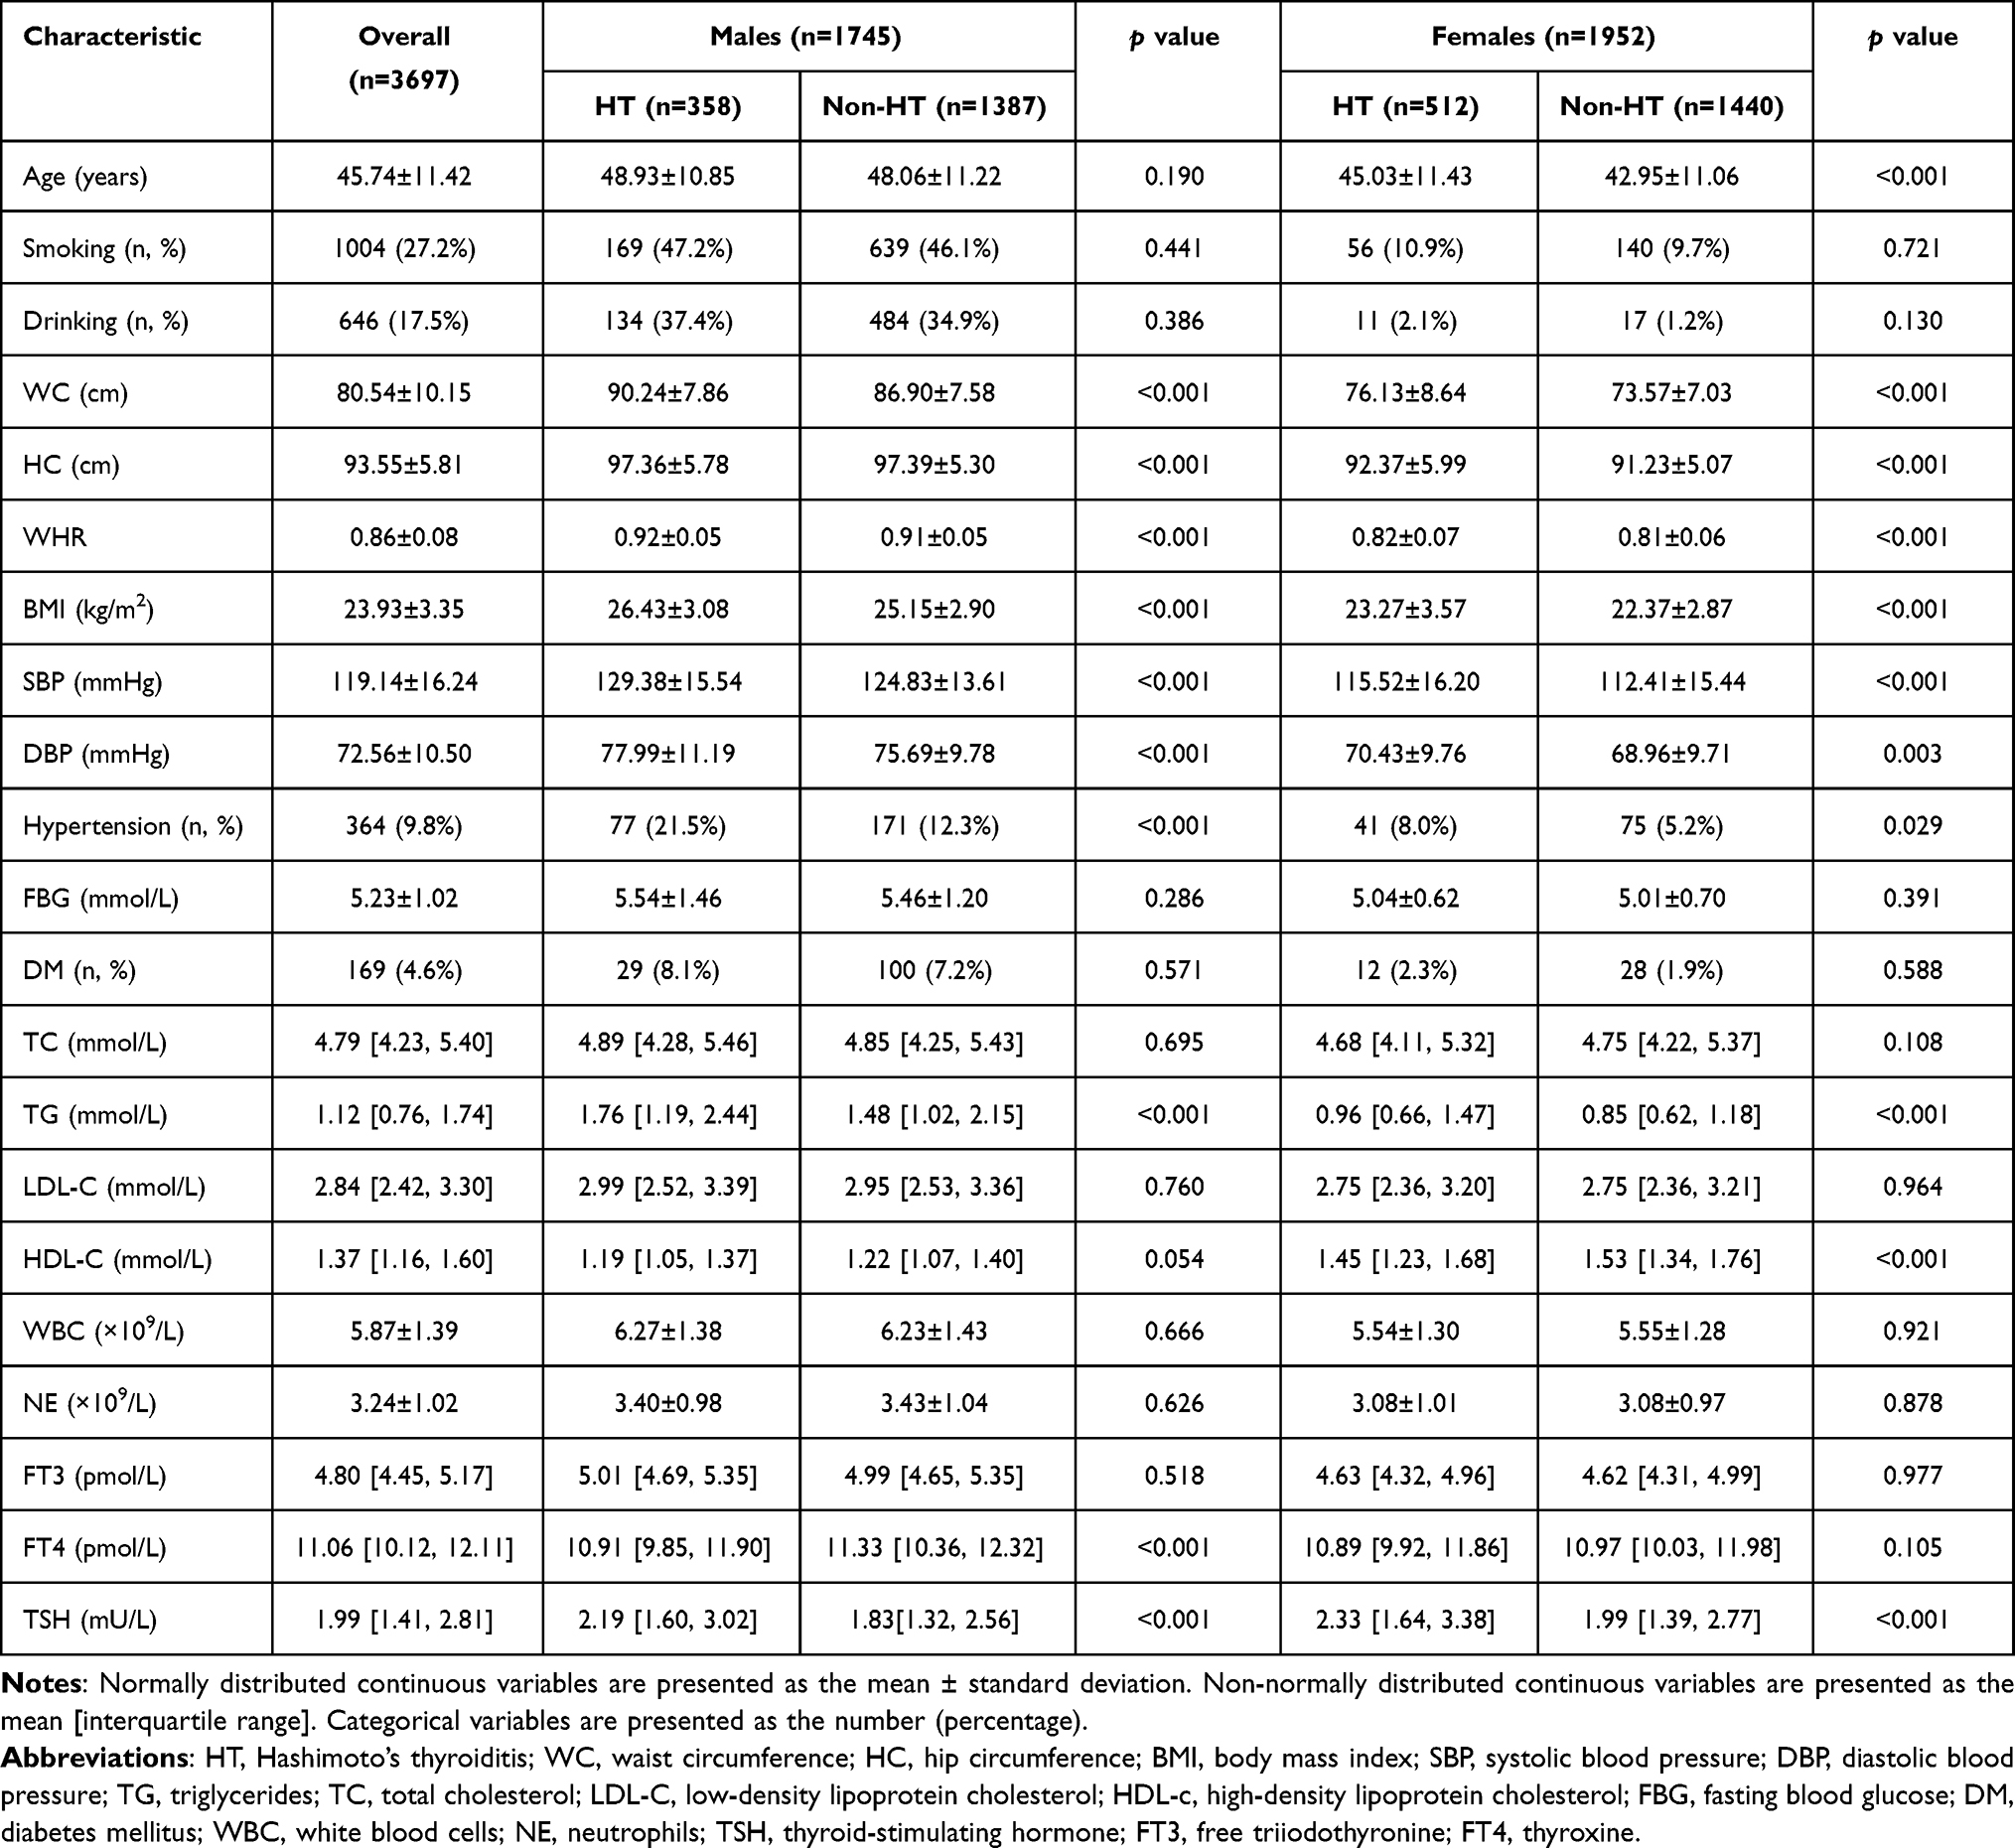 |
Table 1 Baseline Characteristics of All Subjects According to HT by Gender |
Association Between Metabolic Obesity Phenotypes and the Risk of HT Separately in Males and Females
Table 2 shows the associations between eight metabolic obesity phenotypes and the risk of HT. After the adjustment for age, smoking, alcohol consumption, hypertension, TGs, HDL-C, FT4, and TSH (Model 2), multivariate logistic regression analysis showed that metabolic unhealthy status or GO/AO could increase the risk of developing HT among males. Furthermore, unhealthy metabolism state increased the risk of developing HT among males with GO (adjusted odds ratio [OR]=3.78) or AO (adjusted OR=4.55). Additionally, females with healthy metabolism state were not susceptible to developing HT. In contrast, unhealthy metabolism state increased the risk of developing HT among females with GO; moreover, metabolically unhealthy females with GO or AO still had the highest risk of developing HT.
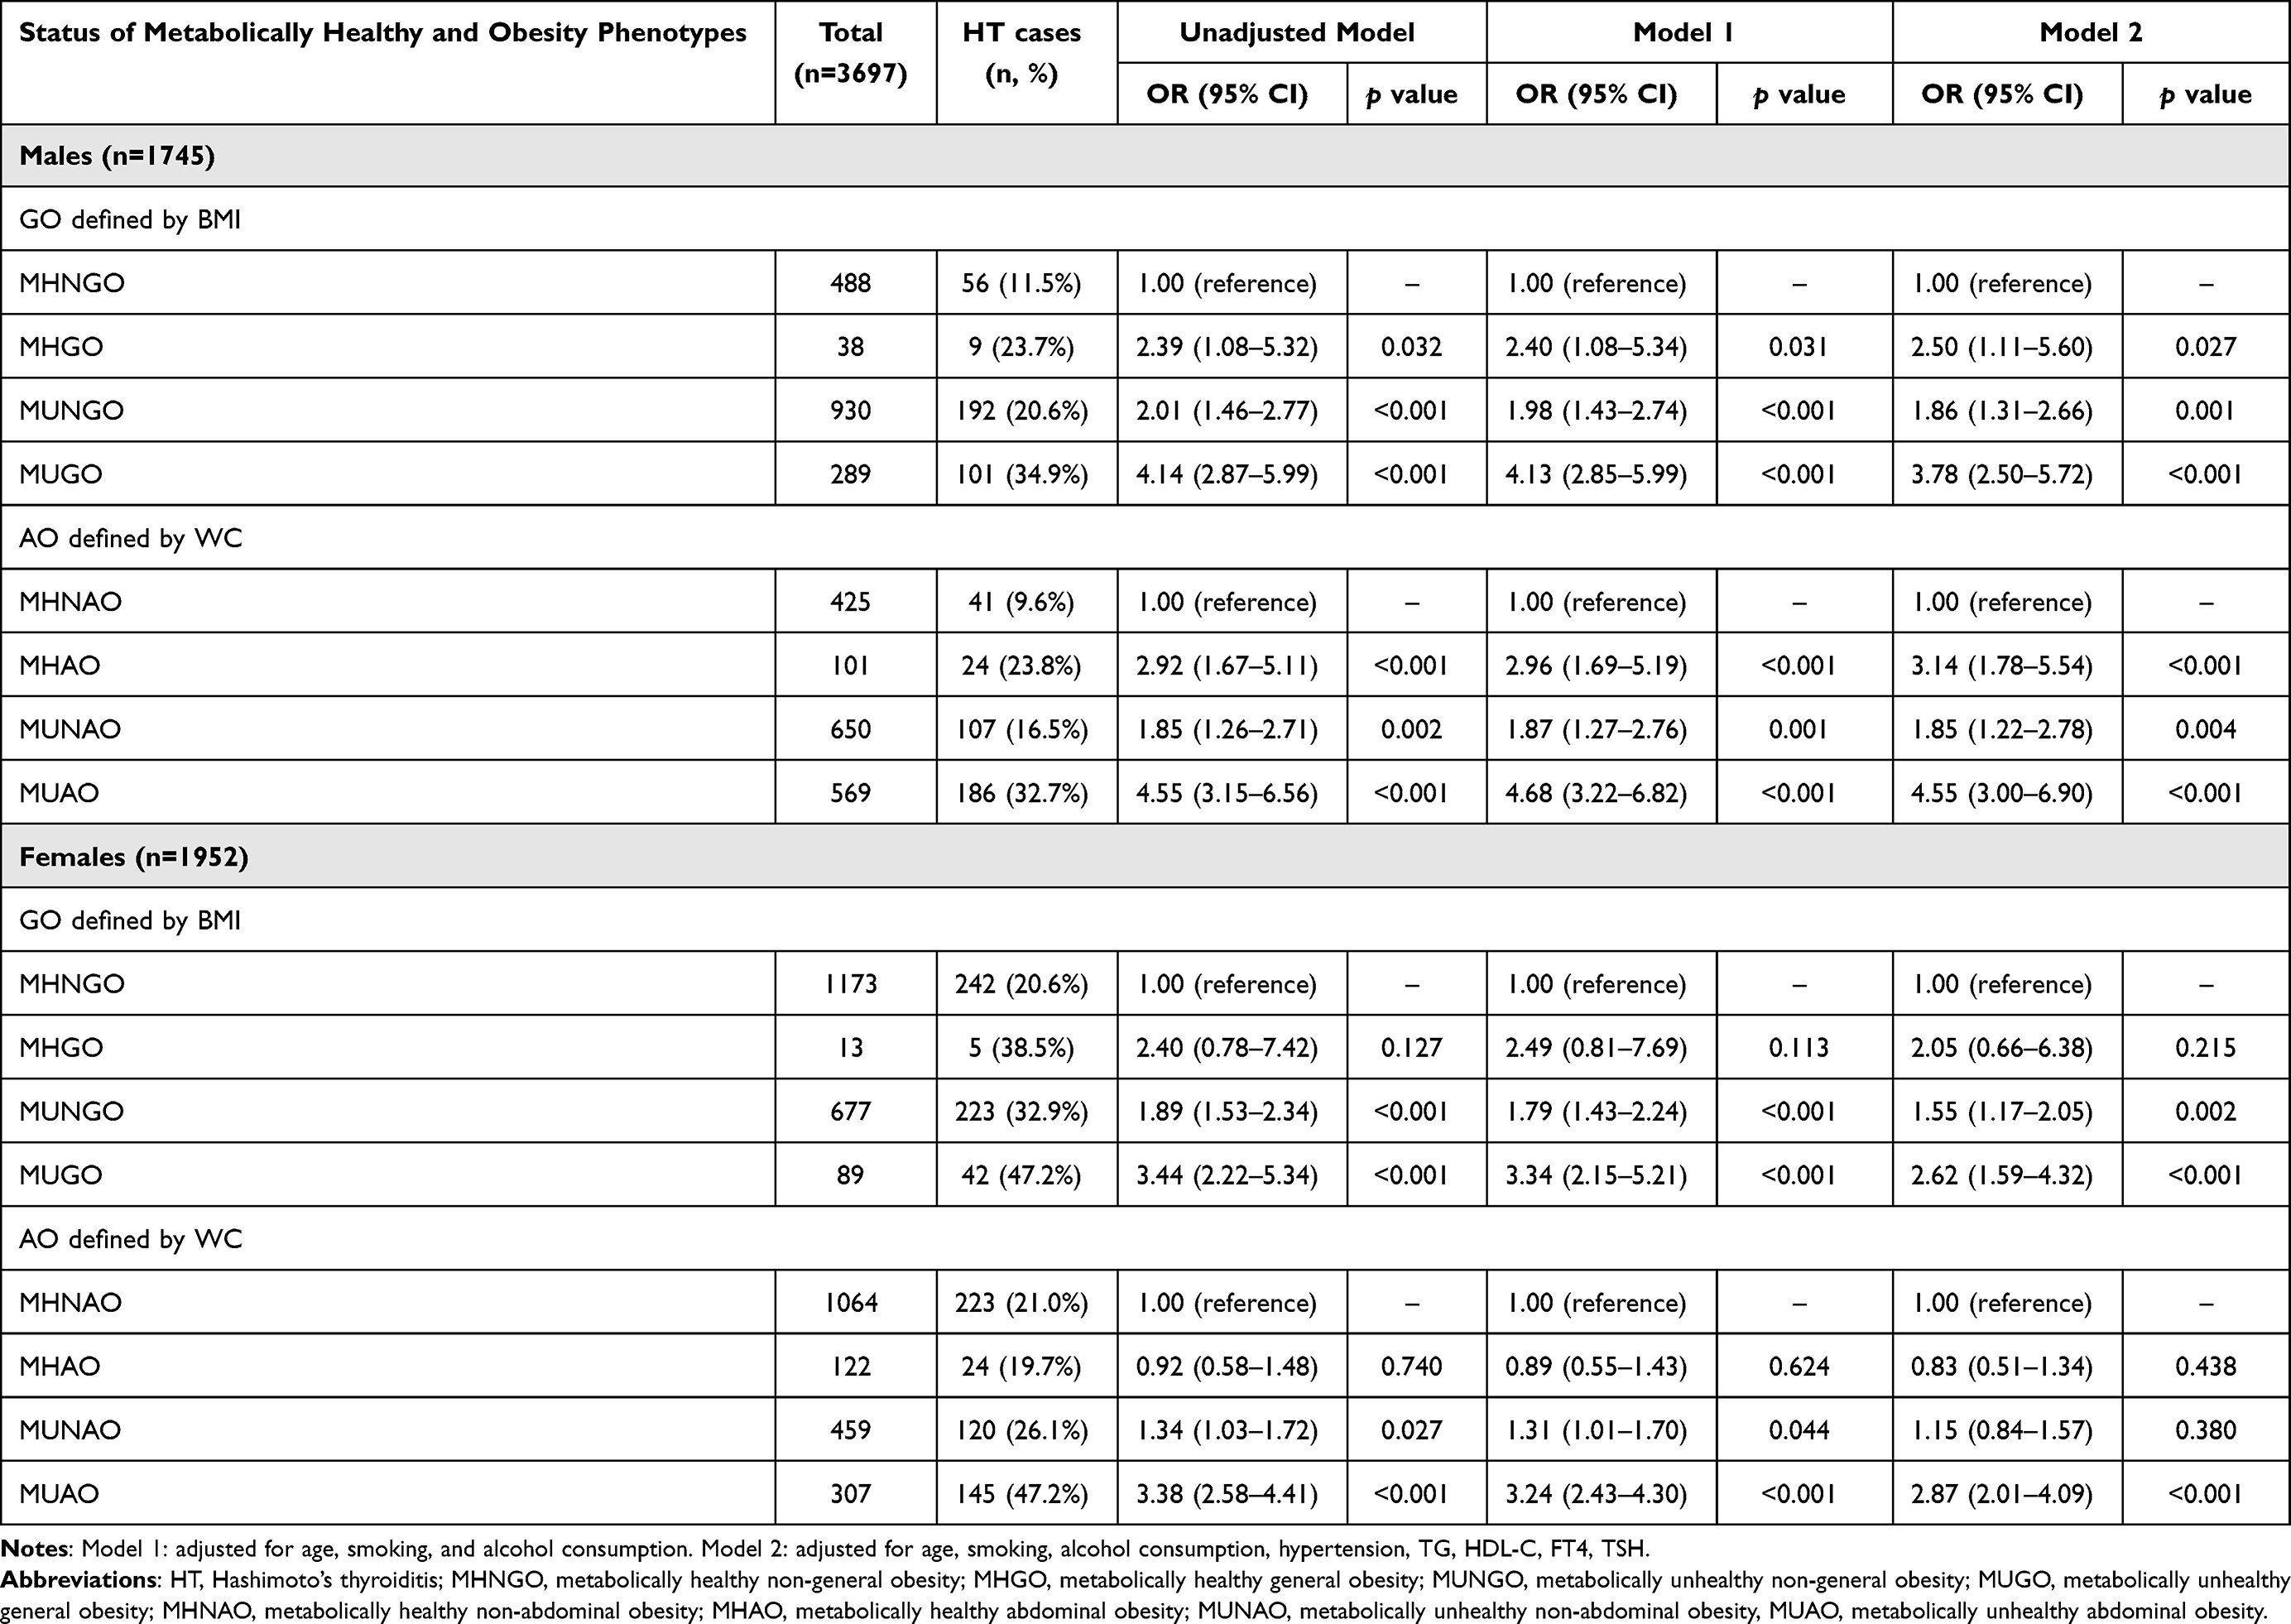 |
Table 2 Association Between Metabolic Obesity Phenotypes and the Risk of HT Separately in Males and Females |
Association Between BMI Categories/WC Quartiles and the Risk of HT
Table 3 shows the associations between BMI categories/WC quartiles and the risk of HT, after adjustment for age, smoking, alcohol consumption, hypertension, TGs, HDL-C, FT4, and TSH (Model 2); the multivariable-adjusted ORs (95% CIs) for HT comparing underweight, overweight, and GO with normal weight as the reference were 1.28 [0.80, 2.06], 1.21 [0.96, 1.53], and 1.75 [1.19, 2.58], respectively (p for trend <0.05). Meanwhile, the multivariable-adjusted ORs (95% CIs) for HT comparing WC quartiles 2, 3, and 4 to the lowest quartiles were 0.82 [0.63, 1.07], 1.13 [0.80, 1.60], and 1.77 [1.10, 2.83], respectively (p for trend <0.05).
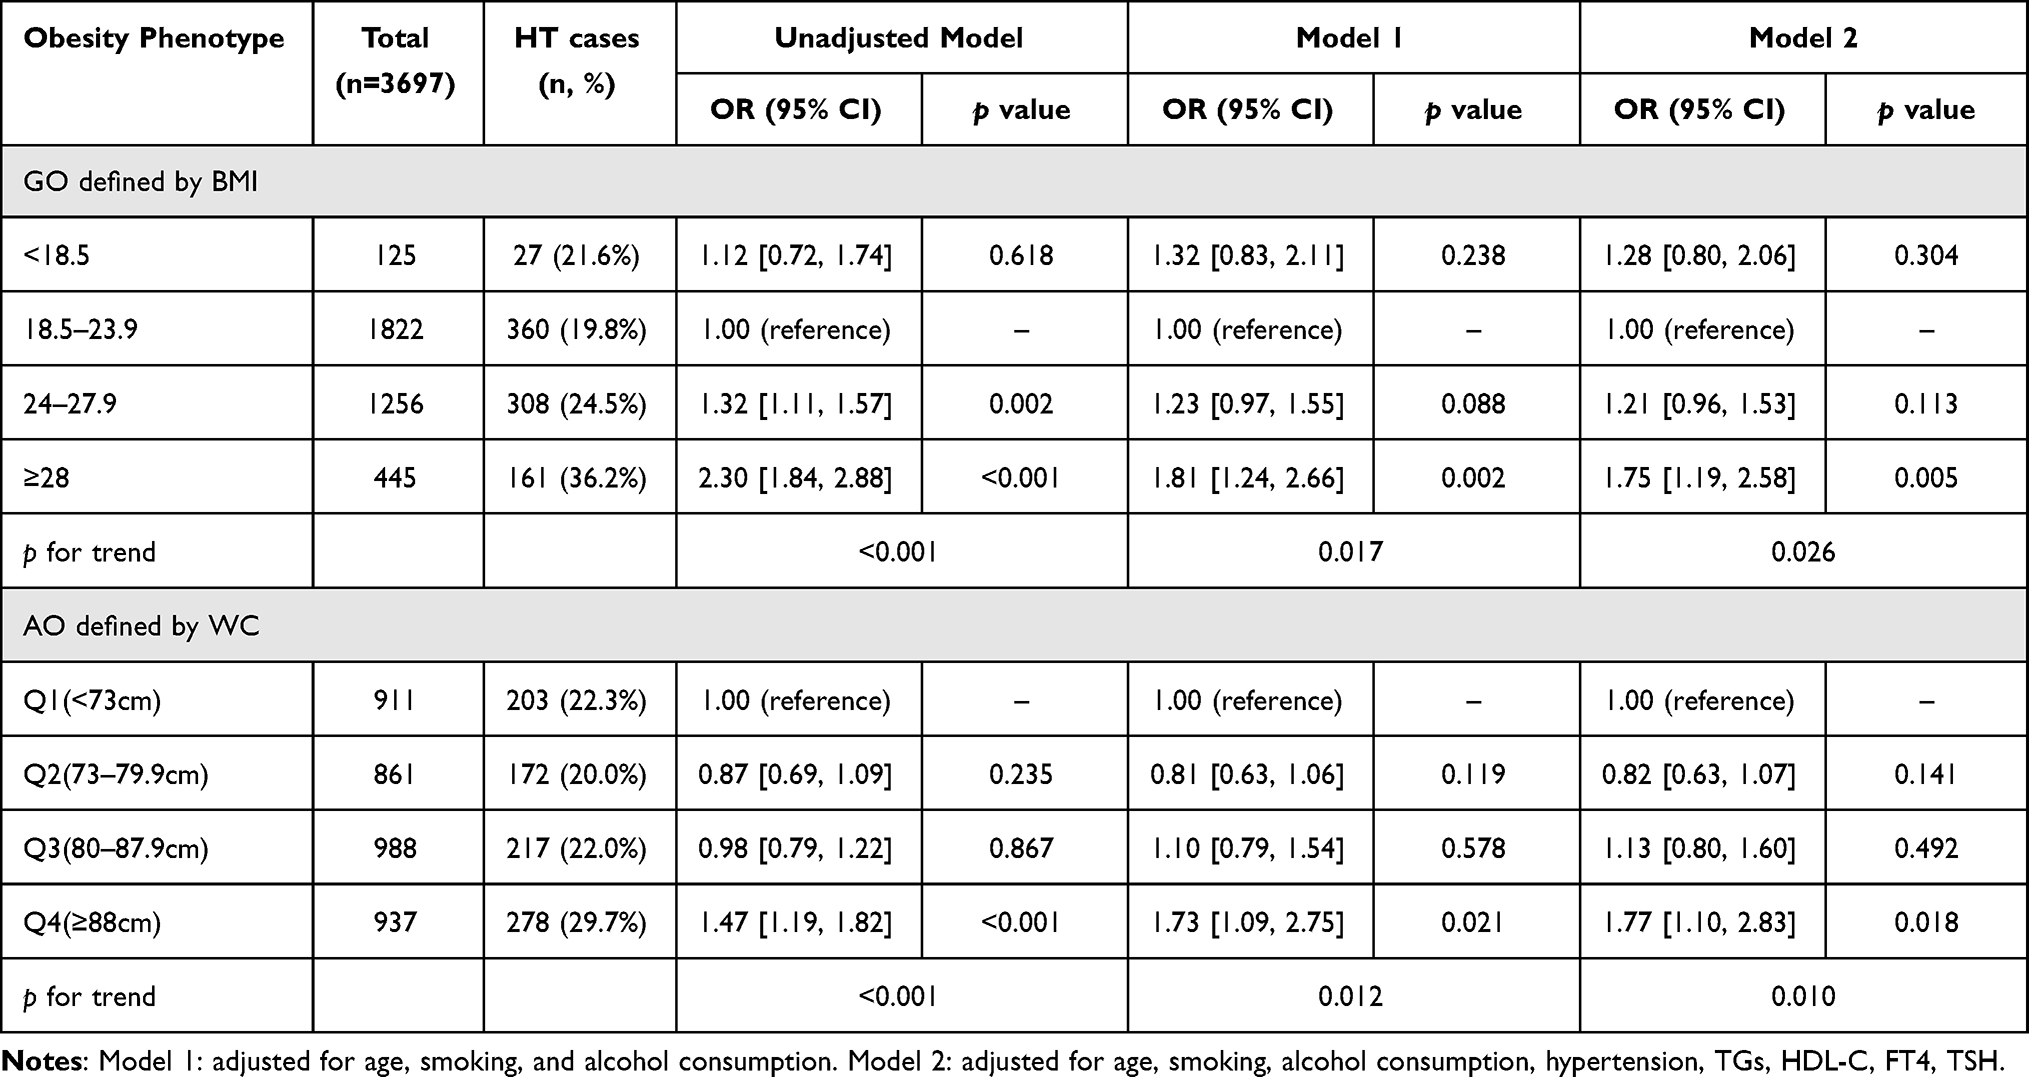 |
Table 3 Test for Linear Trend for Association Between BMI Categories and Quartiles of WC with HT Risk |
Association Between Obesity Phenotypes and the Risk of HT Separately in Metabolically Healthy and Unhealthy Subjects
We compared different obesity phenotypes with non-obesity in terms of the risk of HT in different metabolic states (Figure 3). After adjusting for potential confounders, multivariable regression analysis indicated that individuals with only abdominal obesity (adjusted OR=2.41, 95% CI: 1.90–3.07, p<0.001) or GO+AO (adjusted OR=2.52, 95% CI: 1.93–3.29, p<0.001) had a significant risk of developing HT in the metabolically unhealthy state. Among individuals in the metabolically healthy state, only GO+AO increased the risk of developing HT (adjusted OR=2.37, 95% CI: 1.17–4.78, p=0.016).
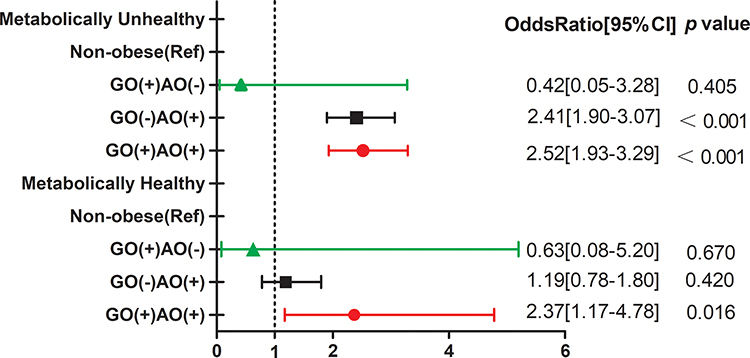 |
Figure 3 Association between different obesity types with HT risk in metabolically healthy and unhealthy states. |
Discussion
This retrospective study enrolled 3697 subjects, examining complete medical records from a health check-up database. We evaluated the association between different metabolic obesity phenotypes with the risk of HT specified by gender at baseline. The incidence of HT in females was higher than males of different metabolic obesity types, except for MHAO. In males, after further adjustment for confounding factors, obesity was a significant independent risk factor for HT among individuals in either healthy or unhealthy metabolic states. Moreover, obesity combined with unhealthy metabolic status had an additive effect on the risk of HT, whereas in females, only GO and AO were not independent risk factors of HT. Nevertheless, obesity coexisting with an unhealthy metabolic state contributed comprehensively to risk of HT in females. In addition, increased WC quartiles and increasing BMI were positively associated with an elevated risk of HT (p for trend <0.05), and AO and GO+AO were independent risk factors for HT in metabolically unhealthy individuals. However, only GO+AO was an independent risk factor for HT in metabolically healthy individuals. According to the results described above, our finding indicate that different metabolic obesity phenotypes may affect the risk level of HT by gender differently.
Although the reason underlying the gender difference in the association between different metabolic obesity phenotypes and risk of HT is not clear, several possible factors may explain this difference based on previous research. First, males in Asia are characterized by the accumulation of visceral adipose tissue, also regarded as AO, and our study showed that prevalence of AO in males was significantly higher than in females (38.4% Vs 22.0%, p<0.001), which indicated that AO in males is more hazardous than in females. Visceral adipose tissue has been shown to be more biologically active than fat located in other regions.18 Furthermore, excessive adipose depots located in the visceral region could contribute to chronic low-grade inflammation, as resident macrophages, endothelial cells, and T cells localize in visceral adipose tissue.7,19,20 These immune-regulating cells are related to the exaggerated release of proinflammatory cytokines and control autoimmune reactions, ultimately inducing thyroid cell apoptosis.21,22 Second, as estrogen and testosterone have a different biological effects in regulating thyroid function,23,24 individuals with different metabolic obesity phenotypes can exhibit varied levels of sex hormones, which can affect the risk of developing HT. Finally, the proportion of females in a perimenopausal state, which is characterized by a drop in estrogen levels, could affect the correlation between obesity phenotype and HT risk.
Our study also demonstrated that AO is strongly associated with the risk of developing HT in individuals with metabolic disorders, and only GO was not associated with increased risk of HT, even in subjects with metabolic abnormalities, indicating that a large amount of adipose tissue in the visceral region has greater effect on the risk of developing HT. Although most studies have used BMI to represent GO, BMI does not accurately reflect the characteristics of fat distribution throughout the body. WC, a standardized parameter for assessing AO, is a measure of visceral adipose tissue; males with high WC had a significantly higher risk of HT, even without metabolic disorders. A previous cohort study also illustrated that TPO-Ab and Tg-Ab positivity was associated with a significant increasing trend with increased WC in males.25 Nevertheless, a 9-year follow-up study reported no significant association between baseline AO phenotype and development of TPO-Ab positivity.26 Our study also found that only AO was not associated with increased risk of developing HT among individuals without metabolic disorders, but those with AO accompanied by unhealthy metabolic status were more likely to develop HT. Notably, the coexistence of GO and AO increased the risk of developing HT in people with or without metabolically unhealthy status, indicating that the effect of GO+AO on HT risk is not markedly associated with metabolic factors.
Our results showed that metabolic disorders constitute an independent risk factor for HT in non-obese males but not females. However, previous research demonstrated conflicting results. A retrospective study exploring the association between components of metabolic syndrome with the presence of thyroid antibodies found a negative association,27 and other studies also showed no significant difference in the prevalence of metabolic syndrome between participants with and without autoimmune thyroiditis.28,29 Conversely, a study by Tamer et al demonstrated that thyroid antibodies are positively related to blood lipid concentration (TGs and non–HDL-C) among premenopausal females diagnosed with HT.30 Additionally, a recent study of 4775 participants showed a positive relationship between thyroid autoimmunity and metabolic syndrome in euthyroid subjects.31 Meanwhile, a population-based study also demonstrated that metabolic disorders such as obesity or dyslipidemia are strongly associated with the prevalence of positive thyroid autoantibodies in euthyroid subjects in a gender-dependent manner.32 The negative association described above may have resulted from the relatively small number of participants positive for thyroid antibodies. As a result, a prospective study should be established to investigate the association between metabolic parameters and HT, which could verify the effect of metabolic disorders on the risk of developing HT.
This study also had several limitations. First, this retrospective study could not determine a causal relationship between the different metabolic obesity phenotypes and the occurrence of HT; therefore, a cohort study is warranted to affirm the actual association. Second, this study was only a single-center investigation and could have been affected by potential selection bias; a multi-center study with a larger sample size is thus needed. Finally, adipokines were not evaluated in the different metabolic obesity types; measurement of various adipokines could provide deeper understanding of the mechanism underlying the association between obesity types and the risk of developing HT. In addition, recent studies illustrated that brain dysfunction existed in neurologically asymptomatic patients with HT,33 and was characterized by reduced brain activity,34 which indicated that cognitive functions needed to be monitored as a confounding factor in statistical analysis. Furthermore, family history of autoimmune thyroid disorders, as a genetic influencing factor for individuals on thyroid autoimmunity risk, also should be collected in further study.
Conclusion
In summary, this research is the first to demonstrate, based on a medical database, that individuals with higher BMI/WC have a higher risk of developing HT. In males, obesity and metabolic disorders were significant risk factors for HT. In females, the coexistence of obesity and unhealthy metabolic status was associated with greater risk of HT. Only AO and GO+AO were associated with increased risk of HT in individuals with metabolic abnormalities.
Ethics Approval and Informed Consent
This study was conducted in accordance with the principles of the Declaration of Helsinki and approved by the Ethics and Research Committee of Huadong Sanatorium Health Examination Center (no. ECHS2021-08). Personal private information was deleted in advance, and statistical analyses were conducted with strict confidentiality and only used for scientific purposes. Thus, the requirement for informed consent from patients was waived.
Acknowledgments
This study accepted assistance from the medical database information center of Huadong Sanatorium. The authors appreciate the efforts of all who contributed to the study.
Disclosure
All authors declare they have no conflicts of interest in this work.
References
1. Tsigalou C, Vallianou N, Dalamaga M. Autoantibody production in obesity: is there evidence for a link between obesity and autoimmunity? Curr Obes Rep. 2020;9(3):245–254. doi:10.1007/s13679-020-00397-8
2. Bluher M. Obesity: global epidemiology and pathogenesis. Nat Rev Endocrinol. 2019;15(5):288–298. doi:10.1038/s41574-019-0176-8
3. Baranowska-Bik A, Bik W. The association of obesity with autoimmune thyroiditis and thyroid function-possible mechanisms of bilateral interaction. Int J Endocrinol. 2020;2020:8894792. doi:10.1155/2020/8894792
4. Caturegli P, De Remigis A, Rose NR. Hashimoto thyroiditis: clinical and diagnostic criteria. Autoimmun Rev. 2014;13(4–5):391–397. doi:10.1016/j.autrev.2014.01.007
5. Versini M, Jeandel PY, Rosenthal E, et al. Obesity in autoimmune diseases: not a passive bystander. Autoimmun Rev. 2014;13(9):981–1000. doi:10.1016/j.autrev.2014.07.001
6. Song RH, Wang B, Yao QM, et al. The impact of obesity on thyroid autoimmunity and dysfunction: a systematic review and meta-analysis. Front Immunol. 2019;10:2349. doi:10.3389/fimmu.2019.02349
7. Santini F, Marzullo P, Rotondi M, et al. Mechanisms in endocrinology: the crosstalk between thyroid gland and adipose tissue: signal integration in health and disease. Eur J Endocrinol. 2014;171(4):R137–R152. doi:10.1530/EJE-14-0067
8. McLeod DS, Cooper DS. The incidence and prevalence of thyroid autoimmunity. Endocrine. 2012;42(2):252–265. doi:10.1007/s12020-012-9703-2
9. Macdougall CE, Wood EG, Loschko J, et al. Visceral adipose tissue immune homeostasis is regulated by the crosstalk between adipocytes and dendritic cell subsets. Cell Metab. 2018;27(3):588–601. doi:10.1016/j.cmet.2018.02.007
10. Mraz M, Haluzik M. The role of adipose tissue immune cells in obesity and low-grade inflammation. J Endocrinol. 2014;222(3):R113–R127. doi:10.1530/JOE-14-0283
11. Chang Y, Kim BK, Yun KE, et al. Metabolically-healthy obesity and coronary artery calcification. J Am Coll Cardiol. 2014;63(24):2679–2686. doi:10.1016/j.jacc.2014.03.042
12. Wildman RP, Muntner P, Reynolds K, et al. The obese without cardiometabolic risk factor clustering and the normal weight with cardiometabolic risk factor clustering: prevalence and correlates of 2 phenotypes among the US population (NHANES 1999–2004). Arch Intern Med. 2008;168(15):1617–1624. doi:10.1001/archinte.168.15.1617
13. Wang T, Lu J, Shi L, et al. Association of insulin resistance and beta-cell dysfunction with incident diabetes among adults in China: a nationwide, population-based, prospective cohort study. Lancet Diabetes Endocrinol. 2020;8(2):115–124. doi:10.1016/S2213-8587(19)30425-5
14. Chang Y, Ryu S, Cho J, et al. Metabolically healthy obesity and development of chronic kidney disease. Ann Intern Med. 2016;165(10):744–745. doi:10.7326/L16-0405
15. National Clinical Research Center of Geriatric. [Expert consensus of the diagnosis and treatment measures for the Chinese elderly patients with type 2 diabetes (2018 Edition)]. Zhonghua Nei Ke Za Zhi. 2018;57(9):626–641. Chinese. doi:10.3760/cma.j.issn.0578-1426.2018.09.004.
16. Alberti KG, Zimmet P, Shaw J. The metabolic syndrome–a new worldwide definition. Lancet. 2005;366(9491):1059–1062. doi:10.1016/S0140-6736(05)67402-8
17. Wang Y, Lin H, Li Q, et al. Association between different obesity phenotypes and hypothyroidism: a study based on a longitudinal health management cohort. Endocrine. 2021;72(3):688–698. doi:10.1007/s12020-021-02677-2
18. Francisco V, Ruiz-Fernandez C, Pino J, et al. Adipokines: linking metabolic syndrome, the immune system, and arthritic diseases. Biochem Pharmacol. 2019;165:196–206. doi:10.1016/j.bcp.2019.03.030
19. Vieira-Potter VJ. Inflammation and macrophage modulation in adipose tissues. Cell Microbiol. 2014;16(10):1484–1492. doi:10.1111/cmi.12336
20. Yang H, Youm YH, Vandanmagsar B, et al. Obesity increases the production of proinflammatory mediators from adipose tissue T cells and compromises TCR repertoire diversity: implications for systemic inflammation and insulin resistance. J Immunol. 2010;185(3):1836–1845. doi:10.4049/jimmunol.1000021
21. Wang SH, Chen GH, Fan Y, et al. Tumor necrosis factor-related apoptosis-inducing ligand inhibits experimental autoimmune thyroiditis by the expansion of CD4+CD25+ regulatory T cells. Endocrinology. 2009;150(4):2000–2007. doi:10.1210/en.2008-1389
22. Sakaguchi S, Ono M, Setoguchi R, et al. Foxp3+ CD25+ CD4+ natural regulatory T cells in dominant self-tolerance and autoimmune disease. Immunol Rev. 2006;212(1):8–27. doi:10.1111/j.0105-2896.2006.00427.x
23. Fortunato RS, Ferreira AC, Hecht F, et al. Sexual dimorphism and thyroid dysfunction: a matter of oxidative stress? J Endocrinol. 2014;221(2):R31–R40. doi:10.1530/JOE-13-0588
24. Sosic-Jurjevic B, Filipovic B, Renko K, et al. Testosterone and estradiol treatments differently affect pituitary-thyroid axis and liver deiodinase 1 activity in orchidectomized middle-aged rats. Exp Gerontol. 2015;72:85–98. doi:10.1016/j.exger.2015.09.010
25. Ong KK, Kuh D, Pierce M, et al. Childhood weight gain and thyroid autoimmunity at age 60–64 years: the 1946 British birth cohort study. J Clin Endocrinol Metab. 2013;98(4):1435–1442. doi:10.1210/jc.2012-3761
26. Amouzegar A, Kazemian E, Abdi H, et al. Abdominal obesity phenotypes and incidence of thyroid autoimmunity: a 9-year follow-up. Endocr Res. 2020;45(3):202–209. doi:10.1080/07435800.2020.1749847
27. Pan B, Zhang Q, Zhou H, et al. Prevalence of components of metabolic syndrome among adults with the presence of autoimmune thyroid condition in an iodine-sufficient region. Biol Trace Elem Res. 2021;199(8):2837–2843. doi:10.1007/s12011-020-02413-3
28. Mousa U, Bozkus Y, Kut A, et al. Fat distribution and metabolic profile in subjects with Hashimoto’s thyroiditis. Acta Endocrinol. 2018;14(1):105–112. doi:10.4183/aeb.2018.105
29. Ren R, Ma Y, Deng F, et al. Association between serum TSH levels and metabolic components in euthyroid subjects: a nationwide population-based study. Diabetes Metab Syndr Obes. 2019;12:1563–1569. doi:10.2147/DMSO.S202769
30. Tamer G, Mert M, Tamer I, et al. Effects of thyroid autoimmunity on abdominal obesity and hyperlipidaemia. Endokrynol Pol. 2011;62(5):421–428.
31. Kim HJ, Park SJ, Park HK, et al. Thyroid autoimmunity and metabolic syndrome: a nationwide population-based study. Eur J Endocrinol. 2021;185(5):707–715. doi:10.1530/EJE-21-0634
32. Wu Y, Shi X, Tang X, et al. The correlation between metabolic disorders and TPOAb/TgAb: a cross-sectional population-based study. Endocr Pract. 2020;26(8):869–882. doi:10.4158/EP-2020-0008
33. Waliszewska-Prosol M, Bladowska J, Budrewicz S, et al. The evaluation of Hashimoto’s thyroiditis with event-related potentials and magnetic resonance spectroscopy and its relation to cognitive function. Sci Rep. 2021;11(1):2480. doi:10.1038/s41598-021-82281-6
34. Bladowska J, Waliszewska-Prosol M, Ejma M, et al. The metabolic alterations within the normal appearing brain in patients with Hashimoto’s thyroiditis are correlated with hormonal changes. Metab Brain Dis. 2019;34(1):53–60. doi:10.1007/s11011-018-0318-z
 © 2022 The Author(s). This work is published and licensed by Dove Medical Press Limited. The full terms of this license are available at https://www.dovepress.com/terms.php and incorporate the Creative Commons Attribution - Non Commercial (unported, v3.0) License.
By accessing the work you hereby accept the Terms. Non-commercial uses of the work are permitted without any further permission from Dove Medical Press Limited, provided the work is properly attributed. For permission for commercial use of this work, please see paragraphs 4.2 and 5 of our Terms.
© 2022 The Author(s). This work is published and licensed by Dove Medical Press Limited. The full terms of this license are available at https://www.dovepress.com/terms.php and incorporate the Creative Commons Attribution - Non Commercial (unported, v3.0) License.
By accessing the work you hereby accept the Terms. Non-commercial uses of the work are permitted without any further permission from Dove Medical Press Limited, provided the work is properly attributed. For permission for commercial use of this work, please see paragraphs 4.2 and 5 of our Terms.