")
Back to Journals » International Journal of Nanomedicine » Volume 12
Ga@C-dots as an antibacterial agent for the eradication of Pseudomonas aeruginosa
Authors Kumar VB, Natan M, Jacobi G, Porat Z, Banin E, Gedanken A
Received 30 June 2016
Accepted for publication 7 September 2016
Published 23 January 2017 Volume 2017:12 Pages 725—730
DOI https://doi.org/10.2147/IJN.S116150
Checked for plagiarism Yes
Review by Single anonymous peer review
Peer reviewer comments 2
Editor who approved publication: Dr Thomas Webster
Vijay Bhooshan Kumar,1 Michal Natan,2 Gila Jacobi,2 Ze’ev Porat,3,4 Ehud Banin,2 Aharon Gedanken1,5
1Department of Chemistry, 2Mina and Everard Goodman Faculty of Life Sciences, Bar Ilan Institute for Nanotechnology and Advanced Materials Bar-Ilan University, Ramat Gan, 3Division of Chemistry, Nuclear Research Center-Negev, 4Institutes of Applied Research, Ben-Gurion University of the Negev, Be’er-Sheva, Israel; 5National Cheng Kung University, Department of Materials Science and Engineering, Tainan, Taiwan
Abstract: The opportunistic pathogen Pseudomonas aeruginosa causes infections that are difficult to treat by antibiotic therapy. This research article reports on the synthesis of gallium (Ga) doped in carbon (C)-dots (Ga@C-dots) and their antimicrobial activity against free-living P. aeruginosa bacteria. The synthesis of Ga@C-dots was carried out by sonicating molten Ga (for 2.5 h) in polyethylene glycol-400, which acts as both a medium and carbon source. The resultant Ga@C-dots, having an average diameter of 9±2 nm, showed remarkably enhanced antibacterial activity compared with undoped C-dots. This was reflected by the much lower concentration of Ga doped within Ga@C-dots which was required for full inhibition of the bacterial growth. These results highlight the possibility of using Ga@C-dots as potential antimicrobial agents.
Keywords: C-dots, Ga@C-dots, sonochemistry, gallium, antibacterial, Pseudomonas aeruginosa
Introduction
In the past three decades, many bacteria have developed strong resistance against most commercially available antibiotics.1 The use of heavy doses of antibiotics, combined with person-to-person spread of bacteria, has greatly increased antibiotic resistance due to genetic mutation,1,2 a problem that is increasing in severity.3 However, the number of new antibiotics that are expected to enter the market is limited4 and might not be sufficient for all the newly resistive bacteria. Nowadays, much research is focused on developing new antimicrobial drugs or agents, with one promising approach to eradicate such bacteria based on materials science.5–7 The organization of atoms at the nanometer scale could enhance the antimicrobial activity of known chemical agents, which can be broadly classified into two types: organic and inorganic.
Carbon nanomaterials have attracted significant attention due to their unique electronic, optical, mechanical, chemical, and thermal properties. Carbon dots have emerged as a new platform of quantum dot-like fluorescent nanomaterials.8 Among these carbon-based nanomaterials, doped carbon (C)-dots are one of the most promising types of fluorescent materials. The surface of these materials is passivated by chemical functionalization with small chains of polymeric or oligomeric species.9 Interestingly, excellent biocompatibility and optical properties can be achieved by doping (C)-dots with metals or nonmetals.10,11 However, despite considerable successes, a challenging problem arises as the metal is often immediately oxidized by atmospheric oxygen on the C-dot surface. Continuous efforts have been made to synthesize doped carbon nanomaterials for biomedical applications. For example, Gong et al synthesized polyol-mediated gadolinium-doped green fluorescent C-dots by microwave irradiation for bimodal magnetic resonance imaging/optical nanoprobes.12
Recently, it was demonstrated that gallium ions (Ga3+) disrupt the iron metabolism of Pseudomonas aeruginosa to exhibit antimicrobial and antibiofilm activity.3,13,14 A plausible explanation is that because of the chemical similarity between Ga3+ and Fe3+ in terms of charge, ionic radius, electronic configuration, and coordination number, Ga can easily substitute for iron in many biological activities. However, since Ga3+ cannot replace Fe3+ as a co-factor in redox-dependent enzymes, and sequential redox reactions are critical for many of the biological functions of Fe3+, these functions are inhibited by Ga substitution.13 This phenomenon can be exploited to disrupt iron metabolism in a wide range of bacterial species. Valappil et al also reported that the antimicrobial action of Ga-exchanged carboxymethyl cellulose materials was effective against both planktonic and biofilm growth by P. aeruginosa.15 In other studies, da Silva et al reported on the effect of the coordination of Ga3+ on the antibacterial activity of N(4)-phenyl-2-formylpyridine thiosemicarbazone and N(4)-phenyl-2-benzoylpyridine thiosemicarbazone against P. aeruginosa,16 and Bernstein illustrated how solution chemistry and the versatility of bacterial metabolic networks could increase or decrease the toxicity of Ga for a pathogenic bacterium.17
In addition to the reports on the activity of Ga ions against P. aeruginosa,3,14 there are also several recent reports detailing the antibacterial activity of C-dots18,19 and a C-dot-Ag nanocomposite.20 However, to the best of our knowledge, no reports on the antibacterial activity of Ga doped in C-dots (Ga@C-dots) have been published. In this study, we describe the synthesis of this nanomaterial and its antimicrobial activity. A one-step sonochemical approach, as previously reported, was utilized to prepare Ga@C-dots.21 Increasing the doping level of Ga in C-dots increased the antimicrobial activity. The chemical and physical properties of Ga@C-dots were also studied by various techniques, including transmission electron microscopy (TEM), fluorescence spectroscopy, solid-state nuclear magnetic resonance (NMR), inductively coupled plasma optical emission spectroscopy (ICP-OES) and zeta potential measurements. The antimicrobial activity of Ga@C-dots, as a function of the Ga-doping level, was tested against opportunistic pathogen P. aeruginosa. Our results highlight the potential of further developing Ga@C-dots as antimicrobial agents.
Experimental
Chemicals
Polyethylene glycol-400 (PEG-400; 99.998%) and Ga (99.99%) were purchased from Sigma-Aldrich (St Louis, MO, USA).
Preparation of Ga@C-dots
We recently reported the formation of Ga@C-dots by sonication.21 In brief, a granule of Ga was inserted into a glass test tube, containing 14 mL of PEG-400, which was dipped in a water bath at 70°C. Four different batches were prepared, in which different amounts of Ga were used: 70, 175, 350, and 700 mg. The tip of an ultrasonic transducer (model VCX 750, frequency 20 kHz, voltage 230 V AC; Sonics and Materials Inc, Newtown, CT, USA) was dipped in the liquid, about 2 cm above the Ga. When the Ga was molten, ultrasonic irradiation was applied for 2.5 h at 70% amplitude, causing the dispersion of the Ga and the formation of a grey suspension of particles. In all cases, after the sonication ceased, solid particles were separated by centrifugation at 10,000 rpm for 30 min. Ga@C-dots were found in the supernatant, showing light brown-yellow color.
Characterization of Ga@C-dots
The characterization of Ga@C-dots has been previously described.21 However, since the amounts of Ga incorporated in C-dots were largely increased as compared with those in the previous study21, some of the reported data are repeated in addition to presenting new analysis. The fluorescence of Ga@C-dots was measured using a Varian Cary Eclipse fluorescence spectrophotometer (Agilent Technologies, Santa Clara, CA, USA). High-resolution transmission electron microscopy was carried out on a JEOL 2100 TEM (JEOL USA, Peabody, MA, USA), operated at an accelerating voltage of 200 kV. The samples were prepared by mixing a few drops of a Ga@C-dot suspension (0.5 mL) in PEG-400 with isopropanol (10 mL). The resulting solution was then bath sonicated for 2 min at room temperature. A few droplets of the mixture were applied to a carbon-coated copper TEM grid and dried under ambient atmosphere. ICP-OES analysis of the Ga@C-dots was done using a Horiba instrument model Ultima 2 (Horiba Scientific, Edison, NJ, USA). Zeta potential measurements of the particles were performed using a ZetaSizer Nano-ZS (Malvern Instruments Ltd, Worcestershire, UK). 13C solid-state NMR spectra were acquired using a Bruker 5000 UltraShield spectrometer (Bruker, Billerica, MA, USA). Raman spectroscopy measurement was performed using Jobin-Yvon Labram spectrometer. Samples were excited using the 632.8 nm laser with a spectral resolution of <1.5 cm−1. All the spectra were initially baseline-corrected with third-order polynomial and normalized to the maximum of the peak intensity.
Antibacterial activity assay of Ga@C-dots
In all the experiments, P. aeruginosa strains: PAO1 (UW), PA14 (UCBPP-PA14), and the clinical isolate C3719 were grown overnight at 37°C under agitation (250 rpm) in Luria Bertani (Difco/BD Biosciences, Sparks, MD, USA) growth medium. The antimicrobial activity of the Ga@C-dots was evaluated by determining the minimum inhibitory concentration (MIC) values for P. aeruginosa. Stock solutions of Ga@C-dots containing Ga at a concentration of 350 ppm were diluted by twofold serial dilutions in Luria Bertani medium in a 96-well plate (Greiner Bio-One, Frickenhausen, Germany). Each well contained 105 colony-forming units/mL of P. aeruginosa, and bacteria treated with de-ionized water served as a negative control. Additionally, bacteria were treated with either Ga or pristine C-dots as controls. Bacterial growth was monitored via absorbance measurements at OD595 using a microplate reader (Synergy 2; BioTek instruments, Winooski, VT, USA). All experiments were conducted in duplicates.
Results and discussion
Chemical characterization of the Ga@C dots
On the basis of our previous report,21 the optimal conditions for the synthesis of Ga@C-dots with the largest amount of Ga doping were sonication for 2.5 h at 70% amplitude and 70°C.21–24 After sonication and separation of the precipitates, the fluorescence emitted from Ga@C-dots in the supernatant solution was recorded at different excitation wavelengths (330, 350, 370, 390, 410, 430, 450, 470, and 490 nm). The results that were obtained from Ga@C-dots which were produced in the presence of different amounts of Ga (70, 175, 350, and 700 mg) were identical to those in our previous reports21 (data not shown).
TEM images of the Ga@C-dots, formed in PEG-400 containing 700 mg Ga, showed that their size distribution was rather narrow, having diameters of 7±2 nm (Figure 1A). Resolution TEM images further revealed that Ga@C-dots were crystalline. Figure 1A inset presents the selected area electron diffraction of Ga@C-dots and shows a polycrystalline pattern with rings corresponding to the (01.3) (10.6) (11.0) planes of a hexagonal carbon structure (PDF 26-1083), while the energy-dispersive X-ray spectrometry spectrum (Figure 1B inset) indicates the presence of Ga, carbon, and oxygen. These images are of high Ga content dots (700 mg); the shape of particles with a smaller Ga content was quite similar, but they were slightly smaller in size, ca 6 nm. This difference is not significant, and lies within the size range of the 700 mg doping level of the Ga (7±2 nm).
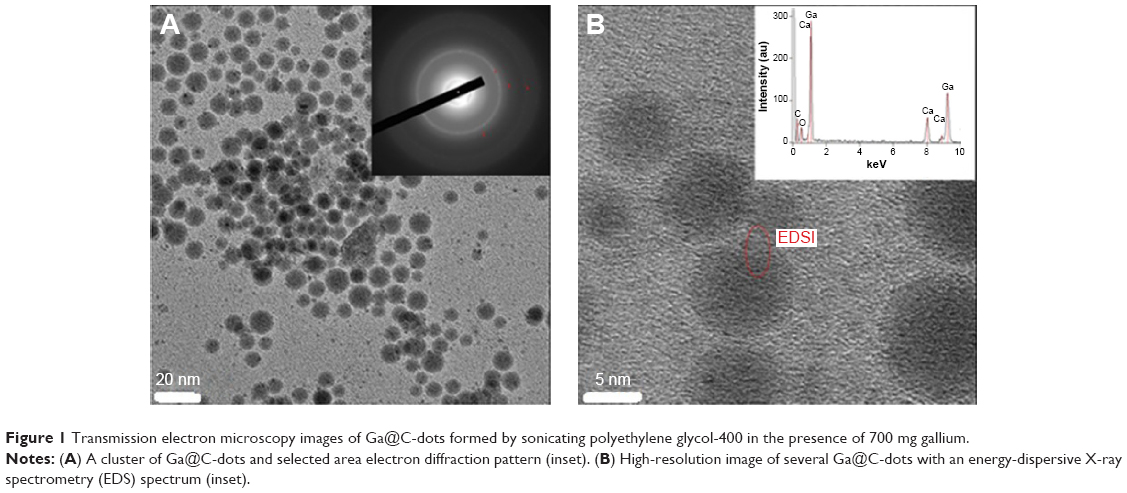 | Figure 1 Transmission electron microscopy images of Ga@C-dots formed by sonicating polyethylene glycol-400 in the presence of 700 mg gallium. |
The stability of Ga@C-dots was examined by fluorescence measurements. Spectra were taken periodically for several weeks and showed no changes in the intensity of the fluorescence bands. However, after 2 months, the strong brown-yellow color of the suspension started to fade and the intensity of the fluorescence bands was slightly reduced.
The analysis of the nature of the surface of Ga@C-dots was undertaken using 13C solid-state NMR in a cross-polarization magic angle-spinning mode. Figure 2 presents such spectra for two samples of Ga@C-dots, with low and high Ga content, in comparison to pristine C-dots. The general pattern of all three spectra are similar, except for the two larger signals for the Ga@C-dot sample with a high Ga load. Although Ga-carbide was never intentionally prepared, a speculative explanation for the peak at 71 ppm is that it is related to the formation of a carbide. This hypothesis is now under further investigation using synchrotron radiation. The peak at 180 nm was assigned to carboxyl carbon (COO−), while the large peak at 135 ppm was related to aromatic carbons, the peaks around 67 ppm to carbonylic carbons (C–O), and the peaks in the range of 6–35 ppm were assigned to carbons bound to hydrogen, or to other carbons.25 For the sample with a higher Ga content, peaks at 20, 67, and 153 ppm became more prominent.
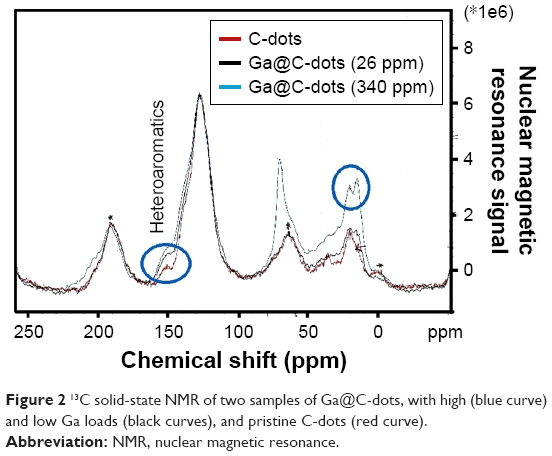 | Figure 2 13C solid-state NMR of two samples of Ga@C-dots, with high (blue curve) and low Ga loads (black curves), and pristine C-dots (red curve). |
Raman analysis
The C-dots and Ga@C-dots suspended in PEG-400 were dried under Ar-atmosphere at 200°C on a hot plate for 3–4 days. After drying, a black precipitate (ppt) was obtained and further analyzed for Raman analysis. Figure 3 shows the Raman spectrum of C-dots, Ga@C-dots (26 ppm), and Ga@C-dots (340 ppm). For C-dots and Ga@C-dots, two prominent peaks appear at 1,330 and 1,565 cm−1, corresponding to the carbon D and G bands, respectively. This is similar to the graphene spectrum, which confirms the formation of graphitic-like C-dots from PEG-400. Based on the intensity of the G band in the Raman spectra, it is concluded that the C-dots produced in this manner are predominantly graphitic in nature. Doping the C-dots with Ga reduced the intensity of G-band. Moreover, the intensity of the D band is related to the size of the inplane sp2 domains. The increase of the D band intensity indicates the formation of more sp2 domains. The relative intensity ratio of both bands (ID/IG) is a measure of disorder degree and inversely proportional to the average size of the sp2 clusters. As seen in Figure 3, the D/G intensity ratio for C-dots is lower than for the Ga@C-dots (0.414 for C-dots, 0.834 for Ga@C-dots [26 ppm], 1.046 for Ga@C-dots [340 ppm]). This suggests that new (or more) graphitic domains are formed and the sp2 cluster number is increased after doping of Ga in C-dots.
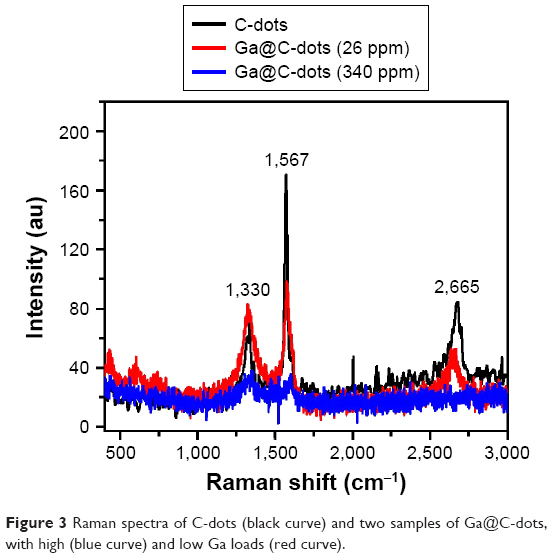 | Figure 3 Raman spectra of C-dots (black curve) and two samples of Ga@C-dots, with high (blue curve) and low Ga loads (red curve). |
ICP-OES analysis was employed to determine the amount of doped Ga in the Ga@C-dots. The samples were prepared for analysis in the following manner: 1 mL of the Ga@C-dot suspension in PEG-400 was mixed in 50 mL of 0.5 M HNO3 in a 100 mL beaker and the mixture was heated on a hot plate to 60°C for 2 h. The HNO3 solution was then evaporated and the residue was diluted with double distilled water. This process was repeated twice to reduce the HNO3 concentration. The final solution was analyzed for Ga by ICP-OES; a gradual increase in the Ga content of Ga@C-dots was measured as the Ga concentration in the synthesis solution was increased (Table 1). However, the Ga content approached a limit when its content in solution was increased above 350 mg.
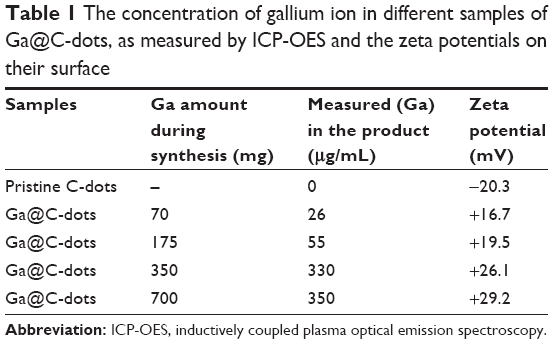 | Table 1 The concentration of gallium ion in different samples of Ga@C-dots, as measured by ICP-OES and the zeta potentials on their surface |
The surface charge of the Ga@C-dots, loaded with different amounts of Ga, was analyzed by zeta potential measurements and compared with that of pristine C-dots, both suspended in PEG. Samples were prepared by mixing 1 mL of water with 1 mL of each of the suspensions of different Ga loads. Figure 4 presents the zeta potential curves of C-dots (A) and for one of the Ga@C-dot samples (B) each in three replicates. While the zeta potential of the C-dots was found to be negative, all Ga@C-dots samples revealed positive zeta potentials, which increased with a higher Ga content (Table 1). The positive zeta potential proves that metallic Ga or Ga+3 ions reside on the surface of the dots. Since C-dots are approximately 10 nm in diameter, this means any Ga/Ga3+ binding site is near the surface, or it can also be on the surface and inside the particle as well.
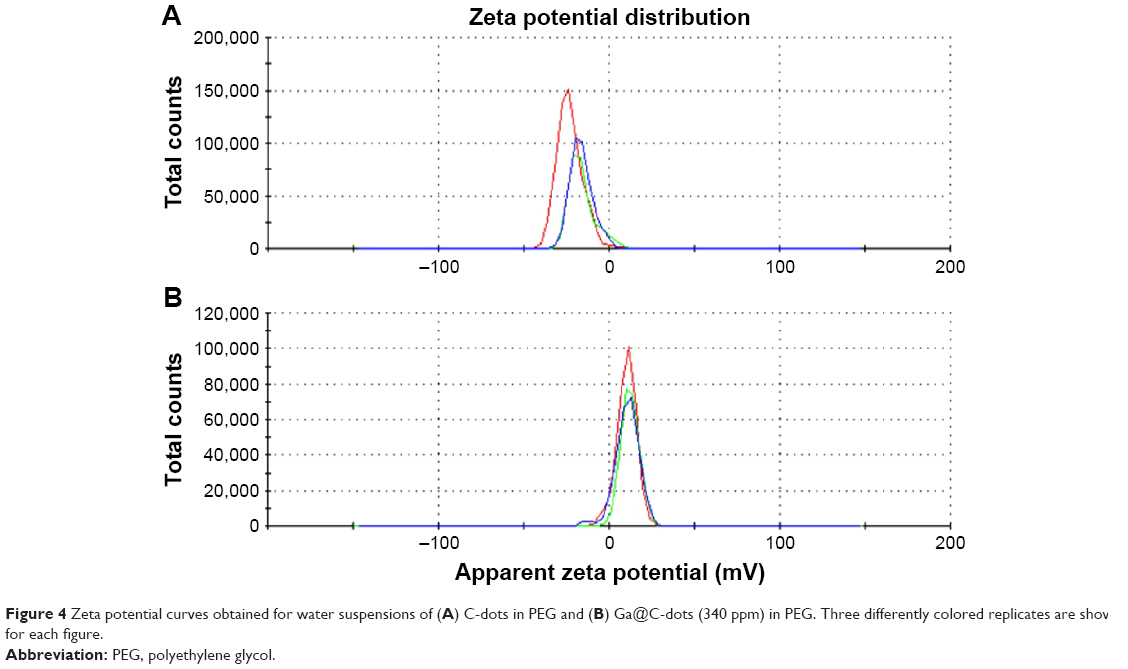 | Figure 4 Zeta potential curves obtained for water suspensions of (A) C-dots in PEG and (B) Ga@C-dots (340 ppm) in PEG. Three differently colored replicates are shown for each figure. |
Antibacterial activity of Ga@C-dots
The antimicrobial activity of Ga@C-dots was evaluated by determining their MIC againstP. aeruginosa, an opportunistic Gram-negative pathogen. We used three strains of P. aeruginosa: PA01, PA14, and the clinical isolate C3719. The experiment included the exposure of the bacteria to a series of diluted aqueous dispersions of Ga@C-dots containing Ga at a starting concentration of 340 ppm in comparison to Ga nanoparticles (370 ppm) or C-dots without Ga. As shown in Table 2, the MIC of the Ga@C-dots was found to be 0.34 ppm for PAO1 and 1.36 ppm for PA14 and C3719. The bacterial growth was partially reduced, although not completely, at Ga@C-dots concentrations of 0.17 ppm for PAO1 and 0.68 ppm for PA14 and C3719. Of note, Ga nanoparticles were not effective against PA14 and C3719 at the concentrations tested, and for PAO1 the MIC was 185 ppm which is 544 more times than the MIC of the Ga-doped C-dots. Furthermore, C-dots were much less effective than the Ga@C-dots, suggesting that the combination of Ga with C-dots offers a synergistic activity against various strains of P. aeruginosa. Furthermore, we showed that Ga@C-dots have comparable MIC values (in vitro) to the commercial antibiotic gentamicin (Table 2), that is commonly used to treat P. aeruginosa keratitis infection. These results suggest that the Ga@C-dots can provide an alternative means for treating antibiotic-resistant bacteria. Future studies will determine if Ga@C-dots have any in vivo side effects, and their biocompatibility.
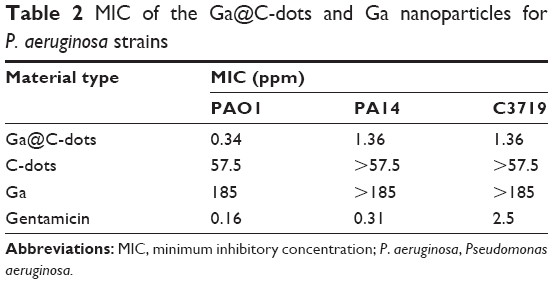 | Table 2 MIC of the Ga@C-dots and Ga nanoparticles for P. aeruginosa strains |
Summary
Ga@C-dots were synthesized by sonication of molten Ga in PEG-400, with the initial Ga content varied from between 70 to 700 mg. Ga@C-dots were shown to have promising antibacterial activity against P. aeruginosa. MIC values of Ga@C-dots against P. aeruginosa ranged between 0.34 and 1.36 ppm, based on the Ga@C-dots formulation used. To conclude, the doping of Ga in C-dots shows synergistic activity against P. aeruginosa. Moreover, Ga@C-dots are highly stable and can be used for at least 2 months after synthesis.
Acknowledgments
The authors wish to express their gratitude and thanks to Prof Gil Goobes and Dr Keren Keinan-Adamsky, Department of Chemistry, Bar Ilan University, for helping with solid-state NMR measurements. MN would like to acknowledge the Adams scholarship for outstanding Ph.D. students, Israel academy of Sciences and Humanity. EB would like to acknowledge the Dyna and Fala Weinstock Foundation for their support. This research was partially supported by the JPI-AMR organization for the NPERDMDR project administered and supported (in part) by grant number 3-11992 from the Chief Scientist Office of the Ministry of Health, Israel.
Disclosure
The authors report no conflicts of interest in this work.
References
Andersson DI, Hughes D. Antibiotic resistance and its cost: is it possible to reverse resistance? Nat Rev Microbiol. 2010;8(4):260–271. | ||
Rizzello L, Pompa PP. Nanosilver-based antibacterial drugs and devices: mechanisms, methodological drawbacks, and guidelines. Chem Soc Rev. 2014;43(5):1501–1518. | ||
Kaneko Y, Thoendel M, Olakanmi O, Britigan BE, Singh PK. The transition metal gallium disrupts Pseudomonas aeruginosa iron metabolism and has antimicrobial and antibiofilm activity. J Clin Invest. 2007;117(4):877–888. | ||
Blecher K, Nasir A, Friedman A. The growing role of nanotechnology in combating infectious disease. Virulence. 2011;2(5):395–401. | ||
Perelshtein I, Lipovsky A, Perkas N, Gedanken A, Moschini E, Mantecca P. The influence of the crystalline nature of nano-metal oxides on their antibacterial and toxicity properties. Nano Res. 2014;8(2):695–707. | ||
Appierot G, Lipovsky A, Dror R, et al. Enhanced antibacterial activity of nanocrystalline ZnO due to increased ROS-mediated cell injury. Adv Funct Mater. 2009;19(6):842–852. | ||
Malka E, Perelshtein I, Lipovsky A, et al. Eradication of multi-drug resistant bacteria by a novel Zn-doped CuO nanocomposite. Small. 2013;9(23):4069–4076. | ||
Sun YP, Zhou B, Lin Y, et al. Quantum-sized carbon dots for bright and colorful photoluminescence. J Am Chem Soc. 2006;128(24):7756–7757. | ||
Wang X, Cao L, Yang ST, et al. Bandgap-like strong fluorescence in functionalized carbon nanoparticles. Angew Chem Int Ed Engl. 2010;49(31):5310–5314. | ||
Li H, Kang Z, Liu Y, Lee S-T. Carbon nanodots: synthesis, properties and applications. J Mater Chem. 2012;22(46):24230–24253. | ||
Luo PG, Sahu S, Yang S-T, et al. Carbon “quantum” dots for optical bioimaging. J Mater Chem B. 2013;1(16):2116. | ||
Gong N, Wang H, Li S, et al. Microwave-assisted polyol synthesis of gadolinium-doped green luminescent carbon dots as a bimodal nanoprobe. Langmuir. 2014;30(36):10933–10939. | ||
Minandri F, Bonchi C, Frangipani E, Imperi F, Visca P. Promises and failures of gallium as an antibacterial agent. Future Microbiol. 2014;9(3):379–397. | ||
Banin E, Lozinski A, Brady KM, et al. The potential of desferrioxamine-gallium as an anti-Pseudomonas therapeutic agent. Proc Natl Acad Sci U S A. 2008;105(43):16761–16766. | ||
Valappil SP, Yiu HHP, Bouffier L, et al. Effect of novel antibacterial gallium-carboxymethyl cellulose on Pseudomonas aeruginosa. Dalt Trans. 2013;42(5):1778–1786. | ||
da Silva JG, Azzolini LS, Wardell SMSV, Wardell JL, Beraldo H. Increasing the antibacterial activity of gallium(III) against Pseudomonas aeruginosa upon coordination to pyridine-derived thiosemicarbazones. Polyhedron. 2009;28(11):2301–2305. | ||
Bernstein LR. Mechanisms of therapeutic activity for gallium. Pharmacol Rev. 1998;50(4):665–682. | ||
Roy AK, Kim S-M, Paoprasert P, Park S-Y, In I. Preparation of biocompatible and antibacterial carbon quantum dots derived from resorcinol and formaldehyde spheres. RSC Adv. 2015;5(40):31677–31682. | ||
Dou Q, Fang X, Jiang S, Chee PL, Lee T-C, Loh XJ. Multi-functional fluorescent carbon dots with antibacterial and gene delivery properties. RSC Adv. 2015;58:46817–46822. | ||
Jin J-C, Xu Z-Q, Dong P, et al. One-step synthesis of silver nanoparticles using carbon dots as reducing and stabilizing agents and their antibacterial mechanisms. Carbon. 2015;94:129–141. | ||
Kumar VB, Perelshtein I, Lipovsky A, Porat Z, Gedanken A. The sonochemical synthesis of Ga@C-dots particles. RSC Adv. 2015;5(32):25533–25540. | ||
Kumar VB, Gedanken A, Kimmel G, Porat Z. Ultrasonic cavitation of molten gallium: formation of micro- and nano-spheres. Ultrason Sonochem. 2014;21(3):1166–1173. | ||
Kumar VB, Koltypin Y, Gedanken A, Porat Z. Ultrasonic cavitation of molten gallium in water: entrapment of organic molecules in gallium microspheres. J Mater Chem A. 2014;2(5):1309–1317. | ||
Kumar VB, Mastai Y, Porat Z, Gedanken A. Chiral imprinting in molten gallium. New J Chem. 2015;39(4):2690–2696. | ||
Deng Y, Chen X, Wang F, Zhang X, Zhao D, Shen D. Environment-dependent photon emission from solid state carbon dots and its mechanism. Nanoscale. 2014;6(17):10388–10393. |
 © 2017 The Author(s). This work is published and licensed by Dove Medical Press Limited. The full terms of this license are available at https://www.dovepress.com/terms.php and incorporate the Creative Commons Attribution - Non Commercial (unported, v3.0) License.
By accessing the work you hereby accept the Terms. Non-commercial uses of the work are permitted without any further permission from Dove Medical Press Limited, provided the work is properly attributed. For permission for commercial use of this work, please see paragraphs 4.2 and 5 of our Terms.
© 2017 The Author(s). This work is published and licensed by Dove Medical Press Limited. The full terms of this license are available at https://www.dovepress.com/terms.php and incorporate the Creative Commons Attribution - Non Commercial (unported, v3.0) License.
By accessing the work you hereby accept the Terms. Non-commercial uses of the work are permitted without any further permission from Dove Medical Press Limited, provided the work is properly attributed. For permission for commercial use of this work, please see paragraphs 4.2 and 5 of our Terms.