")
Back to Journals » OncoTargets and Therapy » Volume 13
G-MDSCs-Derived Exosomal miRNA-143-3p Promotes Proliferation via Targeting of ITM2B in Lung Cancer
Authors Zhou J, Yao Z, Zheng Z, Yang J, Wang R, Fu S, Pan X, Liu Z, Wu K
Received 15 April 2020
Accepted for publication 19 August 2020
Published 30 September 2020 Volume 2020:13 Pages 9701—9719
DOI https://doi.org/10.2147/OTT.S256378
Checked for plagiarism Yes
Review by Single anonymous peer review
Peer reviewer comments 2
Editor who approved publication: Dr Tohru Yamada
Jian-hua Zhou,1,* Zhi-xian Yao,2,* Zhong Zheng,2,* Jun Yang,1 Rui Wang,1 Shi-jie Fu,1 Xu-feng Pan,1 Zhi-hong Liu,2 Ke Wu2
1Shanghai Lung Cancer Center, Shanghai Chest Hospital, Shanghai Jiaotong University, Shanghai, People’s Republic of China; 2Department of Urology, Shanghai General Hospital, Shanghai Jiaotong University, School of Medicine, Shanghai, People’s Republic of China
*These authors contributed equally to this work
Correspondence: Jian-hua Zhou; Ke Wu Email [email protected]; [email protected]
Background: The immune environment of lung cancer is complex, and the critical immune factors that promote lung cancer progression need to be explored. Granulocytic myeloid-derived suppressor cells (G-MDSCs) are regarded as immune suppressing cells. However, they also promote tumor progression through other ways, which needs to be explored further. Therefore, we sought to study the regulatory mechanisms underlying the cancer promoting function of G-MDSCs in lung cancer.
Methods: G-MDSCs were isolated from lung cancer tissues using flow cytometry. Exosomes were separated from the G-MDSCs supernatant by ultracentrifugation and verified using flow cytometry, Western blot, and transmission electron microscopy (TEM). RNA sequencing was used to identify the differential miRNAs and genes. Real-time quantitative real-time PCR (RT-qPCR) confirmed these results. The proliferation rate was assessed using the CCK-8 assay. Lentiviral vectors were used to alter the expression of the miRNAs and genes to analyze their effects on lung cancer progression.
Results: G-MDSCs secreted more exosomes in the lung cancer tissues, which promoted cancer progression by accelerating proliferation. Micro RNA-143-3p (miR-143-3p) increased in G-MDSCs derived exosomes and downregulated integral membrane protein 2B (ITM2B) by targeting the 3ʹ-untranslated region (UTR) region. Overexpression of miR-143-3p enhanced proliferation by inhibiting transcription of ITM2B to activate the PI3K/Akt signaling pathway, which can be blocked by deguelin. This phenomenon was further confirmed by accelerated tumor growth and worse prognosis in mice.
Conclusion: The key findings of this study highlight the potential of the G-MDSC-derived exosomes and the miR-143-3p/ITM2B axis as therapeutic targets and clinical indicators of lung cancer.
Keywords: G-MDSCs, exosomes, miRNA-143-3p, ITM2B, proliferation, lung cancer
Background
Lung cancer is a major cause of cancer-related mortality.1 The progression of lung cancer is closely associated with immune factors and the tumor microenvironment and involves suppression of immune protection. Myeloid-derived suppressor cells (MDSCs) are heterogeneous immune suppressive cells of the myeloid lineage.2 Lung cancer cells and their surrounding stroma recruit and activate MDSCs by producing numerous cytokines.3
MDSC are classified as: granulocytic MDSCs (G-MDSCs) and monocytic MDSCs (M-MDSCs).4 Cells belonging to both the subsets can suppress T cell proliferation and activation.5 Though the proportion of G-MDSCs is less than that of M-MDSCs in the lung cancer immune environment, studies have shown that G-MDSCs have a more profound impact on lung cancer progression.6 G-MDSCs mediate immune suppression function through increasing the levels of nitric oxide (NO) synthase, arginase 1 (Arg-1), and reactive oxygen species (ROS).7 G-MDSCs can also promote lung cancer progression by other ways, such as through exosomes.8
Exosomes are extracellular membrane vesicles that contain proteins and nucleic acid.9 The exosomes composition is tissue-specific and can reflect the state of the cancer.10 MicroRNAs (miRNAs) are 19–22 nucleotide long non-coding RNAs, which have been identified in exosomes.11 Specific miRNAs in the exosomes have been closely associated with cancer progression and can be used as diagnosis and treatment biomarkers. Exosomes are inter-cellular communication mediators because they can carry messages from cells to cells. It is reported that exosomal miRNAs transferred from immune cells to cancer cells contribute to cancer proliferation and metastasis.12 In lung cancer, exosomes are excreted and detectable in fluids including blood, alveolar lavage fluid, and sputum, which are considered to be ideal sources for biomarkers.13,14 As detection technologies improve, exosomal miRNAs have attracted considerable interest in cancers, especially in non-invasive detection of cancers.
Various miRNAs have been reported to be closely related to cancer progression. Among these, the abnormal expression of miR-143-3p has been observed in several cancers.15,16 MiR-143-3p is a highly conserved miRNA located on chromosome 5, position 33, in both human and mouse genomes.17 Wang et al16 reported that the upregulation of miR-143 may be associated with a worse prognosis in lung cancer by promoting brain metastasis. In human pancreatic ductal adenocarcinoma, miR-143-3p was found to be a tumor suppressor by targeting KRAS.18 In addition, miR-143-3p regulates proliferation and migration in MDA-MB-231 cells.19 All these reports show a direct correlation between miR-143-3p expression and tumor genesis and progression.
Integral membrane protein 2B (ITM2B) protein is generated by alternative splicing, which has been shown to induce apoptosis and inhibit proliferation.20 In some studies, ITM2B was regarded as an anti-tumor protein.21 However, ITM2B has not been studied in the lung cancer. The phosphatidylinositol 3-kinase (PI3K)/Akt pathway has been previously demonstrated to be upregulated and to promote proliferation in cancer cells, highlighting its potential function as a therapeutic target in lung cancer treatment.22 Identification of medicinal compounds that target the PI3K/Akt pathway, such as deguelin, has been a challenge. Deguelin, an important compound in an African plant, mundulea sericea, inhibits the in vivo growth of various cancer cells, especially the triple negative breast cancer cells, by inhibiting the PI3K/Akt pathway.23
Therefore, our study aimed to explore the effect of G-MDSCs-derived exosomes in lung cancer through both in vitro and in vivo assays. We aimed to investigate the potential mechanism and provide a strong theoretical basis for exploration of potential therapeutic targets. In the present study, we showed that G-MDSCs-derived exosomal miR-143-3p activates the PI3K/Akt pathway by targeting ITM2B in lung cancer.
Methods
Clinical Samples
This study included 102 patients diagnosed with lung cancer who underwent primary surgery in Shanghai Chest Hospital of Shanghai Jiao Tong University between July 2012 and April 2018 (Table 1). Normal lung tissue samples were obtained from 10 patients with bullae who required partial removal of normal lung tissue. None of the included patients had received radiation or chemotherapy before resection. All tumors were classified according to World Health Organization criteria for lung tumors and frozen immediately after surgery until analysis. All research involving human samples have been approved by the ethics committee of Shanghai Chest Hospital and written informed consent was obtained from all subjects.
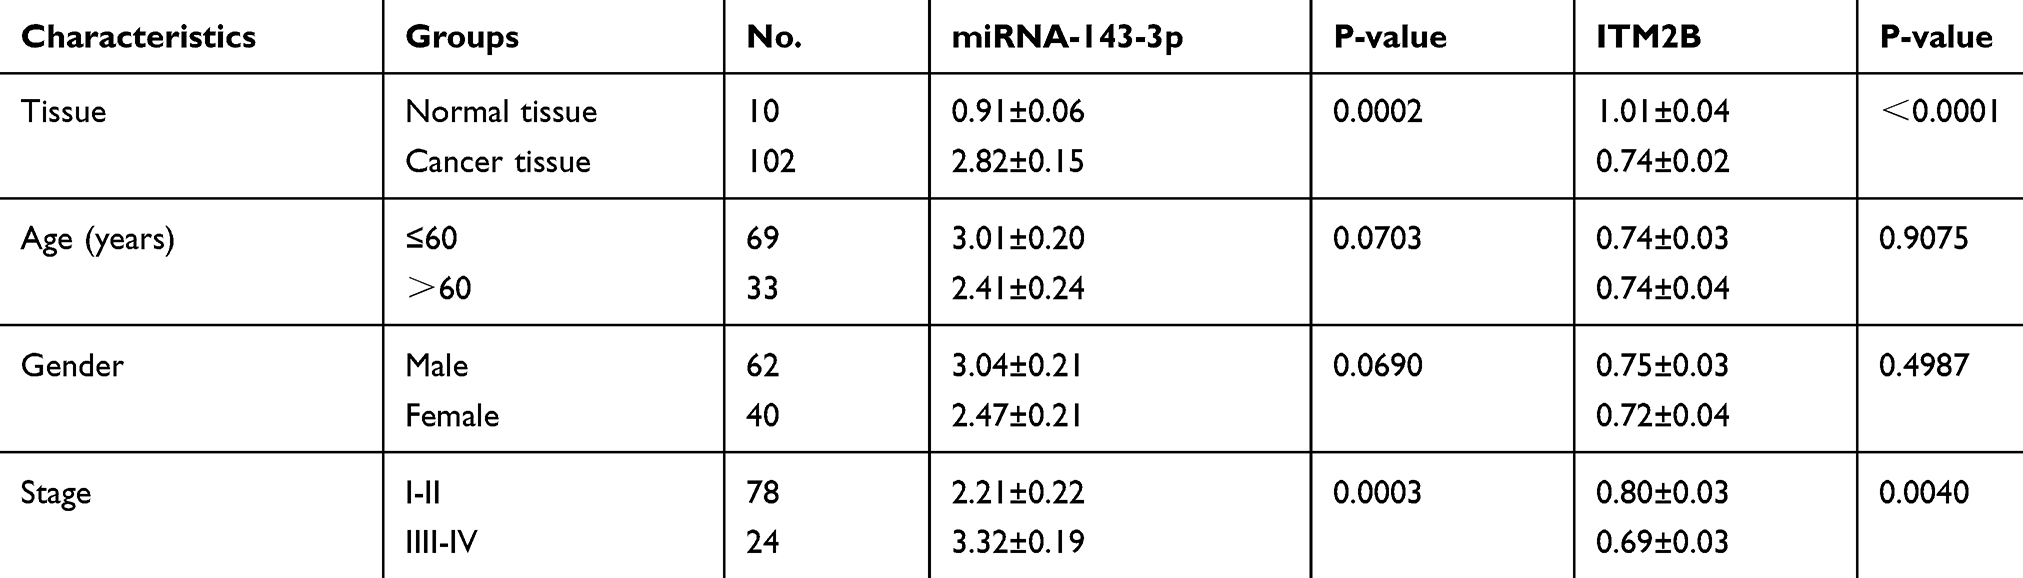 |
Table 1 Relationship Between miRNA-143-3p and ITM2B Expression Levels and Clinicopathological Significance in Lung Cancer Tissues |
Cell Culture
Human lung cancer cell lines, LTEP-a-2, SPC-A-1, NCI-H1395, NCI-H1975, Calu-3, NCI-H1299, NCI-H1650, HCC827, NCI-H358, A549, and mouse lung cancer cell line, Lewis lung carcinoma (LLC) cell line, were provided by the Typical Culture Preservation Commission Cell Bank of the Chinese Academy of Sciences (China). LTEP-a-2, SPC-A-1, NCI-H1395, NCI-H1975, NCI-H1299, NCI-H1650, HCC827, and NCI-H358 cell lines were cultured in Roswell Park Memorial Institute (RPMI)-1640 medium (23400021, Gibco, USA) with 1% penicillin/streptomycin (15140–122, Gibco) and 10% Fetal Bovine Serum (FBS) (10099; Gibco). Calu-3 cells were cultured in Minimum Essential Medium Eagle Medium (MEM) (41500034, Gibco) with NaHCO3 1.5 g/L, Sodium Pyruvate 0.11 g/L, and 10% FBS. A549 cells were cultured in F-12K (21127–022, Invitrogen, USA) with 1% penicillin/streptomycin (15140–122, Gibco) and 10% FBS. LLC cells were cultured in Dulbecco’s Modification of Eagle’s Medium (DMEM) (12800017, Gibco) with NaHCO3 1.5 g/L and 10% FBS. BEAS-2B, a human normal lung epithelial cell line, were cultured in F-12K (21127–022, Invitrogen, USA) with 1% penicillin/streptomycin (15140–122, Gibco) and 10% FBS. LLC cells were cultured in LHC-9 Medium (12680013, Gibco) with 0.5 ng/mL recombinant Epithelial Growth Factor (EGF), 500 ng/mL Hydrocortisone, 0.035 ng/mL Bovine Pituitary Extract, 500 mM Ethanolamine, 500 nM Ethanolamine Phosphate, 0.01 mg/mL Epinephrine, and 0.1 ng/mL Retinoic Acid. All cell lines were cultured under a humidified atmosphere of 5% CO2 at 37°C.
Cell Counting Kit-8 Assay (CCK-8)
The viability and proliferation rates of lung cancer cells were measured by CCK-8 assay. Briefly, the cells were seeded into 96-well plates at a density of 1×10³ cells/well. 10 μL of freshly prepared CCK-8 solutions (ab228554, Abcam, UK) were added into each well for 20 minutes and the optical density (OD) was measured at 450 nm using a scanning multi-well spectrophotometer.
Animals
All animal studies were approved by the institutional Animal Care and Use Committee of Shanghai Jiao Tong University. All mice were maintained in pathogen-free conditions and cared for in compliance with the ethical regulations at Shanghai Chest Hospital. C57B6 mice were provided by the Shanghai Model Organisms Center (China). To establish the lung cancer model, LLC cells (3×10⁵/mouse, 100 μL in phosphate-buffered saline [PBS; 10010023, Gibco]) were subcutaneously injected into the left flank of mice. For MDSCs depletion experiment, monoclonal anti-Ly6G (ab25377, Abcam, 200 μg in 100 μL PBS) was injected intraperitoneally three times a week for 1 week. Immunoglobulin G (Rat IgG; ab37361, Abcam, 200 μg in 100 μL PBS) was used as control. For adoptive transfer experiment, CD11b+ Ly6G+ MDSCs were isolated from the bone marrow (BM) of WT mice by MACS (MDSC isolation kit; 130–094-538, Miltenyi Biotec, Germany) and were transferred to LLC mice with 5×10⁶ G-MDSCs per animal (three times a week for 2 weeks). Tumor diameters and body weight of mice were monitored every day. Tumor volume calculated formula: volume=1/2×length×(width)2.
Isolation of Exosomes
Experiments use exosome-depleted FBS (EXO-FBS-50A, System Biosciences, USA) to avoid the impact of exosomes. Briefly, to remove floating cells and cellular debris, cell culture media was sequentially centrifuged at 300 g for 10 minutes, 2000 g for 15 minutes, and 12,000 g for 30 minutes. The supernatant was further ultra-centrifuged at 100,000 g for 2 hours at 4°C, washed with PBS, and submitted to a second ultracentrifugation at 100,000 g for 2 hours at 4°C. The final exosome pellets were used immediately. Exosomal protein concentration was quantified by BCA protein assay kit (7780S, Cell Signaling Technology, China). GW4869 (10 μM) (HY-19363, MedChemExpress, USA) was utilized to block exosome formation and release as described previously.24
Transmission Electron Microscope (TEM)
The exosomes were precipitated and fixed in 2.5% Glutaraldehyde (G5882, Sigma-Aldrich, USA) at 4°C immediately. After fixation, the specimens were processed through dehydration in gradient alcohol, infiltration in epoxy resin, and embedded. The ultrathin sections were stained with lead citrate and uranyl acetate and observed under TEM (JEOL JEM-1010, Japan).
Flow Cytometry
All splenocytes were flushed out from spleen by 1×PBS and then passed through a 200-mesh sieve to obtain single cell suspension. The following antibodies were listed in Table 2. Cells were detected using a FACS Calibur flow cytometer (Becton Dickinson, USA). Data were analyzed using FlowJo software (Treestar, CA).
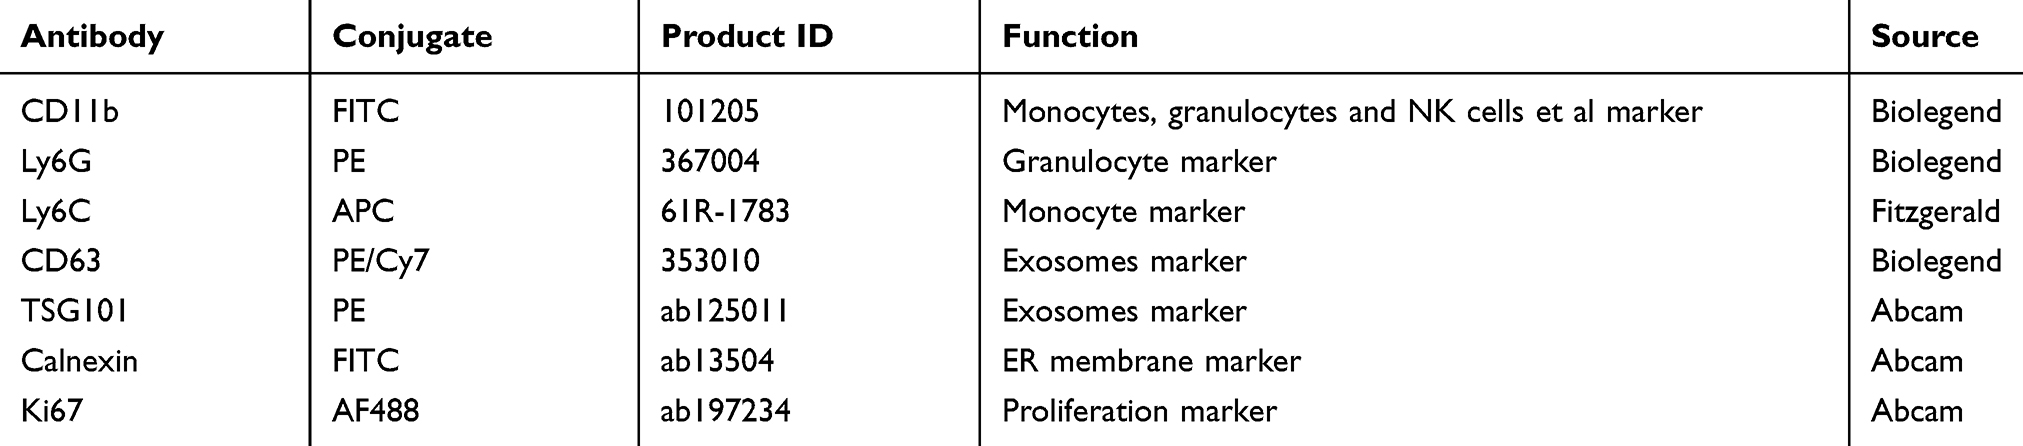 |
Table 2 Monoclonal Antibodies Used for Flow Cytometric Assay |
Western Bolt
The protein concentration of cell lysis was measured. SDS PAGE gel (P0690, Beyotime, China) and PVDF membranes (IPVH00010, Millipore, USA) were needed. Blocking was conducted with Blocking Buffer (P0231, Beyotime). Antibodies were listed in Table 3. The enhanced chemiluminescence reaction (Kibbutz Beit Haemek, Israel) and Alpha Innotech Flour ChemFC2 imaging system (Alpha Innotech) was used for detection.
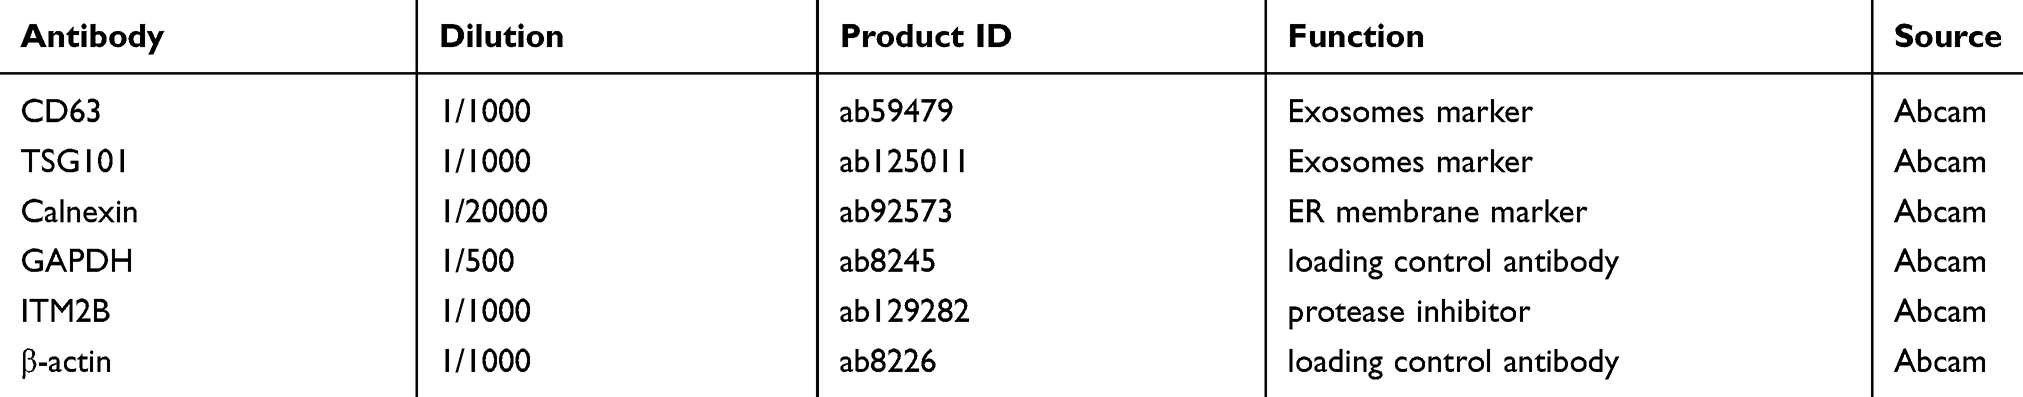 |
Table 3 Antibodies Used for Western Blot Assay |
Real-Time Quantitative Real-Time PCR (RT-qPCR)
Total RNA of cells was extracted using Trizol Reagent (15596026, Thermo Fisher Scientific, USA). According to the manufacturer’s protocols, exosomal RNA was extracted by the Total Exosome RNA and Protein Isolation Kit (4478359, Invitrogen, USA). The miRNAs were amplified using SYBR green technique. U6 snRNA was used as endogenous control to normalize miRNA expression in cells, and cel-miR-39 was used to normalize miRNA expression in exosomes between the samples. The primers of the selected miRNAs were synthesized by Shangon Company (China). Relative miRNA expression level was calculated by 2-ΔΔCt method. All the samples were repeated three times for each miRNA.
RNA-Sequencing
RNA was isolated and enriched for mRNA with MicroPoly A Purist (Ambion, Austin, TX, USA). The quality and quantity of RNA were evaluated with a Bioanalyzer 2100 (Agilent Technologies, Santa Clara, CA, USA), and RNA for each sample was used for RNA sequencing (Illumina HiSeq 2000 platform). The significance of digital gene expression profiles was used to identify differential expression genes between the two groups. The pathway enrichment analysis was performed.
Luciferase
The complementary DNA fragment containing the wild-type or mutant of ITM2B was subcloned downstream of the luciferase gene within the pGL3-Basic luciferase reporter vector (Promega, USA). LTEP-a-2 and SPC-A-1 cells (1.0×10⁵) grown in a 24-well plate were co-transfected with 150 ng of either empty vector or miRNA-143-3p, 50 ng of firefly luciferase reporter comprising wild-type or mutant 3ʹ-UTR of ITM2B fragment using Lipofectamine 3000 (L3000001, Thermo Fisher Scientific). Forty-eight hours after transfection, luciferase assay was determined using the dual luciferase kit (16182, Thermo Fisher Scientific). The relative firefly luciferase activities were normalized to those of Renilla luciferase. Transfection was performed in triplicate.
Stable Transfection with Lentiviral Vectors
Cells (2×10⁵ per well) in 6-well plates were infected with 10 μL of lentiviral vectors containing the miRNA-143-3p mimics, miRNA-143-3p inhibitor, ITM2B overexpression plasmid, ITM2B shRNA, and negative control plasmid (GeneChem, China) for 48 hours. Then, 1.0 μg/mL puromycin (CL13900, MedChemExpress) was used to screen the infected cells for 4–6 weeks. The infection efficiency was confirmed by RT-qPCR, fluorescence microscopy, and Western blot analyses.
Exosome Treatment
Cells were planted into 6-well plates 1 day before treatment. When the cells grew at about 70% of confluent, 200 μg of exosomes were directly added into cells. PBS was as control treatment. Cells were collected for the following experiments after 48 hours treatment. In vivo, when the volume of the xenografts reached approximately 50 mm3, the mice were intratumorally injected with 50 μg exosomes three times for a week. The negative control group was injected with PBS.
Statistical Analysis
Statistical analysis was performed with Prism 8 (GraphPad Software, CA). All data were expressed as means±SEM and analyzed for differences between different treatment groups using Student’s t-test (two-tailed) or two-way ANOVA. Correlation significance was determined by using linear regression. Differences with P-values≤0.05 were considered significant.
Results
Effects of G-MDSCs in Lung Cancer Cells in vitro and in vivo
G-MDSCs are the dominant subpopulation of MDSCs in many cancer tissues and promote tumor progression 2. To explore the effect of G-MDSCs in lung cancer cells, we isolated G-MDSCs from human or mouse lung cancer tissues and then co-cultured them with lung cancer cell lines, LTEP-a-2, the classical lung cancer cell line (Figure 1A). Following 48 hours of co-culture, we assessed cell viability every 24 hours using CCK-8 assays and found that the rate of cell proliferation increased after co-culture with G-MDSCs (Figure 1B and D). Ki67 is associated with and necessary for cell proliferation. We analyzed Ki67 levels using RT-qPCR and found that G-MDSC treatment increased Ki67 levels in both the human and mouse lung cancer cell lines (Figure 1C and E). Anti-ly6G antibody is an effective reagent to deplete G-MDSCs in vivo. We treated a mouse model of lung cancer with anti-ly6G antibody through tail vein injections. Flow cytometry results showed that anti-ly6G antibody effectively decreased G-MDSCs (Figure 1F and G). To test the effect of G-MDSCs on lung cancer in vivo, we used anti-ly6G antibody to deplete G-MDSCs and then performed adoptive transfer of G-MDSCs every 5 days (Figure 1H). Tumor growth rates were recorded every 7 days and the Kaplan–Meier overall survival time was recorded. These results showed that tumors in the G-MDSCs-treated group grew faster than in the control group and G-MDSCs-treated mice had worse prognosis (Figure 1I and J). Taken together, these results showed that G-MDSCs could effectively promote the progression of lung cancer by increasing the proliferation rates of lung cancer cells and tumor growth rates.
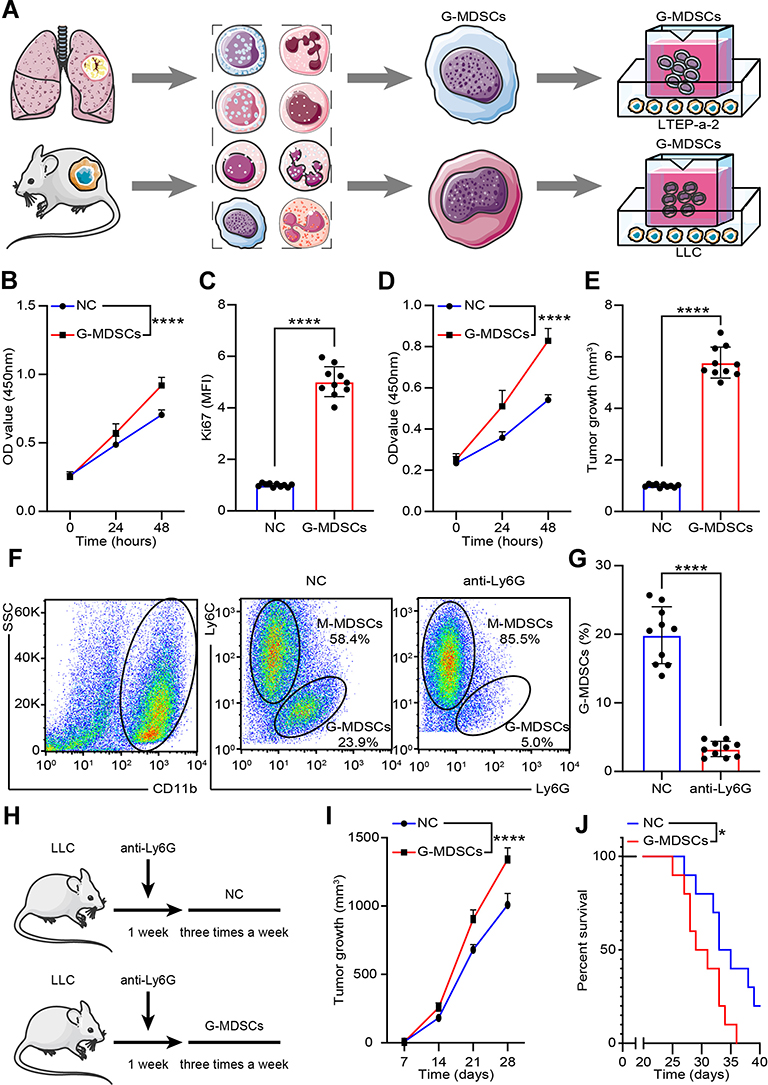 |
Figure 1 G-MDSCs promoted Lung cancer progression. (A) Experimental approach to generate the G-MDSCs-lung cancer cells co-culture system; (B and D) Proliferation rate of LTEP-a-2 cells (B) and LLC cells (D) were analyzed using CCK-8 assay every 24 hours after co-culture with G-MDSCs for 48 hours; (C and E) Ki67 levels in LTEP-a-2 cells (C) and LLC cells (E) were analyzed using RT-qPCR after co-culture with G-MDSCs for 48 hours; (F and G) G-MDSC levels were analyzed in lung cancer xenografts using flow cytometry following treatment with anti-ly6G for 5 days (F) and the data was recorded (G); (H) Experimental approach to construct G-MDSC-depleted mouse model followed by adoptive transfer of G-MDSCs; (I) Tumor growth rate of lung cancer xenograft with or without G-MDSC adoptive transfer; (J) Kaplan–Meier overall survival curve in mice with or without G-MDSC treatment. Mean±standard error of mean (SEM), *P<0.05, ****P<0.001. |
G-MDSCs-Derived Exosomes from Lung Cancer Tissues Promote Proliferation of Cancer Cells
Exosomes were isolated from G-MDSCs by ultracentrifugation and analyzed by TEM (Figure 2A). The size of the exosome particles was between 30–150 nm (Figure 2B). It indicated that we can effectively extract exosomes. The identification of exosomes was confirmed by the positive markers, CD63 and TSG101, and the negative marker, Galnexin, by Western blot and flow cytometry (Figure 2C and D). Western blot analysis showed that the exosomal marker proteins were in G-MDSCs-derived exosomes of lung cancer tissues than normal lung tissues (Figure 2E). To examine whether exosomes secreted by G-MDSCs translocate into the cancer cells, the mice were intratumorally injected with G-MDSCs-derived exosomes and analyzed the exosomal markers by fluorescence microscope. As shown, the fluorescent exosomes entered the cancer cells (Figure 2F). Next, we studied the role of G-MDSCs-derived exosomes in the progression of lung cancer. LLC cells were treated with exosomes for 48 hours and cell proliferation was evaluated using CCK-8 assay every 24 hours. The assay revealed that the G-MDSC-derived exosomes promoted the proliferation of lung cancer cells (Figure 2G). RT-qPCR was used to verify this result, and it showed that Ki67 levels in the LLC cells were increased following exosome treatment for 48 hours (Figure 2H). The effect of G-MDSC-derived exosomes on tumor cell metastasis was evaluated in vivo. Mouse models of lung cancer were intratumorally injected with G-MDSC-derived exosomes. G-MDSC-secreted exosomes greatly increased the proliferation of the tumors (Figure 2I). The survival time of the exosome-treated mice was shorter than that of the control group (Figure 2J). These results showed that G-MDSC-secreted exosomes can be transferred into lung cancer cells and promote tumor progression.
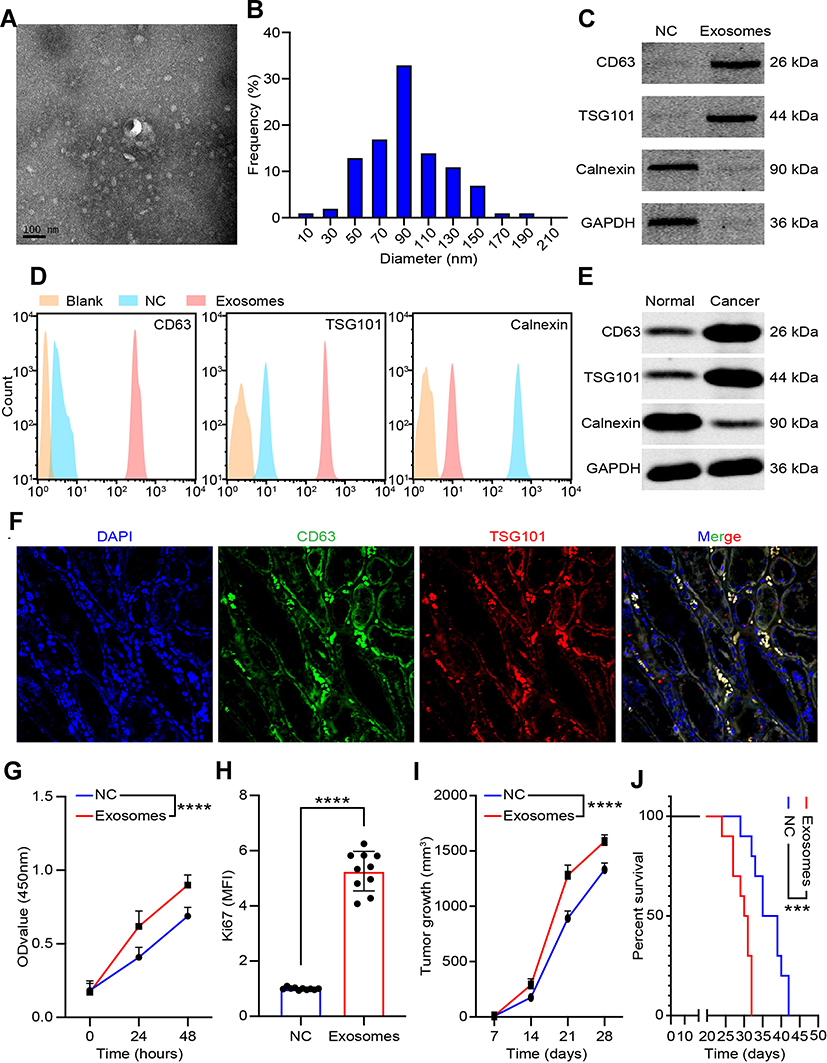 |
Figure 2 Characterization and function of exosomes derived from G-MDSCs. (A) Transmission electron microscopy images of lung cancer G-MDSC-derived exosomes; (B) NanoSight measurement of particle size distribution and concentration in exosomes; (C) Representative Western blot images of CD63, TSG101, and Calnexin proteins in G-MDSCs-derived exosomes; (D) The mean fluorescence intensity of CD63, TSG101, and Calnexin in G-MDSCs-derived exosomes; (E) Representative Western blot images of CD63, TSG101, and Calnexin proteins in exosomes from normal lung tissues derived G-MDSCs culture medium or lung cancer tissues derived G-MDSCs culture medium; (F) Fluorescently-labeled exosomes entered into lung cancer cells. Representative images were filmed after the tissues were fixed and stained (magnification, 400×); (G) Proliferation rate of LLC cells were analyzed by CCK-8 assays every 24 hours following co-culture with G-MDSCs-derived exosomes for 48 hours; (H) Ki67 level in LLC cells were analyzed using RT-qPCR following co-culture with G-MDSC-derived exosomes for 48 hours; (I) Tumor growth rate of lung cancer xenograft with or without adoptive transfer of G-MDSC-derived exosomes; (J) Kaplan–Meier overall survival curve in mice with or without treatment with G-MDSC-derived exosomes. Mean±SEM, ***P<0.005, ****P<0.001. |
Identification of Exosomal miRNAs Secreted from G-MDSCs That Improves the Proliferation of Lung Cancer Cells
Exosomes contain several miRNAs.25 We examined the miRNA profile in LTEP-a-2 cells that were treated with G-MDSC-derived exosomes for 48 hours. miRNA expression profiling revealed that 59 miRNAs were significantly decreased and 42 miRNAs were significantly increased in the cells treated with G-MDSC-derived exosomes compared to the control group (|Fold change|>2, P<0.05; Figure 3A). To confirm this result, we treated ten lung cancer cell lines with G-MDSC-derived exosomes for 48 hours. The cells were collected and analyzed by RT-qPCR. The RT-qPCR assays showed that most miRNAs in the top 15 were upregulated (Figure 3B). To further confirm that the changes in miRNA expression were mediated by G-MDSC-derived exosomes, we treated LTEP-a-2 cells with G-MDSC prior to RT-qPCR analysis. RT-qPCR assays showed that miR-143-3p, miR-470-3p, miR-422b, and miR-222-3p were significantly increased compared to that in the control group (Figure 3C). GW4869, a neutral sphingomyelinase (N-Smase) inhibitor, was used as an exosome inhibitor. We treated LTEP-a-2 cells with G-MDSCs or GW4869 treated G-MDSCs for 48 hours. The expression of microRNAs was verified by RT-qPCR, and showed that miR-143-3p, miR-470-3p, and miR-222-3p were downregulated in the GW4869 treated G-MDSCs group compared to the G-MDSCs treated group. These results indicated that miR-143-3p, miR-470-3p, and miR-222-3p were transferred through G-MDSCs-derived exosomes (Figure 3D). For further confirmation, clinical samples comprising of ten normal lung tissues and 102 lung cancer tissues were collected. We then examined miRNA expression of miR-143-3p, miR-470-3p, and miR-222-3p and found that miR-143-3p was significantly increased in lung cancer tissues compared to normal lung tissues (Figure 3E). In the different stages of lung cancer, miR-143-3p was upregulated as the pathological stage increased (Figure 3F). These results showed that treatment with G-MDSCs-derived exosomes changed the expression of several miRNAs in lung cancer cells. We selected miR-143-3p, which showed similar expression patterns in cell lines and in clinical samples for further investigation.
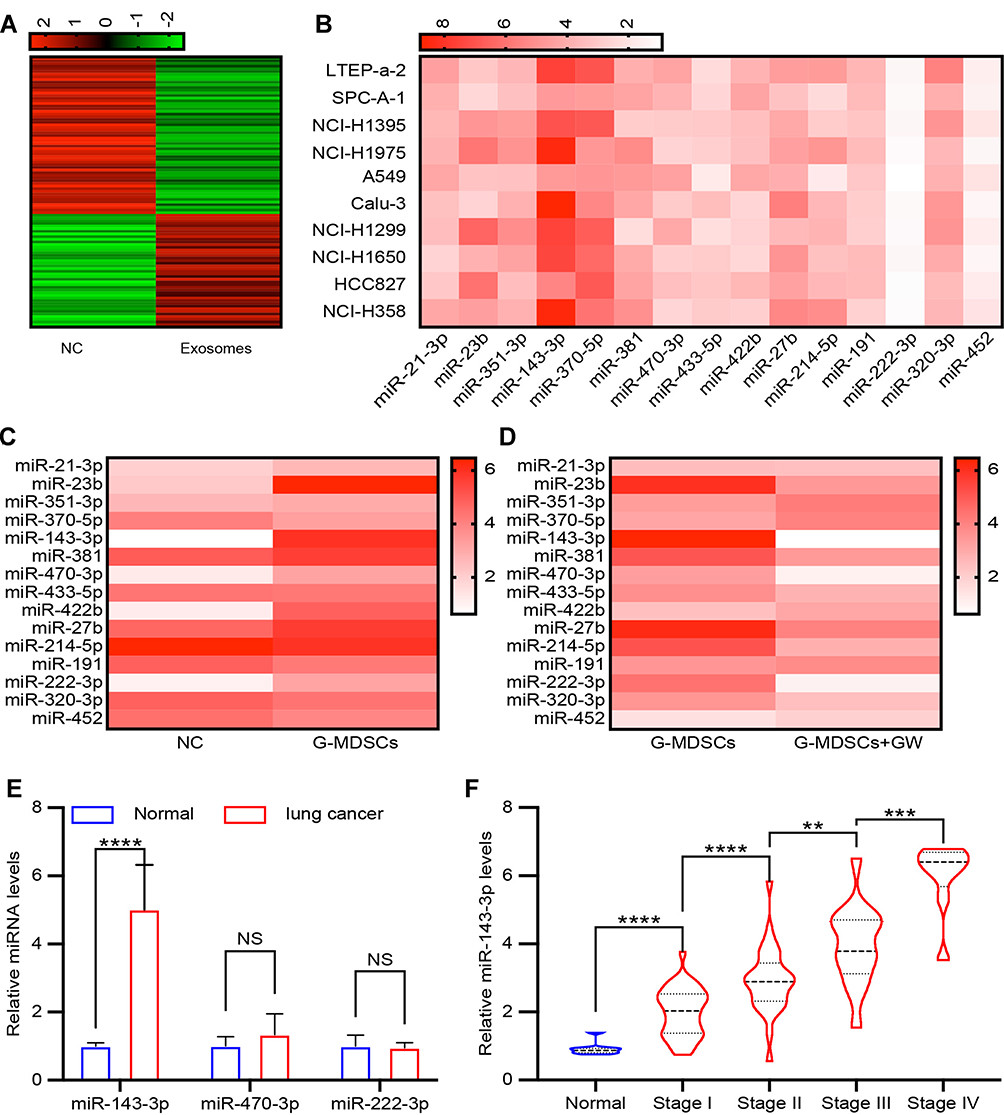 |
Figure 3 Identifying exosomal miRNAs secreted from G-MDSCs. (A) LTEP-a-2 cells were treated with G-MDSC-derived exosomes for 48 hours. The miRNA expression profile was examined and clustering was performed on the differentially expressed microRNAs identified between cells treated with or without G-MDSC-secreted exosomes; (B) Top 15 upregulated miRNA in LTEP-a-2 cells, following treatment with G-MDSC-derived exosomes for 48 hours, were verified in ten lung cancer cell lines; (C) LLC cells were treated with G-MDSCs from lung cancer tissues for 48 hours and RT-qPCR was used to test the top 15 miRNAs levels; (D) GW4869 was added to the G-MDSCs to deplete them of exosomes. LLC cells were treated with G-MDSCs from lung cancer tissues or G-MDSCs treated with GW4869. The top 15 miRNAs were analyzed using RT-qPCR: (E) miR-143-3p, miR-470-3p, and miR-222-3p expression in normal lung tissues and lung cancer tissues were analyzed using RT-qPCR; (F) miR-143-3p levels in normal lung tissues and different stage of lung cancer tissues. Mean±SEM, NS, no statistical significance. **P<0.01, ***P<0.005, ****P<0.001. NS, no statistical significance. |
miRNA-143-3p Promotes Lung Cancer Cell Proliferation
To investigate the role of miRNA-143-3p in lung cancer cell proliferation, we treated the lung cancer cell line, LTEP-a-2, with OE-miRNA-143-3p, or SH-miRNA-143-3p lentiviruses. The expression of miRNA-143-3p was effectively upregulated or downregulated in cells transfected with the OE-miRNA-143-3p lentivirus or SH-miRNA-143-3p lentivirus, respectively, compared to that in cells transfected with the empty lentivirus vector (Figure 4A and B). To test the effect of miRNA-143-3p on cell proliferation, OE-miRNA-143-3p lentivirus or SH-miRNA-143-3p lentivirus-treated LTEP-a-2 cells were subjected to CCK-8 assay after 24 hours. CCK8 assays showed that OE-miRNA-143-3p lentivirus treatment promoted the proliferation rate of LTEP-a-2 cells and SH-miRNA-143-3p lentivirus inhibited cell proliferation (Figure 4C and E). RT-qPCR results showed that overexpression of miRNA-143-3p increased Ki67 levels and downregulation of miRNA-143-3p decreased Ki67 levels (Figure 4D and F). To confirm these results in vivo, we subcutaneously injected OE-miRNA-143-3p lentivirus or SH-miRNA-143-3p lentivirus-treated cells to construct lung cancer mouse models. Tumor growth rates were recorded every 7 days and Kaplan–Meier overall survival time was recorded. These results showed that tumor growth rates of the miRNA-143-3p overexpression group were higher than that of the control group, while that of the miRNA-143-3p downregulated group were lower than the control group (Figure 4G and H). Survival time showed that the miRNA-143-3p overexpression group had a worse prognosis and the miRNA-143-3p downregulated group had a better prognosis (Figure 4I and J). Taken together, these results showed that overexpression of miRNA-143-3p promoted proliferation of lung cancer and silencing miRNA-143-3p could effectively inhibit proliferation of lung cancer cells.
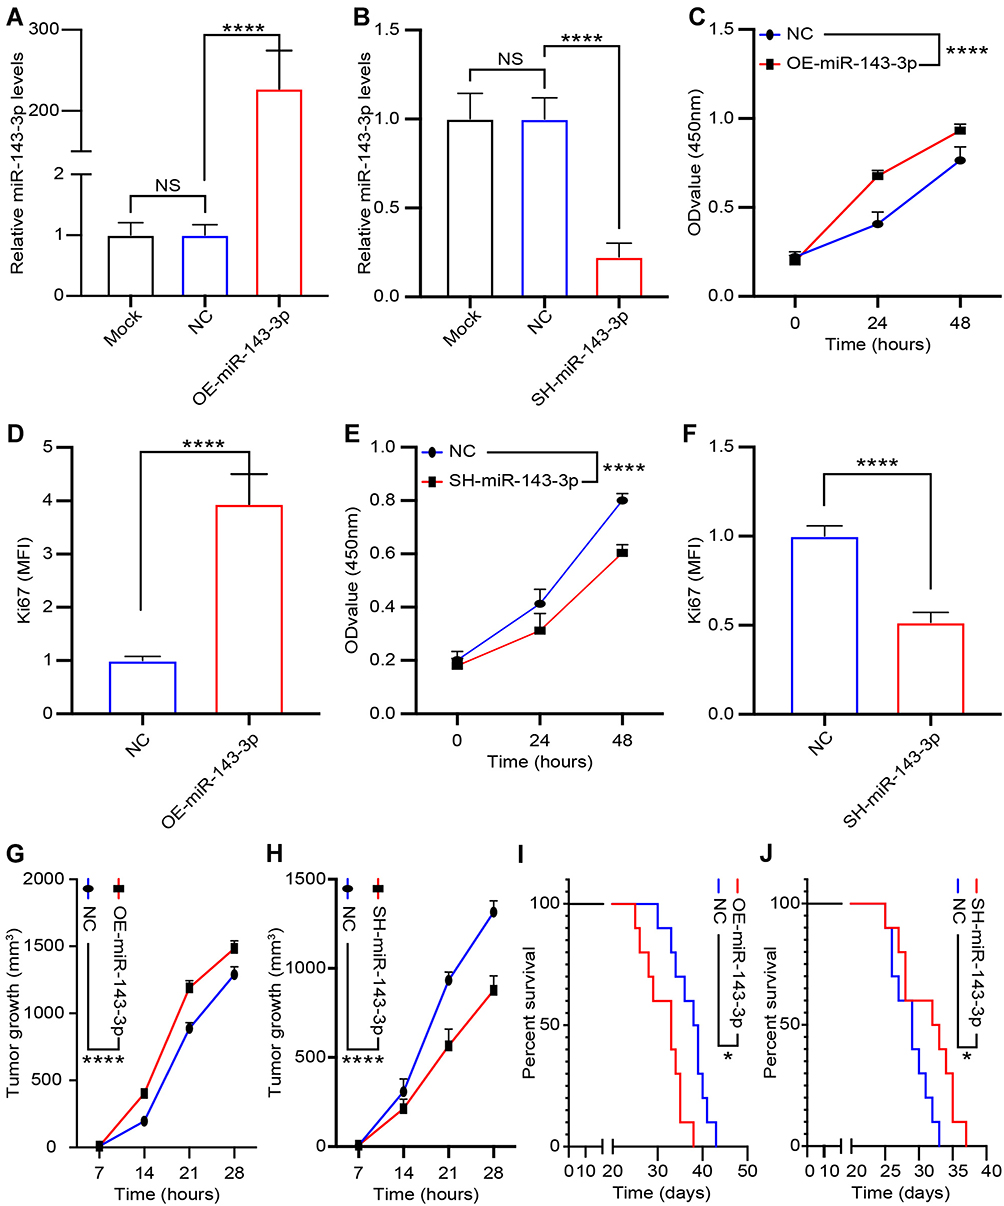 |
Figure 4 miRNA-143-3p promotes proliferation of lung cancer cells. Treatment of lung cancer cells with OE-miRNA-143-3p lentivirus to overexpress miRNA-143-3p and SH-miRNA-143-3p lentivirus to silence miRNA-143-3p. (A) miRNA-143-3p level in LTEP-a-2 cells following mock, empty vector lentivirus, and OE-miRNA-143-3p lentivirus treatment for 24 hours; (B) miRNA-143-3p level in LTEP-a-2 cells following mock, empty vector lentivirus, and SH-miRNA-143-3p lentivirus treatment for 24 hours; (C and E) Proliferation rate of LTEP-a-2 cells were analyzed every 24 hours using CCK-8 assay following treatment with OE-miRNA-143-3p lentivirus (C) or SH-miRNA-143-3p lentivirus (E) compared with empty vector lentivirus treatment; (D and F) Ki67 levels in LTEP-a-2 cells were analyzed using RT-qPCR following OE-miRNA-143-3p lentivirus (D) or SH-miRNA-143-3p lentivirus (F) treatment compared with empty vector lentivirus treatment; (G and H) Tumor growth rate of lung cancer xenograft with OE-miRNA-143-3p lentivirus (G) or SH-miRNA-143-3p lentivirus (H) treatment compared with empty vector lentivirus treatment; (I and J) Kaplan–Meier overall survival curve in mice with OE-miRNA-143-3p lentivirus (I) or SH-miRNA-143-3p lentivirus (J) treatment compared with empty vector lentivirus treatment. Mean±SEM, *P<0.05, ****P<0.001, NS, no statistical significance. |
ITM2B is a miRNA-143-3p Target Gene in Lung Cancer Cells
Previous studies demonstrated that miRNAs enhance cancer progression by targeting mRNAs and inhibiting transcription.26 To determine the target gene of miRNA-143-3p in lung cancer cells, RNA sequencing was used to test downregulated genes in LTEP-a-2, SPC-A-1, and A549 cells following overexpression of miRNA-143-3p by treatment with OE-miRNA-143-3p lentivirus for 48 hours. The results showed that 164 genes were downregulated in the three cell lines (Figure 5A). We used miRmap (http://mirmap.ezlab.org/), microT (http://www.microrna.gr/microT), PicTar (http://pictar.mdc-berlin.de/), and TargetScan (http://www.targetscan.org/) to predict potential miRNA-143-3p target genes. These analyses showed four genes in the intersection of the databases and the RNA sequencing results (Figure 5B). To confirm these results, we analyzed the candidate genes in ten lung cancer cell lines after OE-miRNA-143-3p lentivirus treatment for 48 hours. RT-qPCR results showed that ITM2Bexpression decreased and was most consistent (Figure 5C). Analysis of protein level by Western blot assays showed that ITM2B decreased in both LTEP-a-2 and SPC-A-1 cells after OE-miRNA-143-3p lentivirus treatment for 48 hours (Figure 5D). Then, we constructed a reporter construct in which the putative miRNA-143-3p binding site in the ITM2B sequence was mutated by site-directed mutagenesis (Figure 5E). As expected, the miRNA-143-3p-mediated suppression of luciferase activity was abolished by mutant ITM2B. We next evaluated the expression level of ITM2B in LTEP-a-2 and SPC-A-1 cells following overexpression of miRNA-143-3p. Notably, miRNA-143-3p overexpression significantly decreased the expression levels of ITM2B (Figure 5F and G). Collectively, these data suggest that miRNA-143-3p decreases the expression levels of ITM2B.
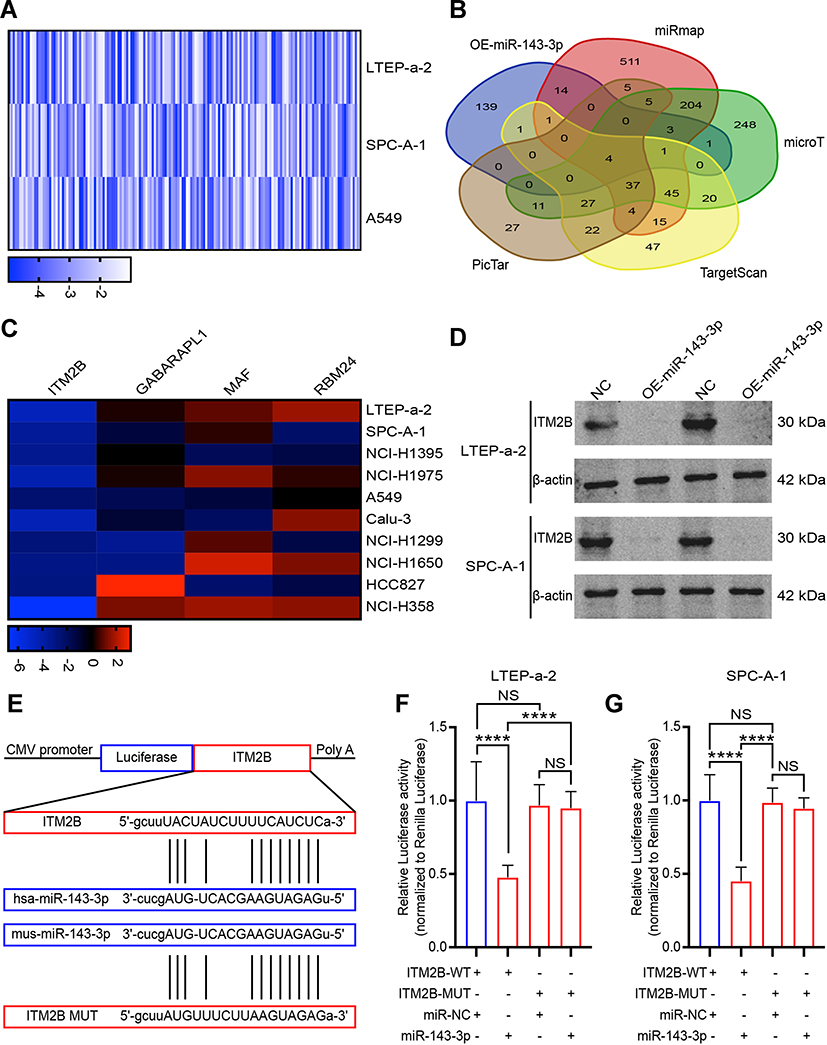 |
Figure 5 ITM2B is a target of miRNA-143-3p in lung cancer cells. (A) RNA sequencing results of downregulated genes in LTEP-a-2, SPC-A-1, and A549 cells following miRNA-143-3p overexpression; (B) Venn diagram of intersection of target genes of miRNA-143-3p predicted using several bioinformatics databases and RNA sequencing results; (C) Levels of four downregulated genes in 10 lung cancer cells following transfection with OE-miRNA-143-3p lentivirus; (D) Representative images of Western blot analysis ofITM2B proteins in lung cancer cells following OE-miRNA-143-3p lentivirus treatment for 48 hours; (E) Schematic view of putative miRNA-143-3p targeting site in the WT and Mut3ʹ-UTR of ITM2B; (F and G) Luciferase activity assay in LTEP-a-2 (F) and SPC-A-1 (G) cells transfected with luciferase report plasmids containing ITM2B3ʹ-UTR (WT or Mut), and control miRNA or miRNA-143-3p. Mean±SEM, ****P<0.001, NS, no statistical significance. |
ITM2B Inhibited Lung Cancer Proliferation by Repressing PI3K/AKT Pathway Activation
To determine the expression level of ITM2B in lung cancer, we evaluated the level of ITM2B transcript in lung cancer tissues (n=515) and compared it to normal lung tissues (n=59). TCGA data showed that ITM2B level decreased in lung cancer tissues (Figure 6A). Clinical samples were collected and analyzed by RT-qPCR. RT-qPCR results showed that ITM2B was upregulated with increased expression in the higher pathological stages (Figure 6B). These results showed that ITM2Bwas downregulated in lung cancer tissues and may function as a tumor suppressor gene. Previous results showed that ITM2B was regulated by miRNA-143-3p, which is mainly enriched in exosomes. We analyzed ITM2B level in 10 lung cancer cell lines using RT-qPCR. Results showed that ITM2B expression was similar in lung cancer cell lines and normal lung cells, BEAS-2B (Figure 6C). This indicated that downregulation of ITM2B in lung cancer tissues mainly depended on extracellular factors. To investigate the function of ITM2B in lung cancer cells, we treated LTEP-a-2 cells with mock, empty vector, and OE-ITM2B lentivirus for 48 hours and followed by RT-qPCR. Results showed that OE-ITM2B lentiviral treatment effectively upregulated ITM2B (Figure 6D). CCK-8 assays showed that OE-ITM2B lentivirus treatment inhibited the rate of proliferation of LTEP-a-2 cells (Figure 6E). RT-qPCR results showed that overexpression ITM2B decreased Ki67 levels (Figure 6F). To confirm these results in vivo, we subcutaneously injected OE-ITM2B lentivirus-treated cells to generate a lung cancer mouse model. Tumor growth rates were recorded every 7 days and Kaplan–Meier overall survival time was recorded. These results showed that the tumor growth rates in the ITM2B overexpression group were higher than that in the control group (Figure 6G). Survival time showed that the ITM2B overexpression group had better prognosis (Figure 6H). Taken together, these results showed that overexpression ITM2B inhibited lung cancer progression by suppressing proliferation.
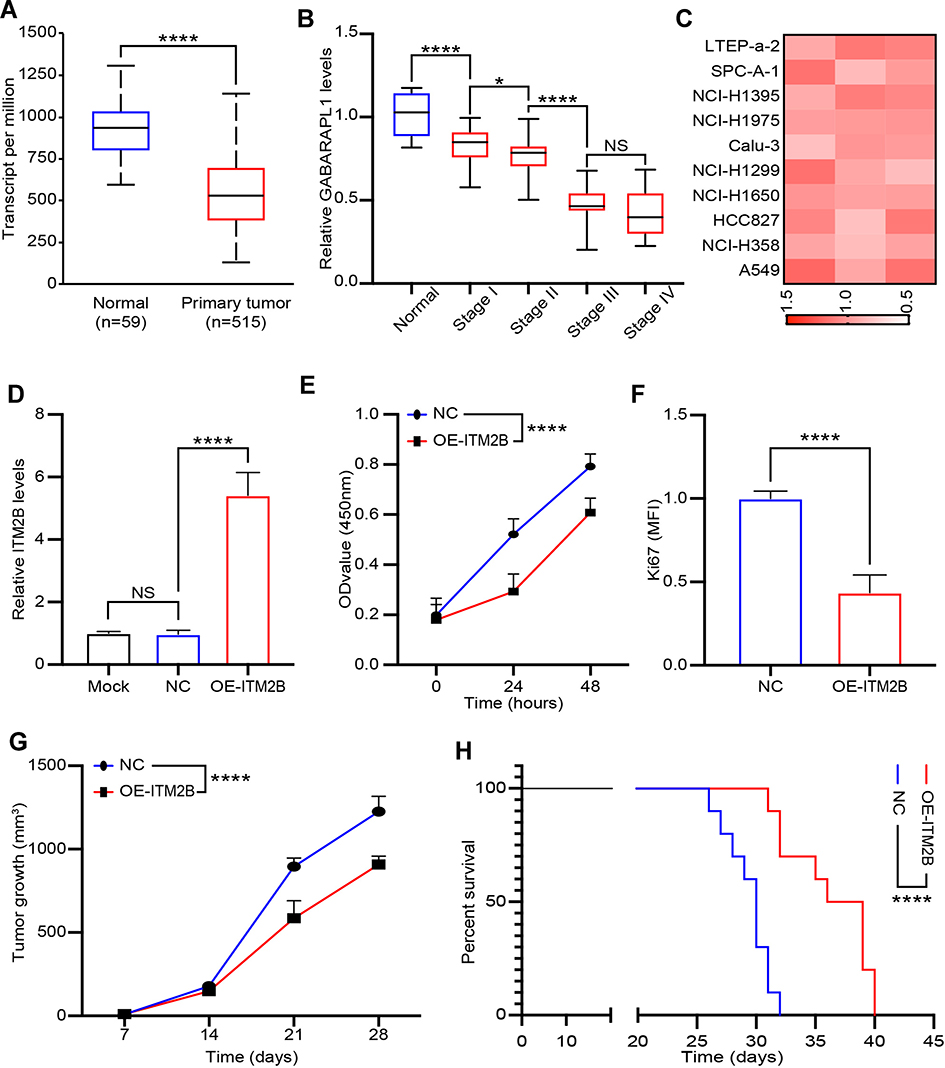 |
Figure 6 ITM2B was decreased in lung cancer tissues and inhibited tumor progression. (A) ITM2B levels in lung cancer tissues compared to normal lung tissues according to TCGA database; (B)ITM2B levels in different stages of lung cancer and normal lung tissues analyzed using RT-qPCR. (C)ITM2B transcription levels in 10 lung cancer cell lines; (D) ITM2B level in LTEP-a-2 cells after mock, empty vector lentivirus, and OE-ITM2B lentivirus treatment for 24 hours; (E) Proliferation rate of LTEP-a-2 cells were assessed using CCK-8 assays every 24 hours following treatment with OE-ITM2B lentivirus compared with empty vector lentivirus treatment; (F) Ki67 levels in LTEP-a-2 cells were assessed using RT-qPCR following OE-ITM2B lentivirus treatment compared with empty vector lentivirus treatment; (G) Tumor growth rate of lung cancer xenograft following OE-ITM2B lentivirus treatment compared with empty vector lentivirus treatment; (H) Kaplan–Meier overall survival curve in mice with OE-ITM2B lentivirus treatment compared with empty vector lentivirus treatment. Mean±SEM, *P<0.05, ****P<0.001, NS, no statistical significance. |
To explore the specific mechanism of proliferation-promoting function of ITM2B, we knocked down ITM2B with SH-ITM2B lentivirus for 24 hours. Hierarchical clustering and heatmap analysis of RNA sequencing results showed that 168 genes were upregulated and 425 genes were downregulated following ITM2B knockdown (Figure 7A). The differentially expressed genes were hierarchically clustered and pathway analysis showed that several signaling pathways were activated and the PI3K/Akt signaling pathway contained more differential genes (Figure 7B). To confirm these results, we analyzed the phosphorylation of PI3K and Akt and compared it to the total protein level. Western blot analysis showed that ITM2B silencing activated the PI3K/Akt signaling pathway while Deguelin, a potent PI3K/Akt inhibitor, reversed this phenomenon (Figure 7C and D). To test whether ITM2B silencing promoted proliferation through the activation of PI3K and Akt signaling pathway, we treated LTEP-a-2 cells with SH-ITM2B lentivirus and/or Deguelin for 48 hours. CCK8 assays showed that SH-ITM2B lentivirus treatment promoted the rate of proliferation of LTEP-a-2 cells while Deguelin reversed the effect (Figure 7E). RT-qPCR results showed that knockdown of ITM2B increased Ki67 levels while Deguelin inhibited this increase (Figure 7F). To confirm these results in vivo, we subcutaneously injected SH-ITM2B lentivirus-treated cells to construct a lung cancer mouse model. Tumor growth rates were recorded every 7 days and Kaplan–Meier overall survival time were recorded. These results showed that the tumor growth rates in the ITM2B silenced group was higher than in the control group and Deguelin had an anti-tumor function (Figure 7G). Survival time showed that the ITM2B silenced group had a worse prognosis while Deguelin extended the survival time (Figure 7H). Taken together, these results showed that silencing of ITM2B promoted lung cancer progression by activation PI3K and Akt signaling pathway and Deguelin inhibited cancer progression by blocking this axis.
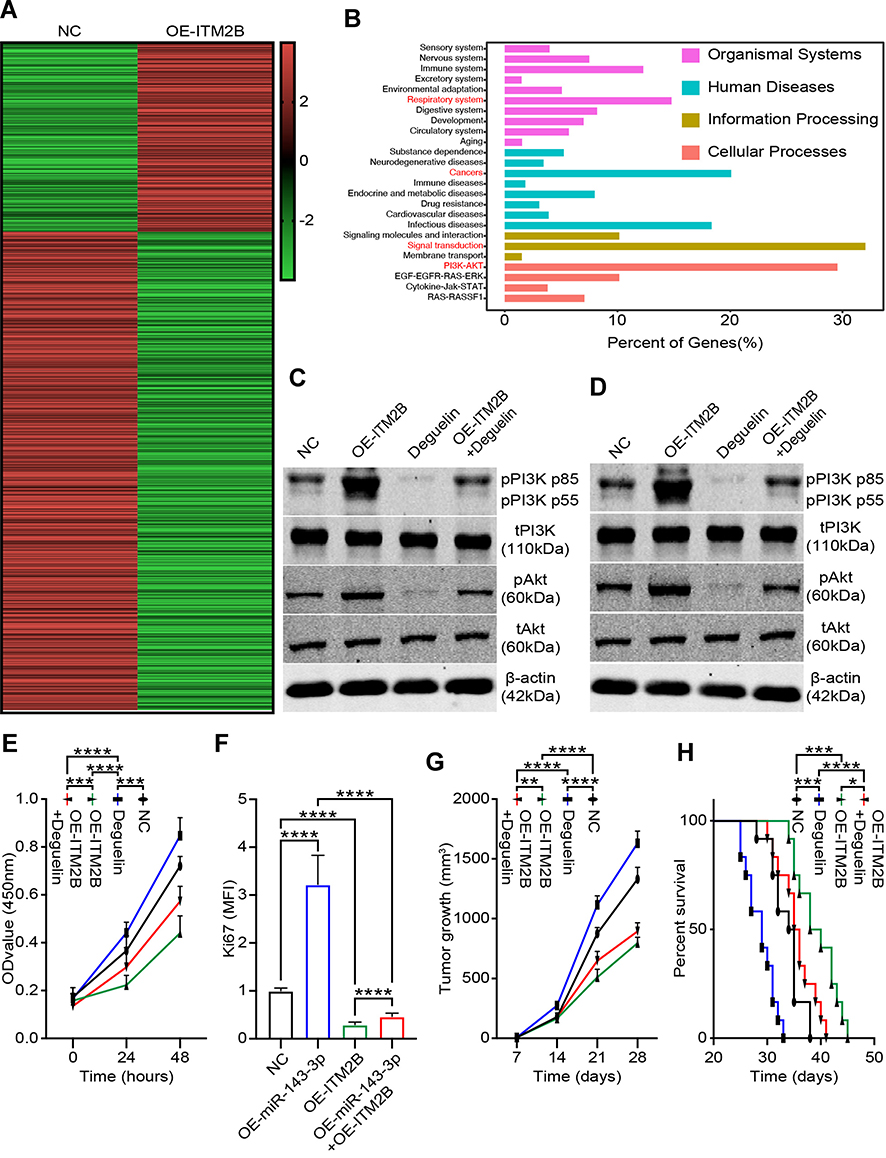 |
Figure 7 Silencing ITM2B was significantly active PI3K/Akt signaling pathway in lung cancer cells. (A) Hierarchical clustering and heatmap analysis of RNA sequencing results of ITM2B knockdown LTEP-a-2 cells and control group; (B) Pathway analysis of the differentially expressed genes using the KEGG database; (C and D) The phosphorylation and total expression levels of PI3K and Akt in LTEP-a-2 cells (C) and SPC-A-1 cells (D). Cells infected with SH-ITM2B lentivirus and/or Deguelin. The expression levels of the phosphorylated proteins were normalized to those of the respective total protein; (E) Proliferation rate of LTEP-a-2 cells was analyzed using CCK-8 assays every 24 hours following treatment with SH-ITM2B lentivirus and/or Deguelin treatment compared with the control group; (F) Ki67 levels of LTEP-a-2 cells were analyzed using RT-qPCR following SH-ITM2B lentivirus and/or Deguelin treatment compared with the control group; (G) Tumor growth rate of lung cancer xenograft with SH-ITM2B lentivirus and/or Deguelin treatment compared with the control group; (H) Kaplan–Meier overall survival curve in mice with SH-ITM2B lentivirus and/or Deguelin treated compared with the control group. Mean±SEM, *P<0.05, **P<0.01, ***P<0.005, ****P<0.001. |
miRNA-143-3p/ITM2B Axis Affected the Development of Lung Cancer and Can Be a Biomarker
Next we sought to delineate the effects of the interaction between miRNA-143-3p and ITM2B on the biological characteristics of lung cancer cells. OE-miRNA-143-3p lentivirus, OE-ITM2B lentivirus, OE-miRNA-143-3p lentivirus with OE-ITM2B lentivirus, and empty vector lentivirus were each delivered into LTEP-a-2 and SPC-A-1 cells and injected into nude mice to examine their effects on tumor progression. The proliferation rate of LTEP-a-2 and SPC-A-1 cells, analyzed using CCK-8 assays every 24 hours, showed that the OE-miRNA-143-3p lentivirus promoted proliferation while the OE-ITM2B lentivirus treatment reversed it (Figure 8A and B). RT-qPCR results showed that overexpression of miRNA-143-3p increased the Ki67 levels while OE-ITM2B lentivirus inhibited this increase (Figure 8C and (D). Treatment with OE-miRNA-143-3p lentivirus resulted in an increase in tumor volume compared with those treated with empty vector lentivirus or OE-miRNA-143-3p lentivirus with OE-ITM2B lentivirus (Figure 8E). OE-miRNA-143-3p lentivirus-treated mice had worse prognosis, while OE-ITM2B lentivirus-treated mice had prolonged survival time (Figure 8F). To explore the clinical significance of the miRNA-143-3p/ITM2B axis, we analyzed the correlation between miRNA-143-3p and ITM2B in lung cancer tissues. The results showed that there was a negative correlation between miRNA-143-3p and ITM2B (Figure 8G). ROC analysis of the individual miRNA-143-3p and ITM2B for the lung cancer tissues and normal lung tissues showed that miRNA-143-3p and ITM2B could be used as good biomarkers to predict lung cancer (Figure 8H and I). These results showed that the miRNA-143-3p/ITM2B axis affected the development of lung cancer and represents a potential diagnostic marker. Taken together, G-MDSC-derived miRNA-143-3p promoted proliferation of lung cancer cells by targeting ITM2B via PI3K/Akt pathway activation (Figure 9)
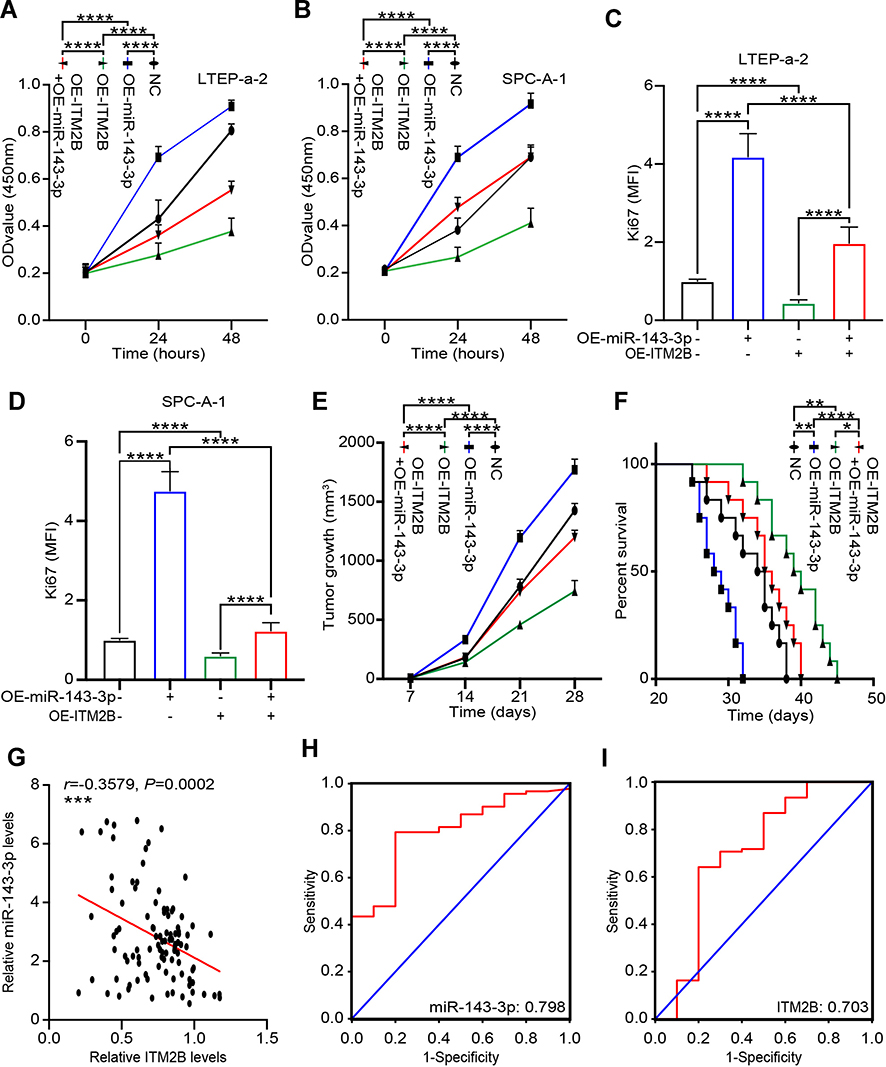 |
Figure 8 miRNA-143-3p andITM2Bcould be biomarkers for lung cancer. (A and B) Proliferation rate of LTEP-a-2 (A) and SPC-A-1 (B) cells were assessed using CCK-8 assays every 24 hours following treatment with OE-miRNA-143-3p lentivirus and/or OE-ITM2B lentivirus treatment compared with control group; (C and D) Ki67 levels in LTEP-a-2 (C) and SPC-A-1 (D) cells were analyzed using RT-qPCR following OE-miRNA-143-3p lentivirus and/or OE-ITM2B lentivirus treatment compared with control group; (E) Tumor growth rate of lung cancer xenograft with OE-miRNA-143-3p lentivirus and/or OE-ITM2B lentivirus treatment compared with control group; (F) Kaplan–Meier overall survival curve in mice with OE-miRNA-143-3p lentivirus and/or OE-ITM2B lentivirus treatment compared with control group; (G) Correlation of miRNA-143-3p and ITM2B in lung cancer tissues; (H) ROC analysis of the individual miRNA-143-3p in the lung cancer tissues and normal lung tissues; (I) ROC analysis of the individual ITM2B in the lung cancer tissues and normal lung tissues. Mean±SEM, *P<0.05, **P<0.01, ***P<0.005, ****P<0.001. |
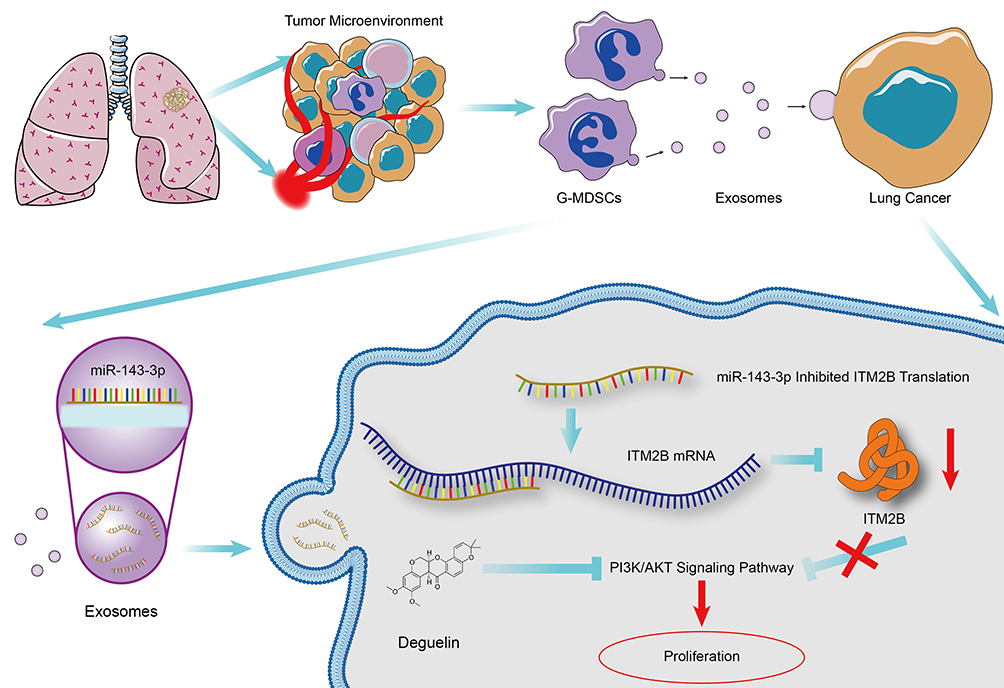 |
Figure 9 Schematic model. G-MDSC-derived miRNA-143-3p to promote proliferation of lung cancer cells by targeting ITM2B via PI3K/Akt pathway activation. |
Discussion
Experimental and clinical studies have shown that the progression of lung cancer is closely associated with the immune environment.27 G-MDSC-mediated immune suppression contributes to the immune escape of cancer cells. Immune cells have more than just immune-regulatory functions. Wu28 reported that MDSCs promoted proliferation bladder cancer not only by immune suppression function. Similar to previous studies, we found that the G-MDSCs indirectly promote proliferation and reducing G-MDSCs improves prognosis.
Immune cells regulate cancer progression through many ways, such as cytokines, interacting with receptors, and through exosomes.29 Recent studies have found that exosomes are closely associated with cancer progression.30 Here, we firstly investigated the regulatory role of G-MDSC-derived exosomes in lung cancer progression. We report that G-MDSC-derived exosomes were significantly more increased in lung cancer tissues than in normal lung tissues. Consistent with our results, Zhang et al31 reported that several immune cells produce more exosomes in cancer tissues, and trigger tumorigenesis and development. In addition, a recent study reported that exosome transportation was an important regulator in the formation and progression of lung cancer, and that the inhibition of exosomes could inhibit tumor proliferation.32 In this study, microscopic observation showed that the fluorescently-labeled exosomes were able to enter the lung cancer cells. We separated and isolated G-MDSC-derived exosomes and found that exosomes promoted the proliferation of lung cancer in vitro and in vivo.
Exosomal contents are rich in variety and exosomes are therefore functionally versatile. Ho et al12 found that exosomes suppress cell proliferation and invasion and activate autophagy by regulating the IL-6 trans-signaling axis. Zhang et al31 reported that exosomes inhibit autophagy to promote gastric cancer progression via the AKT1/mTOR pathway. In our study, G-MDSC-derived exosome treatment increased several miRNAs in lung cancer cells and we identified that exosomes promoted proliferation through upregulation of miR-143-3p levels. MiRNAs play an important role in regulating the expression of specific genes at the transcriptional and posttranscriptional levels. Wu et al33 found that the miR-26-5p inhibit the proliferation of bladder cancer cells by regulating PDCD10. miR-143-3p has been well characterized as a cancer regulator and a tumor promoter. Notably, our results indicate that miR-143-3p expression was markedly upregulated in the lung cancer tissues and inversely correlated with lung cancer progression.
Bioinformatics analysis was performed to identify the potential target genes of miR-143-3p involved in the regulation of proliferation, and ITM2B was identified as a target. Our results indicated that miR-143-3p suppressesITM2B expression significantly and that knockdown of miR-143-3p led to ITM2B overexpression. Luciferase reporter assays verified that miR-143-3p downregulated ITM2B expression by directly binding to its 3ʹ-UTR. Recent studies indicate that ITM2B is a critical factor in cancers.34 Our present results also revealed that silencing ITM2B activated the PI3K/Akt signaling pathway. Deguelin, a naturally occurring rotenoid, is a potent PI3K/Akt inhibitor. We treated lung cancer cells with downregulated expression of ITM2B with deguelin and found that deguelin treatment partly reversed PI3K/Akt activation and promoted proliferation. Furthermore, ITM2B overexpression partially blocked the proliferation-promoting function of miR-143-3p. These data indicate that ITM2B might be a critical player in progression of lung cancer, which is regulated by the G-MDSC-derived exosomal miR-143-3p.
Conclusions
In this work, we described the facilitatory role of G-MDSC-derived exosomal miR-143-3p in promoting proliferation of lung cancer cells. We also revealed the mechanism through which miR-143-3p and ITM2B interact and regulate the PI3K/Akt pathway. Our study provides new mechanistic insights into the regulatory role of exosomal miRNA in lung cancer and may aid in the development of novel therapeutic strategies targeting exosomes.
Abbreviations
Arg-1, arginase 1; BM, bone marrow; CCK-8, cell counting kit-8 assay; DMEM, Dulbecco’s Modification of Eagle’s Medium; EGF, epithelial growth factor; FBS, fetal bovine serum; G-MDSCs, granulocytic MDSCs; ITM2B, integral membrane protein 2B; LLC, Lewis lung carcinoma; MDSCs, myeloid-derived suppressor cells; MEM, Minimum Essential Medium Eagle Medium; miRNAs, microRNAs; miR-143-3p micro RNA-143-3p; M-MDSCs, monocytic MDSCs; NO, nitric oxide; N-smase, neutral sphingomyelinase; OD, optical density; PI3K, phosphatidylinositol 3-kinase; RPMI, Roswell Park Memorial Institute; ROS, reactive oxygen species; RT-qPCR, real-time quantitative real-time PCR; TEM, transmission electron microscopy; UTR, untranslated region.
Data Sharing Statement
The datasets generated and/or analyzed during the current study are available from the corresponding authors on reasonable request.
Ethics Approval and Consent to Participate
This study was supported by the Ethics Committee of Shanghai Chest Hospital of Shanghai Jiao Tong University. All participating patients provided written informed consent. Mice used for in vivo experimental animal studies were cared for in accordance with a protocol approved by the Laboratory Animal Care and Use Committee of Shanghai Chest Hospital of Shanghai Jiao Tong University.
Acknowledgments
We thank all other researchers in our laboratory.
Author Contributions
All authors made a significant contribution to the work reported, whether that is in the conception, study design, execution, acquisition of data, analysis and interpretation, or in all these areas; took part in drafting, revising, or critically reviewing the article; gave final approval of the version to be published; have agreed on the journal to which the article has been submitted; and agree to be accountable for all aspects of the work.
Funding
The present study was supported by the Natural Science Foundation of China (no. 81672515), the Shanghai Pujiang Program (no. 16PJD039) and the Commission of Gaofeng Clinical Medicine Grant (no. 20172019).
Disclosure
The authors report no conflicts of interest for this work.
References
1. Schoenfeld AJ, Chan JM, Kubota D, et al. Tumor Analyses Reveal Squamous Transformation and Off-Target Alterations As Early Resistance Mechanisms to First-line Osimertinib in EGFR-Mutant Lung Cancer. Clin Cancer Res. 2020;26(11):2654–2663. doi:10.1158/1078-0432.CCR-19-3563
2. Wang Y, Yin K, Tian J, et al. Granulocytic Myeloid-Derived Suppressor Cells Promote the Stemness of Colorectal Cancer Cells through Exosomal S100A9. Adv Sci. 2019;6(18):1901278. doi:10.1002/advs.201901278
3. O’Callaghan DS, O’Donnell D, O’Connell F, O’Byrne KJ. The role of inflammation in the pathogenesis of non-small cell lung cancer. J Thorac Oncol. 2010;5(12):2024–2036. doi:10.1097/JTO.0b013e3181f387e4
4. Lauret Marie Joseph E, Laheurte C, Jary M, et al. Immunoregulation and Clinical Implications of ANGPT2/TIE2(+) M-MDSC Signature in Non-Small Cell Lung Cancer. Cancer Immunol Res. 2020;8(2):268–279. doi:10.1158/2326-6066.CIR-19-0326
5. John V, Kotze LA, Ribechini E, Walzl G, Du Plessis N, Lutz MB. Caveolin-1 Controls Vesicular TLR2 Expression, p38 Signaling and T Cell Suppression in BCG Infected Murine Monocytic Myeloid-Derived Suppressor Cells. Front Immunol. 2019;10:2826. doi:10.3389/fimmu.2019.02826
6. Ma J, Xu H, Wang S. Immunosuppressive Role of Myeloid-Derived Suppressor Cells and Therapeutic Targeting in Lung Cancer. J Immunol Res. 2018;2018:6319649. doi:10.1155/2018/6319649
7. Sun JP, Ge QX, Ren Z, Sun XF, Xie SP. MiR-6991-3p is identified as a novel suppressor in the expansion and activation of myeloid-derived suppressor cells in hepatoma-bearing mice. Onco Targets Ther. 2019;12:309–317. doi:10.2147/OTT.S185422
8. Deng Z, Rong Y, Teng Y, et al. Exosomes miR-126a released from MDSC induced by DOX treatment promotes lung metastasis. Oncogene. 2017;36(5):639–651. doi:10.1038/onc.2016.229
9. Cheng C, Zhang Z, Cheng F, Shao Z. Exosomal lncRNA RAMP2-AS1 Derived from Chondrosarcoma Cells Promotes Angiogenesis Through miR-2355-5p/VEGFR2 Axis. Onco Targets Ther. 2020;13:3291–3301. doi:10.2147/OTT.S244652
10. Vallabhajosyula P, Korutla L, Habertheuer A, et al. Tissue-specific exosome biomarkers for noninvasively monitoring immunologic rejection of transplanted tissue. J Clin Invest. 2017;127(4):1375–1391. doi:10.1172/JCI87993
11. Liu XL, Pan Q, Cao HX, et al. Lipotoxic Hepatocyte-Derived Exosomal MicroRNA 192-5p Activates Macrophages Through Rictor/Akt/Forkhead Box Transcription Factor O1 Signaling in Nonalcoholic Fatty Liver Disease. Hepatology. 2019;1:254.
12. Ho M, Chen T, Liu J, et al. Targeting histone deacetylase 3 (HDAC3) in the bone marrow microenvironment inhibits multiple myeloma proliferation by modulating exosomes and IL-6 trans-signaling. Leukemia. 2020;34(1):196–209. doi:10.1038/s41375-019-0493-x
13. Huang W, Yan Y, Liu Y, et al. Exosomes with low miR-34c-3p expression promote invasion and migration of non-small cell lung cancer by upregulating integrin alpha2beta1. Signal Transduct Target Ther. 2020;5(1):39. doi:10.1038/s41392-020-0133-y
14. Yuan M, Huang LL, Chen JH, Wu J, Xu Q. The emerging treatment landscape of targeted therapy in non-small-cell lung cancer. Signal Transduct Target Ther. 2019;4(1):61. doi:10.1038/s41392-019-0099-9
15. Jin YP, Hu YP, Wu XS, et al. miR-143-3p targeting of ITGA6 suppresses tumour growth and angiogenesis by downregulating PLGF expression via the PI3K/AKT pathway in gallbladder carcinoma. Cell Death Dis. 2018;9(2):182. doi:10.1038/s41419-017-0258-2
16. Wang H, Deng Q, Lv Z, et al. N6-methyladenosine induced miR-143-3p promotes the brain metastasis of lung cancer via regulation of VASH1. Mol Cancer. 2019;18(1):181. doi:10.1186/s12943-019-1108-x
17. Li GH, Yu JH, Yang B, Gong FC, Zhang KW. LncRNA LOXL1-AS1 inhibited cell proliferation, migration and invasion as well as induced apoptosis in breast cancer via regulating miR-143-3p. Eur Rev Med Pharmacol Sci. 2019;23(23):10400–10409. doi:10.26355/eurrev_201912_19679
18. Xie F, Li C, Zhang X, Peng W, Wen T. MiR-143-3p suppresses tumorigenesis in pancreatic ductal adenocarcinoma by targeting KRAS. Biomed Pharmacother. 2019;119:109424. doi:10.1016/j.biopha.2019.109424
19. Pinweha P, Phillips CA, Gregory PA, et al. MicroRNA-143-3p targets pyruvate carboxylase expression and controls proliferation and migration of MDA-MB-231cells. Arch Biochem Biophys. 2019;677:108169. doi:10.1016/j.abb.2019.108169
20. Baron BW, Pytel P. Expression Pattern of the BCL6 and ITM2B Proteins in Normal Human Brains and in Alzheimer Disease. Appl Immunohistochem Mol Morphol. 2017;25(7):489–496. doi:10.1097/PAI.0000000000000329
21. Willander H, Hermansson E, Johansson J, Presto J. BRICHOS domain associated with lung fibrosis, dementia and cancer–a chaperone that prevents amyloid fibril formation? FEBS J. 2011;278(20):3893–3904. doi:10.1111/j.1742-4658.2011.08209.x
22. He L, Liu X, Yang J, et al. Imbalance of the reciprocally inhibitory loop between the ubiquitin-specific protease USP43 and EGFR/PI3K/AKT drives breast carcinogenesis. Cell Res. 2018;28(9):934–951. doi:10.1038/s41422-018-0079-6
23. Robles AJ, Cai S, Cichewicz RH, Mooberry SL. Selective activity of deguelin identifies therapeutic targets for androgen receptor-positive breast cancer. Breast Cancer Res Treat. 2016;157(3):475–488. doi:10.1007/s10549-016-3841-9
24. Chen L, Brigstock DR. Integrins and heparan sulfate proteoglycans on hepatic stellate cells (HSC) are novel receptors for HSC-derived exosomes. FEBS Lett. 2016;590(23):4263–4274. doi:10.1002/1873-3468.12448
25. Mirza AH, Kaur S, Nielsen LB, et al. Breast Milk-Derived Extracellular Vesicles Enriched in Exosomes From Mothers With Type 1 Diabetes Contain Aberrant Levels of microRNAs. Front Immunol. 2019;10:2543. doi:10.3389/fimmu.2019.02543
26. Li G, Wu X, Qian W, et al. CCAR1 5ʹ UTR as a natural miRancer of miR-1254 overrides tamoxifen resistance. Cell Res. 2016;26(6):655–673. doi:10.1038/cr.2016.32
27. Fang W, Ma Y, Yin JC, et al. Comprehensive Genomic Profiling Identifies Novel Genetic Predictors of Response to Anti-PD-(L)1 Therapies in Non-Small Cell Lung Cancer. Clin Cancer Res. 2019;25(16):5015–5026. doi:10.1158/1078-0432.CCR-19-0585
28. Mu XY, Wang RJ, Yao ZX, et al. RS 504393 inhibits M-MDSCs recruiting in immune microenvironment of bladder cancer after gemcitabine treatment. Mol Immunol. 2019;109:140–148. doi:10.1016/j.molimm.2019.02.014
29. Paggetti J, Haderk F, Seiffert M, et al. Exosomes released by chronic lymphocytic leukemia cells induce the transition of stromal cells into cancer-associated fibroblasts. Blood. 2015;126(9):1106–1117. doi:10.1182/blood-2014-12-618025
30. Wallace JA, O’Connell RM. MicroRNAs and acute myeloid leukemia: therapeutic implications and emerging concepts. Blood. 2017;130(11):1290–1301. doi:10.1182/blood-2016-10-697698
31. Zhang X, Hubal MJ, Kraus VB. Immune cell extracellular vesicles and their mitochondrial content decline with ageing. Immun Ageing. 2020;17(1):1. doi:10.1186/s12979-019-0172-9
32. Nie H, Xie X, Zhang D, et al. Use of lung-specific exosomes for miRNA-126 delivery in non-small cell lung cancer. Nanoscale. 2020;12(2):877–887. doi:10.1039/C9NR09011H
33. Wu K, Mu XY, Jiang JT, et al. miRNA26a5p and miR26b5p inhibit the proliferation of bladder cancer cells by regulating PDCD10. Oncol Rep. 2018;40(6):3523–3532. doi:10.3892/or.2018.6734
34. Christie D, Zhu J. Transcriptional regulatory networks for CD4 T cell differentiation. Curr Top Microbiol Immunol. 2014;381:125–172. doi:10.1007/82_2014_372
 © 2020 The Author(s). This work is published and licensed by Dove Medical Press Limited. The full terms of this license are available at https://www.dovepress.com/terms.php and incorporate the Creative Commons Attribution - Non Commercial (unported, v3.0) License.
By accessing the work you hereby accept the Terms. Non-commercial uses of the work are permitted without any further permission from Dove Medical Press Limited, provided the work is properly attributed. For permission for commercial use of this work, please see paragraphs 4.2 and 5 of our Terms.
© 2020 The Author(s). This work is published and licensed by Dove Medical Press Limited. The full terms of this license are available at https://www.dovepress.com/terms.php and incorporate the Creative Commons Attribution - Non Commercial (unported, v3.0) License.
By accessing the work you hereby accept the Terms. Non-commercial uses of the work are permitted without any further permission from Dove Medical Press Limited, provided the work is properly attributed. For permission for commercial use of this work, please see paragraphs 4.2 and 5 of our Terms.