")
Back to Journals » Risk Management and Healthcare Policy » Volume 13
Future Patient Incidence in Hemato-Oncology: A Study Using Data from Cancer Registries in Japan
Authors Narimatsu H , Sakaguchi M, Nakamura S , Katayama K
Received 20 August 2020
Accepted for publication 17 October 2020
Published 3 November 2020 Volume 2020:13 Pages 2407—2414
DOI https://doi.org/10.2147/RMHP.S277207
Checked for plagiarism Yes
Review by Single anonymous peer review
Peer reviewer comments 2
Editor who approved publication: Professor Marco Carotenuto
Hiroto Narimatsu,1,2 Masahiko Sakaguchi,1 Sho Nakamura,1,2 Kayoko Katayama1
1Cancer Prevention & Control Division, Kanagawa Cancer Center Research Institute, Yokohama 241-8515, Japan; 2Graduate School of Health Innovation, Kanagawa University of Human Services, Kawasaki, Kanagawa 210-0821, Japan
Correspondence: Hiroto Narimatsu
Kanagawa Cancer Center Research Institute, 2-3-2 Nakao Asahi-ku, Yokohama 241-8515, Japan
Tel +81-45-520-2222 Ext 4022
Fax +81-45-520-2216
Email [email protected]
Purpose: The distribution of patients with hematological malignancies is expected to change markedly in the future due to aging of the Japanese population. We assessed the expected incidence rates of leukemia, malignant lymphoma, and multiple myeloma using national population estimates and data from the Kanagawa Cancer Registry.
Patients and Methods: To evaluate the effects of community aging, we compared expected future incidences of hematological malignancies in Kanagawa with other three areas, namely the Yamagata, Osaka, and Nagasaki prefectures, which have different populations and predicted aging rates.
Results: The total number of patients newly diagnosed with hematological malignancy in Kanagawa in 2010 was 1970. This was predicted to increase to 2581 by 2025 and to 2712 by 2040. Trends were very similar for all three hematological malignancies. These incidence rates were predicted to increase continuously in patients aged ≥ 65 years from 2010 to 2040, with a 169% increase in leukemia, a 167% increase in malignant lymphoma, and a 169% increase in multiple myeloma. A continuous increase in the population aged ≥ 65 years was also noted in the other three prefectures.
Conclusion: The distribution demographic of patients with hematological malignancies is expected to change in the future as the number of elderly patients increases.
Keywords: leukemia, myeloma, lymphoma, aging, hematopoietic stem cell transplantation
Introduction
Japan is quickly developing an aging society, as are various other countries.1 Advancing age is the most important risk factor for cancer,2 and therefore, the number of cancer patients will rapidly increase in the future. Future predictions using simulation models have been conducted worldwide.3–10 We recently predicted the future incidence of breast cancer11 using data from the Kanagawa Cancer Registry,12 2010 census population data from the National Census, and estimated data for future populations up to 2040 from the National Institute of Population and Social Security Research.2 We demonstrated that the future distribution of patients with breast cancer will drastically change, with the increasing number of elderly patients in urban areas. Kanagawa is the one of the biggest prefectures in Japan, which in 2010 had a population of 9,048,331 people. Thus, this prediction may be applied to many areas in Japan, and this change in distribution will induce a major shift in the demand for and supply of cancer medicine. These findings therefore suggest a great impact upon medical providers in the near future.
Predicting the future incidence of hematological malignancies is significant because treatment options differ according to the type of malignancy, and the intensity of treatment is usually determined according to the patient’s age. Highly intensive treatments require numerous medical resources, providers, and equipment types. Consequently, advance knowledge of which age groups and diseases are expected to increase in the future would be valuable for determining the required medical resources in the given geographies.
In this study, we investigated the future incidence of hematological diseases in Kanagawa and three other areas of Japan, viz., the Yamagata, Osaka, and Nagasaki prefectures, which have different demographic characteristics.
Patients and Methods
Data Collection
We conducted our analyses using a “simple model” (the mechanism of which we will explain further on), and an age-period-cohort model using the Nordpred package, which we also used in our previous study on breast cancer prediction.11 Although the age-period-cohort model considers the effects of these three factors,13 in this study, the period and cohort effects were probably overestimated.11 In the cancer registries, the number of recorded cancer cases have appeared to increase due to the recent availability of more complete data; for example, the rate of “death certificate only” (DCO) cases in the Kanagawa Cancer Registry in 1990 was 33%, which improved to 18.2% in 2010, when the data collection criteria widened. Therefore, we also used the simple 2010 model to evaluate the age effect in order to assess the validity of both models. Additionally, the Nordpred package does not provide a function for calculating confidence intervals; therefore, we utilized both models to afford greater accuracy to our findings.
Our data collection methods have been described elsewhere.11 Briefly, we used the population-based cancer registry data for the Kanagawa prefecture (known as the Kanagawa Cancer Registry). Data were fully anonymized prior to our access. As in our previous study,11 we used the observed data from 1995, 2000, 2005, and 2010. In 2010, the population of the Kanagawa prefecture was 9,048,331 people, and only Tokyo had a large population in Japan. All data from the Kanagawa Cancer Registry were retrieved from the database after obtaining permission from the Kanagawa prefecture in April 2016. The completeness of cancer registries was evaluated according to DCO, death certificate notification, and mortality/incidence ratios. This information is available on the National Cancer Center Japan website (https://ganjoho.jp/reg_stat/statistics/dl/statistics_p00.html).
Results are presented for the following cancer types, as defined by the International Classification of Diseases (10th edition): Hodgkin lymphoma (C81), follicular lymphoma (C82), non-follicular lymphoma (C83), mature T/natural killer-cell lymphomas (C84), other specified and unspecified types of non-Hodgkin lymphoma (C85), malignant immunoproliferative diseases and certain other B-cell lymphomas (C88), multiple myeloma and malignant plasma cell neoplasms (C90), lymphoid leukemia (C91), myeloid leukemia (C92), monocytic leukemia (C93), other leukemias of specified cell type (C94), leukemia of unspecified cell type (C95), and other and unspecified malignant neoplasms of lymphoid and hematopoietic and related tissue (C96). Leukemia, malignant lymphoma, and multiple myeloma included codes C91–C95, C81–C85 and C96, and C88 and C90, respectively.
To estimate the expected incidence of cancer for the years 2015, 2020, 2025, 2030, and 2035, we used three databases. Data regarding newly diagnosed patients with hematological malignancy classified by sex and 16 age (at 5-year intervals up to 79 years and >85 years old) were retrieved from the Kanagawa Cancer Registry. Population data for 1995, 2000, 2005, and 2010 were retrieved from the National Census. Estimated data for 2015, 2020, 2025, 2030, and 2035 populations were retrieved from the National Institute of Population and Social Security Research.14 Patients with hematological malignancy identified by DCO were excluded from the study because detailed information, such as incidence data and diagnosis date, was not obtained for these patients (Figure 1).
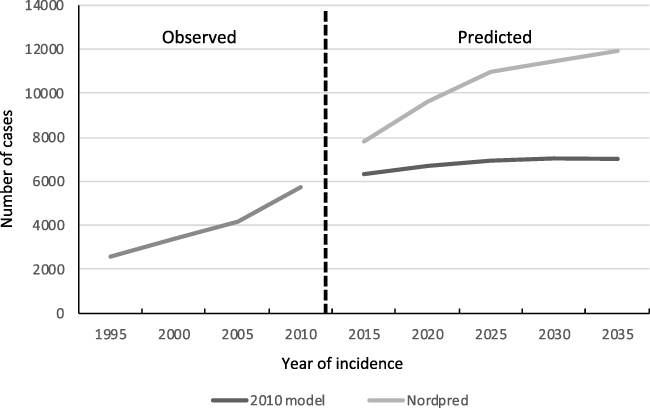 |
Figure 1 Predicted incidence of hematological malignancy in the Yamagata, Kanagawa, Osaka, and Nagasaki prefectures of Japan. The observed (1995–2010) and predicted (2015–2035) total incidences of hematological malignancy. The incidences were determined using the simple 2010 model and the Nordpred model. |
To compare the predicted values in Kanagawa with other areas in Japan with different geographic and demographic characteristics, including the rate of aging, we also used data from population-based cancer registries for the Yamagata, Osaka, and Nagasaki prefectures, with permission from each of these prefectures. The total populations of these prefectures, with populations of individuals aged ≥65 years (%) expressed in brackets, were estimated to be 1,168,924 (321,722 [27.6%]) for Yamagata; 9,048,331 (1,819,503 [20.2%]) for Kanagawa; 8,865,245 (1,962,748 [22.4%]) for Osaka; and 1,426,779 (369,290 [26.0%]) for Nagasaki.15 The projected rates of the population of individuals aged ≥65 years for 2035 were 37.8%, 31.7%, 32.7%, and 37.7%, in the Yamagata, Kanagawa, Osaka, and Nagasaki prefectures, respectively. Age distribution data without standardization were used for analyses.
This study was approved by the Institutional Review Board of Kanagawa Cancer Center (28-Epidemiology-101).
Data Analysis
Data analysis was conducted as previously described.11 Briefly, future estimates of the incidence rates of hematological malignancies were calculated by multiplying the 2010 incidence rates according to sex and the 16 age groups by the future populations according to sex and the 16 age groups. For example, the predicted incidence of hematological malignancies was calculated as follows:
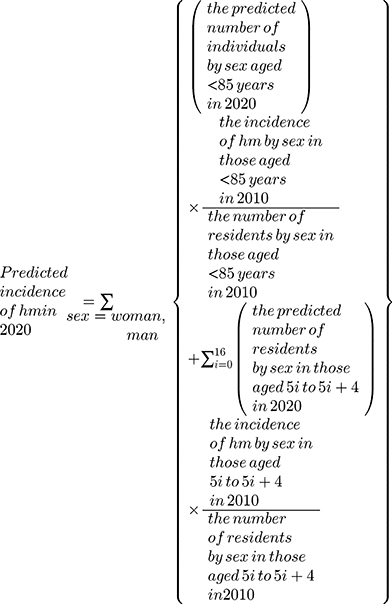
where hm represents hematological malignancies and 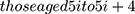 represents a 5-year interval. We refer to this as the “simple 2010 model.” We also used the Nordpred software package to perform sensitivity analysis. Nordpred is R-based software developed by the Cancer Registry of Norway, and uses an age-period-cohort model with Poisson regression:

where g is a link function and  ,
,  ,
,  , and are defined as the incidence rates in the age group
  and in the period p, common linear drift parameter, age component of the age group a, non-linear period component of the period p, and non-linear cohort component of the cohort c, respectively. We used two link functions: the exponential function, and for better predictions to level off the exponential growth, the power 5 function, ie,
  by Moller et al.16
Results
Estimation of Future Incidence
Trends for all three hematological malignancies in the Yamagata, Kanagawa, Osaka, and Nagasaki prefectures are shown in Figure 1. The total number of patients newly diagnosed with hematological malignancy in Kanagawa in 2010 was 1970, comprising 547 with leukemia, 1168 with malignant lymphoma, and 255 with multiple myeloma. The total number of patients newly diagnosed with hematological malignancy was predicted to increase to 2581 by 2025 and to 2712 by 2040. Trends were similar for all three hematological malignancies (Figure 2).
 |
Figure 2 Predicted incidence of leukemia, malignant lymphoma, multiple myeloma, and leukemia in the Kanagawa prefecture, Japan. The observed (1995–2010) and predicted (2015–2035) incidences of malignant lymphoma, multiple myeloma, and leukemia. The incidences were determined using the simple 2010 model. |
In the simple 2010 model, the incidence by age groups according to diseases, including malignant lymphoma, multiple myeloma, and leukemia, are shown in Table 1. The proportional incidence rates of the three hematological malignancies were predicted to increase continuously in patients aged ≥65 years, with a 169% increase for leukemia, a 167% increase for malignant lymphoma, and a 169% increase for multiple myeloma from 2010 to 2040 (Table 1). In the group of patients aged <65 years, incidence rates of these hematological malignancies were predicted to decrease (Table 1). The Nordpred-based sensitivity analysis predicted a similar trend in both groups, for people aged <65 years and those aged ≥65 years (Figure 3).
 |
Table 1 Future Estimated Values Using 2010 Model |
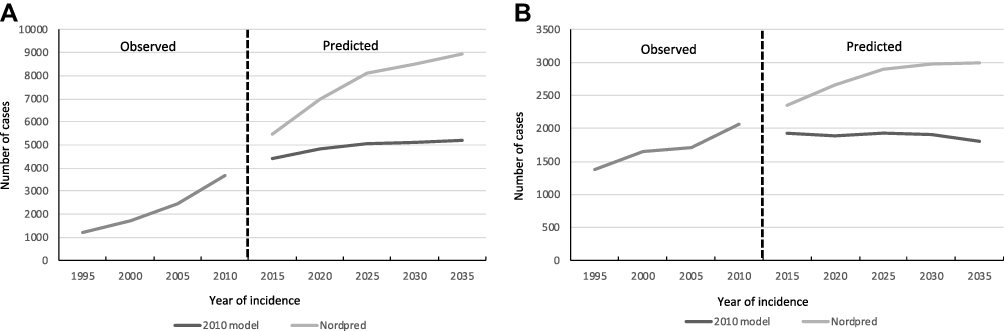 |
Figure 3 Predicted incidence of hematological malignancy according to the age groups in the Kanagawa prefecture, Japan. The observed (1995–2010) and predicted (2015–2035) total incidences of hematological malignancy in the people aged ≥65 years (A) and those aged <65 years (B). The incidences were determined using the simple 2010 model and the Nordpred model. |
Comparison with the Other Prefectures
To evaluate the effect of community aging, we compared the predicted future incidences of hematologic malignancies in Kanagawa with those in the other three selected study areas with different populations and predicted aging rates. As the simple 2010 model demonstrates in Figure 4, continuous increase in incidences of patients aged ≥65 years in the other three prefectures was predicted. A higher rate of increase of patients aged ≥65 years was noted in the Kanagawa and Osaka prefectures, which have larger populations and lower aging rates compared with the Yamagata and Nagasaki prefectures, which have smaller populations and higher aging rates. The Nordpred-based sensitivity analysis predicted a similar trend, with the exception of Yamagata, where an extreme increase was predicted (Figure 4).
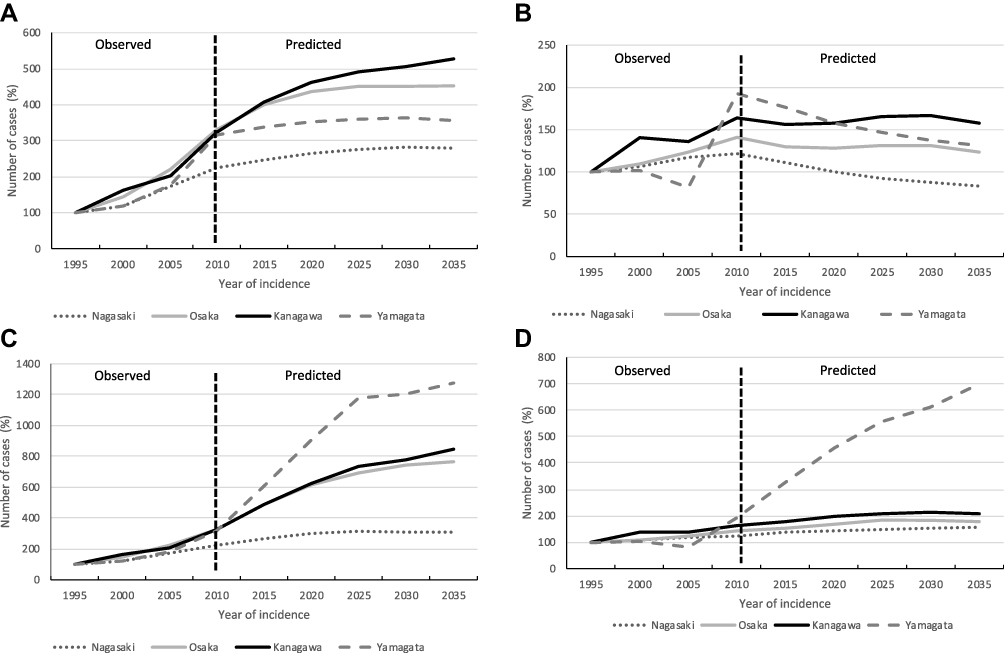 |
Figure 4 Predicted incidence of hematological malignancy in four prefectures in Japan. The observed (1995–2010) and predicted (2015–2035) total incidences of hematological malignancy are shown; (A) incidences using the simple 2010 model in people aged ≥65 years, (B) using the simple 2010 model in people aged <65 years, (C) using the Nordpred model in people aged ≥65 years, and (D) using the Nordpred model in people aged <65 years. |
Discussion
The results of this study predict that the numbers of elderly patients with hematological malignancies will increase and indicate that the distribution of patients will change in the future. This prediction may have a significant impact on future healthcare plans with regard to hematological malignancies.
We found that future incidence rates of hematological malignancies are expected to change. In this study, the number of patients with cancer onset aged ≥65 years is predicted to increase continuously until 2040 (Figure 3), whereas in patients aged <65 years, it is predicted to decrease (simple 2010 model) or increase very little (Nordpred model) (Figure 4). The number of patients aged <65 years would extensively increase in Yamagata (Figure 4D). The transient increase from 2005 to 2010 was probably overestimated for the prediction after 2010. This indicates that predictions using the Nordpred model should be carefully interpreted when a transient increase or decrease is observed before the initial year of the predication due to overestimation.
This change is almost consistent with our future prediction for patients with breast cancer,11 in which the aging “baby boom” generation (which includes individuals born during the first baby boom [1947–1949] after World War II) likely had a marked effect on the change in the distribution of patients. This group is a dominant demographic of the Japanese population, and the total number of baby boomers is estimated to be approximately 8,060,000.17
The predictions from the current study indicate that the demand for high-intensity treatments, such as allogeneic hematopoietic stem cell transplantation,18 will decrease. The number of patients with leukemia aged <40 years, who are candidates for myeloablative transplantation, will decrease to 67% (76/113, simple 2010 model) from 2010 to 2040 (Table 1). The number of patients with leukemia aged <60 years, who are candidates for non-myeloablative transplantation, will decrease to 78% (177/227, simple 2010 model) (Table 1). Similarly, the number of candidates for autologous hematopoietic transplantation with malignant lymphoma and multiple myeloma will decrease. In contrast, the number of patients aged ≥65 years is expected to increase for all three diseases. In terms of therapeutic strategy for these patients, maintaining quality of life is often emphasized.19 Therefore, in the near future, the role of intensive curative treatment will be lower and that of treatment focused on maintaining patients’ quality of life will be higher. As the number of elderly patients with cancer continues to grow, clinicians are increasingly recognizing the necessity of performing clinical trials for this patient population. Clinical trials in geriatric hemato-oncology with endpoints for quality of life are needed.20 Similarly, developing curative treatment with low intensity would be needed. Recent widespread hematopoietic stem cell transplantations, which usually use reduced intensity conditioning regimens, will be of significant importance in elderly care going forward.
The continuous future increase of patients aged ≥65 years is also predicted in the other prefectures with different population sizes and aging rates. Although data from the nationwide cancer database are not yet available for Japan, as it was founded only recently,21 the same future trends were predicted in the groups with larger populations and lower aging rates, namely the Kanagawa and Osaka prefectures, as in the groups with smaller populations and higher aging rates, viz., the Yamagata and Nagasaki prefectures, indicating that this trend may be common to all of Japan’s prefectures. Interestingly, the speed of increase differed, with a more rapid increase noted in metropolitan areas (namely the Kanagawa and Osaka prefectures) than in provincial areas, which is consistent with the findings of our previous study on breast cancer.11 This indicates that a better supply of medical resources, especially those catering to elderly patients, will be needed in these metropolitan areas. It should be noted that sensitivity analysis using Nordpred demonstrated extreme future increase in patients aged ≥65 years, though this may be due to an overestimation of the transient patient increase from 2005 to 2010 in Yamagata.
Although this study provided important information regarding future perspectives on hematological malignancies, one issue remains to be discussed. To estimate the future incidence according to each medical region, we multiplied the incidence rate for 2010 by the population. This estimation method, using the incidence data for a single year, can be applied to other municipalities, as our calculation did not consider the historical data of cancer incidence; however, unlike other methods, the impact of the cohort effect cannot be considered. As per the epidemiologic definition, a cohort effect occurs when different distributions of disease arise from a changing or new environmental cause that affects age groups in a different manner. Thus, a cohort effect is conceptualized as a period effect that is differentially experienced through age-specific exposure or susceptibility to said event or cause (eg, interaction or effect modification).5,22 Only the effect of aging was considered in this study, yet this effect does not need to be considered in the prediction of hematological malignancies. Risk factors are unknown for most hematological diseases, as are effective prevention methods. Factors, except for age, may therefore be neglected or disregarded. To reduce the prospect of erroneous predictions as a result of inherently large random variation due to small numbers, models in Nordpred need at least 100 patients with cancer (all ages) per every 5-year period.23 The numbers for leukemia, malignant lymphoma, and multiple myeloma in the Kanagawa Cancer Registry were not numerically strong. We therefore conducted the same evaluation and prediction using data from the other three prefectures to assess the results for the Kanagawa prefecture. In Japan, the nationwide cancer registry has recently been effected, and future estimations using large datasets from this resource are warranted.
Conclusion
In summary, the distribution of patients with hematological malignancies will change in the future: the number of elderly patients will increase, and the number of patients living in urban areas will increase. This prediction is likely to have a great impact on future healthcare plans.
Acknowledgments
The authors would like to thank the staff members and registrars at the Kanagawa Cancer Center and the Population-Based Cancer Registry Office who were involved in the maintenance of the Kanagawa Cancer Registry, Yamagata Cancer Registry, Nagasaki Cancer Registry, and Osaka Cancer Registry. We would like to thank Editage for English language editing.
Funding
No funding was received for this study.
Disclosure
Dr. Hiroto Narimatsu received research fund from Chugai Pharmaceutical Co., LTD. This funder had no role in study design, data collection and analysis, decision to publish, or preparation of the manuscript. The authors report no other conflicts of interest in this work.
References
1. Annual report on the aging society: 2014 (Summary). [Home Page on the Internet]. Available from: http://www8.cao.go.jp/kourei/english/annualreport/2014/2014pdf_e.html.
2. Cancer statics in Japan 2014 (in Japanese). [Home Page on the Internet]. Available from: http://ganjoho.jp/reg_stat/statistics/brochure/backnumber/2014_jp.html.
3. Petrick JL, Kelly SP, Altekruse SF, McGlynn KA, Rosenberg PS. Future of hepatocellular carcinoma incidence in the United States forecast through 2030. J Clin Oncol. 2016;34(15):1787–1794. doi:10.1200/JCO.2015.64.7412
4. Rahib L, Smith BD, Aizenberg R, Rosenzweig AB, Fleshman JM, Matrisian LM. Projecting cancer incidence and deaths to 2030: the unexpected burden of thyroid, liver, and pancreas cancers in the United States. Cancer Res. 2014;74(11):2913–2921. doi:10.1158/0008-5472.CAN-14-0155
5. Bray F, Moller B. Predicting the future burden of cancer. Nat Rev Cancer. 2006;6(1):63–74. doi:10.1038/nrc1781
6. Rapiti E, Guarnori S, Pastoors B, Miralbell R, Usel M. Planning for the future: cancer incidence projections in Switzerland up to 2019. BMC Public Health. 2014;14:102. doi:10.1186/1471-2458-14-102
7. Coupland VH, Okello C, Davies EA, Bray F, Moller H. The future burden of cancer in London compared with England. J Public Health (Oxf). 2010;32(1):83–89. doi:10.1093/pubmed/fdp082
8. Virani S, Bilheem S, Chansaard W, et al. National and subnational population-based incidence of cancer in Thailand: assessing cancers with the highest burdens. Cancers (Basel). 2017;9(12):108. doi:10.3390/cancers9080108
9. Mistry M, Parkin DM, Ahmad AS, Sasieni P. Cancer incidence in the United Kingdom: projections to the year 2030. Br J Cancer. 2011;105(11):1795–1803. doi:10.1038/bjc.2011.430
10. Smittenaar CR, Petersen KA, Stewart K, Moitt N. Cancer incidence and mortality projections in the UK until 2035. Br J Cancer. 2016;115(9):1147–1155. doi:10.1038/bjc.2016.304
11. Katayama K, Narimatsu H. Prediction of female breast cancer incidence among the aging society in Kanagawa, Japan. PLoS One. 2016;11(8):e0159913. doi:10.1371/journal.pone.0159913
12. Kanagawa Prefecture. Annual report of Kanagawa cancer registry. Cancer Incidence in Kanagawa. 2015;38:65–114.
13. Clayton D, McKeigue PM. Epidemiological methods for studying genes and environmental factors in complex diseases. Lancet. 2001;358(9290):1356–1360. doi:10.1016/S0140-6736(01)06418-2
14. National Institute of Population and Social Security Research. Estimates of the nation’s population trends by region 2010–2040. [Home page on the internet]; 2013. Available from: http://www.ipss.go.jp/pp-shicyoson/j/shicyoson13/t-page.asp.
15. e-stat by Japanese Government (in Japanese). [Web page of the internet]. Available from: https://www.e-stat.go.jp/dbview?sid=0000010101.
16. Moller B, Fekjaer H, Hakulinen T, et al. Prediction of cancer incidence in the Nordic countries up to the year 2020. Eur J Cancer Prev. 2002;11(Suppl 1):S1–S96.
17. Ministry of Health, Labour and Welfare of Japan. Annual Health, Labour and Welfare Report 2010–2011 (Summary). White Papers & Reports; 2011. Available from: http://www.mhlw.go.jp/english/wp/wp-hw5/dl/summary.pdf.
18. Gadi KV, Nash RA. Hematopoietic stem cell transplantation. In: Greer PJ, Foerster J, Rodgers MG, editors. Wintrobe’s Clinical Hematology. Philadelphia: Lippincott Williams & Wilkins; 2009:722–748.
19. Epstein AS, Goldberg GR, Meier DE. Palliative care and hematologic oncology: the promise of collaboration. Blood Rev. 2012;26(6):233–239. doi:10.1016/j.blre.2012.07.001
20. Bluethmann SM, Mariotto AB, Rowland JH. Anticipating the “Silver Tsunami”: prevalence trajectories and comorbidity burden among older cancer survivors in the United States. Cancer Epidemiol Biomarkers Prev. 2016;25(7):1029–1036. doi:10.1158/1055-9965.EPI-16-0133
21. National cancer registry in Japan (in Japanese). Available from: https://ganjoho.jp/reg_stat/can_reg/national/public/about.html.
22. Keyes KM, Utz RL, Robinson W, Li G. What is a cohort effect? Comparison of three statistical methods for modeling cohort effects in obesity prevalence in the United States, 1971–2006. Soc Sci Med. 2010;70(7):1100–1108. doi:10.1016/j.socscimed.2009.12.018
23. Ferlay J, Steliarova-Foucher E, Lortet-Tieulent J, et al. Cancer incidence and mortality patterns in Europe: estimates for 40 countries in 2012. Eur J Cancer. 2013;49(6):1374–1403. doi:10.1016/j.ejca.2012.12.027
 © 2020 The Author(s). This work is published and licensed by Dove Medical Press Limited. The full terms of this license are available at https://www.dovepress.com/terms.php and incorporate the Creative Commons Attribution - Non Commercial (unported, v3.0) License.
By accessing the work you hereby accept the Terms. Non-commercial uses of the work are permitted without any further permission from Dove Medical Press Limited, provided the work is properly attributed. For permission for commercial use of this work, please see paragraphs 4.2 and 5 of our Terms.
© 2020 The Author(s). This work is published and licensed by Dove Medical Press Limited. The full terms of this license are available at https://www.dovepress.com/terms.php and incorporate the Creative Commons Attribution - Non Commercial (unported, v3.0) License.
By accessing the work you hereby accept the Terms. Non-commercial uses of the work are permitted without any further permission from Dove Medical Press Limited, provided the work is properly attributed. For permission for commercial use of this work, please see paragraphs 4.2 and 5 of our Terms.