")
Back to Journals » Nature and Science of Sleep » Volume 14
Fusion of Whole Night Features and Desaturation Segments Combined with Feature Extraction for Event-Level Screening of Sleep-Disordered Breathing
Authors Liu R , Li C, Xu H, Wu K, Li X , Liu Y , Yuan J, Meng L, Zou J, Huang W , Yi H , Sheng B, Guan J, Yin S
Received 22 December 2021
Accepted for publication 3 May 2022
Published 17 May 2022 Volume 2022:14 Pages 927—940
DOI https://doi.org/10.2147/NSS.S355369
Checked for plagiarism Yes
Review by Single anonymous peer review
Peer reviewer comments 3
Editor who approved publication: Professor Ahmed BaHammam
Ruhan Liu,1,2,* Chenyang Li,1,* Huajun Xu,1 Kejia Wu,1 Xinyi Li,1 Yupu Liu,1 Jie Yuan,1 Lili Meng,1 Jianyin Zou,1 Weijun Huang,1 Hongliang Yi,1 Bin Sheng,2 Jian Guan,1 Shankai Yin1
1Department of Otolaryngology Head and Neck Surgery and Shanghai Key Laboratory of Sleep Disordered Breathing & Otolaryngological Institute of Shanghai Jiao Tong University, Shanghai Jiao Tong University Affiliated Sixth People’s Hospital, Shanghai, People’s Republic of China; 2Department of Computer Science and Engineering, Shanghai Jiao Tong University, Shanghai, People’s Republic of China
*These authors contributed equally to this work
Correspondence: Bin Sheng; Jian Guan, Tel +86 13124853285, Email [email protected]; [email protected]
Purpose: Misdiagnosis and missed diagnosis of sleep-disordered breathing (SDB) is common because polysomnography (PSG) is time-consuming, expensive, and uncomfortable. The use of recording methods based on the oxygen saturation (SpO2) signals detected by wearable devices is impractical and inaccurate for extracting signal features and detecting apnoeic events. We propose a method to automatically detect the apnoea-based SpO2 signal segments and compute the apnoea–hypopnea index (AHI) for SDB screening and grading.
Patients and Methods: First, apnoea-related desaturation segments in raw SpO2 signals were detected; global features were extracted from whole night signals. Then, the SpO2 signal segments and global features were fed into a bi-directional long short-term memory convolutional neural network model to identify apnoea-related and non-apnoea-related events. The apnoea-related segments were used to assess the AHI.
Results: The model was trained on 500 individuals and tested on 8131 individuals from two public hospitals and one private centre. In the testing data, the classification accuracy for apnoea-related segments was 84.3%. Individuals with SDB (AHI 15) were identified with a mean accuracy of 88.95%.
Conclusion: Using automatic SDB detection based on SpO2 signals can accurately screen for SDB.
Keywords: sleep apnea hypopnea syndrome, AHI, SDB severity classification, Bi-LSTM-CNN, desaturation events
Introduction
Sleep-disordered breathing (SDB) is characterized by multiple episodes of airflow reduction and cessation during sleep.1,2 SDB is a common sleep disorder with estimated prevalences of 49.7% and 23.4% in men and women, respectively.3 In the Wisconsin Sleep Cohort Study, the prevalences were 24% and 9% in men and women aged 30–60 years, respectively.1 However, many patients with SDB, including severe SDB, remain undiagnosed. In the Wisconsin Sleep Cohort Study, 93% and 82% of women and men with moderate-to-severe sleep apnoea, respectively, had not been diagnosed.2 In addition, according to a database study, over 90% of women and over 80% of men with SDB have not been diagnosed.4
Polysomnography (PSG), the “gold standard” investigation for SDB, is expensive and time-consuming, which may delay the diagnosis of SDB. Thus, home-based portable devices for sleep studies are essential to diagnose SDB. Moreover, home monitoring systems using oxygen saturation (SpO2) to screen for SDB increase the testing capacity and simplify the interpretation of prolonged recordings. Thus, the use of a simple device may ensure timely and accurate diagnosis of SDB.
An ideal system would make an accurate diagnosis on the basis of a few easy-to-collect signals. Many studies have addressed these issues by using signals from audio recordings,5 plethysmography,6 respiratory movements,7,8 oximetry,9–16 electrocardiogram (ECG),17 or a combination of such methods.18,19 The SpO2 signal can be easily collected, and a large number of wearable pulse oximetry devices are available in the market at a low cost.20–22 The SpO2 signal represents the oxyhaemoglobin concentration in blood. The apnoea–hypopnea index (AHI) score is associated with oxygen desaturation23; therefore, screening for SDB on the basis of the SpO2 signal is convenient and accurate, and also diagnosis for SDB with automatic detection assistance is potential.
The aim of our study was to establish a novel apnoea-related desaturation segments generation method to achieve variable length proposal; an efficient fusion method for the classification of apnoea-related desaturation using a combination of whole night features and desaturation segments; and an automatic feature extraction method to select effective global whole night features. Compared to previous studies in terms of complexity of model construction, our study does not use complex manual feature extraction and utilizes sufficiently powerful deep learning for feature extraction to reduce the complexity of construction. In addition, compared to the current method of direct fragment analysis by deep networks, we designed the overall night features with reference to the clinical medical process to improve the accuracy of the model.
Materials and Methods
The study was performed in accordance with the 1964 Helsinki declaration and its later amendments. Informed consent was obtained from all participants. The study protocol was approved by the Ethics Committee of Shanghai Jiao Tong University Affiliated Sixth People’s Hospital, China, under the identifier 2019-KY-050 (K).
PSG Assessment and SDB Classification
The physiological signals of PSG (eg, electroencephalogram, ECG, thoracic and abdominal movements, airflow, electrooculogram, electromyogram, and SpO2) were recorded to analyse the sleep architecture, duration, and quality during overnight PSG.24 The 2012 American Academy of Sleep Medicine criteria were used to diagnose apnoea events:25 peak signal excursion decrease by ≥90% of pre-event baseline using an oronasal thermal sensor (diagnostic study); and duration of drop in sensor signal ≥10s. Hypopnea was diagnosed if the peak signal excursions decreased by ≥30% of pre-event baseline using nasal pressure (diagnostic study); duration of drop in sensor signal ≥10s; and oxygen desaturation ≥3% from pre-event baseline or an arousal. The number of apnoea and hypopnea events in the whole night PSG was used to determine the SDB severity. The AHI score (total number of apnoea and hypopnea events divided by the hours asleep) was computed to classify the SDB severity into normal (0–5), mild (5–15), moderate (15–30), and severe (>30).26
Data Source
Three datasets were used for algorithm development and validation: Apnoea-ECG dataset (Physionet),27 SHHS,28 and No. 6 People’s Hospital (Shanghai Jiao Tong University Affiliated Sixth People’s Hospital). The SHHS dataset contained two datasets, SHHS1 and SHHS2, which were used as the training and testing sets, respectively (Table 1).
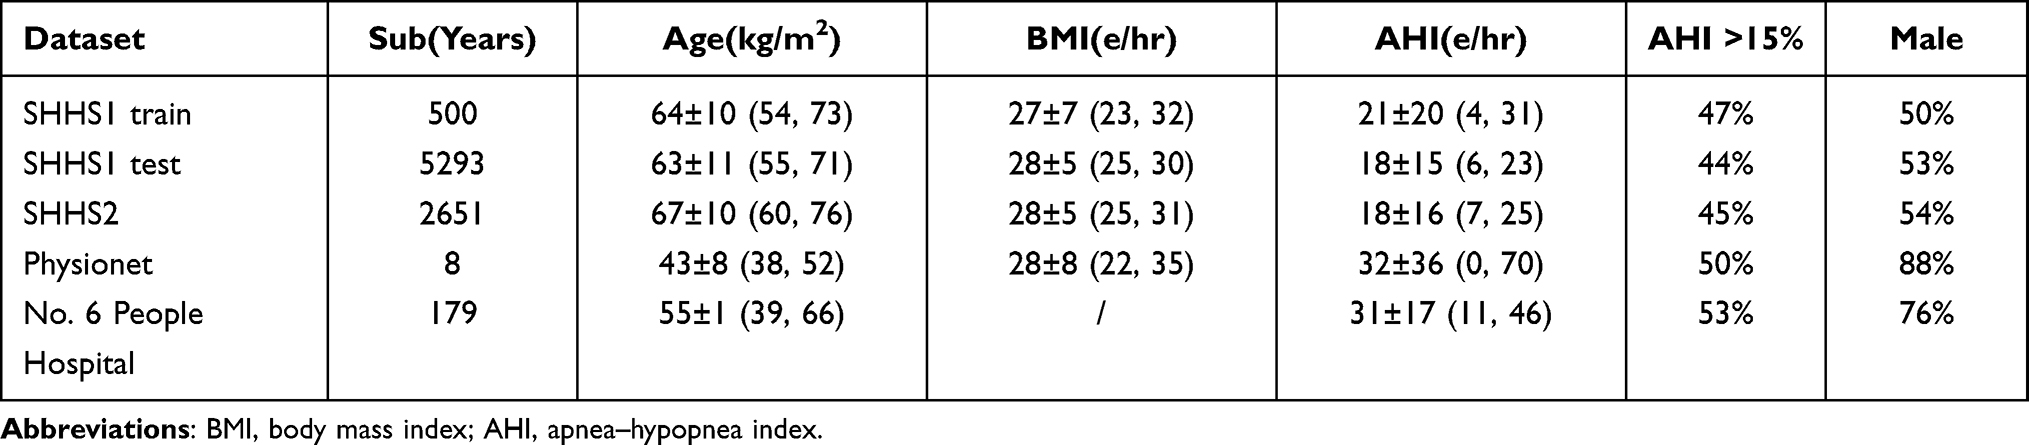 |
Table 1 Patient Characteristics for the Different Datasets Age, BMI and AHI are Presented as Mean ± Standard Deviation, with the 25% and 75% Quantile Values Underneath |
Apnoea-ECG (Physionet): The Apnoea-ECG (Physionet) database contains eight night-time records, including ECG, oxygen saturation levels, and three respiratory signals.27 The SpO2 sampling frequency was set at 100 Hz. The AHI scores and minute-level apnoea annotations are available for each 1-min interval. Four participants did not have SDB, whereas four participants had severe SDB.
SHHS (Sleep Heart Health Study): SHHS is a multi-centre cohort study of the cardiovascular and other consequences of SDB.28 SHHS contains two datasets with PSG results: SHHS1 contains data from 5793 participants tested between 1995 and 1998, whereas SHHS2 contains data from 2651 participants tested between January 2001 and June 2003. The SpO2 signal recording lengths were > 3 h. The SpO2 signals were recorded using Nonin XPOD 3011 sensor and sampled at 1 Hz. In accordance with the 2012 American Academy of Sleep Medicine guidelines, we rechecked the start and end times of apnoeic events in the SHHS training dataset.25 The SHHS training dataset contains 500 records selected from SHHS1 for algorithm training. Because rechecking records is complex and time-consuming, only 500 records were used for training. The remaining SHHS1 records were included in the SHHS1 test dataset. The SHHS training dataset was constructed using patients who had been randomly selected from the SHHS1 dataset to maintain similar proportions of men and women in apnoea severity categories.
No. 6 People’s Hospital: No. 6 People’s Hospital dataset contained 179 PSGs: 11 were normal, while 72, 49, and 47 had mild, moderate, and severe SDB, respectively. The dataset was collected from Shanghai Jiao Tong University Affiliated Sixth People’s Hospital. The dataset was scored in accordance with the 2012 American Academy of Sleep Medicine guidelines by sleep specialists.25 Alice 4, Alice 5, and Alice LE systems were used to score and store the SpO2 signals at sampling rates of 10 and 100 Hz.
Data Processing
The algorithm generated the apnoea-related SpO2 segment proposals. Then, the whole night features of SpO2 signals were extracted. The apnoea-related blood oxygen segments were classified using a bi-directional long short-term memory convolutional neural network (Bi-LSTM-CNN) model according to both whole night features and apnoea-related SpO2 segment proposals. Furthermore, the algorithm used a linear regressor to simulate the relationship of the apparent number of apnoeic events in the whole night SpO2 and the real number of apnoea events.
Before the preprocessing of the data, we took blood oxygen below 50% as artifacts for all data sets due to artifacts caused by the loss and interference of blood oxygen signals in the data set. Moreover, during processing, the signals at both ends of the artifacts were connected using linear interpolation to ensure the continuity of the signals.
Generation of SpO2 Desaturation Segment Proposals
Apnoeic events are often associated with a decrease in blood oxygen level (ie, desaturation). The numbers of apnoeic events were calculated by identifying the desaturation segments and identifying the apnoea-related segments. This process required the identification of all desaturation segments.
However, the noise and sampling roughness of raw SpO2 signals complicate the detection of desaturation segments. Therefore, a wavelet processing algorithm was selected for signal denoising and the identification of desaturation segments. First, denoising was performed by discarding the approximate coefficients of the wavelet Daubechies 8 decomposition. Then, threshold filtering and reconstruction were performed. Therefore, a 3-second moving average filter was applied as a smoothing method after signal denoising.29 Moreover, high sampling rates were resampled at 1 Hz to ensure standardisation and speed computations.29 Then, linear interpolations were used to replace the desaturation signals that decreased below 50% of the baseline. Figure 1 shows the signal after preprocessing. Preprocessing generated a smooth signal and simplified the identification of desaturation events.
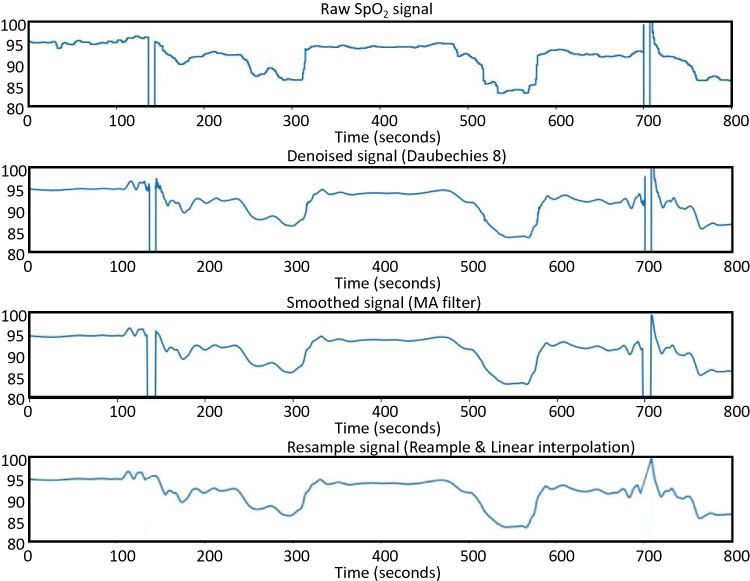 |
Figure 1 A portion of pluse oximetry signals under preprocesing. The four diagrams from top to bottom show four intermediate results of data preprocessing: Raw SpO2 signal, Denoised signal under Daubechies 8 wavelet transform, smoothed signal based on 3-seconds MA filter, and resampled signal after resampling and linear interpolation for SpO2 signal drop below 50%. |
After preprocessing, the signal data were used to generate the desaturation segments (Figure 2). First, the signal peaks and troughs were identified by derivative filtering to select the extremum points. To preserve the completeness of desaturation segments, successive desaturation segments were linked when the total length of the linked segments was <30 s. Furthermore, the start and end point pairs of a desaturation segment were extracted.12 Desaturation segments were identified by a decrease in SpO2 of at least 1% from the beginning to the end of a segment with a total segment length <120 s.29,30 Then, segments were generated from raw data using the start and end points of the segment. All desaturation segments possibly related to apnoea were identified. The generation of desaturation segment proposals is shown in Figure 2.
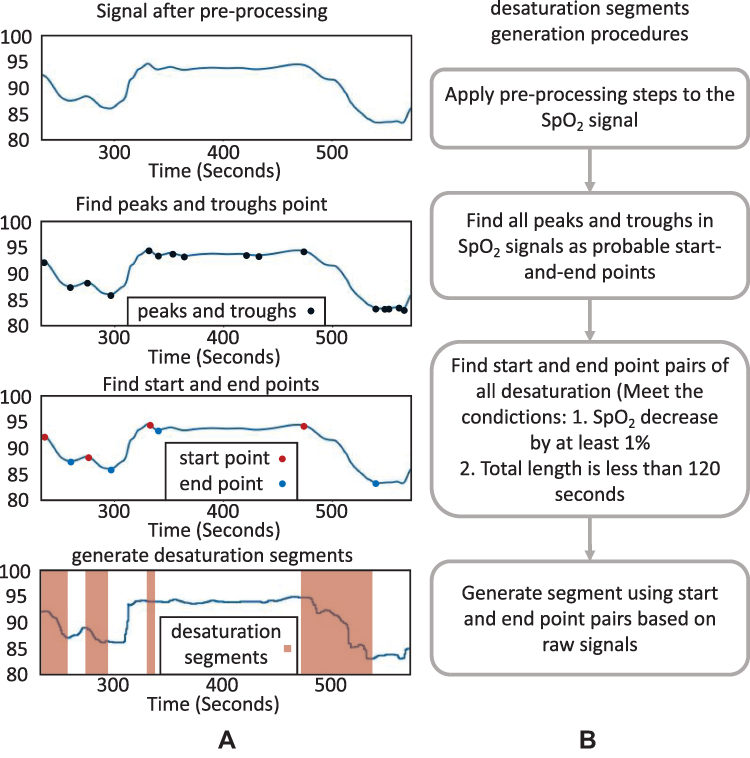 |
Figure 2 Overview of generation for desaturations segments in the SpO2 signal. (A). Graphical overview: on top the under preprocessing signal is plotted. Next, the peaks and troughs that are shown in dark blue dots of this handled signal is plotted. Moreover, the start and end point pairs is in red and blue colors relatively. On the bottom, the desaturation segments of the raw signal are detected. (B). Overview of desaturation segments generation procedures. |
Whole Night Feature Extraction
The whole night SpO2 signal can be characterised by specific features. Time and frequency domain features were extracted from the SpO2 signal to determine the signal properties. Table 2 shows 16 features obtained from the SpO2 signal that have been evaluated in previous studies of patients with obstructive sleep apnoea (OSA).31–35
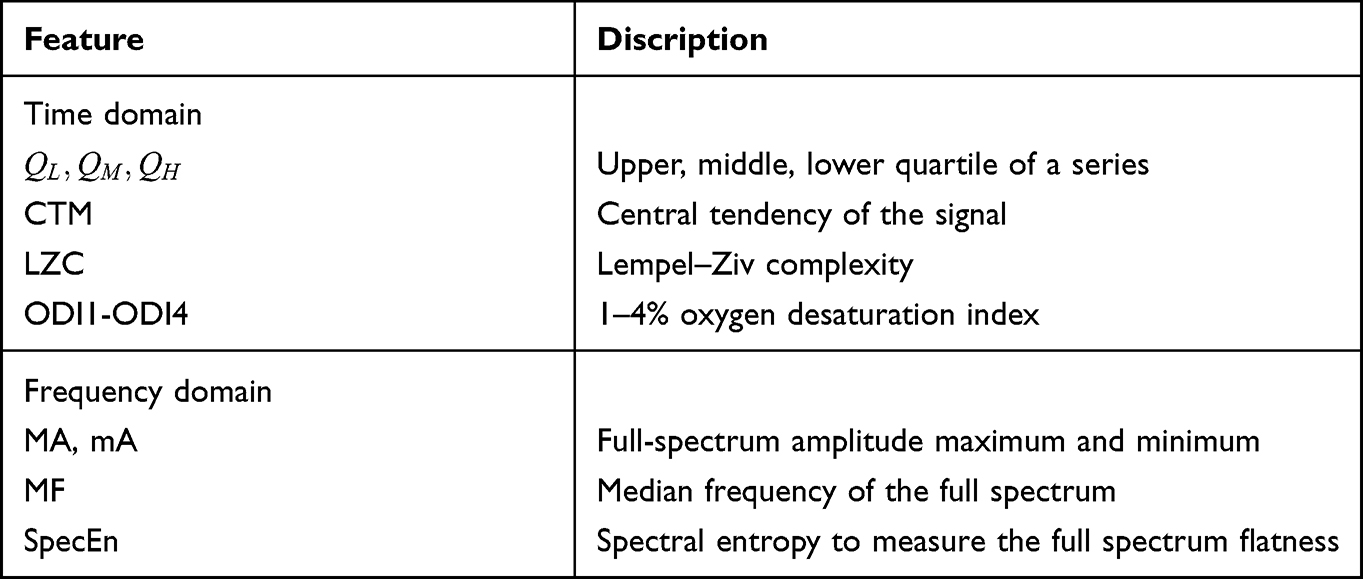 |
Table 2 Time and Frequency Domain Feature Extracted from Whole Night |

Bi-LSTM-CNN for SpO2 Segment Classification
To avoid complex manual feature extraction and ensure good performance of the classifier system, a state-of-the-art model, Convolutional Bidirectional Long Short-Term Memory (CBLSTM), was used for classification.36 This model contains four parts: a temporal encoder (bi-directional long short-term memory [Bi-LSTM]), a local feature extractor (convolutional neural networks [CNNs]), whole night feature fusion, and a connector and linear regressor (Figure 3).37
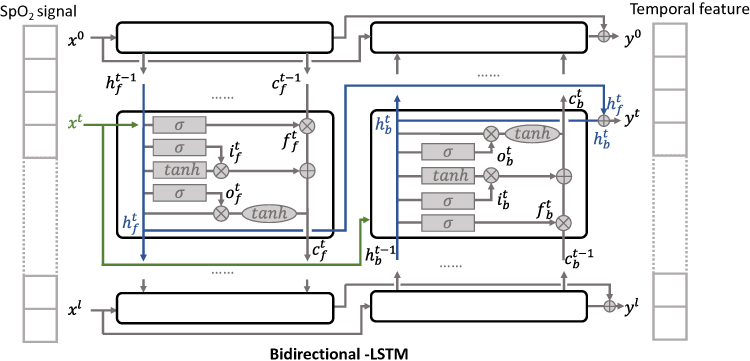 |
Figure 3 Framework of Bi-LSTM network for temporal information extraction. |
A Bi-LSTM network was used to manage the temporal information. Bi-LSTM network is an elegant solution to capture the bidirectional (ie, forward and backward) information.12 This model can access complete, sequential information before and after each time step in a specific sequence. In the present study, a well-known Bi-LSTM framework was used (Figure 3). In Bi-LSTM, at each time step  , forward hidden state
  and backward hidden state
  were updated using the current data
  from the same time step
  , the hidden state at the previous time step
  and
and  , the input gate
  and
and  , the forget gate
  and
and  , the output gate
  and
and  , and a memory cell
  and
and  . The following updating equations were used:
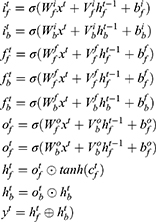
where  and
and  are the weight matrices for different gates for input
  and hidden state
  and
and  , while * is the element-wise multiplication,
  and
and  are the element-wise activation functions, and
  can be the dimension of the word vector or the size of the hidden state in the lower layer. The framework of this network is shown in Figure 4.
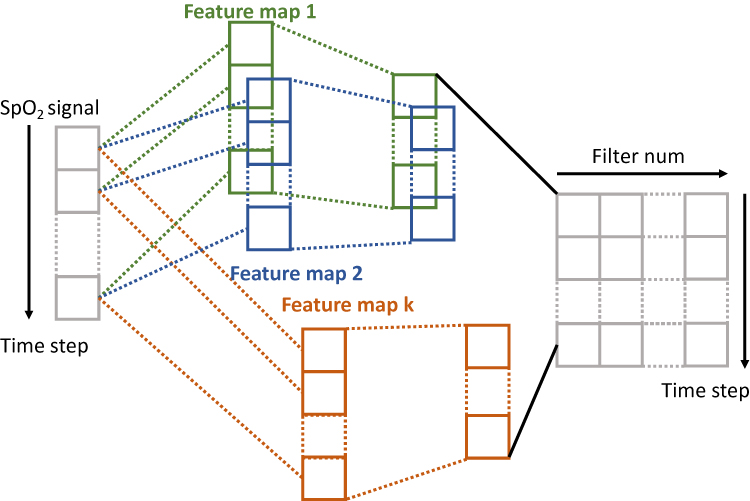 |
Figure 4 The structure of local extractor: Convolutional neural network for 1-D signals. |
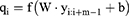
After Bi-LSTM network, the output of Bi-LSTM  is given by

where  represents a window of m continuous time steps beginning from the
  th time step. The CNN feature extractor contains two layers: convolutional and max pooling layers. The convolutional layer slides the filters over the whole input sequence to generate feature maps. Each feature map can be regarded as the convolutional activation of the corresponding filter over the whole sequence. A convolutional filter
  is used to obtain the feature map
  . The
. The  th element is calculated as

where  is the
  activation function,
  is the weight matrix of the convolution filter, is a bias,
  is the length of the filter, and
  is the dimension of the word vector. The convolutional layer uses multiple filters in parallel to obtain feature maps. It also can use convolutional filters of various lengths to extract feature information.
In addition, the pooling layer is applied to compress each generated feature map to produce significant features. The feature maps gained from the convolutional layer are shown below:
where index  denotes the
  th filter; it corresponds to multi-windows as
  . These windows are fed into the max-pooling layer to obtain the compressed feature vector, which can be calculated as
where  . Multiple filters are applied with different initialised weights to derive the output of the CNN layer. The framework of the CNN is displayed in Figure 5.
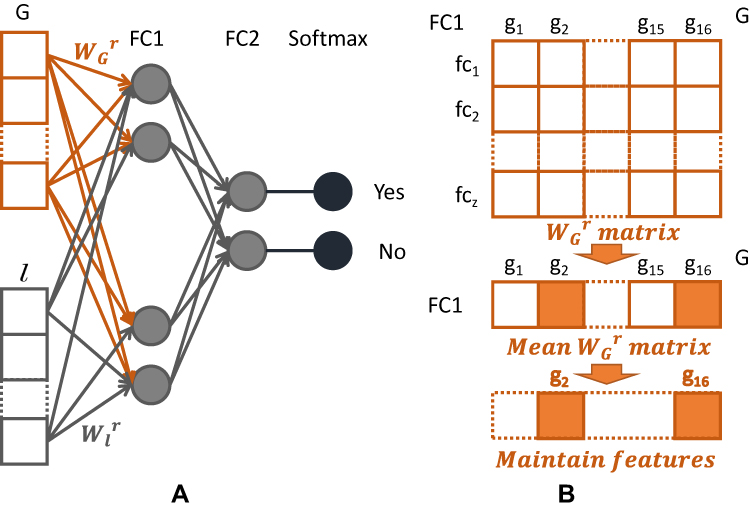 |
Figure 5 Structure of whole night feature infusion and selection. (A). Layers structure of whole night feature infusion. (B). Procedures in selecting whole night features. |
The output representation  of the local extractor represents related information concerning each desaturation segment. However, the severity of desaturation and disease may be helpful for the identification of desaturated fragments. Thus,
  , the whole night feature of
  extracted from full night PSG, is given as
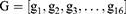
where  ,
,  ,
,  , …,
, …,  are time and frequency domain features of whole night signal extracted in the previous step. The whole night fusion feature
  combines features extracted from fragments and whole night features
  from overnight records. The feature
  is fed into a two-layer full connection layer to gain the prediction of the whole model, as shown in the following equations:
where  ,
,  , and
, and  . In addition,
  is the number of hidden states in the first layer of full connection layers and
  is the dimensionality of the output. Because the objective problem in our task is a bi-classification problem,
  . The structures of the two-layer full connection and softmax layers are shown in Figure 5A.
In this study, focal loss is used as a model loss between the predicted classification results and real class labels because of the uneven distributions of the two types of data38,39:
where  represents the real class label and
  represents the probability that the class of the output
  of the model is 1.
Whole Night Feature Selection
The weights of the fusion full connection layer for the 16 whole night features were used for feature selection. The gradient-weighted class activation mapping (Grad-CAM) method was used to create a weight map with higher-value weights. Low-value weights were considered redundant.40 The feature selection process is shown in Figure 5B.
Statistical Analysis of Classification
Accuracy, sensitivity, specificity, positive predictive value, area under the receiver operating characteristic curve, and Cohen’s kappa were used to analyse the classification performance.
AHI Estimation
The AHI was calculated using a linear regressor, which simulated the relationships between the predicted and real numbers of apnoea-related desaturation events. Moreover, the identified AHI was within the annotated range to avoid the influence of non-sleep time.
Experimental Setup
The dataset included data from 500 individuals, which were used for model training because of the complexity and time-consuming nature of extensive review for additional data. The original apnoeic events recorded by PSG were based on the respiratory signals. The apnoea event markers from the SHHS training dataset were manually converted to desaturation event markers. We performed two major experiments as part of this study. First, we used our method to test well-known datasets and compared the findings to the results of other methods in terms of recognition accuracy. Second, we analysed the fusion method using whole night features and desaturation segments.
Results
Comparison of Methods and Datasets
Segment Classification Performance
Table 3 shows the mean performance of segment classification for each dataset. The mean performance was 84.3% for the test set. The model was validated on the Physionet dataset with an accuracy of 94.5%, an improvement over the previous study (93.0%).40 Table 4 presents the performance indicators for the classification of desaturation events detected by the generation method using different classifiers. These indicators were averaged on all test datasets. As shown in Table 4, the accuracy of the Bi-LSTM-CNN classifier was superior to the accuracies of other classifiers for the complete training dataset. Therefore, only the Bi-LSTM-CNN classifier was used for subsequent experiments.
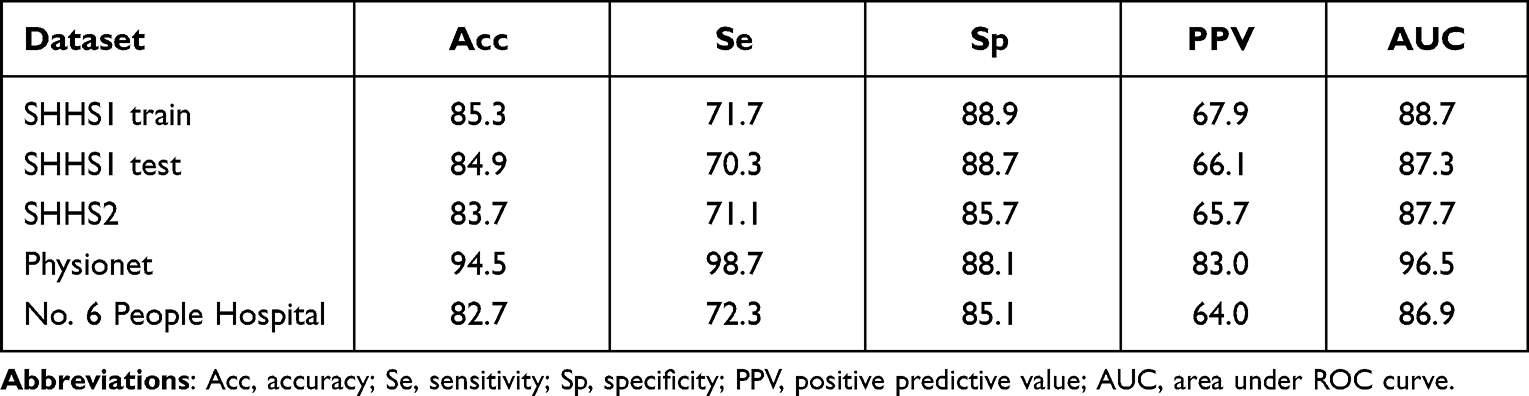 |
Table 3 Overview of the Averaged Classification Performance of Bi-LSTM-CNN Model on Each Set |
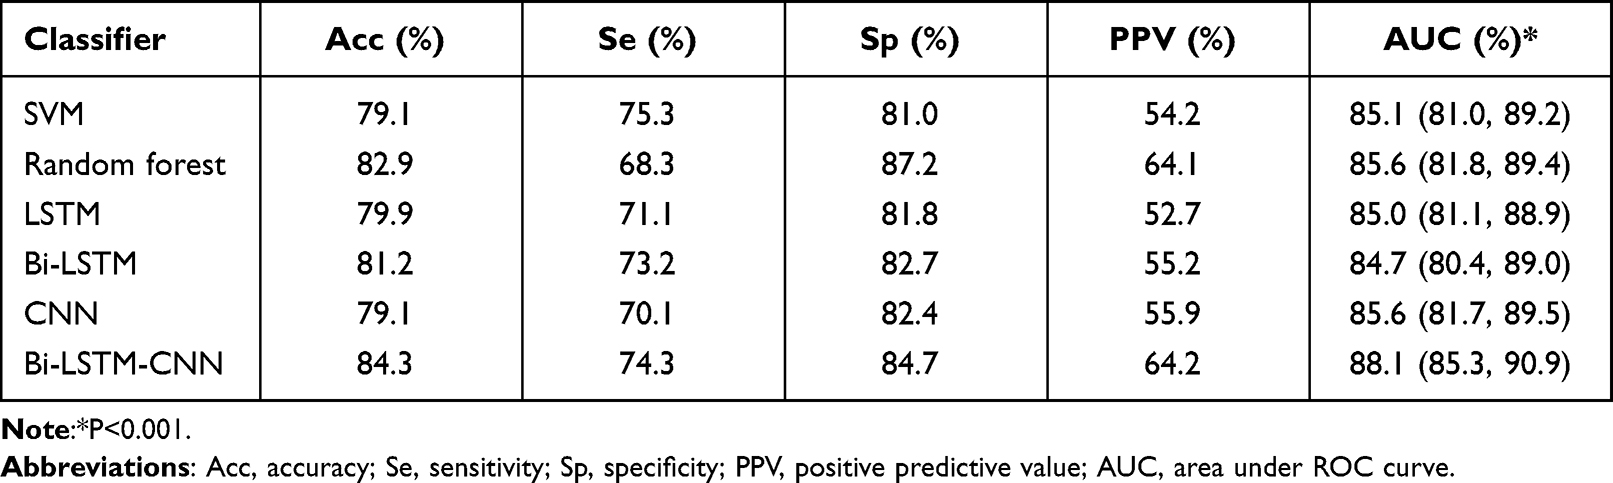 |
Table 4 Overview of the Averaged Classification Performance of Different Method on the Validation Set |
AHI Estimation
Desaturation events were detected by the segment generation method using SpO2 signals from full night PSG. The Bi-LSTM-CNN classifier model was used to divide the signals into apnoeic and non-apnoeic events. The AHI is computed as the number of desaturation events divided by the total recording time. Figure 6 shows a comparison of the predicted and real AHIs for each dataset. The training set had greater variance than did the predictive AHI in the verification set for all datasets. For SHHS and No. 6 People’s Hospital datasets, this discrepancy was limited, but it was higher for AHI; thus, the discrepancy led to insufficient representation of SDB in the test set. In the Physionet dataset, desaturation was absent in only 5.3% of the apnoea-related time; therefore, the predicted AHI was closer to the real value. To ensure the independence of the test dataset, the SHHS1 train dataset was used as the training set, while SHHS1 test, SHHS2, Physionet, and No. 6 People’s Hospital datasets were used as validation sets. The desaturation events in the validation set were divided into apnoeic-related (77.8%) and non-apnoeic-related (22.2%) events. The R2 coefficients of the predicted AHIs for the datasets were 0.87–0.94.
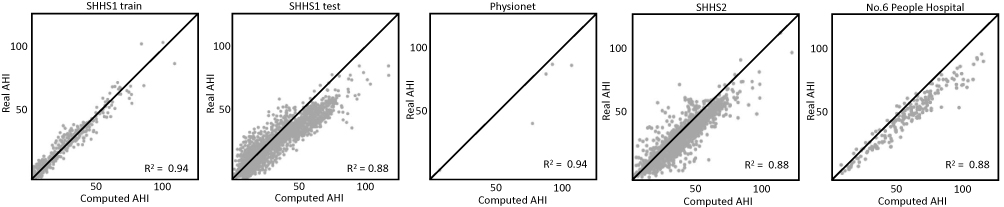 |
Figure 6 Scatter plot of the computed and annotated AHI for all data sets, R2 values are given. Regressions based on the training (SHHS1 train) and test data (SHHS1 test, SHHS2, No. 6 People Hospital, and Physionet) are also plotted. |
OSA Screening and Grading
Based on the AHI, participants were divided into patients with (AHI ≥ 15) and without (AHI 15) OSA. Furthermore, participants were classified into patients without OSA and patients with normal, mild, moderate, and severe OSA. The results of the SDB classification (AHI > 15) were compared with the results of other studies conducted on the SHHS2 dataset.10–12,41,42 Table 5 shows the comparison of the results of a subset of 995 individuals. Our classification method was superior to the methods used in other studies, showing an accuracy of 88.95% and an area under the curve of 0.961. Because the SHHS2 dataset was not used to train the model, these results are meaningful.
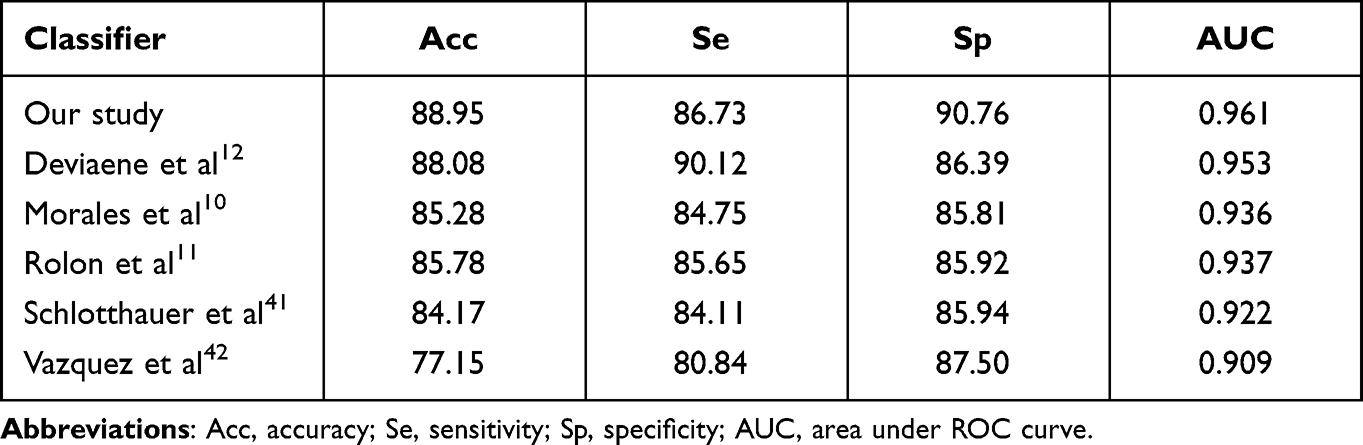 |
Table 5 Comparison of SDB Patient Screening Results for SHHS2 Dataset (AHI >15) |
Figure 7 shows the SDB classification accuracy in each dataset. In the SHHS1 test dataset, the accuracy was significantly lower for normal individuals than for SDB patients, which may be explained by the difficulty in distinguishing between normal and mildly affected individuals. Figure 8 shows that the accuracy and specificity of SDB classification decreased and sensitivity increased with increasing SDB severity. Only 17% of the patients in the SHHS1 and SHHS2 test datasets had severe SDB (AHI ≥ 30), leading to low sensitivity and high specificity. The confusion matrixes of the estimated and true class labels for the SHHS and No. 6 People’s Hospital datasets are shown in Figure 8. Outstanding classification performance was observed in the training set, such that 84.2% of the individuals were classified correctly and the remaining 13.8% of the individuals were classified in closely related classes. The classification accuracies were 4.2%, 67.1%, and 72.5% for the SHHS1 training, SHHS1 test, and SHHS2 sets. An AHI threshold of 15 is often used in SDB screening. Screening individuals for SDB based on an AHI threshold of 15 resulted in accuracy of 95.4% for the training set and accuracies of 88.4%, 88.9%, and 93.9% for the SHHS1 test, SHHS2, and No. 6 People’s Hospital datasets. In the Physionet dataset, SDB was accurately classified in 100 individuals with an accuracy of 100%.
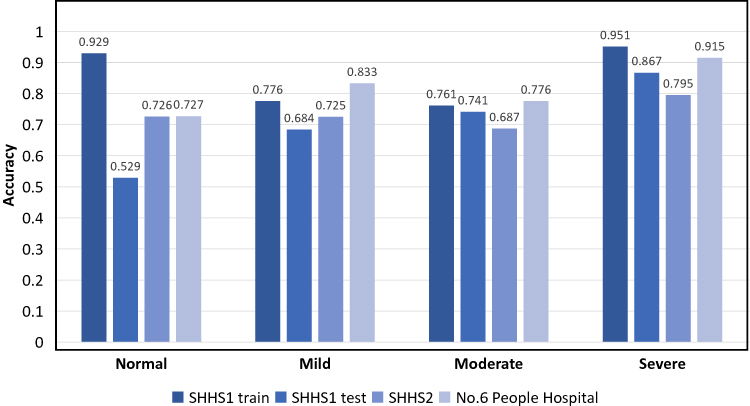 |
Figure 7 The bar chart of the accuracy for each dataset in each class of severity of SDB. |
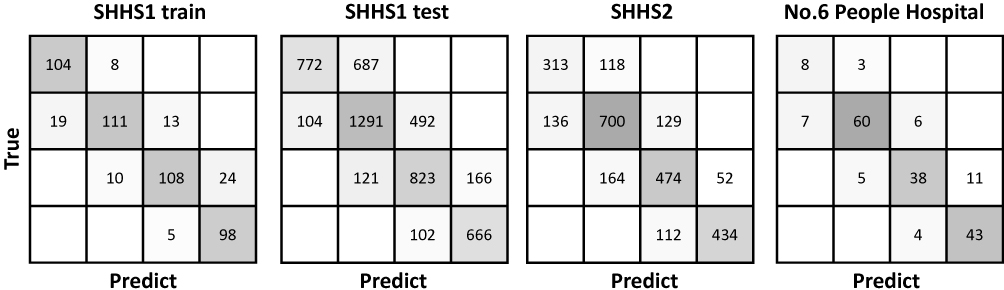 |
Figure 8 Confusion matrix for SDB severity classification based on computed AHI of four datasets (SHHS1 train, SHHS1 test, SHHS2 and No. 6 People Hospital). |
Whole Night Feature Infusion Experiment
We added whole night features to determine the performance accuracy for whole night PSG. Whole night feature infusion improved the accuracy by 1.6 (Table 6). In the SHHS1 test and SHHS2 datasets, models with whole night features were more accurate (84.9% and 83.7%, respectively) than were models without whole night features (84.0% and 83.5%, respectively).
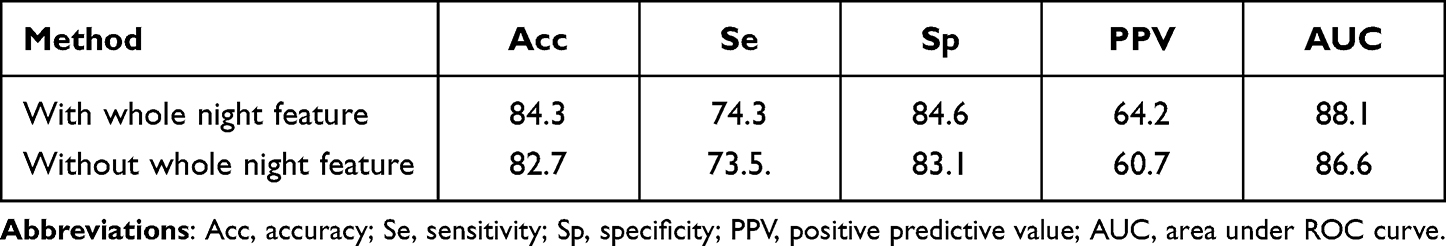 |
Table 6 Overview of the Averaged Classification Performance of Method Using or Not Using Whole Night Feature on the Validation Set |
Discussion
The detection of respiratory events, particularly apnoea-related respiratory events, is tedious and time-consuming because it requires the clinician or sleep technologist to manually examine each event. Therefore, an automated system that can accurately assess individual respiratory events and provide an accurate diagnosis will be extremely useful. Based on the detection and classification of desaturation events associated with apnoea, a method is proposed for the automatic detection of respiratory events using SpO2 signals and AHI data. Use of the Bi-LSTM-CNN classifier was associated with the best accuracy for desaturation classification.1 The mean accuracy of independent test sets was 84.3%. AHI was calculated by dividing the number of events by the duration of the record. Estimated AHI was used to screen and grade SDB, based on an AHI threshold of 15. The accuracy of the screening method was 89% on the SHHS2 dataset, which is better than the accuracies of SpO2-based methods.
Currently available portable home monitoring systems based on SpO2 signals include traditional methods that involve feature extraction,11,12 as well as deep learning methods.13,16 Some previous studies used traditional methods to manually extract the features from whole night records, then determine the presence and severity of SDB.11 Compared to portable home monitoring, PSG can help better diagnose SDB by obtaining more accurate respiratory and sleep conditions through a full range of signal monitoring, but the convenience and ease of use of portable monitoring also provides an efficient means of mass screening for SDB on a large scale. The classification models based on whole night records, such as the work by Di Persia,11 have good performance; however, they cannot recognise apnoeic events and are time-consuming to use for the extraction and selection of artificial features. In addition, detection models using desaturated fragments are well known, but the segment classification does not consider the impact of SDB severity.12 The classification of desaturated fragments corresponding to undetermined apnoea only considers the signal characteristics of the specific fragment, instead of the overall disease severity. Other studies using deep learning methods, such as Recurrent Neural or Deep Brief Networks,13,16 have demonstrated the potential usefulness of such methods. Although deep learning can determine whether apnoea has occurred in the segment, the events cannot be predicted and the exact number of apnoeic events cannot be determined if multiple apnoeic events occur in the segment. Thus, we propose a Bi-LSTM-CNN model to classify the event type and severity. This model uses a novel apnoea-related desaturation segment generation method to achieve variable length proposal. We introduced an efficient fusion method for the classification of apnoea-related desaturation events using the combination of whole night features and desaturation segments. We found that an automatic feature extraction method was most suitable for global whole night feature extraction.
Some practical considerations require further investigation. First, this study used suitable datasets for training and testing, including both public and private datasets. The public dataset may produce inadequate training results because of poor data quality. Future studies can improve the effectiveness of model performance validation by using larger private datasets. Second, the proposed Bi-LSTM-CNN classifier and its training process are complex; extensive data preprocessing is required. Data preprocessing significantly affects the performance of the model. In addition, the model integrates whole-night and fragment features using fully connected layers; significant differences between them may affect the final performance of the classifier. Third, annotation of the event-related respiratory events requires significant human resources. Therefore, further research concerning advanced enhancement techniques is needed to create better models, as well as a system that does not require large amounts of training data for the generation of reliable statistical models. In addition, the blood oxygen signal used for PSG during the training of this model may differ in the application of actual at-home portable devices, and a dataset of blood oxygen signals collected by portable devices may be a direction for further exploration of the study.
Conclusions
Based on the detection and classification of desaturation events associated with apnoea, an automatic detection method (Bi-LSTM-CNN) of respiratory events using SpO2 signals is proposed. The Bi-LSTM-CNN classifier was associated with the best accuracy for desaturation classification. The mean accuracy of different independent test sets was 84.3%. AHI was calculated via division of the number of events by the duration of the record. Estimated AHI was used to screen and grade SDB (AHI threshold: 15). The screening accuracy was 89% on the SHHS2 dataset, which is superior to the accuracies in previous studies conducted on the SHHS2 dataset. The current results support the effectiveness of a wearable SDB monitoring system based on SpO2 signals.
Data Sharing Statement
The datasets used and analyzed in this study are available from the corresponding author, on reasonable request.
Ethics Approval and Statement of Informed Consent
All procedures performed in studies involving human participants were in accordance with the ethical standards of the institutional and/or national research committee and with the 1964 Helsinki declaration and its later amendments or comparable ethical standards and were approved by the Ethics Committee of Shanghai Jiao Tong University Affiliated Sixth People’s Hospital. Informed consent was obtained from all individual participants included in the study.
Acknowledgments
The authors are grateful to the staff in our sleep center and all of the patients who participated.
Author Contributions
All authors made a significant contribution to the work reported, whether that is in the conception, study design, execution, acquisition of data, analysis and interpretation, or in all these areas; took part in drafting, revising or critically reviewing the article; gave final approval of the version to be published; have agreed on the journal to which the article has been submitted; and agree to be accountable for all aspects of the work.
Funding
The study received grants from the Shanghai Municipal Commission of Science and Technology (Grant No. 18DZ2260200), Shanghai Shen-Kang Hospital Management Center Project (Grant Nos. SHDC2020CR2044B, SHDC2020CR3056B), Shanghai Jiao Tong University Affiliated Sixth People’s Hospital College-level Project (X-2296).
Disclosure
The authors declare that the research was conducted in the absence of any commercial or financial relationships that could be construed as a potential conflict of interest.
References
1. Young T, Palta M, Dempsey J, et al. The occurrence of sleep-disordered breathing among middle-aged adults. N Engl J Med. 1993;328(17):1230–1235. doi:10.1056/NEJM199304293281704
2. Flemons WW, Littner MR, Rowley JA, et al. Home diagnosis of sleep apnea: a systematic review of the literature. An evidence review cosponsored by the American Academy of Sleep Medicine, the American College of Chest Physicians, and the American Thoracic Society. Chest. 2003;124(4):1543–1579. doi:10.1378/chest.124.4.1543
3. Heinzer R, Vat S, Marques-Vidal P, et al. Prevalence of sleep-disordered breathing in the general population: the hypnolaus study. Lancet Respir Med. 2015;3(4):310–318. doi:10.1016/S2213-2600(15)00043-0
4. Namen AM, Chatterjee A, Huang KE, et al. Recognition of sleep apnea is increasing. analysis of trends in two large, representative databases of outpatient practice. Ann Am Thorac Soc. 2016;13(11):2027–2034. doi:10.1513/AnnalsATS.201603-152OC
5. Hara H, Tsutsumi M, Tarumoto S, et al. Validation of a new snoring detection device based on a hysteresis extraction algorithm. Auris Nasus Larynx. 2017;44(5):576–582. doi:10.1016/j.anl.2016.12.009
6. Lee J, Nam Y, Kim Y. Sleep monitoring based on a tri-axial accelerometer and a pressure sensor. Sensors. 2016;16(5):750. doi:10.3390/s16050750
7. Sanchez-Sinencio E, Jin J. A home sleep apnea screening device with time-domain signal processing and autonomous scoring capability. IEEE Trans Biomed Circuits Syst. 2014;9(1):96–104. doi:10.1109/TBCAS.2014.2314301
8. Rodriguez-Villegas E, Chen G, Radcliffe J, et al. A pilot study of a wearable apnoea detection device. BMJ Open. 2014;4(10):e005299. doi:10.1136/bmjopen-2014-005299
9. Huang SH, Teng NC, Wang KJ, et al. Use of oximetry as a screening tool for obstructive sleep apnea: a case study in Taiwan. J Med Syst. 2015;39(3):29. doi:10.1007/s10916-015-0195-5
10. Morales JF, Varon C, Deviaene M, et al. Sleep apnea hypopnea syndrome classification in SpO2 signals using wavelet decomposition and phase space reconstruction.
11. Rolon RE, Larrateguy LD, Di Persia LE, et al. Discriminative methods based on sparse representations of pulse oximetry signals for sleep apnea-hypopnea detection. Biomed Signal Process Control. 2017;3:58–67.
12. Deviaene M, Testelmans D, Buyse B, et al. Automatic screening of sleep apnea patients based on the SpO2 signal. IEEE J Biomed Health Inform. 2018;23(2):607–617. doi:10.1109/JBHI.2018.2817368
13. Mostafa SS, Mendonca F, Morgado-Dias F, et al. SpO2 based sleep apnea detection using (INES); 2017: 000091–000096.
14. Kulkas A, Duce B, Leppanen T, et al. Severity of desaturation events differs between hypopnea and obstructive apnea events and is modulated by their duration in obstructive sleep apnea. Sleep Breath. 2017;4(4):829–835. doi:10.1007/s11325-017-1513-6
15. Sato M, Suzuki M, Suzuki J, et al. Overweight patients with severe sleep apnea experience deeper oxygen desaturation at apneic events. J Med Dent Sci. 2008;1:43–47.
16. Pathinarupothi RK, Rangan ES, Gopalakrishnan EA, et al. Single sensor techniques for sleep apnea diagnosis using deep learning.
17. Li K, Pan W, Li Y, et al. A method to detect sleep apnea based on deep neural network and hidden Markov model using single-lead ECG signal. Neurocomputing. 2018;294:94–101. doi:10.1016/j.neucom.2018.03.011
18. Punjabi M. An ANN-based detection of obstructive sleep apnea from simultaneous ECG and SpO2 recordings. Clin Neurophysiol. 2018;30:603613.
19. Moret-Bonillo V, Alvarez-Estevez D, Fernandez-Leal A, et al. Intelligent approach for analysis of respiratory signals and oxygen saturation in the sleep apnea/hypopnea syndrome. Open Med Inform J. 2014;1:94–101.
20. Collop NA, Tracy SL, Kapur V, et al. Obstructive sleep apnea devices for out-of-center (OOC) testing: technology evaluation. J Clin Sleep Med. 2011;7(5):531–548. doi:10.5664/JCSM.1328
21. Krehel M, Wolf M, Boesel LF, et al. Development of a luminous textile for reflective pulse oximetry measurements. Biomed Opt Express. 2014;5(8):2537–2547. doi:10.1364/BOE.5.002537
22. Coetzee FM, Elghazzawi Z. Noise-resistant pulse oximetry using a synthetic reference signal. IEEE Trans Biomed Eng. 2000;47(8):1018–1026. doi:10.1109/10.855928
23. Sivam S, Yee B, Wong K, Wang D, Grunstein R, Piper A. Obesity hypoventilation syndrome: early detection of nocturnal-only hypercapnia in an obese population. J Clin Sleep Med. 2018;14(9):1477–1484. doi:10.5664/jcsm.7318
24. Van de Water AT, Holmes A, Hurley DA. Objective measurements of sleep for non-laboratory settings as alternatives to polysomnography–a systematic review. J Sleep Res. 2011;20(1 Pt 2):183–200. doi:10.1111/j.1365-2869.2009.00814.x
25. Berry RB, Budhiraja R, Gottlieb D, et al.; American Academy of Sleep Medicine. Rules for scoring respiratory events in sleep: update of the 2007 AASM manual for the scoring of sleep and associated events. Deliberations of the sleep apnea definitions task force of the American Academy of Sleep Medicine. J Clin Sleep Med. 2012;8(5):597–619. doi:10.5664/jcsm.2172.
26. American Academy of Sleep Medicine Task Force. Sleep-related breathing disorders in adults: recommendations for syndrome definition and measurement techniques in clinical research. The Report of an American Academy of Sleep Medicine Task Force. Sleep. 1999;22(5):667–689. doi:10.1093/sleep/22.5.667
27. Mark RG, Penzel T, Moody GB, et al. The Apnea-ECG database. Computers in Cardiology; 2000.
28. Young T, Shahar E, Nieto FJ, et al.; Sleep Heart Health Study Research Group. Predictors of sleep-disordered breathing in community-dwelling adults: the Sleep Heart Health Study. Arch Intern Med. 2002;162(8):893–900. doi:10.1001/archinte.162.8.893
29. Koley BL, Dey D. On-line detection of apnea/hypopnea events using SpO2 signal: a rule-based approach employing binary classifier models. IEEE J Biomed Health Inform. 2014;18(1):231–239. doi:10.1109/JBHI.2013.2266279
30. Kulkas A, Tiihonen P, Julkunen P, et al. Novel parameters indicate significant differences in severity of obstructive sleep apnea with patients having similar apnea-hypopnea index. Med Biol Eng Comput. 2013;51(6):697–708. doi:10.1007/s11517-013-1039-4
31. Costa M, Goldberger AL, Peng CK. Multiscale entropy analysis of biological signals. Phys Rev E Stat Nonlin Soft Matter Phys. 2005;71(2 Pt 1):021906. doi:10.1103/PhysRevE.71.021906
32. Alvarez D, Hornero R, Marcos JV, et al. Assessment of feature selection and classification approaches to enhance information from overnight oximetry in the context of apnea diagnosis. Int J Neural Syst. 2013;23(5):1350020. doi:10.1142/S0129065713500202
33. Alvarez D, Hornero R, García M, et al. Improving diagnostic ability of blood oxygen saturation from overnight pulse oximetry in obstructive sleep apnea detection by means of central tendency measure. Artif Intell Med. 2007;41(1):13–24. doi:10.1016/j.artmed.2007.06.002
34. Alvarez D, Gutierrez-Tobal GC, Hornero R, et al. Linear and non linear analysis of airflflow recordings to help in sleep apnoea-hypopnoea syndrome diagnosis. Phys Rev E Stat Nonlin Soft Matter Phys. 2012;33:1261–1275.
35. Gutierrez-Tobal GC, Alvarez D, Alonso-Alvarez ML, et al. Automated screening of children with obstructive sleep apnea using nocturnal oximetry: an alternative to respiratory polygraphy in unattended settings. J Clin Sleep Med. 2017;13(5):693–702. doi:10.5664/jcsm.6586
36. Shuying L, Huosheng X, LiangChih Y, et al. SENTINLP at IJCNLP-2017 Task 4: customer feedback analysis using a Bi-LSTM-CNN model.
37. Schuster KK, Paliwal M. Bidirectional recurrent neural networks. IEEE Trans Signal Process. 1997;45(11):2673–2681. doi:10.1109/78.650093
38. Lin TY, Goyal P, Girshick R, He K, Dollar P. Focal loss for dense object detection. IEEE Trans Pattern Anal Mach Intell. 2020;42(2):318–327. doi:10.1109/TPAMI.2018.2858826
39. Lin TY, Goyal P, Girshick R, et al. Real-time detection of apneas on a PDA. IEEE Trans Inf Technol Biomed. 2017;14:2999–3007.
40. Das A, Selvaraju RR, Cogswell M, et al. Grad-CAM: visual explanations from deep networks via gradient-based localization. J Clin Sleep Med. 2016:618–626. doi:10.1109/ICCV.2017.74
41. Schlotthauer G, Di Persia LE, Larrateguy LD, et al. Screening of obstructive sleep apnea with empirical mode decomposition of pulse oximetry. Med Eng Phys. 2014;36(8):1074–1080. doi:10.1016/j.medengphy.2014.05.008
42. vázquez JC, Tsai WH, Flemons WW, et al. Automated analysis of digital oximetry in the diagnosis of obstructive sleep apnoea. Thorax. 2000;55(4):302–307. doi:10.1136/thorax.55.4.302
 © 2022 The Author(s). This work is published and licensed by Dove Medical Press Limited. The full terms of this license are available at https://www.dovepress.com/terms.php and incorporate the Creative Commons Attribution - Non Commercial (unported, v3.0) License.
By accessing the work you hereby accept the Terms. Non-commercial uses of the work are permitted without any further permission from Dove Medical Press Limited, provided the work is properly attributed. For permission for commercial use of this work, please see paragraphs 4.2 and 5 of our Terms.
© 2022 The Author(s). This work is published and licensed by Dove Medical Press Limited. The full terms of this license are available at https://www.dovepress.com/terms.php and incorporate the Creative Commons Attribution - Non Commercial (unported, v3.0) License.
By accessing the work you hereby accept the Terms. Non-commercial uses of the work are permitted without any further permission from Dove Medical Press Limited, provided the work is properly attributed. For permission for commercial use of this work, please see paragraphs 4.2 and 5 of our Terms.