")
Back to Journals » International Journal of Chronic Obstructive Pulmonary Disease » Volume 15
Functional, Ultrastructural, and Transcriptomic Changes in Rat Diaphragms with Different Durations of Cigarette Smoke Exposure
Authors Sheng H , Zhang Y, Shi X, Hu Y, Pang B, Jin J, Ma Y
Received 22 August 2020
Accepted for publication 6 November 2020
Published 30 November 2020 Volume 2020:15 Pages 3135—3145
DOI https://doi.org/10.2147/COPD.S278327
Checked for plagiarism Yes
Review by Single anonymous peer review
Peer reviewer comments 5
Editor who approved publication: Dr Richard Russell
Haiyan Sheng,1,2 Yijie Zhang,1,3 Xiaoqian Shi,1,4 Yuhan Hu,1 Baosen Pang,1,4 Jiawei Jin,1,4 Yingmin Ma1
1Department of Respiratory and Critical Care Medicine, Beijing Institute of Respiratory Medicine, Beijing Chaoyang Hospital, Capital Medical University, Beijing, People’s Republic of China; 2Department of Respiratory and Critical Care Medicine, Beijing Tongren Hospital, Capital Medical University, Beijing, People’s Republic of China; 3Department of Emergency Medicine, Beijing Shijitan Hospital, Capital Medical University, Beijing, People’s Republic of China; 4The Clinical Research Center, Beijing Chaoyang Hospital, Capital Medical University, Beijing, People’s Republic of China
Correspondence: Yingmin Ma; Jiawei Jin Email [email protected]; [email protected]
Aims: The aim of the study was to explore the functional and structural changes of the diaphragm and underlying mechanisms in response to 12 or 24 weeks of cigarette smoke (CS) exposure in rats.
Materials and Methods: Rats were exposed to CS to develop a COPD model and the rats exposed to room air served as a control group. Rats were randomly divided into four groups: CS12W, CON12W, CS24W, and CON24W. Pulmonary function, lung histopathology, and the contractile properties and ultrastructure of diaphragm muscle were examined in these rats. The changes of transcriptomic profiling of diaphragm muscle were further compared between CS and control rats by the RNA Seq.
Results: Both CS groups showed lower FEV0.3/FVC, elevated mean linear intercept (MLI), and reduced mean alveolar numbers (MAN) vs the control groups. The fatigue index (FI) of the diaphragm muscle from the CS12W group, but not CS24W, was significantly increased. Conversely, the force–frequency curves of the diaphragm muscle from the CS24W group, but not CS12W group, were significantly decreased. Consistently, mitochondrial number density (NA) and volume density (Vv) were increased in the CS12W diaphragm muscle, while being decreased in the CS24W group. Furthermore, the diaphragm transcriptomic profiling results showed that genes regulating cell proliferation and energy metabolic activity were un-regulated and genes regulating protein degradation were down-regulated in the CS12W diaphragm, while CS24W diaphragm showed opposite changes.
Conclusion: These observations suggested a transition of diaphragm muscle from initial compensatory to decompensatory changes in function, structure, and gene expression during the development of COPD.
Keywords: COPD, diaphragm, contractile properties, transcriptional gene expression
Introduction
Chronic obstructive pulmonary disease (COPD) characterized by irreversible airway obstruction is a serious life-threatening disease.1 Progressive dyspnea and exercise intolerance (the common clinical manifestations of COPD) seriously impact patients’ physical capacity and life quality.1,2 Owing to a large contribution of diaphragm dysfunction to dyspnea and exercise intolerance, the chronic deleterious remodeling of diaphragm muscle is likely involved in the pathogenesis of COPD.2,3 However, the changes in diaphragm muscle during COPD development and the underlying regulation mechanisms have not been fully elucidated.
Diaphragm dysfunction during COPD is associated with chronic increased mechanical load, hypoxia, and malnutrition.2–6 The pathogenesis is involved with systemic inflammation, protein degradation, oxidative stress, and apoptosis.7–10 Nevertheless, diaphragm functional and structural changes in COPD are controversial in previous studies. Gea et al5 showed a fatigue-resistant diaphragm compensation in COPD patients, whereas van Hees et al8 indicated a diaphragm fatigue caused by deregulated protein degradation. Moreover, some previous studies manifested COPD-induced diaphragmatic atrophy,3,4,7,9,11,12 but recent studies indicated that the diaphragm was resistant to atrophy in COPD patients.13 Furthermore, it has been considered that diaphragm adaptive compensation for inadequate ventilation occurred in early stages of COPD and dysfunction mostly observed in advanced stage.7,10–12,14 However, increasing evidence also indicated maladaptive changes in the early course of COPD, including the loss of cytoplasm integrity and enhanced proteolytic deregulation.7,10,11,14 Given these discrepancies, it is therefore necessary to investigate the structural and functional changes in the diaphragm during COPD development.
Herein, we analyzed the structural and functional changes of the diaphragm in rat COPD model induced by different durations of CS exposure. We further explored the regulatory mechanism through comparing transcriptional profile changes in these diaphragm muscles. These findings will advance the pathogenesis of diaphragm dysfunction and toprovide reference of precision therapy for different stages of COPD.
Materials and Methods
Establishment of the COPD Model
All animals were maintained at the animal facility, Beijing Chaoyang Hospital. All animal procedures approved by the Animal Care and Ethics Committee of Beijing Chaoyang Hospital were performed in accordance with the Guide for the Care and Use of Laboratory Animals of the Beijing Chaoyang Hospital, Capital Medical University.
Seven-week-old SPF male Sprague-Dawley (SD) rats were maintained under conditions of 12-hour light/dark cycle, 25-26°C, and 50-60% humidity, and subjected to CS exposure after 1-week adaptation.7,9 These rats were divided into four group: CS12W (CS exposed for 12 weeks, n=9), CON12W (room air-exposed for 12 weeks, n=9), CS24W (CS exposed for 24 weeks, n=6), and CON24W (room air-exposed for 24 weeks, n=6). The CS groups were exposed to CS generated by burning cigarettes (Baisha, Hunan, China, Tar 11 mg, nicotine 0.9 mg, carbon monoxide 12 mg) using the Tobacco Smoke Inhalation Experiment System for small animals (Model SIS-CS, Shibata Scientific Technology Ltd., Tokyo, Japan). Rats were exposed to CS twice daily (10:00–11:00 am and 17:00–18:00 pm) using a nose-breathing apparatus.
A total of 20 cigarettes were used for each exposure procedure and the level of total particulate matter was maintained at 993.6±125.7 mg/m3. The control rats were exposed to room air without smoking. At the end of 12 weeks of CS, before the following analyses, three rats in the CS12W group compared with three rats in the CON12W group were randomly selected to confirm that the COPD model was established by evaluating the pulmonary functional changes and lung tissue histological changes. Following 12-week or 24 week CS exposures, the pulmonary function measured and tissues were collected for further analyses.
Pulmonary Function Test and Lung Histopathology
Pulmonary function was assessed using the AniRes2005 animal lung function analysis system (Beijing Beilanbo Technology). The forced expiratory volume in 0.3 second (FEV0.3), forced vital capacity (FVC), expiratory resistance (RE), and dynamic lung compliance (Cdy) were measured; the ratio of FEV0.3/FVC was calculated.
The animals were sacrificed by cutting the distal aorta. The left bronchus was ligated and the left lobes were immediately excised and stored with liquid nitrogen for real-time quantitative polymerase chain reaction (qPCR) assessing the changes of tumor necrosis factor (TNF)-α and interleukin (IL)-6. The sequences of the primers (Sangon Biotech, Shanghai) are shown in Supplementary Table S1. The relative level of target mRNA was normalized against the cDNA levels of the β-actin housekeeping gene. Data were expressed as fold change vs CON12W using 2−ΔΔCt method.
The right lungs were inflated with 4% PFA at a constant pressure of 25 cm H2O for 10 minutes, then the right lower lobes were ligated and dissected out from rats and were fixed in 4% PFA in PBS and embedded in paraffin. These paraffin embedded tissues were sliced into 5 μm-thick sections for Hematoxylin and Eosin (HE) (ScyTek Laboratories). Ten fields per section were randomly taken with 100× magnification and a cross was drawn through the center of each field. The average alveolar diameter was assessed as follows: Mean linear intercept (MLI) (μm)=total length of the cross/number of alveolar septa lying on the cross; the density of alveoli was determined as follows: Mean alveolar numbers (MAN) (/mm2)=alveolar number/whole field area.9
Measurement of Diaphragm Muscle Contractile Properties
The right hemi-diaphragm was immediately removed and immersed in oxygenated (95% O2:5% CO2) Krebs-Henseleit solution at 37°C. A 5 mm-width diaphragm strip was suspended vertically in Krebs-Henseleit solution and then adjusted to optimal length of developing maximum twitch tension (L0). Twitch kinetics, force–frequency relationship and fatigue tolerance were measured to determine the contractile properties as previously described.8,15 Twitch kinetics were acquired by testing the peak twitch tension (Pt), contraction time (CT), and the time required from peak tension to half relaxation (1/2RT) during a single muscle contraction elicited by 0.2 ms duration of pulse stimulation. Force–frequency relationships were evaluated by sequentially stimulating the muscle at 10, 20, 40, 60, 80, 100, and 150 Hz, with a rest interval of 1 minute. After 10 minutes of rest, muscle fatigue was rated as follows: 40-Hz stimulus (duration of stimulation: 330 ms) was applied every second last for the 2 minutes. Fatigue index (FI) = force of 2 minutes/initial tension.15
After tests, the muscle strip was dried, the length and weight were measured, and the cross-sectional area (CSA) was calculated. CSA (cm2) = strip weight (g)/[length (cm) * muscle density (g/cm3)]. Muscle density is expressed as 1.056 g/cm3. Mechanical values measured are standardized and corrected by CSA.
Diaphragm Structural and Ultrastructural Observations
Muscle samples were embedded with O.C.T. compound (SAKURA, USA), and quickly immersed into cooled isopentane and stored with liquid nitrogen. These embedded samples were sliced into 10 μm-thick cross-sections for ATPase staining fluid (Beijing Solarbio Science & Technology) to classify types I and II muscle fibers. The proportion of type I fibers was type I fiber number/diaphragm muscle fiber number of whole fields.16
Transmission electron microscope (TEM, FEI Company, UA) was used to observe the diaphragm muscle fiber and mitochondrial morphology. Following fixation in Karnovsky’s fixative and post-fixation with 1% osmium fixative, the diaphragm tissues were embedded in epoxy resin and sectioned. Ultrathin sections were stained with uranyl and lead citrate and then examined in an electron microscope. Three copper nets were observed for each sample, and 10 randomly selected fields from each copper net were analyzed (6,000×). Mitochondrial number density (NA) and mitochondrial volume density (Vv) were established and calculated by Image Scope image analysis software. Ten horizontal and 10 vertical lines were cross-drawn equidistant through the space. NA (/μm2) = mitochondria number of reference space/whole space area; Vv (%) = number of points that hit mitochondria/number of points that hit reference space.17
RNA-Seq Analysis
Samples of 50 mg tissue (n=3 per each group) were extracted to analyze the transcriptome genes expression by RNA-Seq technology (OE biotech, Shanghai, China). Briefly, total RNA was extracted by the mirVana miRNA Isolation Kit (Ambion) and RNA integrity was evaluated by Agilent 2100 Bioanalyzer (Agilent Technologies). The cDNA library was constructed using TruSeq Stranded mRNA LTSample Prep Kit (Illumina), and sequenced on the Illumina sequencing platform (HiSeqTM 2500). Raw reads were processed using Trimmomatic.18 After comparing with the sequences of reference genes, the differentially expressed genes (DEGs) were identified using the DESeq (2012) R package functions estimate Size Factors and binom Test.19 |log2FC |>0.58 and P-value<0.05 were set as the threshold for defining significant up or down expression, respectively. Twelve differential genes (Fbxo32, Nedd4l, Foxo3, Megf10, Cdk1, Ccnb1, Plk3, Gpsm1, Ptgs2, Sik1, Myh4, Atp5f1) between CS-exposure groups and control groups were selected to conduct qPCR to verify RNA-Seq results, and the primers are shown in Supplementary Table S1. Functional enrichment and pathway enrichment analysis of DEGs were based on Gene Ontology (GO) and Kyoto Encyclopedia of Gene and Genomes (KEGG).20
Statistical Analysis
Data were presented as mean±standard deviation (SD). The statistical analysis was analyzed using SPSS 19.0 software. Statistical comparisons between two groups were performed using the Mann–Whitney U-test for non-normally distributed continuous variables, and a two-tailed Student’s t-test for normally distributed continuous variables. Comparisons among groups were performed using 1-way ANOVA followed by Bonferroni post-hoc multiple comparison tests where appropriate. P<0.05 was considered as statistically significant.
Results
CS Exposure Caused Airflow Obstruction as Well as Emphysema Formation and Inflammatory Infiltration
Both 12 and 24 weeks of CS exposure caused obvious airflow obstruction vs room-air exposure controls, indicated by decreased FEV0.3/FVC in CS groups, although CS exposure failed to cause the obvious changes in resistance (RE) and compliance (Cdy) (Figure 1A and Supplementary Table S2). Consistently, histological assay showed typically emphysema formation and inflammatory infiltration. Emphysema-like alveolar structure changes included wider alveolar space, reduced alveolar units, and a thinner alveolar wall, confirmed by significantly increased MLI and decreased MAN (Figure 1B–D). Notably, compared to CS12W lungs, CS24W lungs showed more severe changes in MLI, MAN, and FEV0.3/FVC (Figure 1A–D). Furthermore, an enhanced pulmonary inflammation along with these functional and structural changes was evidenced by the infiltrated inflammatory cells across the bronchioles and the increased levels of TNF-α and IL-6 in CS lungs (Figure 1E and F).
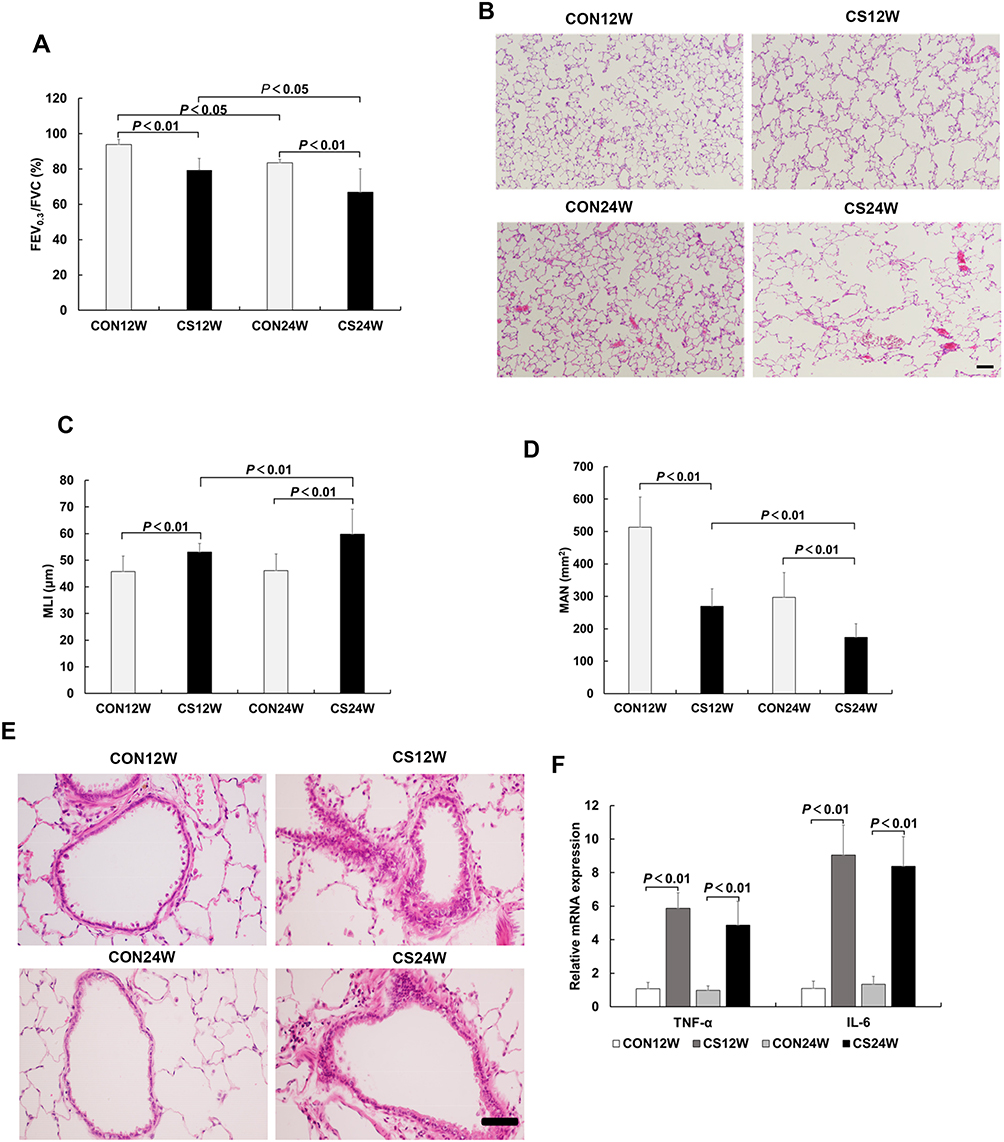 |
Figure 1 CS exposure caused airflow obstruction in pulmonary function, emphysema, and inflammatory changes in the lung. (A) CS groups showed decreased FEV0.3/FVC, and the CS24W group was even more decreased than the CS12W group, indicating CS exposure-induced pulmonary functional change. (B) The HE staining on alveolar structure from rats exposed to CS and controls. Emphysema-like alveolar structure changes including widened alveolar space, reduced alveolar units, and the thinner alveolar wall were present in CS lungs, and CS24W lungs showed more severe changes than CS12W lungs. MLI (C) and MAN (D) were measured to indicated alveolar structural changes. CS groups showed significantly increased MLI and decreased MAN compared to the control groups, and the CS24W group showed severe changes in MLI and MAN compared to the CS12W group. (E) The HE staining on bronchioles from rats exposed to CS and controls. Inflammatory cells obviously infiltrated across the bronchioles in the CS groups. (F) Expression of TNF-α and IL-6 mRNA in rat lung tissue. TNF-αand IL-6 levels increased in CS groups compared to controls. Data presented as mean±SD, n=6 per group. |
CS Exposure Caused Diaphragm Functional Changes in FI and Force–Frequency Curve
In order to evaluate diaphragm functional changes during the CS-induced COPD, we measured the muscle functional indexes including peak twitch tension (Pt) to the cross-sectional area (Pt/CSA), CT, 1/2RT, FI, and force–frequency curve. Compared to controls, both CS12W and CS24W diaphragm displayed a marked decrease in Pt/CSA, although they displayed comparable CT and 1/2RT (Supplementary Table S3). The FI of the CS12W group was significantly increased vs the CON12W group, while no significant change was observed in the CS24W group, suggesting the enhanced fatigue-resistant ability of the diaphragm muscle by short-term CS exposure (Figure 2A). Furthermore, the force-frequency curve of the diaphragm muscle was examined to indicate functional changes. Twenty-four weeks of CS exposure caused a marked downward shift vs CON24W, while 12 weeks of CS exposure failed to cause a significant change in the force–frequency curve (Figure 2B).
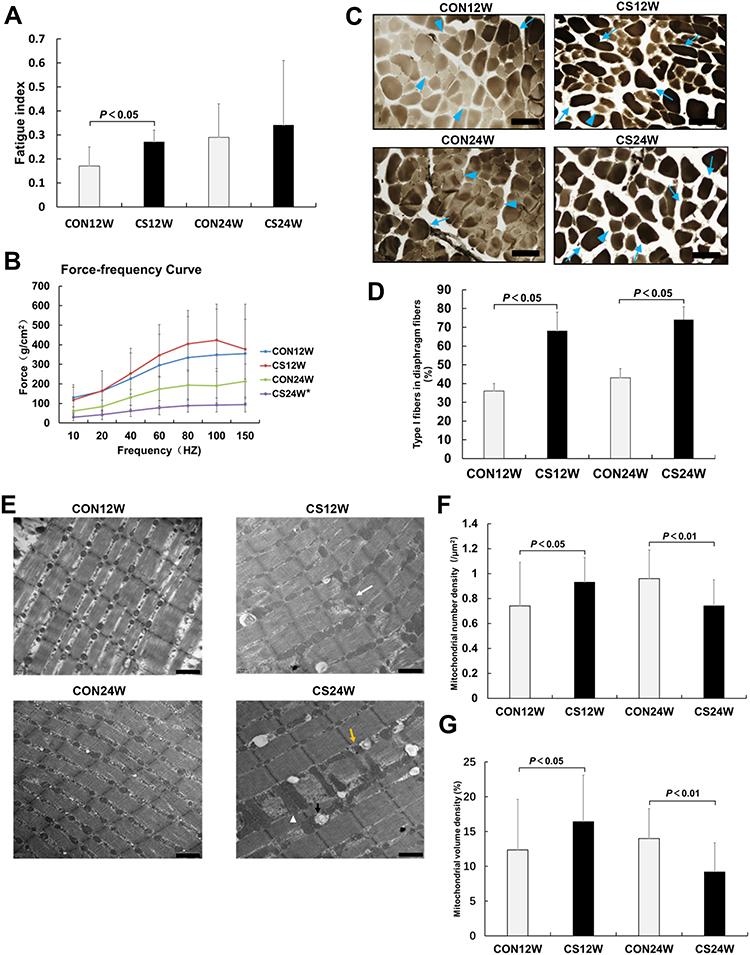 |
Figure 2 CS exposure caused functional and ultrastructural changes in diaphragm muscles. Fatigue index (A) and force–frequency curve (B) were measured to indicate diaphragm muscles functional changes post-CS exposure. The fatigue index of the CS12W group was significantly increased vs the CON12W group, while no significant change was observed in the CS24W group. Twenty-four weeks of CS exposure caused a marked downward shift vs CON24W, while 12 weeks of CS exposure failed to cause significant change in the force–frequency curve. (C) Distinguish of diaphragm fiber types was conducted by ATPase stains. Dark-stained fibers were type I fibers (blue arrow), and light-stained fibers were type II fibers (blue arrow head). (D) The proportions of type I fibers in diaphragm fibers were measured. CS groups exhibit an increased proportion of type I fibers and decreased proportion of type II fibers compared with control groups. (E) The ultrastructure of diaphragm muscles was observed by TEM. CS caused blurred Z lines (white arrow), unclear structure, ruptured focal myofilament (yellow arrow); the visible giant mitochondria (white arrow head) was observed in the CS24W group. The changes in mitochondrial number (F) and volume (G) were measured. The diaphragm muscle from CS12W displayed a significant increase in mitochondrial number, while diaphragm muscle from CS24W exhibited a significant decrease of mitochondrial number. Additionally, the diaphragm muscle from the CS12W diaphragm displayed increased mitochondrial volume density compared to controls, whereas the CS24W group showed decreased Vv. Data presented as mean±SD, *P<0.05 vs control group; n=6 per group. Scale bar: 100 μm for C; 1 μm for E. |
CS Exposure Caused an Increase of the Proportion of Type I Fibers and the Changes of Both Mitochondrial Morphology and Number in Diaphragm Muscle
In order to identify whether the diaphragm muscle functional changes were associated with the alteration in diaphragm-fiber type proportion, the ATPase staining was performed on the cross cryosections of diaphragm muscle to label slow-twitch muscle fibers (type I, the dark and positive staining). These type I muscle fibers expressing muscle myosin with a slow ATPase rate are adapted for long and slow contraction. The type II muscle fibers, identified by lighter staining, are fast-twitch muscles expressing muscle myosin with a fast ATPase rate. CS groups exhibit an increased proportion of type I fibers and decreased proportion of type II fibers compared to controls, suggesting a remodeling of type II-to-I fiber transformation in the development of COPD (Figure 2C and D).
The diaphragm myofibrils and mitochondrial morphological changes were examined by TEM. Compared to diaphragm muscle from controls with normal diaphragm myofibrils and clear Z line arranged in order, the diaphragm muscle from CS-exposure rats exhibited a blurred Z line, unclear structure, and focal myofilament rupture and dissolution (Figure 2E). Notably, the diaphragm muscle from CS12W displayed a significant increase in mitochondrial number, while the diaphragm muscle from CS24W exhibited a significant decrease of mitochondrial number with obvious giant mitochondria (Figure 2E and F). Additionally, the diaphragm muscle from CS12W diaphragm displayed increased mitochondrial volume density (Vv) compared to controls, whereas the CS24W group showed decreased Vv (Figure 2G). In addition, the diaphragm muscle from the CS groups, especially from the CS24W group, showed marked vacuolization, which might be associated with increased autophagy and apoptosis processes.
The results of RNA Seq Showed That Transcriptomic Signatures in Rat Diaphragms Were Different with Different Durations of CS Exposure
RNA from diaphragms were sequenced by reference transcriptome with a RNA Integrity Number (RIN) range of 8.1–9.3 in each sample of the four groups. The summary sequencing depth results are shown in Supplementary Table S4. RNA Seq identified a total of 706 differentially expressed genes between CS12W and CON12W groups and a total of 162 differentially expressed genes between CS24W and CON24W groups (Supplementary Table S5 and S6). Of these, 290 genes were up-regulated and 416 genes were down-regulated in the CS12W group, while 109 were up-regulated and 53 down-regulated in the CS24W group (Figures 3A and 4A). The qPCR assays further confirmed the transcriptional changes of some interesting genes observed in RNA-Seq results (Figures 3B and 4B).
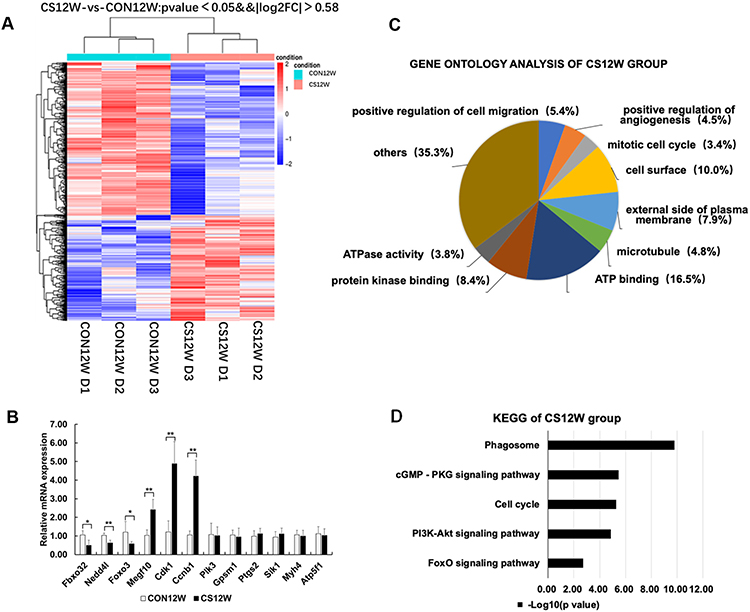 |
Figure 3 Hierarchical clustering, Go Ontology, KEGG pathway analysis, and real-time PCR verification of rat diaphragms muscle from CON12W and CS12W. (A) Hierarchical clustering revealed that gene expression profiles were separated based on 12W of CS exposure. (B) Real-time PCR verification of six differential genes and two non-differential genes, confirming the results of the mRNA levels of genes of interest revealed by microarray. Data presented as mean±SD, *P<0.05 and **P<0.01 vs control group; n=6 per group. (C) Gene Ontology analysis showed the mostly affected biological process, cellular component, and molecular function. The most significant enrichment GO terms in CS12W were positive regulation of cell migration, positive regulation of angiogenesis, and mitotic cell cycle in biological process, cell surface, external side of plasma membrane, and microtubule in cellular components, ATP binding, protein kinase binding, and ATPase activity in molecular functions. (D) KEGG pathway analysis demonstrated that several pathways were regulated by CS exposure. The top 20 pathways of enrichment analysis KEGG differential genes in CS12W group included phagosome (eight up-regulated and 18 down-regulated genes) and cell cycle (14 up-regulated and one down-regulated). |
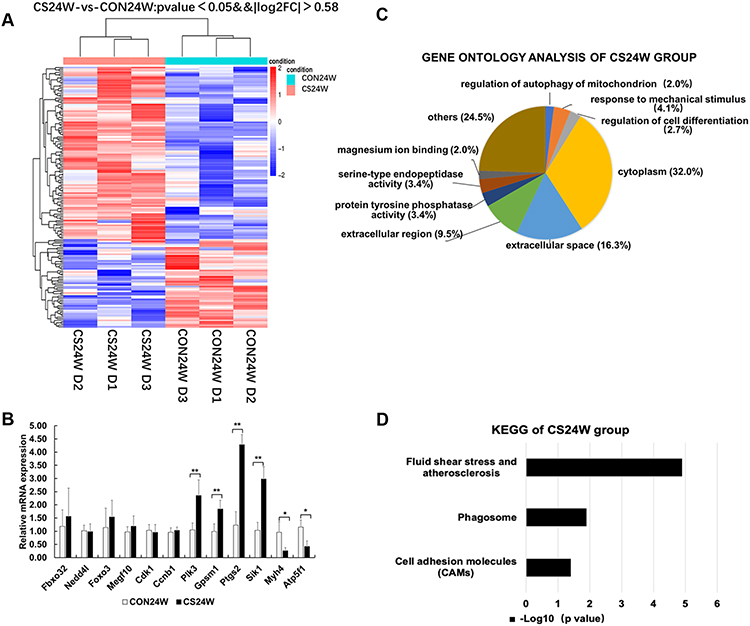 |
Figure 4 Hierarchical clustering, Go Ontology, KEGG pathway analysis and real-time PCR verification of rat diaphragms muscle from CON24W and CS24W. (A) Hierarchical clustering revealed that gene expression profiles were separated based on 24W of CS exposure. (B) Real-time PCR verification of two differential genes and six non-differential genes, confirming the results of the mRNA levels of genes of interest revealed by microarray. Data presented as mean±SD, * P<0.05 and **P<0.01 vs control group; n=6 per group. (C) Gene Ontology analysis showed the mostly affected biological process, cellular component, and molecular function. Significantly enriched GO terms from differentialgenes in the CS24W group included regulation of autophagy of mitochondrion and regulation of cell differentiation in biological processes, cytoplasm in cellular components, protein tyrosine phosphatase activity and serine-type endopeptidase activity in molecular functions, respectively. (D) KEGG pathway analysis demonstrated that several pathways were regulated by CS exposure. The top 20 pathways of enrichment analysis KEGG differential genes in the CS24W group included phagosome (four up-regulated genes). |
GO analysis showed differential functional enrichment terms regulated by CS exposure (Figures 3C and 4C). In CS12W diaphragms, the most significant enrichment GO terms were the positive regulations of cell migration, angiogenesis, and mitotic cell cycle in biological process and cell surface, external the side of plasma membrane and microtubule in cellular components, ATP binding, protein kinase binding, and ATPase activity in molecular functions. Of note, Fbxo32 (Atrogin-1) and Nedd4l, the genes responsible for the ubiquitin-dependent protein catabolic process, were down-regulated; Megf10, the gene responsible for muscle cell proliferation, were up-regulated; Cdk1 and Ccnb1, the genes responsible for cell cycle progression, were also up-regulated (Supplementary Table S5). All of the above suggested CS-exposure enhanced cell proliferation and energy metabolic activity as well as deregulated protein degradation in the early stage of COPD.
In CS24W diaphragms, significantly enriched GO terms from differentially genes included the regulations of mitochondrion autophagy and cell differentiation in the biological process, cytoplasm in cellular components, and protein tyrosine phosphatase activity and serine-type endopeptidase activity in molecular functions (Figure 4C). Notably, Plk3 and Gpsm1 genes that positively regulate autophagy and protein degradation were both up-regulated, suggesting that 24 weeks of CS exposure enhanced the protein catabolic process (Supplementary Table S6).
The top 20 pathways of enrichment analysis KEGG differential genes in the CS12W group included phagosome (eight up-regulated and 18 down-regulated genes) and cell cycle (14 up-regulated and one down-regulated) (Figure 3D, Supplementary Figure S1 and Supplementary Table S7). The phagosome pathway involved in apoptosis and protein degradation was mainly down-regulated, while the cell cycle pathway involved in cell division and proliferation was mainly up-regulated. Moreover, the PI3K-Akt signaling pathway and FOXO signaling pathway involved in the protein degradation and muscle atrophy were presented in KEGG enrichment analysis. Conversely, in the CS24W group, the top 20 pathways of enrichment analysis KEGG differential genes showed an enhanced phagosome pathway (four up-regulated genes) (Figure 4D, Supplementary Figure S2 and Supplementary Table S8). These distinct observations in CS12W versus CS24W groups suggested that diaphragm muscle underwent transcriptional profile changes accompanied with the transition from compensation to decompensation in function and structure in response to CS exposure.
Discussion
In this study, we analyzed the structural and functional changes of the diaphragm in a CS-induced COPD rat model and we further explored the transcriptional profile changes in these diaphragms. Our studies indicated the key findings: 1) the diaphragm functional assays including force–frequency curves and FI indicated that 12 weeks of CS exposure induced a compensation of diaphragm muscle contraction, while the 24 weeks of CS exposure deteriorated diaphragm muscle contractile function; 2) consistent with these functional changes, mitochondrial volume density and mitochondrial number density in diaphragm muscle were increased in CS12W rats, while it was decreased in CS24W rats; 3) the diaphragm transcriptomic profiling results showed that gene expressions of cell proliferation and energy metabolic activity were enhanced and gene expression of the protein degradation pathways was attenuated in the CS12W diaphragm, while the CS24W diaphragm showed opposite changes of these processes. These observations suggest that the diaphragm muscle is undergoing a transition from compensatory to decompensatory changes in function, structure, and gene expression profile during the development of COPD; these findings will advance the knowledge of pathogenesis of COPD in diaphragm dysfunction other than pulmonary deleterious changes.
COPD Model Establishment
Airflow obstruction is a key pulmonary functional characteristic of COPD, and emphysema was a typical lung histopathological change of COPD.1 The present results revealed that FEV0.3/FVC (the critical parameter of airflow obstruction) was declined in our rat COPD model. Additionally, histological assay showed enlargement of air spaces with significantly decreased alveolar number, along with obvious inflammatory infiltration in these lungs. All these features suggested that establishment of a COPD rat model with CS-exposure was successful. Furthermore, compared to the CS12W group, the CS24W group presented as more increased in MLI and decreased in MAN and FEV0.3/FVC, suggesting longer CS exposure caused severe COPD. Since diaphragm force is decreased and COPD incidence is increased with aging,1,21,22 we especially set each CS group with an age-matching control group to be compared to reduce the effect of aging on the diaphragm changes in the present study.
Fatigue Resistant Enhanced in the Diaphragm of Early Stage of COPD
Previous studies demonstrated that CS-exposure promoted the transition of diaphragm muscle fiber types from fatigue-sensitive type II fibers to fatigue-resistant type I fibers with an abundance of mitochondria.7,10–12,16,23 In line with these studies, we found that FI was improved in the CS12W group, accompanied with the increased proportion of type I fibers and mitochondrial number and volume density. Furthermore, the diaphragm muscle, as a type of skeletal muscle, can undergo an adaptive transition to maintain respiratory homeostasis, in response to pathophysiological stressors.6,12 In our COPD rats with CS-exposure-induced emphysema and decreased pulmonary ventilation, the diaphragm also underwent an adaptive transition in the early stage of COPD against chronic increased mechanical load, indicated by enhanced anti-fatigue capacity and maintained force–frequency curves. The further ultrastructural analyses showed that such an adaptive transition was likely associated with increased mitochondrial number and energy metabolic activity.
Decreased Protein Degradation is Associated with Compensatory Mechanism in Early COPD Stage
Previous studies suggested that the strong compensatory capacity of the diaphragm in the early stage of COPD could be associated with a decrease in protein degradation and an increase in muscle mass.13 E3 Ub-ligase intermediated phagosome-lysosomal pathway has been indicated as the major protein degradation pathway to cause atrophy in diaphragm cells.7,8,13,23–25 The muscle-specific E3 Ub-ligases, Atrogin-1, is essential for muscle atrophy under various conditions and its expression is regulated by FOXO signaling.23,24,26 Nedd4 was another E3 Ub-ligase involved in the protein degradation for muscle atrophy.23 Doucet et al13 found that mRNA expressions of Atrogin-1 and FOXO were decreased in the diaphragm compared with the quadriceps in COPD, suggesting that compensatory mechanisms were likely involved with decreased protein degradation in COPD. Consistently, our transcriptomic analyses also indicated down-regulated genes of the phagosome pathway, including Atrogin-1, Nedd4l, and Foxo-3, in CS12W diaphragms, suggesting the decrease in protein degradation was associated with diaphragms compensational changes. Furthermore, it has been demonstrated that PI3K-AKT signaling can inhibit FOXO transcription factors leading to down-regulation of Atrogin-1.24 Interestingly, our transcriptomic results showed an attenuated function of PI3K-AKT pathway accompanied with decreased expressions of Atrogin-1 and FOXO in the CS12W group, implying the involvement of PI3K-AKT-FOXO axis in diaphragms compensation during earlier COPD.
Decompensatory Mechanisms in the Diaphragm at the Late Stage of COPD
The decline in diaphragm muscle strength and endurance is one of the typical features for COPD advancement, leading to exacerbated respiratory failure.3,4,10,11,23 Previous findings suggested that CS-induced diaphragmatic muscle atrophy and weakness was associated with abnormal mitochondria including swelling and vacuolization, which might account for deregulated apoptosis.9 Herein, our CS24W rats also showed declined diaphragm force generation and fatigue resistant capacity vs the CS12W diaphragm. The TEM observation showed a decreased number of mitochondria in CS24W with visible giant mitochondria and vacuolar-like changes, implying a deregulation of mitochondrial autophagy. These finding suggested the significance of mitochondria disorder in the diaphragm atrophy and dysfunction at the decompensatory stage of the diaphragm.
Our transcriptomic GO analyses further showed that the genes associated with mitochondrial autophagy and cell differentiation were significantly enriched in the CS24W group. The top 20 pathways of enrichment analysis KEGG differential genes also showed up-regulated phagosome pathways, which indicated that the protein degradation and apoptosis were enhanced. Notably, Plk3 and Gpsm1 genes that positively regulated autophagy and protein degradation were both upregulated, suggesting that 24 weeks of CS-exposure enhanced the protein catabolic process. These RNA-Seq results in CS24W diaphragm were consistent with previous studies, in which the transcription of genes involving the diaphragm functional and biology process were attenuated in the advanced stage of COPD.4,9,12
Conclusion
In summary, 12 weeks of CS exposure induced a compensation of diaphragm muscle including enhanced contraction, increased mitochondrial number density and volume density, upregulated transcriptions for energy metabolic activity, and downregulated transcriptions for protein degradation. However, CS exposure for 24 weeks caused decompensatory outcomes including deteriorated diaphragm muscle contraction, abnormal mitochondria, and enhanced transcriptions for protein degradation. These observations suggested that the diaphragm underwent a transition from adaptive to maladaptive changes in function, structure, and gene expression during the development of COPD.
Acknowledgments
This research did not receive any specific grant from funding agencies in the public, commercial, or not-for-profit sectors.
Disclosure
The authors declare that there are no conflicts of interest.
References
1. Global strategy for the diagnosis, management, and prevention of chronic obstructive pulmonary disease (2020 report). Global initiative for chronic obstructive lung disease.2020. Available from https://goldcopd.org/gold-reports/.
2. Barreiro E, Gea J. Respiratory and limb muscle dysfunction in COPD. COPD. 2015;12(4):413–426. doi:10.3109/15412555.2014.974737
3. Vilaro J, Ramirez-Sarmiento A, Martinez-Llorens JM, et al. Global muscle dysfunction as a risk factor of readmission to hospital due to COPD exacerbations. Respir Med. 2010;104(12):1896–1902. doi:10.1016/j.rmed.2010.05.001
4. Souza RMP, Cardim AB, Maia TO, et al. Inspiratory muscle strength, diaphragmatic mobility, and body composition in chronic obstructive pulmonary disease. Physiother Res Int. 2019;24(2):e1766. doi:10.1002/pri.1766
5. Gea J, Agusti A, Roca J. Pathophysiology of muscle dysfunction in COPD. J Appl Physiol. 2013;114(9):1222–1234. doi:10.1152/japplphysiol.00981.2012
6. Lewis P, O’Halloran KD. Diaphragm muscle adaptation to sustained hypoxia: lessons from animal models with relevance to high altitude and chronic respiratory diseases. Front Physiol. 2016;7:623. doi:10.3389/fphys.2016.00623
7. Zhang Y, Gao J, Luo Y. The effect of various durations of cigarette smoke exposure on muscle fibre remodeling in rat diaphragms. Biomed Pharmacother. 2019;117:109053. doi:10.1016/j.biopha.2019.109053
8. van Hees H, Ottenheijm C, Ennen L, et al. Proteasome inhibition improves diaphragm function in an animal model for COPD. Am J Physiol Lung Cell Mol Physiol. 2011;301(1):L110–116.
9. Zhou X, Yi D, Wu Y, et al. Expression of diaphragmatic myostatin and correlation with apoptosis in rats with chronic obstructive pulmonary disease. Exp Ther Med. 2018;15(3):2295–2300.
10. Levine S, Bashir MH, Clanton TL, et al. COPD elicits remodeling of the diaphragm and vastus lateralis muscles in humans. J Appl Physiol. 2013;114(9):1235–1245. doi:10.1152/japplphysiol.01121.2012
11. Ottenheijm CA, Heunks LM, Dekhuijzen RP. Diaphragm adaptations in patients with COPD. Respir Res. 2008;9:12. doi:10.1186/1465-9921-9-12
12. Doucet M, Debigare R, Joanisse DR, et al. Adaptation of the diaphragm and the vastus lateralis in mild-to-moderate COPD. Eur Respir J. 2004;24(6):971–979. doi:10.1183/09031936.04.00020204
13. Doucet M, Dube A, Joanisse DR, et al. Atrophy and hypertrophy signalling of the quadriceps and diaphragm in COPD. Thorax. 2010;65(11):963–970. doi:10.1136/thx.2009.133827
14. Nucci RAB, de Souza RR, Suemoto CK, et al. Cigarette smoking impairs the diaphragm muscle structure of patients without respiratory pathologies: an autopsy study. Cell Physiol Biochem. 2019;53:648–655.
15. van Lunteren E. Effects of genetic obesity on rat upper airway muscle and diaphragm contractile properties. Eur Respir J. 1996;9(10):2139–2144.
16. Levine S, Gregory C, Nguyen T, et al. Bioenergetic adaptation of individual human diaphragmatic myofibers to severe COPD. J Appl Physiol. 2002;92(3):1205–1213. doi:10.1152/japplphysiol.00116.2001
17. Hoppeler H, Mathieu O, Krauer R, et al. Design of the mammalian respiratory system. VI Distribution of mitochondria and capillaries in various muscles. Respir Physiol. 1981;44(1):87–111. doi:10.1016/0034-5687(81)90078-5
18. Bolger AM, Lohse M, Usadel B. Trimmomatic: a flexible trimmer for Illumina sequence data. Bioinformatics. 2014;30(15):2114–2120. doi:10.1093/bioinformatics/btu170
19. Anders S, Huber W. Differential expression of RNA-Seq data at the gene level-the DESeq package. EMBL. 2013.
20. Kanehisa M, Araki M, Goto S, et al. KEGG for linking genomes to life and the environment. Nucleic Acids Res. 2008;36(Database issue):D480–484. doi:10.1093/nar/gkm882
21. Greising SM, Ermilov LG, Sieck GC, et al. Ageing and neurotrophic signalling effects on diaphragm neuromuscular function. J Physiol. 2015;593(2):431–440. doi:10.1113/jphysiol.2014.282244
22. Greising SM, Mantilla CB, Gorman BA, et al. Diaphragm muscle sarcopenia in aging mice. Exp Gerontol. 2013;48(9):881–887. doi:10.1016/j.exger.2013.06.001
23. Testelmans D, Crul T, Maes K, et al. Atrophy and hypertrophy signalling in the diaphragm of patients with COPD. Eur Respir J. 2010;35(3):549–556. doi:10.1183/09031936.00091108
24. Sandri M, Sandri C, Gilbert A, et al. Foxo transcription factors induce the atrophy-related ubiquitin ligase atrogin-1 and cause skeletal muscle atrophy. Cell. 2004;117(3):399–412. doi:10.1016/S0092-8674(04)00400-3
25. Doucet M, Russell AP, Leger B, et al. Muscle atrophy and hypertrophy signaling in patients with chronic obstructive pulmonary disease. Am J Respir Crit Care Med. 2007;176(3):261–269. doi:10.1164/rccm.200605-704OC
26. Langen RC, Gosker HR, Remels AH, et al. Triggers and mechanisms of skeletal muscle wasting in chronic obstructive pulmonary disease. Int J Biochem Cell Biol. 2013;45(10):2245–2256. doi:10.1016/j.biocel.2013.06.015
 © 2020 The Author(s). This work is published and licensed by Dove Medical Press Limited. The full terms of this license are available at https://www.dovepress.com/terms.php and incorporate the Creative Commons Attribution - Non Commercial (unported, v3.0) License.
By accessing the work you hereby accept the Terms. Non-commercial uses of the work are permitted without any further permission from Dove Medical Press Limited, provided the work is properly attributed. For permission for commercial use of this work, please see paragraphs 4.2 and 5 of our Terms.
© 2020 The Author(s). This work is published and licensed by Dove Medical Press Limited. The full terms of this license are available at https://www.dovepress.com/terms.php and incorporate the Creative Commons Attribution - Non Commercial (unported, v3.0) License.
By accessing the work you hereby accept the Terms. Non-commercial uses of the work are permitted without any further permission from Dove Medical Press Limited, provided the work is properly attributed. For permission for commercial use of this work, please see paragraphs 4.2 and 5 of our Terms.