")
Back to Journals » Neuropsychiatric Disease and Treatment » Volume 18
Functional Connectivity Density in the Sensorimotor Area is Associated with Sleep Latency in Patients with Primary Insomnia
Authors Ji B, Dai M, Guo Z, Li J, Cao Y, Zhang Z , Zhang Y, Liu X
Received 13 September 2021
Accepted for publication 23 November 2021
Published 4 January 2022 Volume 2022:18 Pages 1—10
DOI https://doi.org/10.2147/NDT.S338489
Checked for plagiarism Yes
Review by Single anonymous peer review
Peer reviewer comments 3
Editor who approved publication: Dr Taro Kishi
Bin Ji,1 Min Dai,2 Zhongwei Guo,3 Jiapeng Li,4 Yulin Cao,4 Zhenzhong Zhang,3 Yan Zhang,3 Xiaozheng Liu2
1Department of Anesthesiologyand Perioperative Medicine, The Second Affiliated Hospital and Yuying Children’s Hospital of Wenzhou Medical University, Wenzhou, Zhejiang, 325027, People’s Republic of China; 2Department of Radiology of the Second Affiliated Hospital and Yuying Children’s Hospital, Wenzhou Medical University, Wenzhou, Zhejiang, 325027, People’s Republic of China; 3The Sleep Medical Center of Tongde Hospital of Zhejiang Province, Hangzhou, Zhejiang, 310012, People’s Republic of China; 4Department of Radiology of Tongde Hospital of Zhejiang Province, Hangzhou, Zhejiang, 310012, People’s Republic of China
Correspondence: Yan Zhang
The Sleep Medical Center of Tongde Hospital of Zhejiang Province, No. 234 Gucui Road, Hangzhou, Zhejiang, 310012, People’s Republic of China
Email [email protected]
Xiaozheng Liu
Department of Radiology of the Second Affiliated Hospital and Yuying Children’s Hospital, Wenzhou Medical University, No. 109 Xueyuan West Road, Wenzhou, Zhejiang, 325027, People’s Republic of China
Email [email protected]
Objective: It is unclear whether the patterns of functional connectivity density (FCD) differ between patients with primary insomnia (PI) and healthy subjects. In the present study, we investigated the features of FCD in patients with PI using resting-state functional MRI (rsfMRI).
Methods: rsfMRI datasets of 32 patients with PI and 34 healthy controls (HCs) were obtained using a 3-Tesla scanner. FCD analysis was performed to compare voxels with abnormal whole-brain functional connectivity with other voxels among patients with PI and HCs. Abnormal brain regions were then used as seed points for FC analysis.
Results: Compared with HCs, patients with PI exhibited significantly decreased FCD in the left medial frontal gyrus and increased FCD in the left supplementary motor area (SMA). With the left medial frontal gyrus as the seed point, patients with PI showed decreased FC between the left medial frontal gyrus and the left fusiform gyrus compared with HCs. With the left SMA as the seed point, patients with PI exhibited increased FC between the left SMA and the right anterior cingulate gyrus. Correlation analysis revealed that the increased FCD values in the left SMA were positively correlated with sleep latency in patients with PI.
Conclusion: Default-mode network and SMA dysfunctions may be related to the pathophysiology of PI.
Keywords: primary insomnia, resting-state functional magnetic resonance imaging, functional connectivity density
Introduction
Insomnia is a common sleep disorder characterized by difficulty in falling or maintaining sleep or by nonrestorative sleep, engendering significant daytime symptoms. Its prevalence ranges from 10% to 15% in the general population and from 33% to 50% in the adult population.1 Studies show that insomnia is an independent risk factor for suicide and substance abuse2 and is associated with the impairment of occupational functions.3 Furthermore, insomnia poses a substantial population-level burden in self-assessed health.4 However, selecting an appropriate therapeutic strategy for patients with insomnia remains challenging for clinicians.5 Therefore, exploring the underlying neural mechanisms may be helpful for understanding the pathological processes and selecting the appropriate intervention strategy for insomnia.6,7
At the global brain level, sleep is regulated by coordinated wake and sleep brain networks, including wake- and sleep-promoting pathways.8 Dysregulation within these networks may cause insomnia.9 Functional magnetic resonance imaging (fMRI) is a promising imaging modality that can be used to noninvasively assess neuroelectric activity by measuring blood oxygen levels in the brain. FMRI has been used to explore the neural circuit mechanisms of insomnia. Li et al10 reported that patients with primary insomnia (PI) had smaller thalamus volumes than healthy controls (HCs). When using the thalamus as the seed point for functional connectivity (FC) analysis, the thalamus showed reduced FC with the hippocampus, caudate, and putamen. Further correlation analysis showed that FC was correlated with sleep quality based on the Pittsburgh Sleep Quality Index (PSQI). Taking the right smaller nucleus accumbens (NAc) as the seed point, Shao et al7 reported that patients with insomnia had increased FC between the NAc and medial prefrontal cortex (mPFC), anterior cingulate cortex (ACC), olfactory cortex, paracingulate cortex, and caudate. Meanwhile, the occipital and temporal gyri showed decreased FC with NAc. In addition, the increased FC between the NAc and mPFC was significantly correlated with the total PSQI scores. From the FC analysis based on the seed points of right middle frontal and right inferior frontal gyri, Xie et al11 reported that, compared with HCs, patients with PI had weakened FC between the right inferior parietal gyrus and the right medial frontal cortex and between the left orbitofrontal cortex and right inferior frontal gyrus. The FC between the right medial frontal cortex and right inferior parietal gyrus was correlated with the severity of insomnia based on the Self-Rating Scale of Sleep. The FC between the right inferior frontal gyrus and left orbitofrontal cortex was correlated with the severity of insomnia and negative emotion. These studies revealed that many abnormal brain regions are parts of the default-mode network (DMN). However, seed-based FC reflects the FC strength between two brain regions. The FC strength is an important index reflecting the functional coordinate activities in related brain regions that subsequently influence the functional activity of the entire brain. In addition to connectivity strength, examining the number of functional connections plays a key role in exploring the aberrant FC of the brain.12 Therefore, FC analysis is useful for investigating region-specific brain functions, but it cannot be used to measure changes in the whole-brain functional network at the voxel level.13
FC density (FCD) is a data-driven approach that reflects the number of connections that one voxel has to any other voxel or all voxels in the entire brain and can be used to quantitatively analyze the FC pattern of each voxel in the whole brain that may be missed by seed-driven approaches.14 FCD analysis has been applied in studies of several mental disorders, such as obsessive–compulsive disorder,12 schizophrenia,15 bipolar disorder,16 and major depressive disorder.17 It has also been used to assess electroconvulsive therapy in major depressive disorder18 and for the diagnostic differentiation between patients with depression and those with schizophrenia.15 Gong et al19 investigated the FCD characteristics of insomnia symptoms in patients with major depressive disorder and found that the group with lower-level insomnia had higher FCD in the bilateral parahippocampal/hippocampal gyri and lower FCD in the left inferior temporal gyrus than the group with higher-level insomnia. FCD in the inferior temporal gyrus and bilateral parahippocampal/hippocampal gyri was associated with the severity of insomnia, and the global FCD in the left anterior bilateral parahippocampal/hippocampal gyri was correlated with depressive symptoms.
In the present study, we investigated differences in FCD between patients with PI and HCs. We also examined the correlations between FCD and sleep behaviors in patients with PI. Based on the previous findings of abnormal FC in patients with PI, we hypothesized that PI is associated with altered FCD in regions critical to the DMN.20,21
Materials and Methods
Subjects
All subjects were recruited from July 2018 to August 2019. Subjects with PI met the following inclusion criteria: (1) diagnostic criteria of the International Classification of Sleep Disorders, second edition,22 including (i) sleep disturbances, such as difficulty in initiating or maintaining sleep or nonrestorative sleep, as the predominant complaint; (ii) sleep disturbances leading to functional impairment; and (iii) sleep disturbances that did not coexist with mental disorders; (2) right handed; (3) aged 18–60 years; and (4) >9 years of education. Subjects with PI fulfilling the following exclusion criteria were excluded: (1) abnormal signals on head MRI, (2) history of substance abuse or psychiatric disease, (3) women who were pregnant, or (4) taking hypnotic drugs. HCs enrolled in this study met the following criteria: (1) insomnia score according to the Athens Insomnia Scale (AIS) of <6, (2) no brain lesions as verified by conventional T1 or T2 fluid-attenuated inversion recovery MRI, (3) aged <60 years, (4) no history of psychiatric or neurological diseases, and (5) women who were not pregnant.
The PSQI23 and AIS24 were used to evaluate sleep quality. The PSQI comprises 19 self-rated items and 7 subcomponents: (1) sleep quality (1 item), (2) sleep latency (2 items), (3) sleep duration (1 item), (4) sleep efficiency (3 items), (5) sleep disturbance (9 items), (6) sleep medication (1 item), and (7) daily dysfunction (2 items). Each subcomponent is scored on a 0–3 scale. The cumulative score of each component is the total score of the PSQI, which ranges from 0 to 21. The higher the score, the worse the sleep quality. The AIS is a sleep self-assessment tool. According to the respondent’s own situation, they choose the suitable options, ie, the situations they have experienced at least three times a week in the past month. There are eight questions in total, the first five focuses on the assessment of night sleep and the last three focuses on the assessment of daytime function. Each score ranges from none to severe and is divided into four grades: 0, 1, 2, and 3. The total score is categorized as <4, no sleep disorder; 4–6, suspicious insomnia; and >6, insomnia.
Experienced psychiatrists performed the clinical evaluations of all subjects. The study was conducted in accordance with the Declaration of Helsinki and was approved by the Ethics Committee of Tongde Hospital of Zhejiang Province. All participants provided written informed consent before enrollment.
MRI Scan
We acquired functional images (200 volumes, 33 axial slices, 4.8-mm thickness with no gap, 64×64 matrix, 2000-ms repetition time, 30-ms echo time, 90° flip angle, and 200 × 200-mm2 field of view) and high-resolution T1-weighted anatomical images (repetition time/echo time = 1.900/2.48 ms, flip angle = 9°, 128 slices, field of view = 256×256 mm2, 1 × 1×1 mm3 resolution) using a 3-Tesla Siemens scanner (Siemens Magnetom Verio; Siemens Medical Systems, Erlangen, Germany). During the MRI scan, subjects were instructed to close their eyes and to not fall asleep.
Data Processing
Data preprocessing was conducted using the DPABI toolbox v4.0 (http://rfmri.org/DPABI). Preprocessing of functional images included deleting the first 10 volumes, slice timing, and realigning. Participants with >2 mm of maximal translation of x, y, or z and 2° of maximal rotation were excluded from the analyses. Normalization into the Montreal Neurological Institute space and smoothing (6 mm full width at half maximum) were performed, followed by detrending and temporal filtering with typical temporal bandpass (0.01–0.08 Hz). To remove spurious signals, head motion parameters, cerebrospinal fluid, and white matter were regressed out of each voxel’s time series.
Head Motion Analysis
To evaluate the effect of head movement on the results, we calculated the mean relative root mean square and mean framewise displacement power (FD_power) of head movement.25 We performed a two-sample t-test on the head movement parameters of the two groups to compare the differences between them.
FCD Analysis
We performed whole-brain FCD analysis on the preprocessed fMRI data. Using a gray matter mask, we calculated the functional connection between each gray matter voxel and other voxels via Pearson’s correlation analysis. FC mapping of the whole brain was performed for each subject.26 The FCD for a given voxel was computed as the sum of the FC values at the individual level by thresholding each correlation at r > 0.25. Finally, Fisher Z-transformation was performed on the FCD images to make them normally distributed. For stability and repeatability, we considered only the positive values for the FCD.
Seed-Based FC Analysis
We conducted seed-based FC analysis to identify the brain regions causing FCD abnormalities. We then selected these abnormal regions as seed points. The ROI was a small spherical region with a radius of 6 mm, with the center at the peak point. FC analysis was performed using REST software (www.restfmri.net). We calculated seed-based FC using Pearson’s correlation analysis between the seed point and other brain regions. The correlation coefficients were transformed into a Z-score by Fisher Z-transformation to improve the normality of the seed-based FC maps.
Statistical Analysis
We performed statistical analysis using DPABIv4.0 (http://www.rfmri.org/dpabi). Two-sample t-tests were conducted on the individual normalized FCD or FC maps in a voxel-by-voxel manner between the two groups. To reduce the influence of confounding factors in statistical analysis, the mean relative displacements of head motion, age, and sex were set as covariates. Finally, the statistical threshold was set at p < 0.05 (3dClustSim corrected for multiple comparisons, with an uncorrected individual voxel p < 0.005 with a cluster size > 30 voxels).
Relationship of FCD with Clinical Variables
To examine the correlation between clinical symptoms and FCD values in patients with PI, we performed Pearson’s correlation analysis between the mean FCD signal of abnormal brain regions and clinical variables in these patients (p < 0.05, FDR correct).
Results
General Clinical Data
In total, 32 patients with PI and 34 HCs were included in this study. There were no significant differences between the PI and HC groups in terms of age (t = 0.898, p = 0.376), sex distribution (χ2 = 0.161, p = 0.735), or years of education (t = 0.464, p = 0.645). The PSQI scores were higher in the PI group than in the HC group (12.03 ± 3.56 vs 2.06 ± 1.41, p < 0.01). Table 1 presents the principal demographic and psychological characteristics of the two groups.
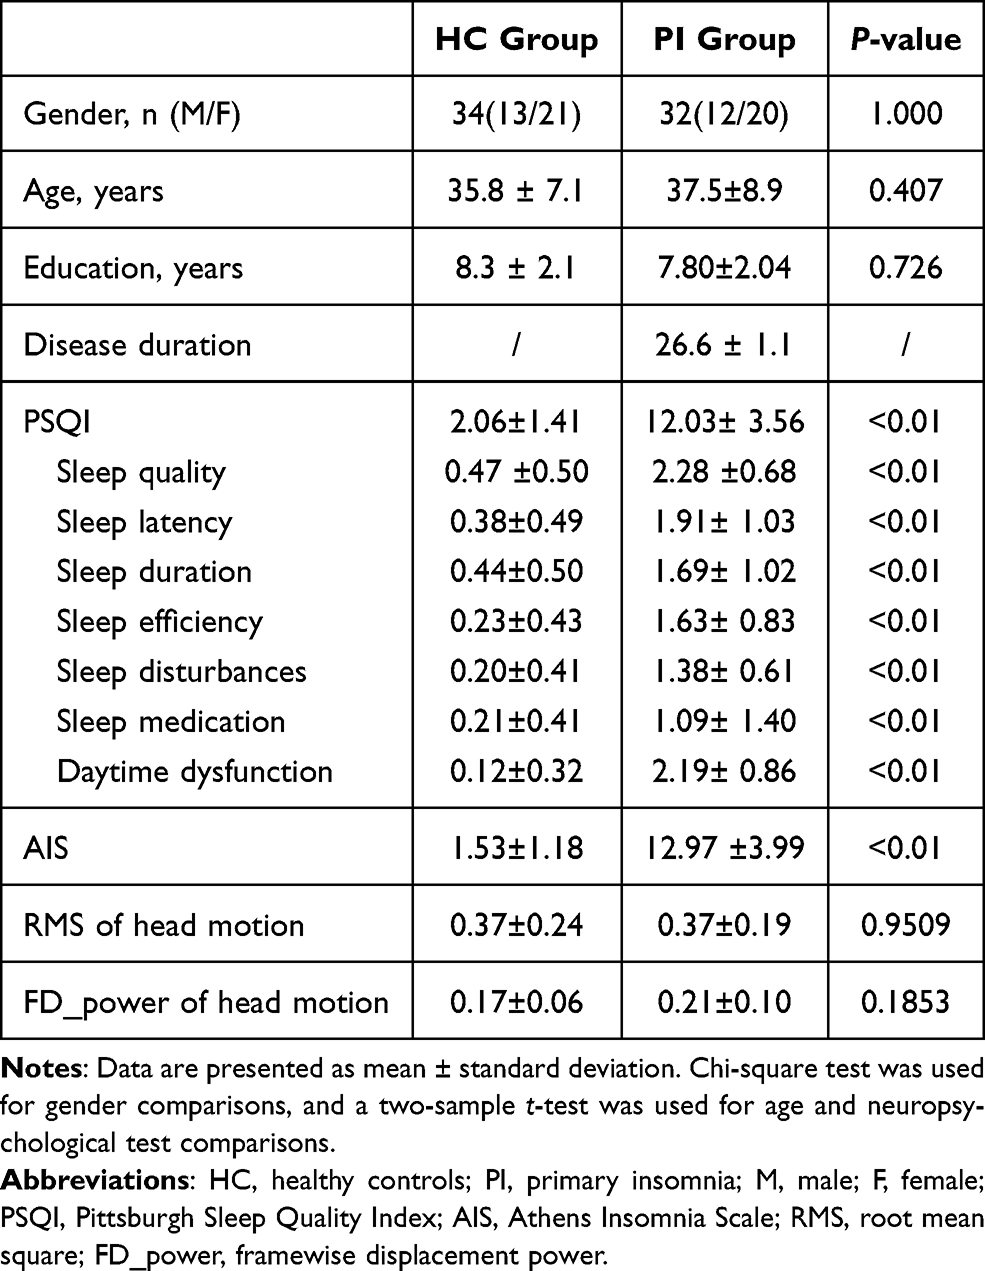 |
Table 1 Demographic and Neuropsychological Data |
Results of the Head Motion Analysis
There was no significant difference between the two groups in mean motion based on the two-sample t-test. The t and p values for the relative root mean square were −0.0618 and 0.9509, respectively. For the mean FD_power, the values were t = −1.3363 and p = 0.1853.
Differences in FCD Values Between the PI and HC Groups
Group analysis revealed that patients with PI exhibited significantly decreased FCD in the left mPFC and increased FCD in the left supplementary motor area (SMA) compared with HCs (Table 2 and Figure 1).
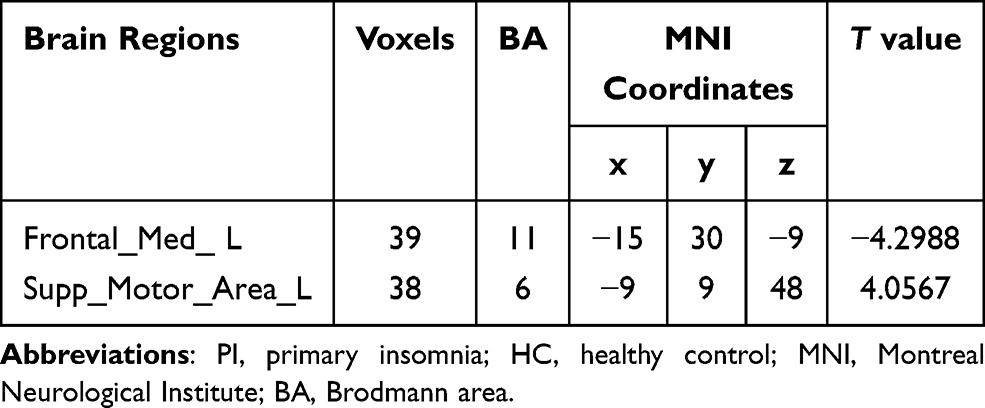 |
Table 2 Brain Regions with Significantly Different FCD Values Between the PI and HC Groups |
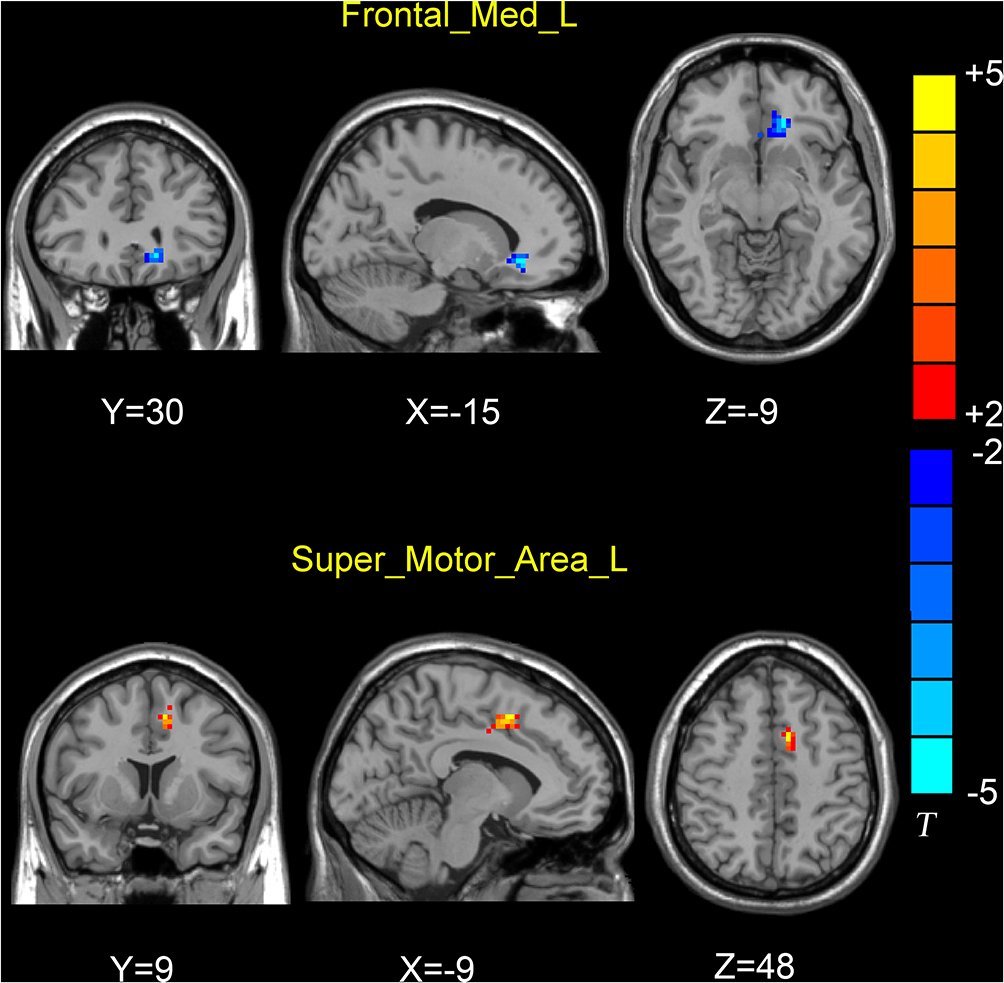 |
Figure 1 Brain regions showing differences in FCD values between the PI and HC groups (P < 0.005, 3dClusSim correction). T-value bar is shown on the right. MNI coordinates is shown on the bottom of brain regions. Hot and cold colors indicate higher and lower FCD in the PI than in the HC groups, respectively. Compared with HC subjects PI patients exhibited significantly decreased FCD in the left medial prefrontal cortex and increased FCD in the left supplementary motor area. |
Comparison of Seed-Based FC Between the PI and HC Groups
In whole-brain FC analysis with the left medial frontal gyrus as the seed point, patients with PI displayed decreased FC between the left mPFC and left fusiform gyrus (FG) compared with HCs. In whole-brain FC analysis with the left SMA as the seed point, patients with PI exhibited increased FC between the left SMA and right ACC (Figure 2).
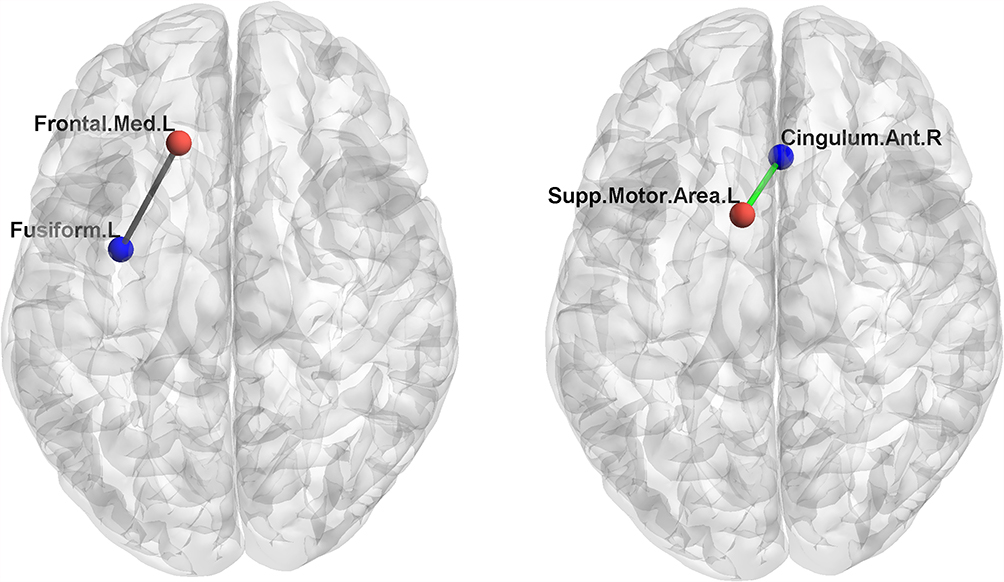 |
Figure 2 Brain regions showing changes in functional connectivity (FC) values in the PI group, compared with the HC group. Seed points are marked in red, and the brain regions displaying differences in FC are marked in blue. The decreased FC was displayed as gray edge, and increased FC was displayed as green edge. The functional connections between the seed points and the different brain regions are displayed as gray lines (FC, PI < HC; P < 0.005, 3dClusSim correction). Left figure: whole-brain FC analysis with the left medial frontal gyrus as the seed point, PI patients displayed decreased FC between the left medial prefrontal cortex and the left fusiform gyrus compared with HCs. Right figure: whole-brain FC analysis with the left supplementary motor area as the seed point, PI patients exhibited increased FC between the left supplementary motor area and the right anterior cingulum cortex. |
Correlations of FCD with Neuropsychological Performance in the PI Group
The FCD values in the left SMA were positively correlated with sleep latency (p = 0.0340, r = 0.4189; Figure 3).
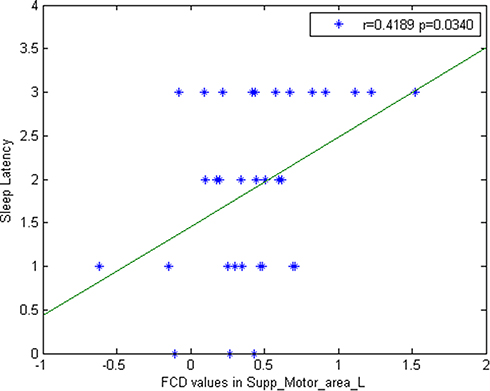 |
Figure 3 The correlation between FCD values in the SMA and sleep latency in PI patients. Significantly positive correlation was found between these two measures in PI patients (p = 0.0340, FDR corrected). |
Discussion
In this study, we investigated whole-brain FCD and FC in patients with PI. Using FCD analysis, we found that, compared with HCs, patients with PI showed changes in FCD in the left mPFC and SMA. FC analysis showed that, compared with HCs, patients with PI had decreased FC between the left mPFC and left FG and increased FC between the left SMA and right ACC. FCD values in the left SMA were positively correlated with sleep latency. Consistent with the findings of previous studies, our results suggest that the mPFC and SMA are important nodes in the neural substrate of sleep disorders. Using the same FCD method, Yang et al27 conducted a sleep deprivation study. After 36 hours of sleep deprivation, healthy participants showed decreased long/short-range FCD in the mPFC and increased long/short-range FCD in sensory integration and arousal-regulating areas, including the occipital–temporal cortex. Another sleep deprivation study showed that, compared with rested wakefulness status, subjects with sleep deprivation status had decreased short FCD in the right orbitofrontal cortex and increased short FCD in the bilateral precentral gyrus.28 From their data on insomnia, Zhou et al29 reported that patients with chronic insomnia disorder primarily exhibited alterations in FCD in the left dorsal ACC, left dorsal mPFC (dmPFC), SMA, temporal regions, and basal ganglia. Zhu et al30 also found that patients with PI showed lower FCD in ACC and that the lower FCD values of the left ACC were associated with their anxiety level.
The mPFC is an important brain node responsible for regulating emotion and cognitive processes.31 The left mPFC has been shown to play an important role in sleep. Studies using magnetoencephalography found that left dmPFC activity increased the most during rapid eye movement and deep non-rapid eye movement sleep,32 whereas sleep slow waves originated preferentially in the left frontal sulcus and cingulate gyrus.33 Using resting-state fMRI and the regional homogeneity method, Pang et al34 reported that regional homogeneity values in the mPFC were significantly decreased in patients with chronic insomnia disorder compared with controls. Using the FC strength method, Huang et al35 found that patients with chronic insomnia disorder exhibited decreased FC strength primarily in the dorsolateral PFC and mPFC. From a study of 192 patients with focal brain lesions, Koenigs et al36 found that insomnia was associated with damage to the left dmPFC. Longitudinal studies have shown that the PFC is involved in sleep processes. For example, after 4 weeks of pharmacologic intervention in patients with PI, Feng et al37 found that PSQI scores were decreased, and this was significantly associated with increased FC between the mPFC and hippocampus. Park et al38 reported that improved sleep quality after cognitive behavioral therapy was correlated with increased FC between the PFC and DMN. These previous studies, together with our present results, demonstrate that the mPFC is an important node in the neural mechanisms of insomnia.
The SMA is an important node in the sensorimotor network, which is the primary sensory area of the brain. Killgore et al39 studied the relationship between difficulty in initiating or maintaining sleep and FC in primary sensory processing and motor planning regions. Their results showed that difficulty in falling asleep was associated with increased FC between the primary visual cortex and other sensory regions, such as the SMA, primary auditory cortex, and olfactory cortex. The primary auditory cortex also showed greater connectivity with the SMA in those with sleep initiation problems. Their results are consistent with the predictions of the hyperarousal model of insomnia. Zabrecky et al40 demonstrated that patients with insomnia who received vibroacoustic stimulation showed significant improvement in measured sleep minutes and insomnia severity index questionnaire scores. Further, the FC in the vermis, cerebellar hemisphere, thalamus, SMA, NAc, and PFC showed significant changes. Studies show that the improvement in insomnia by transcranial magnetic stimulation is closely related to functional changes in the SMA.41,42 Indeed, the SMA is the preferred brain target of noninvasive brain stimulation for the treatment of chronic insomnia disorder.43 Our findings of FCD changes in the SMA are consistent with those of previous studies and suggest that the SMA is an important node in the neural substrate of insomnia.
Our results revealed that, compared with HCs, patients with PI had decreased FC between the left mPFC and left FG, suggesting that the mPFC and FG are involved in the mechanisms underlying insomnia and that there is a close relationship between these two structures.44,45 Yu et al46 reported that cortical thickness in the right orbitofrontal cortex and fusiform area was positively correlated with the severity of insomnia in the PI group. Patients with PI also exhibited increased regional homogeneity in the left insula, right anterior cingulate gyrus, bilateral precentral gyrus, and left cuneus and decreased regional homogeneity in the right middle cingulate cortex and left fusiform.47 Using the voxel-mirrored homotopic connectivity method, Li et al48 reported that, compared with healthy participants without insomnia symptoms, healthy participants with insomnia symptoms displayed significantly increased voxel-mirrored homotopic connectivity in the bilateral thalamus/posterior insula (including anterior insula), fusiform, middle cingulate gyrus, inferior parietal lobe, and postcentral gyrus. The voxel-mirrored homotopic connectivity values in the ACC were significantly positively correlated with sleep disturbance scores in all healthy participants. The investigators posited that insomnia is associated with the substantial impairment of interhemispheric coordination within the default-mode (ACC), salience (insula), hyperarousal (thalamus/posterior insula), and visual (fusiform) networks. Frank et al49 identified bidirectional connectivity between the amygdala, FG, and orbitofrontal cortex during naturalistic scene perception, suggesting that human emotion perception is formed in part by nonhierarchical causal interactions across these three regions. Bae et al50 found that emotion perception was associated with brain FC between the FG and the frontal and insular cortices. Geday et al51 reported on the existence of a neural network in the posterior fusiform and inferior occipital gyrus that is specialized in identifying emotionally important visual clues. Input from this area converges on the mPFC to be evaluated for relevance for attention. Therefore, in our study, the FC changes between the mPFC and FG may be related to emotion perception and attention in patients with PI.
Our results revealed that in patients with insomnia, the FC between the SMA and ACC is increased, which corroborates the findings of previous studies.52–54 Pang et al55 reported that FC strength between the left DMN and right SMA was negatively correlated with PSQI scores in participants with chronic insomnia disorder with accompanying cognitive dysfunction, indicating that the functional link between the SMA and DMN is involved in cognitive impairment in sleep disorder. The ACC is considered to mediate conscious information processing or high-capacity attention.53,56 The caudal part of the ACC adjacent to the SMA had increased activity in an auditory continuous performance task. Activity in this area is attributed to motor response and attention.56 Based on the Go/NoGo task with a warning stimulus using fMRI, Yanaka et al57 reported that both auditory and visual warning stimuli activated the midbrain, thalamus, and ACC extending to the pre-SMA, suggesting that the warning effect may be partly mediated by the potentiation of the pre-SMA through the midbrain–thalamus–ACC alerting network. These findings suggest that dysfunction of the DMN–SMA network may be associated with attention deficits and overactivity of the arousal systems in patients with PI.
Notably, we found that increased FCD values in the left SMA were positively correlated with sleep latency. Falling asleep is a complex process in which a series of psychophysiological changes represent the transition from wakefulness to sleep. It is characterized by a gradual decrease in responsiveness to external stimuli and an increase in behavioral calmness.58 Sleep difficulty is particularly common in young people, and sleep attacks are affected by psychological factors.59–61 Narisawa60 reported that Japanese university students with difficulty in sleep onset had higher body sensations, such as a feeling of a heavy stomach and frequent rolling over, unstable mental state, negative state, and stress. These anxiety-related factors at bedtime may delay sleep onset. Keilani et al62 reported that pain, especially pain intensity and affective pain, is associated with sleep quality, and that 1 point more in the total short-form McGill Pain Questionnaire score increased the odds of needing >30 minutes to fall asleep. Neuroimaging studies show that patients with social anxiety disorder have larger gray matter volume in the SMA63 and that the connectivity between the SMA and periaqueductal gray is related to disease duration in functional dyspepsia.64 Killgore et al39 reported that difficulty in falling asleep was associated with increased FC between the primary visual cortex and primary auditory cortex, olfactory cortex, and SMA. Actually, the SMA is mutually connected to the higher-order thalamic nucleus, the pulvinar in particular, which plays an important role in visual processing via pulvinar projection to the primary visual cortex65 and auditory processing through the superior colliculus–pulvinar–primary auditory cortex pathway.66 Kanemoto et al67 reported that in patients with dementia with Lewy bodies, total sleep time and bodily activity during sleep are associated with dysfunction of the pulvinar and parieto-occipital regions. Hansen et al68 reported the case of a 35-year-old woman with no prior comorbidities who developed severe and persistent hypersomnia with a long sleep time after a small right-sided MRI-verified thalamic stroke affecting the dorsal part of the pulvinar. In our study, the increased FCD values in the SMA might be related to a high level of arousal in sensory and psychological stresses by the SMA–pulvinar–sensory regions.
This study has several limitations. First, the relatively small size of clinical samples might have affected the robustness of the statistical results. Second, to facilitate the analysis of the correlation between electrophysiology and fMRI brain activity, sleep monitoring data need to be provided. Third, although we excluded patients with mental disorders from the study group, mood states may affect the state of the brain network. This study did not use cognitive or emotional scales to evaluate the effect of sleep on cognition and emotion. Thus, we cannot evaluate the relationship among cognition, emotion, and brain function in patients with PI.
Conclusions
We compared FCD between the PI and HC groups and found that patients with PI exhibited significantly altered FCD in the left medial frontal gyrus/orbital gyrus and left SMA. These findings can help us understand the neurophysiological basis of PI.
Data Sharing Statement
The MRI data used in this study are available from the corresponding author (Xiaozheng Liu) upon reasonable request.
Acknowledgments
This research was supported by the General Project of the Department of Science and Technology of Zhejiang Province (2017KY109 and 2020358406 to XZ Liu and 2018KY031 to ZW Guo). We thank Barry Patel, PhD, from Liwen Bianji, Edanz Editing China (www.liwenbianji.cn/ac), for editing a draft of this manuscript.
Disclosure
The authors declare that they have no conflicts of interest.
References
1. Bollu PC, Kaur H. Sleep medicine: insomnia and sleep. Mo Med. 2019;116(1):68–75.
2. de Zambotti M, Goldstone A, Colrain IM, Baker FC. Insomnia disorder in adolescence: diagnosis, impact, and treatment. Sleep Med Rev. 2018;39:12–24. doi:10.1016/j.smrv.2017.06.009
3. Xie Z, Chen F, Li WA, et al. A review of sleep disorders and melatonin. Neurol Res. 2017;39(6):559–565. doi:10.1080/01616412.2017.1315864
4. Olfson M, Wall M, Liu SM, Morin CM, Blanco C. Insomnia and impaired quality of life in the United States. J Clin Psychiatry. 2018;79(5):17m12020. PMID: 30256547. doi:10.4088/JCP.17m12020
5. Hassinger AB, Bletnisky N, Dudekula R, El-Solh AA. Selecting a pharmacotherapy regimen for patients with chronic insomnia. Expert Opin Pharmacother. 2020;21(9):1035–1043. doi:10.1080/14656566.2020.1743265
6. Sanjari Moghaddam H, Mohammadi E, Dolatshahi M, et al. White matter microstructural abnormalities in primary insomnia: a systematic review of diffusion tensor imaging studies. Prog Neuropsychopharmacol Biol Psychiatry. 2021;105:110132. doi:10.1016/j.pnpbp.2020.110132
7. Shao Z, Xu Y, Chen L, et al. Dysfunction of the NAc-mPFC circuit in insomnia disorder. Neuroimage Clin. 2020;28:102474. doi:10.1016/j.nicl.2020.102474
8. Scammell TE, Arrigoni E, Lipton JO. Neural circuitry of wakefulness and sleep. Neuron. 2017;93(4):747–765. doi:10.1016/j.neuron.2017.01.014
9. Levenson JC, Kay DB, Buysse DJ. The pathophysiology of insomnia. Chest. 2015;147(4):1179–1192. doi:10.1378/chest.14-1617
10. Li M, Wang R, Zhao M, et al. Abnormalities of thalamus volume and resting state functional connectivity in primary insomnia patients. Brain Imaging Behav. 2019;13(5):1193–1201. doi:10.1007/s11682-018-9932-y
11. Xie D, Qin H, Dong F, et al. Functional connectivity abnormalities of brain regions with structural deficits in primary insomnia patients. Front Neurosci. 2020;14:566. doi:10.3389/fnins.2020.00566
12. Shan PW, Liu W, Liu C, et al. Aberrant functional connectivity density in patients with treatment-refractory obsessive-compulsive disorder: a pilot study. J Int Med Res. 2019;47(6):2434–2445. doi:10.1177/0300060518807058
13. Anticevic A, Hu S, Zhang S, et al. Global resting-state functional magnetic resonance imaging analysis identifies frontal cortex, striatal, and cerebellar dysconnectivity in obsessive-compulsive disorder. Biol Psychiatry. 2014;75(8):595–605. doi:10.1016/j.biopsych.2013.10.021
14. Beucke JC, Sepulcre J, Talukdar T, et al. Abnormally high degree connectivity of the orbitofrontal cortex in obsessive-compulsive disorder. JAMA Psychiatry. 2013;70:619–629. doi:10.1001/jamapsychiatry.2013.173
15. Chen X, Liu C, He H, et al. Transdiagnostic differences in the resting-state functional connectivity of the prefrontal cortex in depression and schizophrenia. J Affect Disord. 2017;217:118–124. doi:10.1016/j.jad.2017.04.001
16. Yang Y, Cui Q, Pang Y, et al. Frequency-specific alteration of functional connectivity density in bipolar disorder depression. Prog Neuropsychopharmacol Biol Psychiatry. 2021;104:110026. doi:10.1016/j.pnpbp.2020.110026
17. Zhang B, Li M, Qin W, et al. Altered functional connectivity density in major depressive disorder at rest. Eur Arch Psychiatry Clin Neurosci. 2016;266(3):239–248. doi:10.1007/s00406-015-0614-0
18. Li X, Meng H, Fu Y, et al. The impact of whole brain global functional connectivity density following MECT in major depression: a Follow-Up Study. Front Psychiatry. 2019;10:7. doi:10.3389/fpsyt.2019.00007
19. Gong L, Xu R, Liu D, et al. Abnormal functional connectivity density in patients with major depressive disorder with comorbid insomnia. J Affect Disord. 2020;266:417–423. doi:10.1016/j.jad.2020.01.088
20. Tashjian SM, Goldenberg D, Monti MM, Galván A. Sleep quality and adolescent default mode network connectivity. Soc Cogn Affect Neurosci. 2018;13(3):290–299. doi:10.1093/scan/nsy009
21. Regen W, Kyle SD, Nissen C, et al. Objective sleep disturbances are associated with greater waking resting-state connectivity between the retrosplenial cortex/ hippocampus and various nodes of the default mode network. J Psychiatry Neurosci. 2016;41(5):295–303. doi:10.1503/jpn.140290
22. American Academy of Sleep Medicine. International Classification of Sleep Disorders. Diagnostic and Coding Manual.
23. Buysse DJ, Reynolds CF, Monk TH, Berman SR, Kupfer DJ. The Pittsburgh sleep quality index: a new instrument for psychiatric practice and research. Psychiatry Res. 1989;28(2):193–213. doi:10.1016/0165-1781(89)90047-4
24. Soldatos CR, Dikeos DG, Paparrigopoulos TJ. Athens insomnia scale: validation of an instrument based on ICD-10 criteria. J Psychosom Res. 2000;48:555–560. doi:10.1016/S0022-3999(00)00095-7
25. Jenkinson M, Bannister P, Brady M, et al. Improved optimization for the robust and accurate linear registration and motion correction of brain images. Neuroimage. 2002;17(2):825–841. doi:10.1006/nimg.2002.1132
26. Liu F, Zhu C, Wang Y, et al. Disrupted cortical hubs in functional brain networks in social anxiety disorder. Clin Neurophysiol. 2015;126(9):1711–1716.
27. Yang L, Lei Y, Wang L, et al. Abnormal functional connectivity density in sleep-deprived subjects. Brain Imaging Behav. 2018;12(6):1650–1657. doi:10.1007/s11682-018-9829-9
28. Kong D, Liu R, Song L, Zheng J, Zhang J, Chen W. Altered long- and short-range functional connectivity density in healthy subjects after sleep deprivations. Front Neurol. 2018;9:546. doi:10.3389/fneur.2018.00546
29. Zhou F, Zhu Y, Zhu Y, et al. Altered long- and short-range functional connectivity density associated with poor sleep quality in patients with chronic insomnia disorder: a resting-state fMRI study. Brain Behav. 2020;10(11):e01844. doi:10.1002/brb3.1844
30. Zhu Y, Zhao X, Yin H, Zhang M. Functional connectivity density abnormalities and anxiety in primary insomnia patients. Brain Imaging Behav. 2021;15(1):114–121. doi:10.1007/s11682-019-00238-w
31. Andrews-Hanna JR, Reidler JS, Huang C, Buckner R. Evidence for the default network’s role in spontaneous cognition. J Neurophysiol. 2010;104:322–35. 28. doi:10.1152/jn.00830.2009
32. Ioannides AA, Kostopoulos GK, Liu L, Fenwick PB. MEG identifies dorsal medial brain activations during sleep. Neuroimage. 2009;44(2):455–468. doi:10.1016/j.neuroimage.2008.09.030
33. Murphy M, Riedner BA, Huber R, Massimini M, Ferrarelli F, Tononi G. Source modeling sleep slow waves. Proc Natl Acad Sci U S A. 2009;106(5):1608–1613. doi:10.1073/pnas.0807933106
34. Pang R, Guo R, Wu X, et al. Altered regional homogeneity in chronic insomnia disorder with or without cognitive impairment. AJNR Am J Neuroradiol. 2018;39(4):742–747. doi:10.3174/ajnr.A5587
35. Huang S, Zhou F, Jiang J, et al. Regional impairment of intrinsic functional connectivity strength in patients with chronic primary insomnia. Neuropsychiatr Dis Treat. 2017;13:1449–1462. doi:10.2147/NDT.S137292
36. Koenigs M, Holliday J, Solomon J, Grafman J. Left dorsomedial frontal brain damage is associated with insomnia. J Neurosci. 2010;30:16041–16043. doi:10.1523/JNEUROSCI.3745-10.2010
37. Feng F, Yu S, Wang Z, et al. Non-pharmacological and pharmacological interventions relieve insomnia symptoms by modulating a shared network: a controlled longitudinal study. Neuroimage Clin. 2019;22:101745. doi:10.1016/j.nicl.2019.101745
38. Park HY, Lee H, Jhee JH, et al. Changes in resting-state brain connectivity following computerized cognitive behavioral therapy for insomnia in dialysis patients: a pilot study. Gen Hosp Psychiatry. 2020;66:24–29. doi:10.1016/j.genhosppsych.2020.05.013
39. Killgore WD, Schwab ZJ, Kipman M, Deldonno SR, Weber M. Insomnia-related complaints correlate with functional connectivity between sensory-motor regions. Neuroreport. 2013;24(5):233–240. PMID: 23399993. doi:10.1097/WNR.0b013e32835edbdd
40. Zabrecky G, Shahrampour S, Whitely C, et al. An fMRI study of the effects of vibroacoustic stimulation on functional connectivity in patients with insomnia. Sleep Disord. 2020;2020:7846914. doi:10.1155/2020/7846914
41. Nardone R, Höller Y, Brigo F, Tezzon F, Golaszewski S, Trinka E. Transcranial magnetic stimulation and sleep disorders: pathophysiologic insights. Sleep Med. 2013;14(11):1047–1058. doi:10.1016/j.sleep.2013.04.025
42. Nardone R, Golaszewski S, Frey V, et al. Altered response to repetitive transcranial magnetic stimulation in patients with chronic primary insomnia. Sleep Med. 2020;72:126–129. doi:10.1016/j.sleep.2020.03.030
43. Gong L, Xu R, Qin M, et al. New potential stimulation targets for noninvasive brain stimulation treatment of chronic insomnia. Sleep Med. 2020;75:380–387. doi:10.1016/j.sleep.2020.08.021
44. van Dongen EV, Takashima A, Barth M, Fernández G. Functional connectivity during light sleep is correlated with memory performance for face-location associations. Neuroimage. 2011;57(1):262–270. doi:10.1016/j.neuroimage.2011.04.019
45. Jegou A, Schabus M, Gosseries O, et al. Cortical reactivations during sleep spindles following declarative learning. Neuroimage. 2019;195:104–112. doi:10.1016/j.neuroimage.2019.03.051
46. Yu S, Feng F, Zhang Q, et al. Gray matter hypertrophy in primary insomnia: a surface-based morphometric study. Brain Imaging Behav. 2020;14(5):1309–1317. PMID: 30511119. doi:10.1007/s11682-018-9992-z
47. Wang T, Li S, Jiang G, et al. Regional homogeneity changes in patients with primary insomnia. Eur Radiol. 2016;26(5):1292–1300. doi:10.1007/s00330-015-3960-4
48. Li X, Guo S, Wang C, Wang B, Sun H, Zhang X. Increased interhemispheric resting-state functional connectivity in healthy participants with insomnia symptoms: a randomized clinical consort study. Medicin. 2017;96(27):e7037. doi:10.1097/MD.0000000000007037
49. Frank DW, Costa VD, Averbeck BB, Sabatinelli D. Directional interconnectivity of the human amygdala, fusiform gyrus, and orbitofrontal cortex in emotional scene perception. J Neurophysiol. 2019;122(4):1530–1537. doi:10.1152/jn.00780.2018
50. Bae S, Kang KD, Kim SW, Shin YJ, Nam JJ, Han DH. Investigation of an emotion perception test using functional magnetic resonance imaging. Comput Methods Programs Biomed. 2019;179:104994. doi:10.1016/j.cmpb.2019.104994
51. Geday J, Gjedde A, Boldsen AS, Kupers R. Emotional valence modulates activity in the posterior fusiform gyrus and inferior medial prefrontal cortex in social perception. Neuroimage. 2003;18(3):675–684. doi:10.1016/s1053-8119(02)00038-1
52. Santarnecchi E, Del Bianco C, Sicilia I, et al. Age of insomnia onset correlates with a reversal of default mode network and supplementary motor cortex connectivity. Neural Plast. 2018;2018:3678534. doi:10.1155/2018/3678534
53. Johansen-Berg H, Matthews PM. Attention to movement modulates activity in sensorimotor areas, including primary motor cortex. Exp Brain Res. 2002;142(1):13–24. 52. doi:10.1007/s00221-001-0905-8
54. Zhao L, Wang E, Zhang X, et al. Cortical structural connectivity alterations in primary insomnia: insights from MRI-based morphometric correlation analysis. Biomed Res Int. 2015;2015:817595. doi:10.1155/2015/817595
55. Pang R, Zhan Y, Zhang Y, et al. Aberrant functional connectivity architecture in participants with chronic insomnia disorder accompanying cognitive dysfunction a whole-brain, data-driven analysis. Front Neurosci. 2017;11:259. doi:10.3389/fnins.2017.00259
56. Benedict RH, Shucard DW, Santa Maria MP, et al. Covert auditory attention generates activation in the rostral/dorsal anterior cingulate cortex. J Cogn Neurosci. 2002;14(4):637–645. doi:10.1162/08989290260045765
57. Yanaka HT, Saito DN, Uchiyama Y, Sadato N. Neural substrates of phasic alertness: a functional magnetic resonance imaging study. Neurosci Res. 2010;68(1):51–58. doi:10.1016/j.neures.2010.05.005
58. De Zambotti M, Goldstone A, Forouzanfar M, et al. The falling asleep process in adolescents. Sleep. 2020;43(6):zsz312. doi:10.1093/sleep/zsz312
59. Biggs QM, Ursano RJ, Wang J, Wynn GH, Carr RB, Fullerton CS. Post traumatic stress symptom variation associated with sleep characteristics. BMC Psychiatry. 2020;20(1):174. doi:10.1186/s12888-020-02550-y
60. Narisawa H. Anxiety and its related factors at bedtime are associated with difficulty in falling asleep. Tohoku J Exp Med. 2013;231(1):37–43. doi:10.1620/tjem.231.37
61. Brown FC, Buboltz WC
62. Keilani M, Crevenna R, Dorner TE. Sleep quality in subjects suffering from chronic pain. Wien Klin Wochenschr. 2018;130(1–2):31–36. doi:10.1007/s00508-017-1256-1
63. Wang X, Cheng B, Luo Q, Qiu L, Wang S. Gray matter structural alterations in social anxiety disorder: a voxel-based meta-analysis. Front Psychiatry. 2018;9:449. doi:10.3389/fpsyt.2018.00449
64. Liu P, Wang G, Liu Y, et al. Disrupted intrinsic connectivity of the periaqueductal gray in patients with functional dyspepsia: a resting-state fMRI study. Neurogastroenterol Motil. 2017;29:8. doi:10.1111/nmo.13060
65. Fang Q, Chou XL, Peng B, et al. Circuit via retino-colliculo-pulvinar pathway enhances feature selectivity in visual cortex through surround suppression. Neuron. 2020;105(2):355–369.e6. doi:10.1016/j.neuron.2019.10.027
66. Chou XL, Fang Q, Yan L, et al. Contextual and cross-modality modulation of auditory cortical processing through pulvinar mediated suppression. Elife. 2020;9:e54157. doi:10.7554/eLife.54157
67. Kanemoto H, Kazui H, Adachi H, et al. Thalamic pulvinar metabolism, sleep disturbances, and hallucinations in dementia with Lewy bodies: positron emission tomography and actigraphy study. Int J Geriatr Psychiatry. 2020;35(8):934–943. doi:10.1002/gps.5315
68. Hansen PN, Krøigård T, Nguyen N, Frandsen RV, Jennum PJ, Beier CP. Severe hypersomnia after unilateral infarction in the pulvinar nucleus- a case report. BMC Neurol. 2020;20(1):442. doi:10.1186/s12883-020-02018-2
 © 2022 The Author(s). This work is published and licensed by Dove Medical Press Limited. The full terms of this license are available at https://www.dovepress.com/terms.php and incorporate the Creative Commons Attribution - Non Commercial (unported, v3.0) License.
By accessing the work you hereby accept the Terms. Non-commercial uses of the work are permitted without any further permission from Dove Medical Press Limited, provided the work is properly attributed. For permission for commercial use of this work, please see paragraphs 4.2 and 5 of our Terms.
© 2022 The Author(s). This work is published and licensed by Dove Medical Press Limited. The full terms of this license are available at https://www.dovepress.com/terms.php and incorporate the Creative Commons Attribution - Non Commercial (unported, v3.0) License.
By accessing the work you hereby accept the Terms. Non-commercial uses of the work are permitted without any further permission from Dove Medical Press Limited, provided the work is properly attributed. For permission for commercial use of this work, please see paragraphs 4.2 and 5 of our Terms.