")
Back to Journals » International Journal of Nanomedicine » Volume 14
Functional Autophagic Flux Regulates AgNP Uptake And The Internalized Nanoparticles Determine Tumor Cell Fate By Temporally Regulating Flux
Authors Fageria L, Bambroo V, Mathew A, Mukherjee S, Chowdhury R, Pande S
Received 6 July 2019
Accepted for publication 10 October 2019
Published 20 November 2019 Volume 2019:14 Pages 9063—9076
DOI https://doi.org/10.2147/IJN.S222211
Checked for plagiarism Yes
Review by Single anonymous peer review
Peer reviewer comments 3
Editor who approved publication: Dr Thomas Webster
Leena Fageria,1 Vishakha Bambroo,1 Angel Mathew,1 Sudeshna Mukherjee,1 Rajdeep Chowdhury,1 Surojit Pande2
1Department of Biological Sciences, Pilani Campus, BITS, Pilani, Rajasthan 333031, India; 2Department of Chemistry, Pilani Campus, BITS, Pilani, Rajasthan 333031, India
Correspondence: Surojit Pande
Department of Chemistry, Pilani Campus, BITS, Pilani, Rajasthan 333031 Email [email protected]
Rajdeep Chowdhury
Department of Biological Sciences, Pilani Campus, BITS, Pilani, Rajasthan 333031 Email [email protected]
Background: Silver nanoparticles (AgNPs) are known to induce the conserved, cellular, homeostatic process- autophagy in tumor cells. Previous studies primarily focus on the pro-survival role of autophagy post AgNP exposure in tumor cells, but seldom on its role in AgNP uptake, or on the functional significance of autophagy temporal dynamics. Our study sheds more light on the extensive crosstalk that exists between AgNP and autophagy, which can be critical to the improvement of AgNP-induced therapeutic effects.
Methods: β-cyclodextrin (β-CD) coated AgNPs of two different sizes were synthesized by nucleation method and characterized by transmission electron microscopy. Fluorescence microscopy and flow cytometry were used to probe intracellular uptake of AgNPs. Endocytic mechanism of AgNPs was classically analyzed through use of various endocytosis inhibitors. Autophagy was evaluated by immunoblot and fluorescence microscopy. Additionally, immunoblot was performed to monitor Janus Kinase (JNK) signalling, ubiquitination of proteins, expression of endo-lysosomal and apoptotic markers in correlation to AgNP-induced autophagy.
Results: The intra-cellular route of entry for the small NPs (∼9 nm; ss-AgNPs) was different than the large NPs (∼19 nm; ls-AgNPs) studied. However, irrespective of their unique route of entry an inhibition of autophagic flux by chloroquine (CQ) reduced uptake of both the AgNPs. In contrary, rapamycin (Rapa), an autophagy inducer enhanced it. Importantly, JNK activation was required for autophagy induction and AgNP uptake. Furthermore, effect of AgNPs on autophagy showed temporal dependency. An enhanced autophagic flux was noted at early time points; however, prolonged exposure resulted in inhibition of flux marked by increase in Rab7, LC3B-II and p62 proteins. Inhibition of flux was associated with lysosomal dysfunction, decreased LAMP1 expression and an increased accumulation of ubiquitinated (Ub) proteins. This resulted in heightened reactive oxygen species (ROS) and consequent cytotoxicity.
Conclusion: In this study, we observed that a functional autophagic flux aids AgNP uptake, but AgNPs in turn, overtime, inhibits flux and endo-lysosomal function. We provide critical, novel insights into crosstalk between AgNP and autophagy which can be vital to future AgNP-based therapy development.
Keywords: silver nanoparticles, endocytosis, autophagy, ROS, lysosomes
Introduction
The unique ability of NPs to home, particularly into tumor tissues exploiting the leaky vasculature of tumors makes them an essential component of the therapeutic arsenal against cancer.1–4 Among diverse nanomaterials, AgNPs have shown significant potential as anti-carcinogenic agents.5 Currently, it is unanimously accepted that AgNPs impart cytotoxicity in a dose-dependent manner in tumor cells, primarily through the generation of ROS, and consequent activation of apoptosis or necrosis.6 In spite of substantial progress, an important aspect of AgNP research that has been considerably less studied is how AgNPs modulate associated cellular events like, endocytosis, trafficking, and autophagy. AgNPs being a vital tool in therapeutics, a thorough understanding of these parameters shall undoubtedly strengthen their functional efficacy. Different discrete pathways for cellular internalization of NPs exist, which is critical for exerting an effect at the cellular level. Currently, a vast majority of research suggests that metal NPs enter the cell primarily via endocytosis.7 Based on the proteins involved, it can be primarily classified as caveolae-mediated, clathrin-mediated, or clathrin- and caveolae-independent endocytosis.8 However, what regulates the mode of entry of the NPs and how it affects subsequent intracellular trafficking and key intracellular processes is under-explored.9
A cellular internalization mechanism like endocytosis is tightly associated with the cellular homeostatic process- autophagy. It is a lysosome-mediated cellular degradative process that sequesters cytosolic components in membrane-bound vesicles before delivering them to the lysosomes. In context to endocytosis, it is often considered that for an efficient autophagy a functional endocytic pathway is essential;10 therefore, we assumed that the molecular forces driving autophagy in tumor cells might be cross-linked with activities at the plasma membrane level itself. This study thus establishes the connection between AgNP internalization and autophagy.
Autophagy is highly implicated in cancer and is imperative to tumor cell adaptation to stress.11 We along with few other studies have previously reported activation of protective autophagy upon exposure of tumor cells to AgNPs;5 but, conversely, autophagy can act as a pro-death mechanism as well.12 We, however, assume that the effect of AgNPs on autophagy is not discrete but dynamic and cannot be strictly categorized into pro-survival or pro-death and it has a strong connection with other processes like cellular internalization or endocytic mechanisms. Therefore, analyzing the process of AgNP internalization and the subsequent effect on intracellular trafficking and autophagy might be necessary for developing ways to allow AgNPs into the tumor cells and impart a higher curative effect.
In the present study, we report the one-pot green synthesis of AgNPs in an eco-friendly method using beta-cyclodextrin (β-CD) as a reducing and stabilizing agent.13 β-CD is widely used in pharmaceuticals for encapsulating drugs and increasing its solubility and biocompatibility inside the body.14 Thereafter, the internalization mechanism of the AgNPs and their temporal effect on autophagy, endocytic trafficking, and subsequent toxicity are studied in detail on breast cancer cells. The overall objective was to characterize the dynamic crosstalk that exists between AgNP and autophagy in the tumor cells.
Materials And Methods
Chemicals
Rapamycin (Rapa, #sc-3504A), Nocodazole (Noc, #sc-3518), Chlorpromazine (CPZ, #sc-357313), Dynasore (Dyn, #sc-202592), JC-1 (#sc-364116A) and JNK inhibitor, SP600125 (#sc-200635) were purchased from Santa Cruz Biotechnology. 2ʹ,7ʹ-dichlorofluorescein diacetate (DCFDA, # D6883), Mono-dansylcadaverine (MDC, # D4008), Chloroquine (CQ, #C6628), RIPA Buffer (#R0278), Acridine Orange (AO, #A9231) and Propidium iodide (PI, #P4864) were purchased from Sigma; N-Acetyl-L-cysteine (NAC, #47866) and 3-(4, 5-dimethylthiazol-2-yl)-2,5-di-phenyltetrazolium bromide (MTT, #33611) were obtained from SRL; beta-cyclodextrin (β-CD, #C0900), Genistein (Gen, #G0272) and 3-(2-Benzothiazolyl)-7-(diethylamino)coumarin (C6, #B2088) were purchased from TCI Chemicals. FITC conjugated AnnexinV (#A13199), AnnexinV binding buffer (#V13246), LysoTracker Red DND-99 (LT, # L7528), Enhanced Chemiluminescence (ECL, #32106) and Antifade mountant (4ʹ-6-diamidino-2-phenylindole, #P36962) were procured from Thermo Fisher Scientific. Lipofectamine 3000 was from Invitrogen (#L3000-001). Antibodies were obtained from Cell Signalling Technology (CST, USA). GFP-Ub was a gift from Nico Dantuma (Addgene plasmid # 11928).
Synthesis Of Size-Dependent AgNPs
Nucleation method was used for synthesizing β-CD capped AgNPs. 0.16 g of β-CD was dissolved in autoclaved Milli-Q water. After dissolving, 300 µL of 1.0 M NaOH solution was added to increase the pH of the solution to ~10. The corresponding metal salt solution, 10 µL of 0.1 M AgNO3 was added and mixed properly. Then, the reaction mixtures were shaken well and heated on a water bath at 85°C for 8 mins while it turned into yellow, indicating the formation of metal nanoparticles. For size variation, 50 µL of 0.1 M AgNO3 was used keeping the remaining procedure unaltered.13
Characterization Of Nanoparticles
UV-Vis property of synthesized AgNPs was characterized using Multiskan GO microplate spectrophotometer operated within the range of 300–700 nm at a resolution of 2 nm. Hydrodynamic diameter and zeta-potential of AgNPs was measured using Malvern Zetasizer Nano ZS. For size and shape determination, the synthesized solution was drop cast onto carbon-coated copper grids, and the grids were kept in a vacuum desiccator overnight for drying. Transmission electron micropscopy (TEM) images were taken on a Tecnai G2 20 S-Twin TEM instrument (FEI Company) at an acceleration voltage of 200 kV. For size distribution calculation, ~100 particles were considered.
Cell Culture
Human breast cancer cells, MCF-7 and MDA-MB-468 (procured from NCCS, Pune, India) were cultured at 37 °C, 5% CO2, in Dulbecco’s modified eagle medium (Invitrogen) supplemented with 10% fetal bovine serum (Invitrogen), 1% Penicillin (100 UmL−1) and streptomycin (100 μgmL−1; Invitrogen) solution. The cells were grown to 70–80% confluency, rinsed in phosphate buffer saline, and placed into the fresh medium before treatments. The immortalized keratinocytes, HaCaT cells used in this study were a kind gift from Dr. Archana Singh, IGIB, Delhi, India.
Cell Viability Analysis
MTT assay was performed to analyze cell viability using the method described previously.5 Briefly, 8000 cells per well were seeded in 96-well plate and treated with various concentrations (10–150 µM) of ss- and ls-AgNPs for 24 h. The absorbance of formazan crystals formed was obtained at 570 nm with a differential filter of 630 nm using a Multiskan GO microplate spectrophotometer.
Microscopic Imaging And Analyzing NP Internalization
For bright field imaging, cells were cultured in 6 cm dishes and treated with different doses of AgNPs. Images were captured using Olympus (CKX41). For internalization study, the NPs were tagged with C6, (2.5 μg/mL) for 1 mL of NPs and kept overnight in the dark. Subsequently, C6 tagged NPs with or without endocytosis inhibitors were added to cells in 6 well plates and incubated for 1 h. The samples were then acquired through flow cytometer (CytoFlex, Beckmann Coulter), and analysis was performed using CytExpert. For microscopic imaging, cells were plated on coverslips. After incubation with C6 tagged NPs, the coverslips were washed with PBS and fixed with 4% paraformaldehyde at −20 °C for 10 min. The coverslips were mounted with antifade containing DAPI. AgNP internalization was confirmed by visualization through ZEISS Axio Scope A1 microscope.
Immunoblotting
Immunoblotting was performed following methods described previously.15 The blots were probed with specific primary antibodies (dilution 1:1000). The blots were stripped, and re-probed following conventionally used methods. β-actin or GAPDH (dilution 1:2000) was used as a loading control. The blots were cut to probe with multiple antibodies against proteins of different molecular weights. The secondary antibodies used were horseradish peroxide-conjugated goat anti-rabbit IgG. The protein intensity was measured using Enhanced Chemiluminescence by Chemi-Doc XRS (Bio-Rad) detection system. The expression was densitometrically quantified using ImageJ software.
Immunofluorescence
Cells were seeded overnight on coverslips. Thereafter, the cells were treated with AgNPs in the presence or absence of Dynamin inhibitor for 2 h. Cells were then fixed with 4% paraformaldehyde at −20 °C for 10 min. Blocking was done for 2 h with 5% BSA followed by overnight incubation with anti-Clathrin primary antibodies at 4 °C. The secondary antibody used was tagged with Texas-Red. The coverslips were mounted with antifade containing DAPI and visualized through ZEISS Axio Scope A1 microscope.
Transfection
For visualization of accumulated ubiquitinated proteins and LC3 puncta, MCF-7 cells were seeded on coverslips and were transfected with 2 µg of GFP-Ub purified plasmids and RFP-LC3II plasmid (gift from Dr. Sovan Sarkar, University of Birmingham, UK). Lipofectamine 3000 was used for transfection. Approximately, 6 h after transfection, the cells were treated with AgNPs in the medium. Post-treatment, the coverslips were washed and mounted with anti-fade containing DAPI. Green and Red fluorescent puncta were analyzed under a fluorescence microscope.
siRNA Mediated Silencing Of ATG5
Cells were transfected with siATG5 (a kind gift from Dr. Santosh Chauhan, ILS, Bhubaneswar, India) using lipofectamine 3000. Cells were pre-incubated with 20 nM siATG5 for 6 h before the addition of AgNP in the medium.
Measurement Of LysoTracker (LT) Fluorescence
The LysoTracker Red DND-99 and LysoTracker Green DND-26 were used for labeling lysosomes. Cells were cultured till 70–80% confluency. After that the medium was replaced with pre-warmed (37 °C) probe-containing medium. Cells were then incubated for 20 min. The cells were then observed under a fluorescence microscope (Zeiss), and the intensity of LT fluorescence was measured.
Acridine Orange (AO) Staining
MCF-7 cells were trypsinized, collected and stained with AO (final concentration: 0.5 µg/mL) for 10 min. After centrifugation, cells were resuspended in PBS and analyzed through a flow cytometer. Analysis of acquired data was performed using CytExpert software. Percentage of cells showing red fluorescence of AO is represented through a bar diagram.
Measurement Of Intracellular ROS
DCFHDA passively enters the cell, where it reacts with ROS to form the highly fluorescent compound, dichlorofluorescein (DCF). ROS levels were estimated by a previously reported method.5 The fluorescence of DCF was measured at 485 nm excitation and 530 nm emission using a microplate reader (Fluoroskan Ascent).
Apoptosis Assay
MCF-7 cells were seeded in 6-well plates for detection of apoptosis. After attaining 70% confluency, the cells were incubated with IC50 concentrations of AgNPs for 24 h or 48 h. Thereafter, the cells were processed by the method discussed earlier.16 Briefly, the samples were treated with AnnexinV/PI and then were acquired and analyzed using flow cytometer. Percent apoptotic cells represent both Annexin+ and Annexin+PI+ cells and percent dead cells represent Annexin+, Annexin+PI+, and only PI+ cells in the bar diagram.
Estimation Of Mitochondrial Membrane Potential (Ψm)
Mitochondrial membrane potential was analyzed using JC-1, a lipophilic cationic fluorescent dye. JC-1 was added to cells in a concentration of 0.5 µgmL −1 after treating cells with AgNPs in 6-well plate and incubated for an additional 30 min at 37 °C. After washing with PBS; the stained cells were collected and assayed using a flow cytometer.
Statistical Analysis
The obtained data was analyzed using OriginPro 9.0 and GraphPad Prism (Version 5.01) Software. One-way ANOVA, two-way ANOVA or Student’s t-test were used to determine the statistical significance of particular treatment in comparison to control. Bonferroni or Tukey post-tests were used to compare multiple comparisons. All data points represent the mean of independent measurements. If p-value > 0.05 difference is not significant (ns); if p ≤ 0.05 significant difference denoted by symbols */#/$ or @, if p ≤ 0.01 significance denoted by **/##/$$ or @@ and ***/###/$$$ and @@@ symbol represents p ≤ 0.001.
Results
Synthesis And Characterization Of Small And Large-Sized AgNPs
The synthesis of AgNPs has been discussed in the materials & methods section. Briefly, β-CD was used as a reducing and stabilizing agent, and a variable amount of AgNO3 was used for size-dependent AgNP synthesis. The resulting NPs were exposed to breast cancer cells (MCF-7 and MDA-MB-468) for further study. The overall characterization of the NPs, biological results and probable mechanism of action are discussed in the following section: Figure 1A shows the UV-vis analysis of AgNPs synthesized by using β-CD. Digital image of yellow colour AgNP is shown in the inset of Figure 1A. It can be seen from Figure 1A that the characteristic peak appeared at 405 nm and 408 nm for ss and ls-AgNPs, respectively. The difference in peak intensity represents a different amount of AgNO3 was used for the synthesis of size-dependent AgNPs (Figure 1A). The size and shape of Ag cluster were analyzed by TEM which showed uniform, monodisperse, and spherical particles with diameters 9±2.2 nm and 19±2 nm for small-size (ss) and large-size (ls), respectively (Figure 1B and C). The high resolution TEM image of ss- and ls-AgNPs are shown in the inset of Figure 1B and C. Size distribution histogram for both ss- and ls-AgNPs are shown in Figure 1D and E. To check the surface charge and dispersity of AgNPs, zeta potential analysis was performed. Zeta potential value of ss-AgNPs and ls-AgNPs were −31.0 and −29.8 respectively. The Zeta potential analysis of NPs showed a negative surface charge characteristic of the -COO− and -OH− functional groups present on β-CD, which is well-matched with literature.13 β-CD is cyclic oligosaccharides and consisting of seven α-(1,4)-linked glycosyl units. β-CD tends to form a bucket-like structure with a hydrophobic interior. Since its discovery, it is known as bio-degradable, very less toxic, and hence is widely used for drug delivery, and storage.14 β-CD and AgNO3 were found to be non-toxic to the cells studied here (Supplementary Figure 1(i, ii)). Due to having ample advantages, β-CD was chosen as a stabilizing and reducing agent for the synthesis of size-dependent AgNPs. Highly monodisperse and uniform AgNP particles were synthesized using β-CD, thus avoiding conventionally used toxic reducing or stabilizing agents.
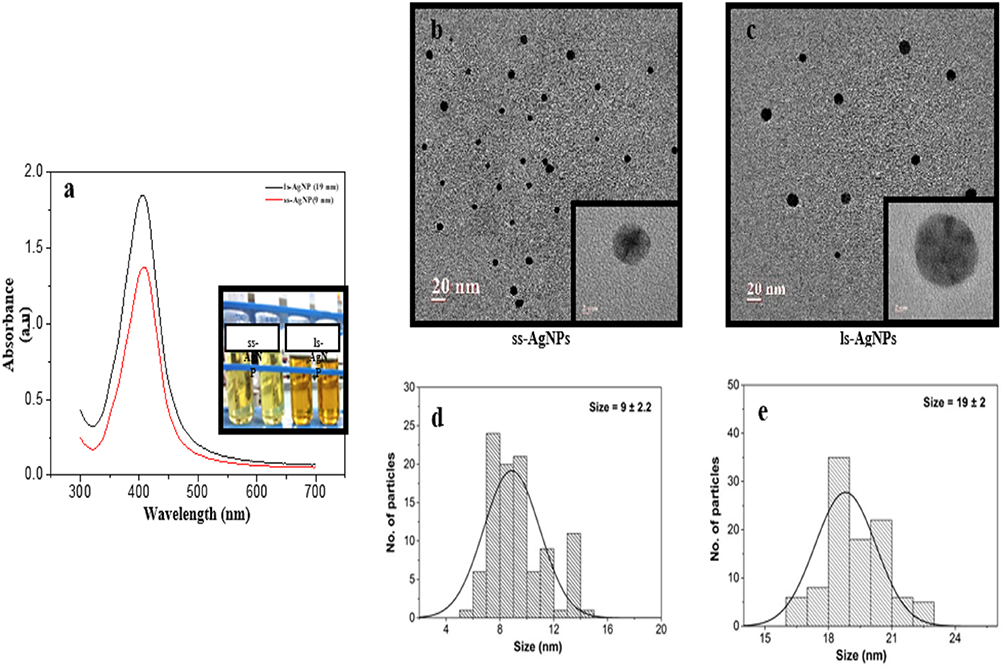 |
Figure 1 Synthesis and characterization of AgNPs. (A) UV-Visible spectra analysis confirming the synthesis of AgNPs. Inset showing test tubes after the formation of AgNPs at different concentration of silver nitrate solution. (B, C) TEM images of ss-AgNPs and ls-AgNPs, respectively. (D, E) Particle size distribution histogram of AgNPs determined using TEM images. |
Internalization Of ss-AgNPs And ls-AgNPs Are Through Different Routes
We initially examined the dose-dependent effect of AgNPs on human breast cancer cells, MCF-7 and MDA-MB-468. Figure 2A shows phase contrast images of MCF-7 cells exposed to AgNPs. A distinct difference in cell shape with consistent rounding up of cells (marked in a circle) was observed after treatment with ss-AgNPs but not ls-AgNPs at similar doses. Both the cell types studied were significantly more sensitive to ss-AgNPs with an IC50 of ~25 µM compared to ls-AgNPs (IC50~100 µM) (Figure 2B and Supplementary Figure 1(iii, iv)). Relatively less cytotoxicity was observed in the HaCaT cells, which are immortalized cells (Supplementary Figure 1(v, vi)). For understanding the reason for enhanced cytotoxicity of ss-AgNPs, we monitored cellular uptake of AgNPs presuming that a variation in size might result in differential uptake. The AgNPs were tagged with Coumarin-6 (C6) for their visualization in MCF-7 cells.17,18 Uptake of free C6 was also monitored (Supplementary Figure 2). Figure 2C (i) and (ii), indicates that there was more intense green fluorescence for ss-AgNPs reflecting their better internalization. The microscopic observation was further confirmed through flow cytometry with ss-AgNPs showing significantly (***) increased internalization at similar dose (Figure 2D). The uptake also increased with time (Figure 2E). It can be inferred from above that uptake of AgNPs is size and time-dependent with enhanced permeability potential for small NPs.
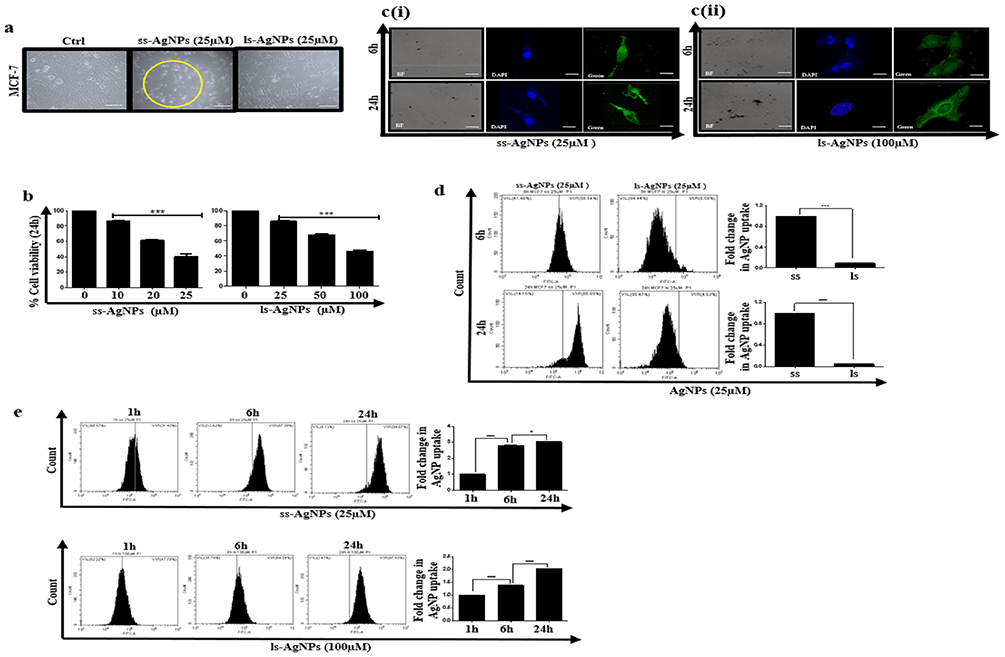 |
Figure 2 Analysis of internalization of ss-AgNPs and ls-AgNPs. (A) Phase-contrast images of cells after treatment with 25 µM of AgNPs for 24 h. “Ctrl” represents un-treated cells. Scale bar- 100 µm (B) MTT assay analyzing cell viability after 24 h of treatment with AgNPs in MCF-7 cells. [C (i) and (ii)] Fluorescent microscopic images of MCF-7 cells after treatment with IC50 dose of C6 tagged AgNPs for 6 h and 24 h. Scale bar- 200 µm. (D) A comparative fold change between C6 tagged ss-AgNP and ls-AgNp uptake (25 µM) measured through flow cytometry at different time points. (E) A comparative difference in uptake of C6 tagged AgNPs (IC50) at different time points (1 h, 6 h & 24 h) as measured through flow cytometry. The symbol (*) represents a significant difference between different treatments. |
Internalization of NPs can occur through various mechanisms like clathrin-mediated endocytosis (CME), caveolae-mediated endocytosis (CVE) and clathrin-caveolae independent (CCIE) endocytic mechanisms, as well as by phagocytosis or macropinocytosis.8
We took the commonly used inhibitors of endocytosis, for example, chlorpromazine (CPZ), which inhibits CME;19 genistein (Gen), an inhibitor CVE; nocodazole (Noc), that inhibit actin driven macropinocytosis;20 and finally, dynasore (Dyn), that inhibit dynamin from blocking dynamin-dependent endocytosis.21 The time and dose of each inhibitor were selected based on prior published reports;19–21 a non-cytotoxic dose was selected based on viability assay performed (Supplementary Figure 3). Inhibition of NP uptake was quantified by flow cytometry. The internalization parameters were analyzed after 1 h of exposure to the NPs, as blocking a particular route of entry into the cells may activate another compensatory pathway of endocytosis at later time points, thus complicating analysis.22 Importantly, of all the inhibitors, Dyn most significantly (***) affected internalization of ss-AgNPs; however, it did not have a profound impact on the uptake of ls-AgNPs (Figure 3A and B). Figure 3C represents co-localization of clathrin protein, with AgNPs. Importantly, the addition of Dyn before AgNP treatment reduced the co-localization of clathrin (Red) with AgNPs (Green). There are existing reports suggesting that dynamin and clathrin co-localize, and dynamin is required for clathrin-dependent vesicle formation. Hence, pre-treatment with Dyn, that acts as an inhibitor of endocytic pathways that are known to depend on dynamin by inhibiting vesicle formation, showed reduced co-localization of AgNPs and clathrin.23,24 On the contrary, a significant impediment in the uptake of ls-AgNPs was observed when specific inhibitors of CME and CVE were used (Figure 3B). Dyn, though an inhibitor of dynamin-1 and 2 dependent segregation of endocytic vesicles from the cell membrane, is also involved in dynamin-independent effects as well.25,26 We assume that ss-AgNPs by virtue of their small size might involve both dynamin-dependent and independent mechanisms for internalization.
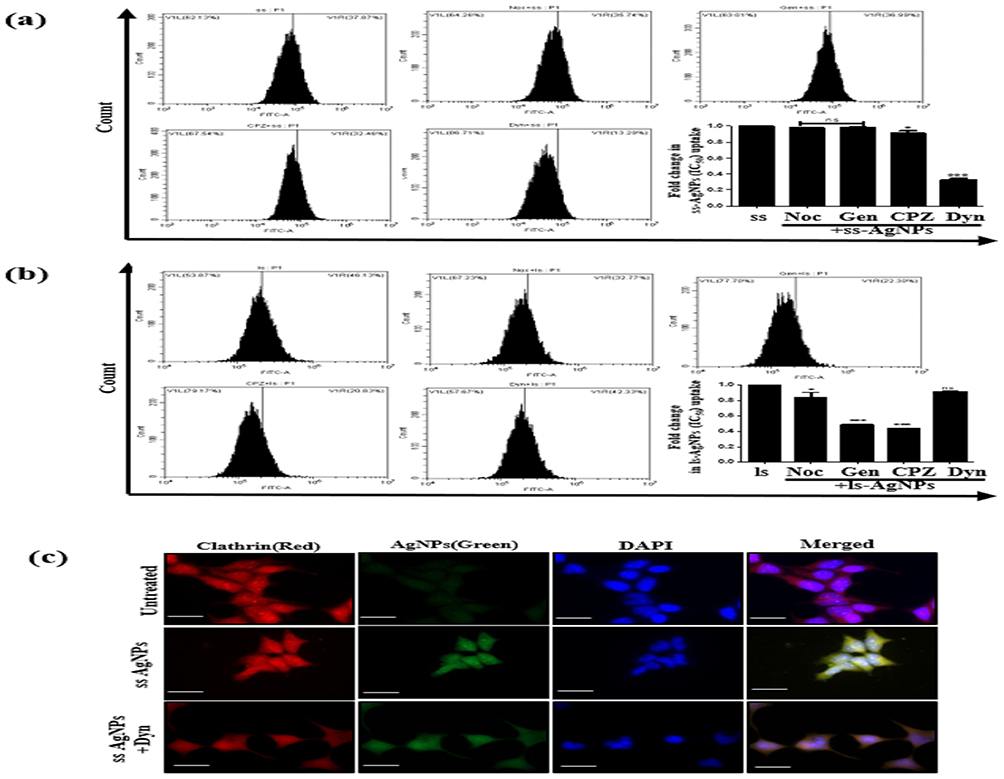 |
Figure 3 Analysis of intra-cellular uptake mechanism of ss-AgNPs and ls-AgNPs. Flow cytometric analysis of the uptake of ss-AgNPs (A) and ls-AgNPs (B) (at IC50 dose) 1 h after treatment with NPs. The cells were exposed for 30 min to the different endocytic pathway inhibitors prior to AgNP exposure. The inhibitors used were- Nocodazole (Noc; 0.5 µM), Genistein (Gen; 10 µM), Chlorpromazine (CPZ; 5 µM) and Dynasore (Dyn; 50 µM). (C) Immunofluorescence images of cells treated with IC50 dose of ss-AgNPs (green) with and without Dyn. Cells were stained with anti-rabbit TR conjugated secondary antibody against clathrin (red). Scale bar- 200 µm. The symbol (*) represents a significant difference with respect to AgNP-treated cells. |
AgNPs Cause Initial Induction Of Autophagy-Mediated By JNK Activation
Several reports confirm a strong correlation between endocytosis and autophagy.27 We were therefore interested in investigating the effect of AgNPs on autophagy. As expected, both ss-AgNPs and ls-AgNPs, at their IC50 dose led to an increase in LC3B-II (Figure 4A), Beclin1 and Atg3 protein levels (Supplementary Figure 4), predominant markers of autophagy. However, an increase in LC3B-II does not always correlate with autophagic flux, as it may indicate a blockage of autophagic flux as well.28 We, hence, analyzed the expression level of p62, which when degraded means induction of flux and when accumulates signifies inhibition. At 1 and 6 h, an increase in LC3B-II was coupled with decreased p62 protein levels indicating induction of autophagy and probable trafficking of NPs towards lysosomes (Figure 4A and B). The MAPK-JNK pathway has been implicated in the regulation of autophagy.5 We observed that both ss-AgNPs and ls-AgNPs, at IC50 dose resulted in phosphorylation of JNK (Figure 4B). Interestingly, pharmacological inhibition of JNK by SP600125 led to a drastic decrease in LC3B-II levels (Figure 4C). After 6 h of AgNP exposure, we also observed co-localization of transfected RFP-LC3 puncta with lysosomes (LysoTracker) which further confirmed autophagic flux induction (Figure 4D).
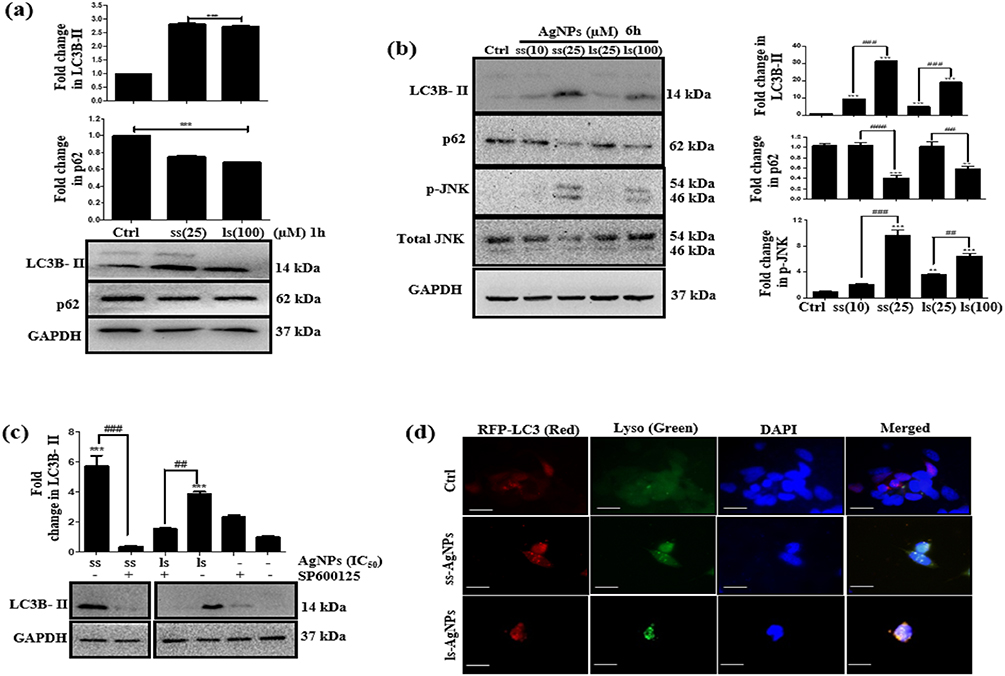 |
Figure 4 Analysis of early induction of autophagy and JNK after AgNP exposure. (A) Immunoblot showing expression of LC3B-II and p62 after 1 h of treatment with AgNPs. (B) Immunoblot showing expression of LC3B-II, p62 and JNK after treatment with AgNPs for 6 h. (C) Immunoblot showing expression of LC3B-II upon AgNPs treatment for 6 h after inhibiting JNK by SP600125. Wherever mentioned, SP600125 (25 µM) was added 24 h before AgNP treatment. GAPDH served as a loading control. (D) Fluorescent microscopic images showing co-localization of LC3 (red) with lysosomes (Lyso Tracker green) after 6 h of AgNP treatment. Scale bar- 200 µm. [Symbol (*), (#) and ($) represent statistically significant difference with respect to untreated cells, AgNP-treated cells, and AgNP with inhibitor/inducer respectively]. |
JNK Activation And Autophagy Facilitate Uptake Of AgNPs
To prove the connection between autophagic flux and endocytic trafficking, we inhibited autophagic flux with CQ and monitored endosomal marker, Rab7. Rab7 is implicated in the maturation of endosomes and/or autophagosomes, directing their fusion with lysosomes.29 We observed an accumulation of Rab7 protein when cells were treated with both CQ and AgNPs when compared to only CQ (Figure 5A), indicating that a flux blockage can affect trafficking. Since autophagy is tightly linked with endocytic trafficking,27 we were therefore interested to know whether modulation of autophagy or JNK signaling has any effect on endocytosis of AgNPs as well. Interestingly, inhibition of autophagy or JNK signaling with CQ or SP600125 respectively, resulted in reduced uptake of AgNPs with a more pronounced effect on autophagy inhibition (Figure 5B). In contrary, enhancing autophagy by Rapa, increased uptake of AgNPs (Figure 5C).
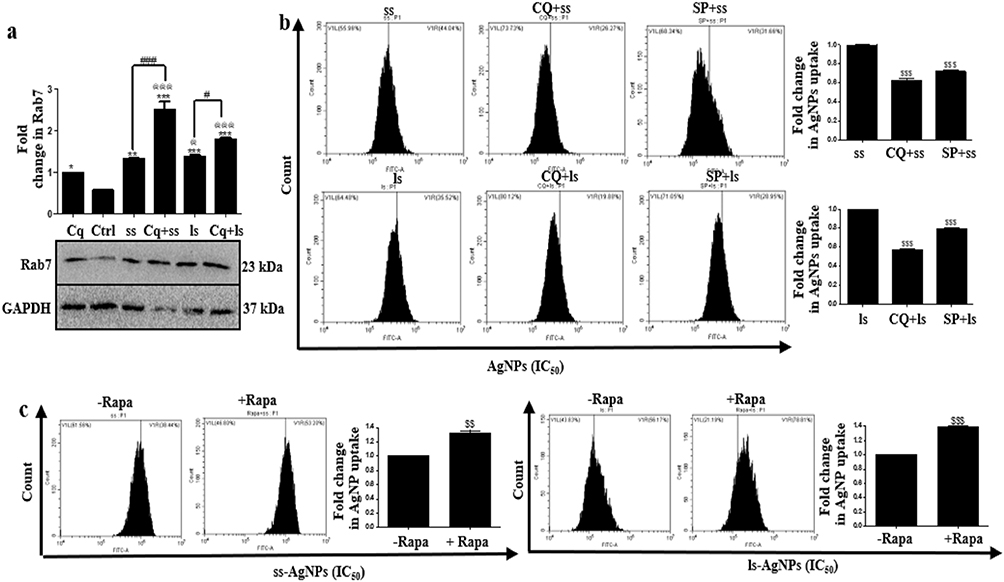 |
Figure 5 Analysis of correlation of JNK and autophagy signaling with NP uptake. (A) Immunoblot showing expression of Rab7 after treatment with IC50 dose of AgNPs for 6 h in presence or absence of CQ. [Symbol *@ and # represent significant difference with respect to untreated cells, CQ-treated cells and CQ plus NP treatment, respectively]. CQ (20 µM) was added 24 h before NP treatment. (B) Flow cytometric analysis of the uptake of AgNPs post inhibition of autophagy and JNK signaling. CQ (20 µM) or SP600125 (25 µM) were added 24 h before NP treatment (C) Flow cytometric analysis of the uptake of AgNPs post treatment with Rapa (500 nM). Rapa was added 24 h before NP treatment [$ represents significant difference with respect to AgNP treatment]. |
AgNP Accumulation Over Time In Turn Disrupts Trafficking And Autophagic Flux
Though there are previous reports that show activation of autophagic flux upon AgNP exposure,30 reports are scarce demonstrating delayed effects of the NPs on the endo-lysosome trafficking. Interestingly we observed that prolonged exposure to ss-AgNPs/ls-AgNPs led to an increased accumulation of both LC3B-II and p62 protein, indicating a blockage of autophagic flux (Figure 6A). We further observed an accumulation of Rab7 in a time-dependent manner upon AgNP exposure, with maximal accumulation at 24 h. We also found a gradual increase in early endosomal marker EEA1 (early endosome antigen 1) after 24 h of AgNP treatment, suggesting that AgNPs perturb the endocytic trafficking process (Figure 6B). An efficient management of protein aggregates is essential for cell viability, and autophagy primarily ensures this homeostasis.11 AgNP exposed cells showed increased green ubiquitin (GFP-Ub) punctate dots with considerably more at 24 h than 6 h (Figure 6C). Also, the total ubiquitinated protein content was higher at 24 h compared to 6 h of AgNP treatment (Figure 6D). Induction of flux with Rapa promoted clearance of aggregates and hence less ubiquitinated protein accumulation was observed with AgNP plus Rapa compared to only NPs (Figure 6D).
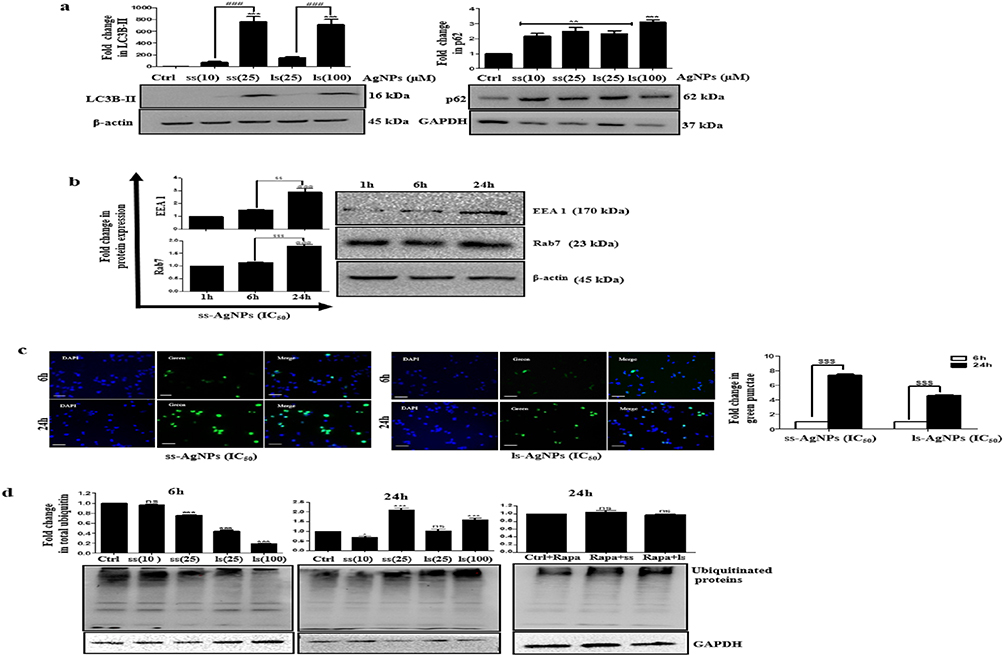 |
Figure 6 Analysis of AgNP accumulation over time on trafficking and autophagic flux. (A) Immunoblots showing expression of LC3B-II and p62 after AgNP exposure for 24 h. (B) Immunoblots showing expression of EEA1 and Rab7 at different time points post exposure to IC50 dose of AgNPs. (C) A comparative analysis of GFP-ub punctae green fluorescence after 6 h and 24 h of AgNP exposure. Scale bar- 200 µm. (D) Immunoblot showing total ubiquitinated protein after exposure to AgNPs. Rapa was added 24 h before NP treatment. [Symbol *#, @ and $ represent statistically significant difference with respect to untreated cells, AgNP-treated, 1 h AgNP treatment & 6/24 h of AgNP treatment respectively]. |
Disruption Of Lysosomal Function After Prolonged AgNP Exposure Results In Inhibition Of Autophagic Flux
The expression of LAMP1, a lysosome-associated membrane protein, was significantly ($$$) reduced at 24 h when compared to cells treated with AgNPs for 1 h or 6 h (Figure 7A). We further observed a significant ($$$) decrease in LysoTracker (LT) fluorescence after 24 h of AgNP exposure (Figure 7B). To further determine the stability of lysosomes in cells exposed to the NPs we used acridine orange (AO). A loss of lysosomal integrity is generally quantified as loss of AO red dots.31 We observed a time-dependent variation in AO red fluorescence, with a high red fluorescence at 6 h followed by a decrease by 24 h suggesting probable lysosomal membrane permeabilization (LMP) or disruption of lysosomal integrity upon prolonged AgNP exposure (Figure 7C). Interestingly, cells when treated with Rapa along with AgNPs, did not show the decrease in LT fluorescence, as observed with only NP (Figure 7D). Moreover, there was also increased retention of AO-red fluorescence with Rapa plus NP indicating existence of more functional lysosomes when Rapa is added (Figure 7E).
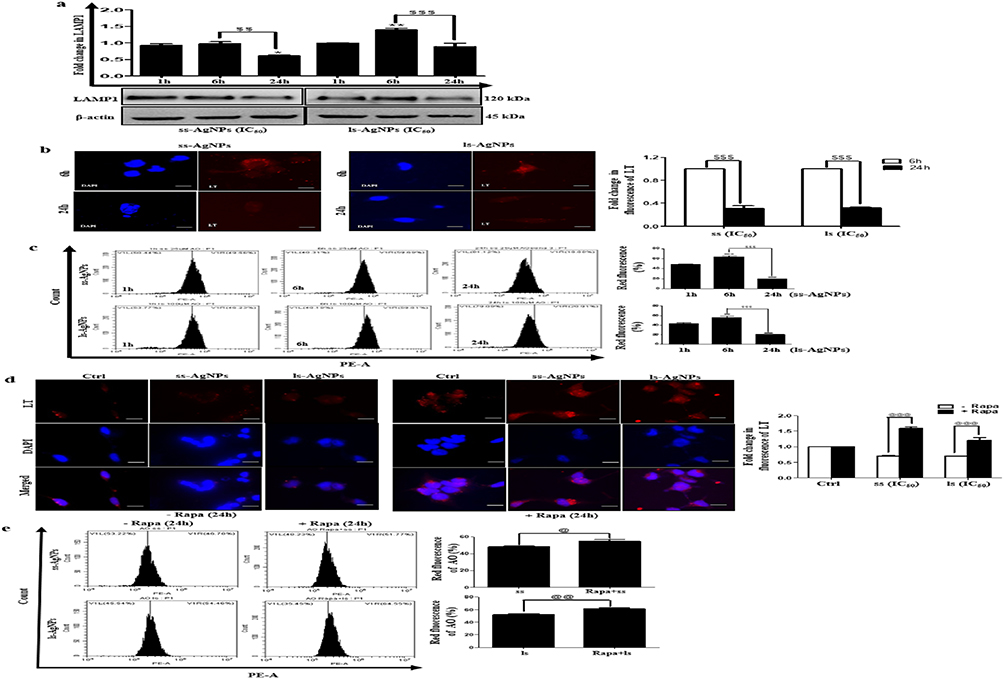 |
Figure 7 Analysis of prolonged AgNP exposure on lysosomal function. (A) Immunoblot showing comparative LAMP1 expression at different time points post-AgNP exposure. (B) A comparative analysis of LysoTracker Red fluorescence between 6 h and 24 h, post exposure to AgNPs. (C) A comparative analysis of AO red fluorescence at different time points as analyzed through flow cytometer post-exposure to AgNPs. [Significant difference between 6 h and 24 h of AgNP treatment with respect to 1 h is represented as (*), whereas as ($) represents a significant difference between 6 h and 24 h]. (D) A comparative analysis of LysoTracker Red fluorescence with or without Rapa, post exposure to AgNPs at IC50 dose for 24 h. (E) A comparative analysis of AO red fluorescence, in presence or absence of Rapa, post exposure to AgNPs at IC50 dose for 24 h. Rapa was added 24 h before NP treatment. [Symbol @ represents statistically significant difference with respect to AgNP-treated cells]. Scale bar- 200 µm. |
Autophagy Regulates Intra-Cellular ROS And Associated Cytotoxicity As Well
Autophagy is known to play a role in the regulation of intracellular reactive oxygen species (ROS).32 At early time point (6 h) when enhanced autophagic flux was observed, ROS levels were low; however, at 24 h when flux was inhibited, we observed a significantly(***) increased ROS (Figure 8A(i)). An increased ROS is the cause towards cytotoxicity was proved when a ROS quencher, N-acetyl cysteine (NAC) resulted in significantly (###) increased cell viability after AgNP treatment, more prominently at 24 h (Figure 8A(ii)). We thereafter inhibited autophagy by CQ and measured ROS. An enhanced ROS accumulation was observed along with increased cytotoxicity (Figure 8B(i) and (ii)). Interestingly, a significant (***) decrease in expression of LC3B-II protein levels was also observed after AgNP treatment in cells pre-exposed to NAC; this confirms the role autophagy in reducing ROS levels (Figure 8B(iii)). Further, upon genetic ablation of ATG5 with si-ATG5 an increased cytotoxicity to ss-AgNPs (~1.5 fold) and ls-AgNPs (~1.4 fold) was observed (Figure 8B(iv) and Supplementary Figure 5). AgNP-induced accumulation of ROS and associated cytotoxicity was reduced when the cells were treated with Rapa prior to NP exposure (Figure 8C). We thereafter checked for mitochondrial membrane potential (MMP; ΔΨM) after AgNP exposure using JC-1. Flow cytometric analysis showed a collapse in MMP in cells treated with AgNPs for 24 h (Figure 8D). As expected, a decrease in MMP was associated with apoptosis as confirmed by AnnexinV and PI staining (Figure 8E(i)); however, further extending AgNP exposure till 48 h increased cell population positive for PI only (Figure 8E(i)). AgNP induced apoptosis was further confirmed by observing a reduction in expression of total PARP protein upon exposure to IC50 dose of AgNPs for 24 h (Figure 8E(ii)).
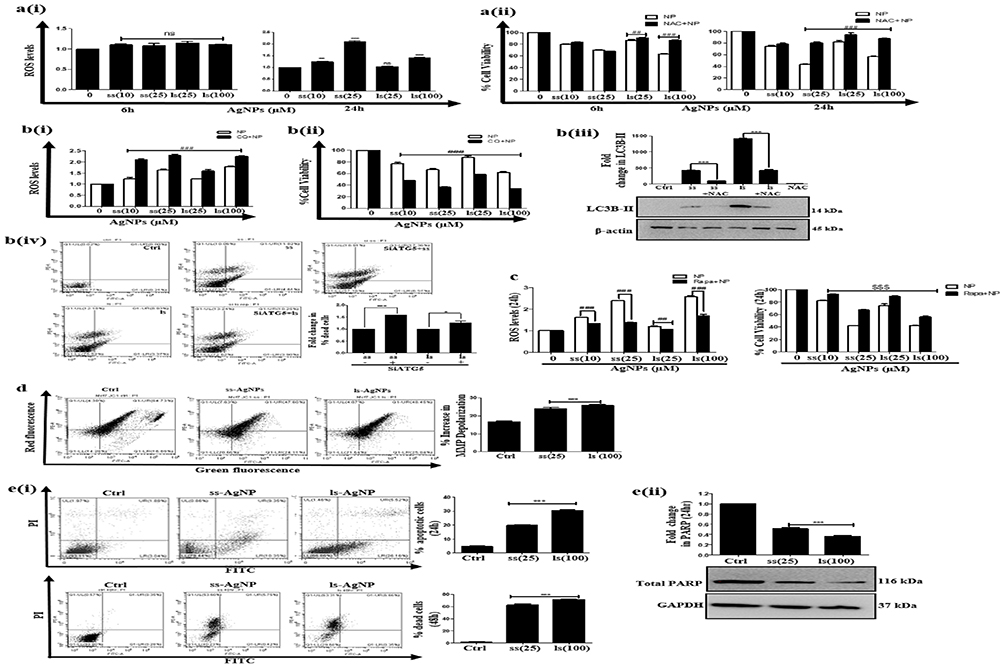 |
Figure 8 Analysis of autophagy mediated intra-cellular ROS and cytotoxicity. [A(i)] Fold change in intracellular ROS levels post-exposure to AgNPs for 6 h & 24 h, (ii) MTT assay analyzing cell viability after 6 h & 24 h of AgNP treatment, in presence or absence of NAC (20 mM). NAC was added 1 h before AgNP treatment. [B(i)] Fold change in intracellular ROS levels post-exposure to AgNPs for 6 h in presence or absence of CQ (20 µM). (ii) MTT assay measuring cell viability post-exposure to AgNPs for 6 h in the presence or absence of CQ. (iii) Immunoblots showing expression of LC3B-II protein after 24 h of AgNP treatment with or without NAC. (iv) AnnexinV/PI staining representing percentage of dead cells post-exposure to IC50 dose of AgNPs for 24 h, with or without silencing of ATG5, as analyzed through flow cytometry. (C) Fold change in intracellular ROS levels and cell viability analysis post-exposure to AgNPs for 24 h, in presence or absence of Rapa. (D) Flow cytometric analysis of MMP with JC-1 dye in cells treated with IC50 dose of AgNPs for 24 h. [E (i)] Dot plots of AnnexinV/PI staining post-exposure to IC50 dose of AgNPs for 24 h and 48 h, respectively, as analyzed through flow cytometry. (ii) Immunoblots showing expression of total PARP after exposure of IC50 dose of AgNPs for 24 h. [Symbol (*) and (#) represent a significant difference in AgNP-treated cells with respect to untreated control and specific inhibitor respectively]. |
Discussion
Existing literature shows elevated autophagy after AgNP treatment.5,7 Majority of the studies portray its role either in the promotion of cell survival and in rare situations, its paradoxical role in increased cell death. However, the correlation between AgNP internalization by the tumor cells and autophagy, as well as the temporal effect of AgNPs, if any, on autophagy has not been well characterized. Here, for the first time, we show that a perturbation of functional autophagic flux significantly affects the internalization of AgNPs, and the internalized AgNPs show a time-dependent effect on autophagy. This crosstalk between AgNP and autophagy was independent of the size of the NPs we studied. Though the small-sized AgNPs were more internalized than the large AgNPs, inhibition of autophagy by CQ negatively impacted internalization of both. Autophagy inducer rapamycin, in contrary, enhanced intra-cellular uptake. Importantly, a dynamin inhibitor maximally affected the uptake of ss-AgNPs, but not ls-AgNPs; however, irrespective of the route of entry, autophagy promoted uptake of the AgNPs. Nonetheless, it remains to be explored whether autophagy affects uptake of AgNPs with considerably larger variations in size. We further probed whether AgNPs, in turn, exert a size-dependent effect on autophagy. Both ss-AgNPs and ls-AgNPs, at their respective IC50 doses, exhibited significant induction of autophagy, mediated by upstream JNK activation. Autophagy induction was marked by increased LC3B-II and decreased p62 protein levels. Since LC3B-II is cleared by autophagy, we observed a nice co-localization of LC3B-II with labeled lysosomes post-AgNP exposure. However, this induction of flux was restricted to early time points of exposure only, like 1 h and 6 h. Interestingly, there was a contrasting inhibition of flux at later time points, like 24 h. The inhibition of flux was marked by p62, LC3B-II, and ubiquitinated protein accumulation alongside pronounced cytotoxic response. A disruption of vesicular trafficking associated with lysosomal damage also accompanied the above. We assume that tumor cells perceive NPs as foreign and hence they initially up-regulate autophagy directing and converging the endocytic routes towards lysosomes in an attempt to sequester or degrade the AgNPs. However, though lysosomes can influence the disposition of AgNPs, their persistence in turn negatively impacts the lysosomal function and hence subsequent autophagic flux. Now, as autophagy is known to play a key role in selective degradation of stress-induced protein aggregates, hence, an AgNP-induced impairment of autophagic flux results in increased protein accumulation, consequently leading to an aggravated cytotoxic response. Furthermore, we speculate that the p62 protein accumulation, a probable outcome of defective flux, may also provoke cellular stress enhancing AgNP-induced cytotoxic effects. We observed an enhanced ROS associated with defective autophagy after prolonged AgNP exposure. Use of Rapamycin, an autophagy inducer diminished ROS levels and mitigated ROS-induced cytotoxicity. Existing literature suggests that oxidative stress might affect cellular homeostasis, including disruption of proteostasis.30,33 Therefore, the accumulation of ubiquitinated proteins, after prolonged AgNP exposure, might be the product of both oxidative stress on proteostasis, coupled with an impaired autophagic flux. Figure 9 summarizes the crosstalk of AgNPs with autophagy. Overall, in this study we show that though the size of AgNPs might impact their initial internalization dynamics but the subsequent intra-cellular effect on autophagy does not correlate with their size; both NPs at their respective IC50 doses result in similar intra-cellular effects marked by an initial autophagy induction followed by inhibition of flux over time. Thus, the role of autophagy dynamically changes over time, suggesting that it might be misleading to assign one particular function to autophagy. This temporal divergence of autophagy necessitates further investigations into selective autophagy like, mitophagy or ER phagy which are currently investigated as a follow up to this study. Our results provide exciting new observations on temporal variations of autophagy and its role relevant to AgNP entry, trafficking into tumor cells, and the subsequent effect on tumor cell death which might be relevant for future enhancement of AgNP-induced therapy.
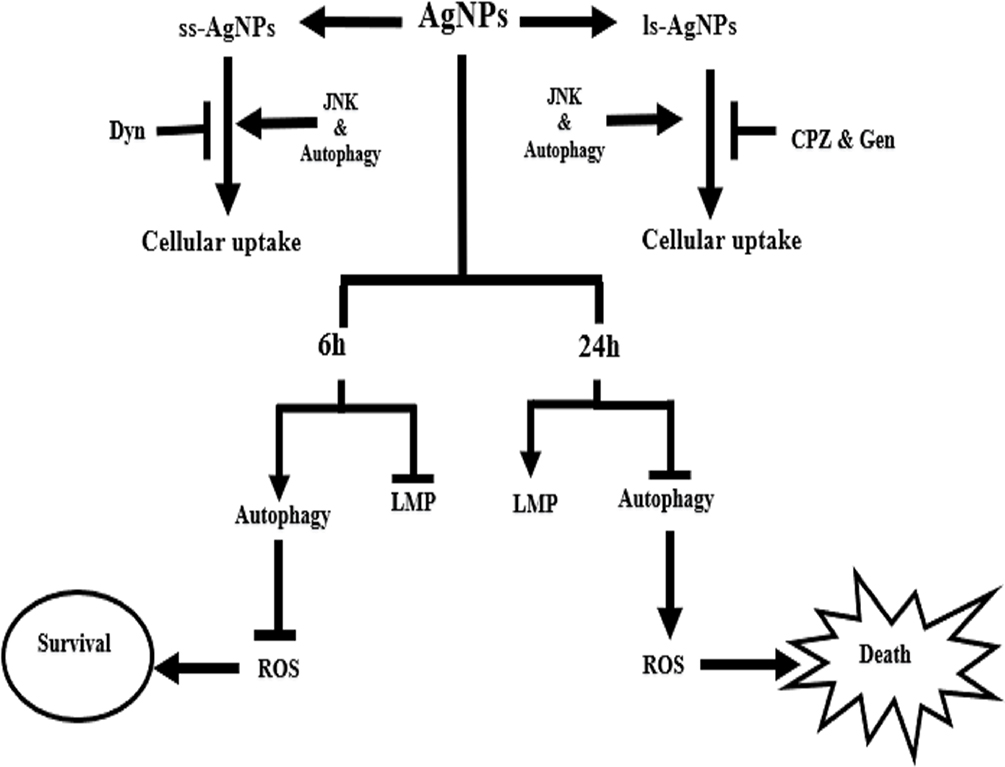 |
Figure 9 Schematic representation of the crosstalk between AgNP and autophagy. |
Acknowledgments
We acknowledge BITS-Pilani for providing us infrastructural support. LF thanks UGC for providing student fellowship.
Author Contributions
LF, AM, and VB contributed in acquisition of data. All authors contributed to data analysis, drafting and revising the article, gave final approval of the version to be published, and agree to be accountable for all aspects of the work.
Disclosure
The authors report no conflicts of interest in this work.
References
1. Sriram MI, Kanth SB, Kalishwaralal K, Gurunathan S. Antitumor activity of silver nanoparticles in Dalton’s lymphoma ascites tumor model. Int J Nanomedicine. 2010;5:753–762. doi:10.2147/IJN.S11727
2. Liu P, Huang Z, Chen Z, et al. Silver nanoparticles: a novel radiation sensitizer for glioma? Nanoscale. 2013;5(23):11829–11836. doi:10.1039/c3nr01351k
3. Cui Z, Zhang Y, Xia K, et al. Nanodiamond autophagy inhibitor allosterically improves the arsenical-based therapy of solid tumors. Nat Commun. 2018;9(1):4347. doi:10.1038/s41467-018-06749-2
4. Yang F, Huang W, Li Y, et al. Anti-tumor effects in mice induced by survivin-targeted siRNA delivered through polysaccharide nanoparticles. Biomaterials. 2013;34(22):5689–5699. doi:10.1016/j.biomaterials.2013.03.047
5. Fageria L, Pareek V, Dilip RV, et al. Biosynthesized protein-capped silver nanoparticles induce ros-dependent proapoptotic signals and prosurvival autophagy in cancer cells. ACS Omega. 2017;2(4):1489–1504. doi:10.1021/acsomega.7b00045
6. Hussain SM, Hess KL, Gearhart JM, Geiss KT, Schlager JJ. In vitro toxicity of nanoparticles in BRL 3A rat liver cells. Toxicol In Vitro. 2005;19(7):975–983. doi:10.1016/j.tiv.2005.06.034
7. Hsiao I-L, Hsieh Y-K, Chuang C-Y, Wang C-F, Huang Y-J. Effects of silver nanoparticles on the interactions of neuron- and glia-like cells: toxicity, uptake mechanisms, and lysosomal tracking. Environ Toxicol. 2017;32(6):1742–1753. doi:10.1002/tox.22397
8. Sahay G, Alakhova DY, Kabanov AV. Endocytosis of nanomedicines. J Control Release. 2010;145(3):182–195. doi:10.1016/j.jconrel.2010.01.036
9. Kou L, Sun J, Zhai Y, He Z. The endocytosis and intracellular fate of nanomedicines: implication for rational design. Asian J Pharm Sci. 2013;8(1):1–10. doi:10.1016/j.ajps.2013.07.001
10. Lamb CA, Dooley HC, Tooze SA. Endocytosis and autophagy: shared machinery for degradation. Bioessays. 2013;35(1):34–45. doi:10.1002/bies.201200130
11. Galluzzi L, Baehrecke EH, Ballabio A, et al. Molecular definitions of autophagy and related processes. EMBO J. 2017;36(13):1811–1836. doi:10.15252/embj.201796697
12. Xu Y, Wang L, Bai R, Zhang T, Chen C. Silver nanoparticles impede phorbol myristate acetate-induced monocyte–macrophage differentiation and autophagy. Nanoscale. 2015;7(38):16100–16109. doi:10.1039/C5NR04200C
13. Pande S, Ghosh SK, Praharaj S, et al. Synthesis of normal and inverted gold− silver core− shell architectures in β-cyclodextrin and their applications in SERS. J Phys Chem C. 2007;111(29):10806–10813. doi:10.1021/jp0702393
14. Adeoye O, Cabral-Marques H. Cyclodextrin nanosystems in oral drug delivery: a mini review. Int J Pharm. 2017;531(2):521–531. doi:10.1016/j.ijpharm.2017.04.050
15. Saini H, Hakeem I, Mukherjee S. Autophagy regulated by gain of function mutant p53 enhances proteasomal inhibitor-mediated cell death through induction of ROS and ERK in lung cancer cells. J Oncol. 2019;2019:6164807. doi:10.1155/2019/6164807
16. Mukherjee S, Dash S, Lohitesh K, Chowdhury R. The dynamic role of autophagy and MAPK signaling in determining cell fate under cisplatin stress in osteosarcoma cells. PLoS One 2017;12(6):e0179203.
17. Zucker RM, Daniel KM, Massaro EJ, Karafas SJ, Degn LL, Boyes WK. Detection of silver nanoparticles in cells by flow cytometry using light scatter and far-red fluorescence. Cytometry A. 2013;83(10):962–972. doi:10.1002/cyto.a.22342
18. Mo L, Hou L, Guo D, Xiao X, Mao P, Yang X. Preparation and characterization of teniposide PLGA nanoparticles and their uptake in human glioblastoma U87MG cells. Int J Pharm. 2012;436(1–2):815–824. doi:10.1016/j.ijpharm.2012.07.050
19. Vercauteren D, Vandenbroucke RE, Jones AT, et al. The use of inhibitors to study endocytic pathways of gene carriers: optimization and pitfalls. Mol Ther. 2010;18(3):561–569. doi:10.1038/mt.2009.281
20. Yang Y, Qu R, Fan T, et al. Cross-talk between microtubules and the linker of nucleoskeleton complex plays a critical role in the adipogenesis of human adipose-derived stem cells. Stem Cell Res Ther. 2018;9(1):125–139. doi:10.1186/s13287-018-0836-y
21. Sun J, Liu Y, Ge M, et al. A distinct endocytic mechanism of functionalized-silica nanoparticles in breast cancer stem cells. Sci Rep. 2017;7(1):16236. doi:10.1038/s41598-017-16591-z
22. Harush-Frenkel O, Debotton N, Benita S, Altschuler Y. Targeting of nanoparticles to the clathrin-mediated endocytic pathway. Biochem Biophys Res Commun. 2007;353(1):26–32. doi:10.1016/j.bbrc.2006.11.135
23. Takei K, Slepnev VI, Haucke V, De Camilli P. Functional partnership between amphiphysin and dynamin in clathrin-mediated endocytosis. Nat Cell Biol. 1999;1(1):33–39. doi:10.1038/9004
24. Macia E, Ehrlich M, Massol R, Boucrot E, Brunner C, Kirchhausen T. Dynasore, a cell-permeable inhibitor of dynamin. Dev Cell. 2006;10(6):839–850. doi:10.1016/j.devcel.2006.04.002
25. Preta G, Cronin JG, Sheldon IM. Dynasore-not just a dynamin inhibitor. Cell Commun Signal. 2015;13(1):24–31. doi:10.1186/s12964-015-0102-1
26. Basagiannis D, Zografou S, Galanopoulou K, Christoforidis S. Dynasore impairs VEGFR2 signalling in an endocytosis-independent manner. Sci Rep. 2017;7:45035. doi:10.1038/srep45035
27. Tooze SA, Abada A, Elazar Z. Endocytosis and autophagy: exploitation or cooperation? Cold Spring Harb Perspect Biol. 2014;6(5):a018358. doi:10.1101/cshperspect.a018358
28. Zhang XJ, Chen S, Huang KX, Le WD. Why should autophagic flux be assessed? Acta Pharmacol Sin. 2013;34(5):595–599. doi:10.1038/aps.2012.184
29. Jager S, Bucci C, Tanida I, et al. Role for Rab7 in maturation of late autophagic vacuoles. J Cell Sci. 2004;117(Pt 20):4837–4848. doi:10.1242/jcs.01370
30. Lee Y-H, Cheng F-Y, Chiu H-W, et al. Cytotoxicity, oxidative stress, apoptosis and the autophagic effects of silver nanoparticles in mouse embryonic fibroblasts. Biomaterials. 2014;35(16):4706–4715. doi:10.1016/j.biomaterials.2014.02.021
31. Paglin S, Hollister T, Delohery T, et al. A novel response of cancer cells to radiation involves autophagy and formation of acidic vesicles. Cancer Res. 2001;61(2):439–444.
32. Dash S, Sarashetti PM, Rajashekar B, Chowdhury R, Mukherjee S. TGF-β2-induced EMT is dampened by inhibition of autophagy and TNF-α treatment. Oncotarget. 2018;9(5):6433. doi:10.18632/oncotarget.23942
33. Miyayama T, Matsuoka M. Involvement of lysosomal dysfunction in silver nanoparticle-induced cellular damage in A549 human lung alveolar epithelial cells. J Occup Med Toxicol. 2016;1(1):1–6. doi:10.1186/s12995-016-0090-0
 © 2019 The Author(s). This work is published and licensed by Dove Medical Press Limited. The full terms of this license are available at https://www.dovepress.com/terms.php and incorporate the Creative Commons Attribution - Non Commercial (unported, v3.0) License.
By accessing the work you hereby accept the Terms. Non-commercial uses of the work are permitted without any further permission from Dove Medical Press Limited, provided the work is properly attributed. For permission for commercial use of this work, please see paragraphs 4.2 and 5 of our Terms.
© 2019 The Author(s). This work is published and licensed by Dove Medical Press Limited. The full terms of this license are available at https://www.dovepress.com/terms.php and incorporate the Creative Commons Attribution - Non Commercial (unported, v3.0) License.
By accessing the work you hereby accept the Terms. Non-commercial uses of the work are permitted without any further permission from Dove Medical Press Limited, provided the work is properly attributed. For permission for commercial use of this work, please see paragraphs 4.2 and 5 of our Terms.