")
Back to Journals » Journal of Pain Research » Volume 13
Functional and Structural Changes in Postherpetic Neuralgia Brain Before and Six Months After Pain Relieving
Authors Zhang Y, Cao S, Yuan J, Song G, Yu T, Liang X
Received 21 January 2020
Accepted for publication 17 April 2020
Published 4 May 2020 Volume 2020:13 Pages 909—918
DOI https://doi.org/10.2147/JPR.S246745
Checked for plagiarism Yes
Review by Single anonymous peer review
Peer reviewer comments 3
Editor who approved publication: Professor E Alfonso Romero-Sandoval
Yi Zhang,1,2 Song Cao,2,3 Jie Yuan,2,3 Ganjun Song,2,4 Tian Yu,2 Xiaoli Liang5
1Department of Anesthesiology, The Second Affiliated Hospital of Zunyi Medical University, Zunyi 563002, Guizhou, People’s Republic of China; 2Guizhou Key Laboratory of Anesthesia and Organ Protection, Zunyi Medical University, Zunyi, People’s Republic of China; 3Department of Pain Medicine, Affiliated Hospital of Zunyi Medical University, Zunyi, People’s Republic of China; 4Department of Radiology, Affiliated Hospital of Zunyi Medical University, Zunyi 563000, Guizhou, People’s Republic of China; 5Department of Anesthesiology, Zunyi Medical University, Zunyi 563002, Guizhou, People’s Republic of China
Correspondence: Xiaoli Liang
Department of Anesthesiology, Affiliated Hospital of Zunyi Medical University, Zunyi 563000, Guizhou, People’s Republic of China
Tel +8613648521600
Email [email protected]
Objective: Multimodal magnetic resonance imaging (MRI) was used to detect whether 6 months after pain relieving, the structural and functional abnormalities in the brain of postherpetic neuralgia (PHN) patients are changeable.
Methods: Fifteen successfully treated PHN patients were enrolled; the brain activity and structural abnormalities were detected and compared before and 6 months after treatment. The functional parameters were evaluated with resting-state functional MRI technique, i.e., the regional homogeneity (ReHo) and fractional amplitude of low-frequency fluctuation (fALFF). Structural changes were detected with voxel-based morphometry (VBM) and diffusion kurtosis imaging (DKI).
Results: Six months after pain relieving, PHN brain showed different ReHo and fALFF values in the frontal lobe, caudate, supramarginal gyrus, anterior cingulate cortex (ACC), cuneus, middle temporal gyrus, and cerebellum. In addition, VBM intensity in the cerebellum increased; DKI values decreased in the thalamus and increased in the temporal lobe after successful treatment.
Conclusion: Six months after pain relieving, functional and structural changes exist in PHN brain. Changes in some differential areas in PHN brain, such as ACC, frontal lobe, thalamus, and temporal lobe indicate that the central plasticity may be reversible after chronic pain relieving.
Keywords: postherpetic neuralgia, PHN, functional magnetic resonance imaging, regional homogeneity, ReHo, fractional amplitude of low-frequency fluctuation, fALFF
Introduction
Herpes zoster causes many complications, among which postherpetic neuralgia (PHN) is the most common and refractory one.1 PHN is one kind of neuropathic pain lasting more than one2 or three months1,3 after the outbreak of herpes zoster (shingles). PHN has been an economic burden of the gradually aging society.4 In China, the estimated prevalence rates of herpes zoster and PHN from hospital patients were 7.7% and 2.3%, respectively.5 PHN not only affects patients’ quality of life6 but also increases the risks of anxiety, depression, and suicide.7,8 Unfortunately, the mechanisms of PHN are still not fully understood.9
By using functional magnetic resonance imaging (fMRI), accumulating evidence showed functional abnormalities in PHN brain.10–14 For example, functional connectivity analysis revealed altered connections between putamen and other regions in PHN brain.11 Small-world network detection showed decreased local efficiency in sense, memory, and emotion-related brain areas in PHN brain.12 Our previous work showed functional abnormalities in PHN brain in the pain matrix (frontal lobe, insular and cerebellum etc.), occipital lobe, temporal lobe, and brainstem.15–17
Chronic pain causes central sensitization and plasticity changes in the brain.18,19 Multimodal MRI studies indicate microstructure abnormalities in the gray and white matter of PHN brain.20,21 Compared with healthy brain, PHN brain exhibited significantly decreased DKI values in the gray matter,20 and reduced diffusion tensor imaging (DTI) values in white matter,21 which means abnormal microstructural integrity. Of note, compared with healthy brain, gray matter volume (GMV) changes have been found in many areas in PHN brain, such as insula, middle frontal gyrus, cerebellar posterior lobe, parahippocampal gyrus, and so on.22 Furthermore, two studies compared VBM values between PHN and herpes zoster brain; GMV differences were found in limbic lobe (hippocampus and parahippocampal gyrus), frontal lobe, thalamus, occipital lobe, parietal lobe, cerebellum, etc.,17,22 which suggest that pain duration of herpetic neuralgia influences GMV.
Whether the structure and function of these abnormal brain areas can recover after successful treatments and pain relief is of interest. Geha et al10 found that after 6 h or two-week treatment of PHN patients with 5% lidocaine patch, the spontaneous pain was significantly reduced, and for most of the pain-activated areas, the brain activities were significantly reduced.10 The ventral striatal and amygdala activity, which was modulated by longer-term treatment, reflected changes in neuropathic pain score.10 Six months after the effective treatment of chronic low back pain, the abnormal functional connection between the insula and prefrontal lobes began to recover,23 and the cortex thickness of the dorsolateral prefrontal lobes increased significantly.24 When the chronic pain of patients with osteoarthritis was relieved after joint replacement, 9 months after operation, the decreased GMV of thalamus recovered,25 and the decreased GMV of anterior motor cortex and auxiliary motor cortex gradually recovered one year after operation.26 However, whether successful treatment can reverse the microstructural damage and GMV changes in PHN brain has not been reported.
Here, we focus on the brain activity and structural changes in PHN patients who recovered for 6 months after treatment. The brain activity, GMV, and microstructural damages were detected with multimodal MRI.
Methods
Participants
This study was approved by the ethics committee of the Affiliated Hospital of Zunyi Medical University, and conducted in accordance with the Declaration of Helsinki. Written informed consents were obtained from all patients. All of the 15 right-handed patients were recruited from the Department of Pain Medicine of the local hospital. The diagnosis of PHN was based on the International Association for the Study of Pain (IASP) criteria.27 Spontaneous pain intensity was evaluated with visual analogue scale (VAS), and depression level of PHN patients was evaluated with Beck depression inventory (BDI). Patients were treated with combination therapy as guidelines recommended,28 including: i) Antiepileptic drugs; ii) Opioid analgesics; iii) Neurotrophic drugs; iv) Paravertebral nerve block; and v) Physical therapy. PHN patients were discharged when the pain was relieved (VAS score < 3). Only PHN patients claimed: i) intense thoracic herpetic neuralgia (VAS scores ≥ 5) on the right side on the admission day; ii) herpetic neuralgia relieved (VAS < 3) for 6 months after treatment; iii) with no depression symptoms and with low BDI scores (<10) were enrolled. No opioid analgesics, antidepressants, or antipsychotic drugs were taken one month before MRI scans. All patients showed no visible structural abnormalities from brain MRI images. Patients in the present study received twice MRI scan: first time was on the admission day, before treatments (T1), and the second one was 6 months after enrollment and treatment (T2). After discharging, all patients did not receive additional treatment.
Image Acquisition
MRI images were acquired as reported,15,16 patients were scanned with a GE Signa HDxT 3.0 T MRI scanner (GE company, USA) with a standard 8-channel head coil. fMRI images were acquired using an echo-planar image (EPI) sequence with parameters as follows: thickness/gap = 4.0/0 mm, matrix = 64 × 64, TR = 2000 ms, TE = 40 ms, flip angle = 90°, field of view (FOV) = 240 × 240 mm. A total of 210 time points and 33 axial slices were obtained in 7 minutes. DKI images were acquired using spin-echo single-shot echo-planar imaging sequences, with TR/TE = 10,000/99.3 ms, thickness/gap = 4.0/0 mm, FA: 15°, FOV: 240 × 240 mm3, matrix: 128 × 128, scan time is 530 s, and a total of 1820 images were collected for DKI analyses. High-resolution anatomic 3D T1 images were acquired with the TR = 5.8 ms, TE = 1.8 ms, flip angle = 12°, thickness/gap = 1.0/0 mm, FOV = 256 × 256 mm, matrix = 256 × 256, 146 sagittal slices were collected.
Image Processing
The fMRI mages were processed with the Data Processing Assistant for Resting-State fMRI (DPARSF, http://rest.restfmri.net/forum/DPARSF)29 and SPM8 (Wellcome Department, University College of London, UK) software based on MATLAB R2012a (MathWorks, USA).
The processes with DPARSF were as follows: the first 10 volumes of the fMRI images were discarded considering scanner calibration and participants adaptation during the scan, then the remaining 200 volumes were further analyzed for slice timing, head-motion correction, spatial normalization to the Montreal Neurological Institute (MNI) space and resampling with a 3 × 3 × 3 mm3 resolution. Patients with a head motion > 2.0 mm or >2.0° of rotation in any direction were excluded, and linear trends of the MRI data were removed. For ReHo analyses, to discard high-frequency physiological noise and the frequency drift lower than 0.01 Hz, the band-pass filtering was set as 0.01–0.08 Hz.30 The Resting State fMRI Data Analysis Toolkit (REST, http://rest.restfmri.net)31 was used for the subsequent analyses: individual ReHo map was generated by calculating the KCC of the time series of a given voxel with those of its neighbors (26 voxels) in a voxel-wise way.32,33 Then, a whole-brain mask was adopted to remove the non-brain tissues. The individual ReHo maps were divided by their own global mean KCC within the whole-brain mask to assure standardization. Afterward, spatial smoothing was performed on individual standardized ReHo map with a Gaussian kernel of 4 mm full-width at half maximum (FWHM).34
fALFF analysis was performed as previously described.35,36 Firstly, the resampled images were smoothed with a 4 mm Gaussian kernel and filtered with a 0.01–0.08 Hz frequency band, then the time courses were filtered with this frequency band using a Fast Fourier Transform. The mean and standard deviation of individual’s ReHo and fALFF value were calculated by DPARSF within the whole-brain mask.
The VBM37 and DKI analysis20 were performed with SPM8, DKE toolbox,38 and FMRIB Software Library (Oxford University, UK) as reported. The procedures included the following steps: i) checking for scanner artifacts and gross anatomical abnormalities for each subject; ii) setting the image origin to the anterior commissure; iii) segmenting the images into gray matter, white matter, and cerebrospinal fluid (CSF) images; iv) using the DARTEL toolbox on SPM8 to produce a high-dimensional normalization protocol; and v) checking for homogeneity across the sample and applying a 8 mm FWHM Gaussian kernel standard smoothing. After this pre-processing, modulated, smoothed, and normalized images were obtained for statistical analysis.
DKI analyses included the following steps: each DKI parameter was estimated from the DKI image by DKE software. The parameters mainly include: DKI oriented mean kurtosis (MK), axial kurtosis (AK), radial kurtosis (RK), and fractional anisotropy (FA); DTI oriented FA, mean diffusion tensor (MD), axial diffusion tensor (AD), and radial diffusion (RD).
Statistical Analysis
Clinical data of PHN patients were analyzed using Prism 7.0 (GraphPad Software Inc, USA). Paired t-tests were used for detecting the VAS score differences. P < 0.05 was considered as statistically significant.
Paired t-tests were conducted with REST in whole-brain voxel-wise way for ReHo, fALFF, VBM, and DKI comparisons between two time points. To further determine the significances, multiple comparison correction was performed with Monte Carlo simulations39 with the REST AlphaSim utility.31 Voxels with P < 0.05 (two-tailed, with AlphaSim correction: http://afni.nih.gov/afni/docpdf/AlphaSim.pdf) were regarded as brain areas of significant difference.
REST Slice Viewer was employed to display statistic results31 and images. Brain areas were overlaid on brain MRI template images. A color-bar was set to illustrate the statistic values.20
Results
Demographic and Clinical Features
Clinical characteristics of 15 PHN patients (female: male = 8:7) are listed in Table 1. The comparison of VAS score indicates that 6 months after treatment, patients had significantly lower VAS scores: 7.1 ± 1.2 vs 0.7 ± 0.8, P < 0.0001.
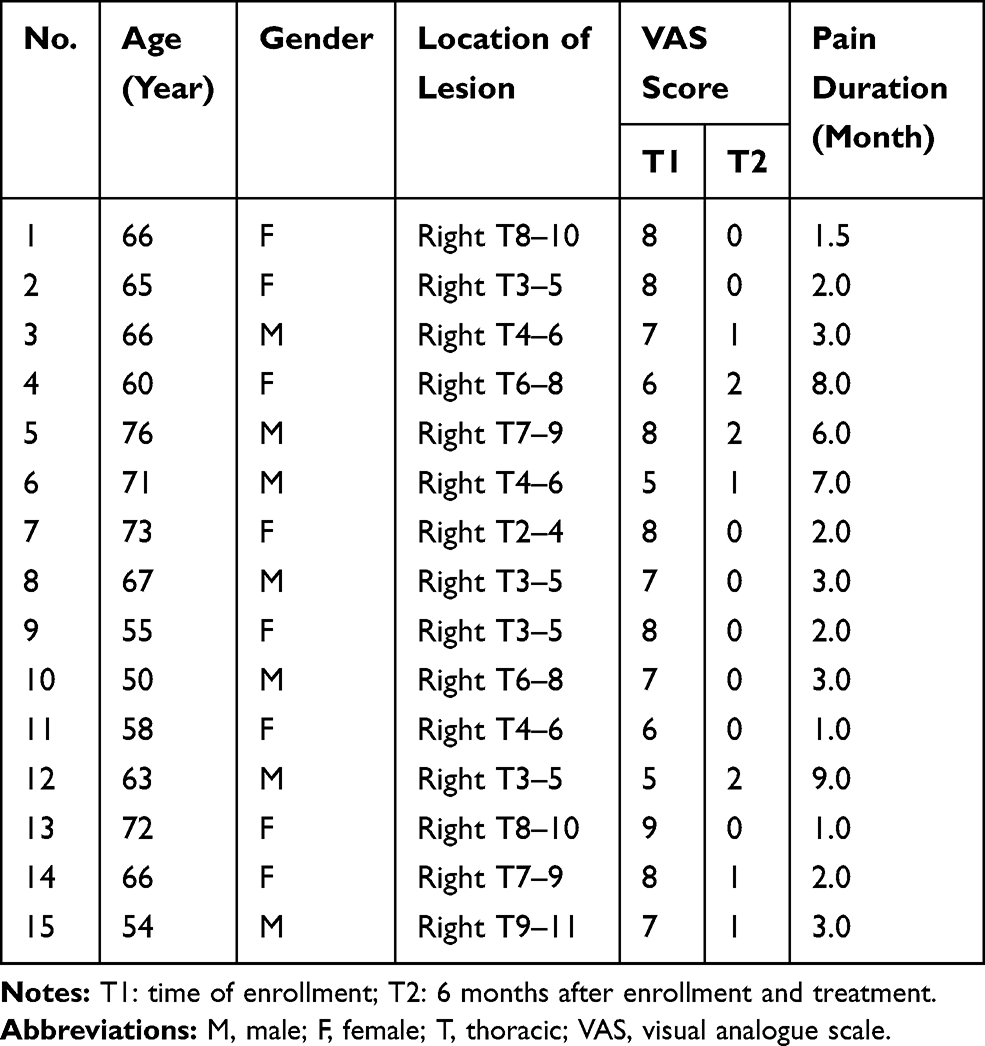 |
Table 1 Demographic and Clinical Variables of 15 PHN Patients Before Treatment and Six Months After Pain Relieving |
Comparisons of ReHo Before and After Treatment
The ReHo values of multiple regions in the brain of PHN patients significantly changed 6 months after comprehensive treatment. These areas are shown in Figure 1 and Table 2. After treatments, ReHo value increased in temporal lobe, cerebellum, cingulate gyrus, and precuneus, while part of temporal lobe, cingulate gyrus, and frontal lobe showed decreased ReHo after treatments (P < 0.05, AlphaSim correction). Detailed information of these differential areas is listed in Table 2.
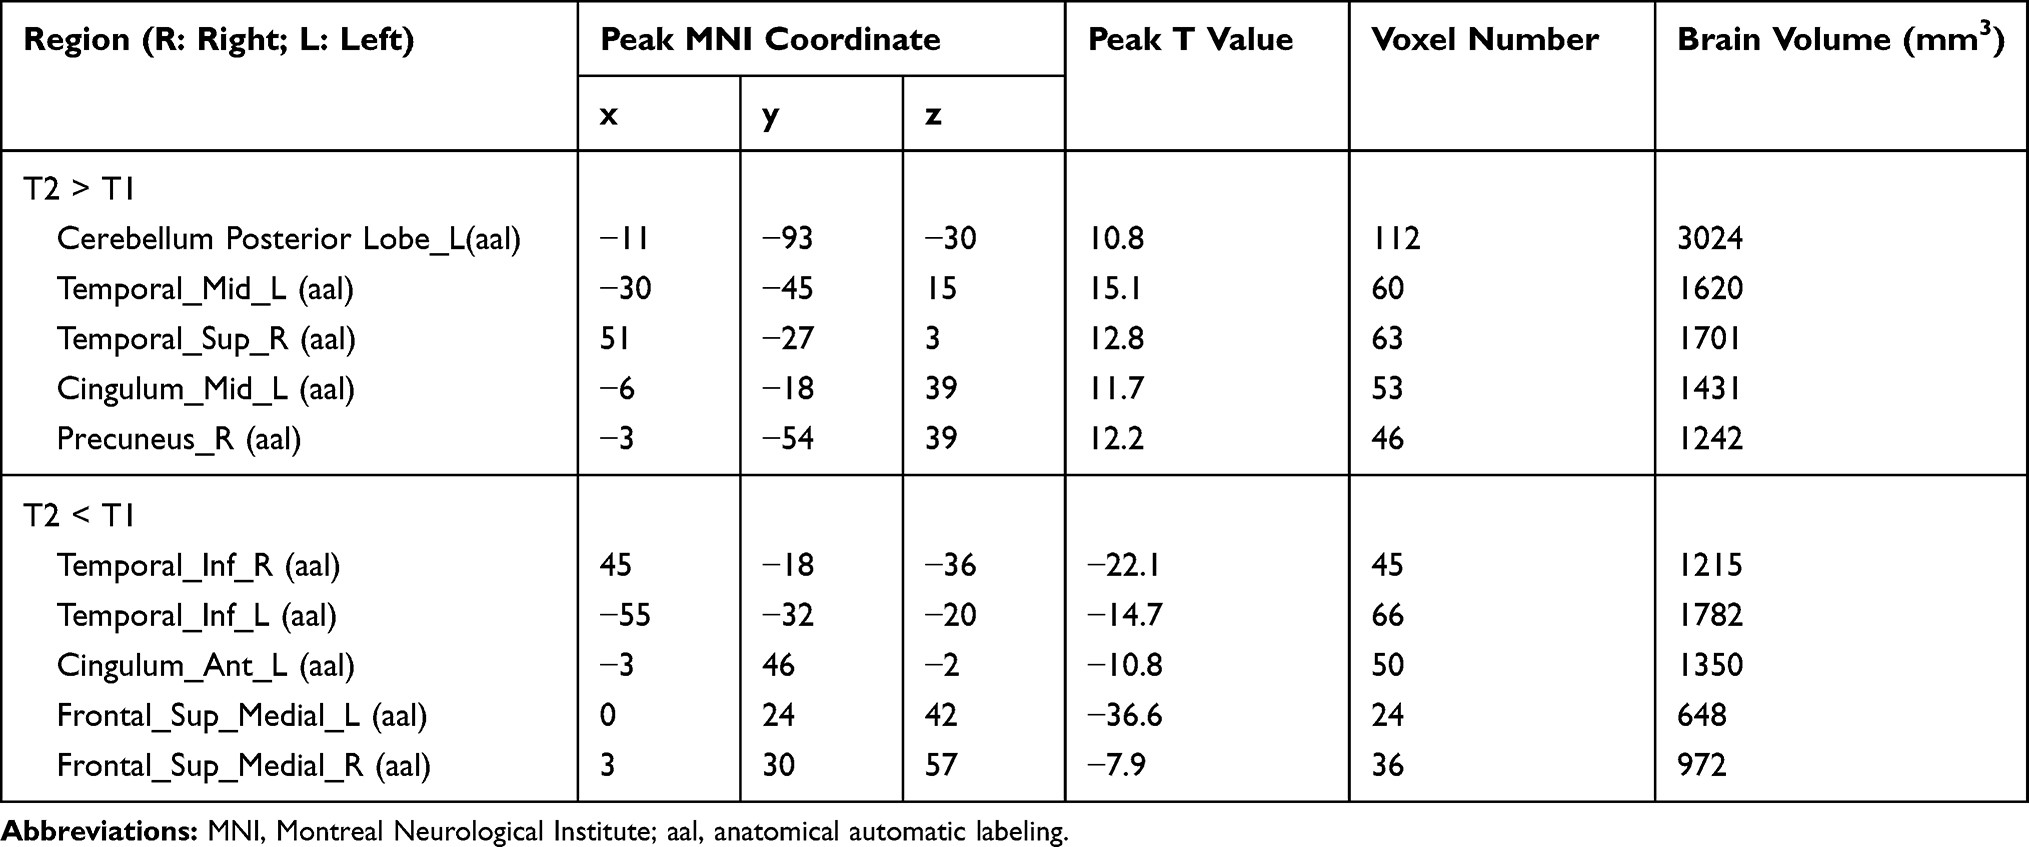 |
Table 2 Clusters with Different ReHo Values Six Months After Treatment |
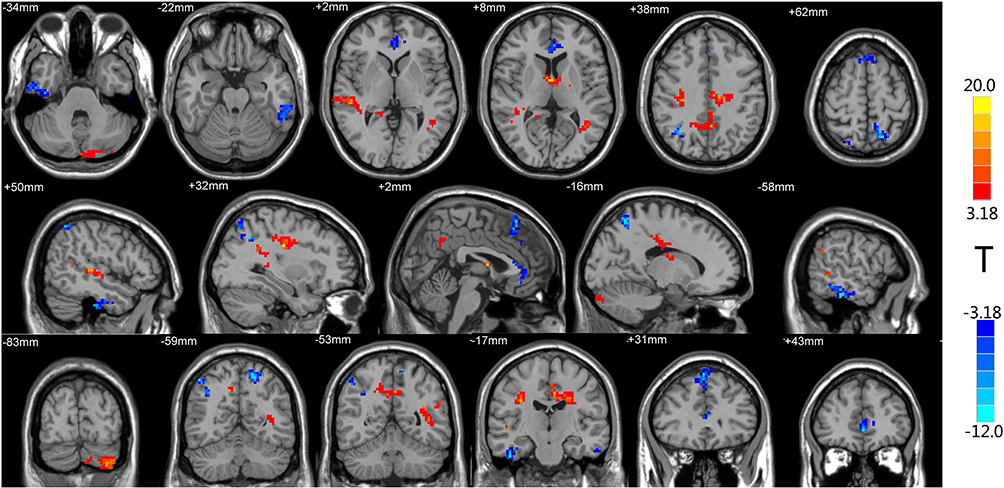 |
Figure 1 Brain regions with differential ReHo values after treatment. The distribution of ReHo differential brain areas in the transversal sections (upper row), sagittal sections (middle row), and coronal sections (third row) after treatment. The red and yellow colors indicate higher ReHo value, while blue colors indicate lower ReHo in PHN brain 6 months after treatment, compared with the admission day (P < 0.05, AlphaSim corrected, paired t-test, n=15). Brain areas with increased ReHo mainly in the temporal lobe, cerebellum, cingulate gyrus, and precuneus. Lower ReHo values were detected in the temporal lobe, anterior cingulate gyrus, and frontal lobe (Table 2). |
Comparisons of fALFF Before and After Treatment
As shown in Figure 2 and Table 3, the fALFF values of multiple regions in the brain of PHN patients significantly changed 6 months after comprehensive treatments. The areas where the fALFF value increased after treatments were: bilateral frontal lobe and bilateral caudate, while the right supramarginal gyrus and lingual gyrus showed decreased fALFF after treatments (P < 0.05, AlphaSim corrected). The MNI space coordinates, T value, and corresponding voxels are listed in Table 3.
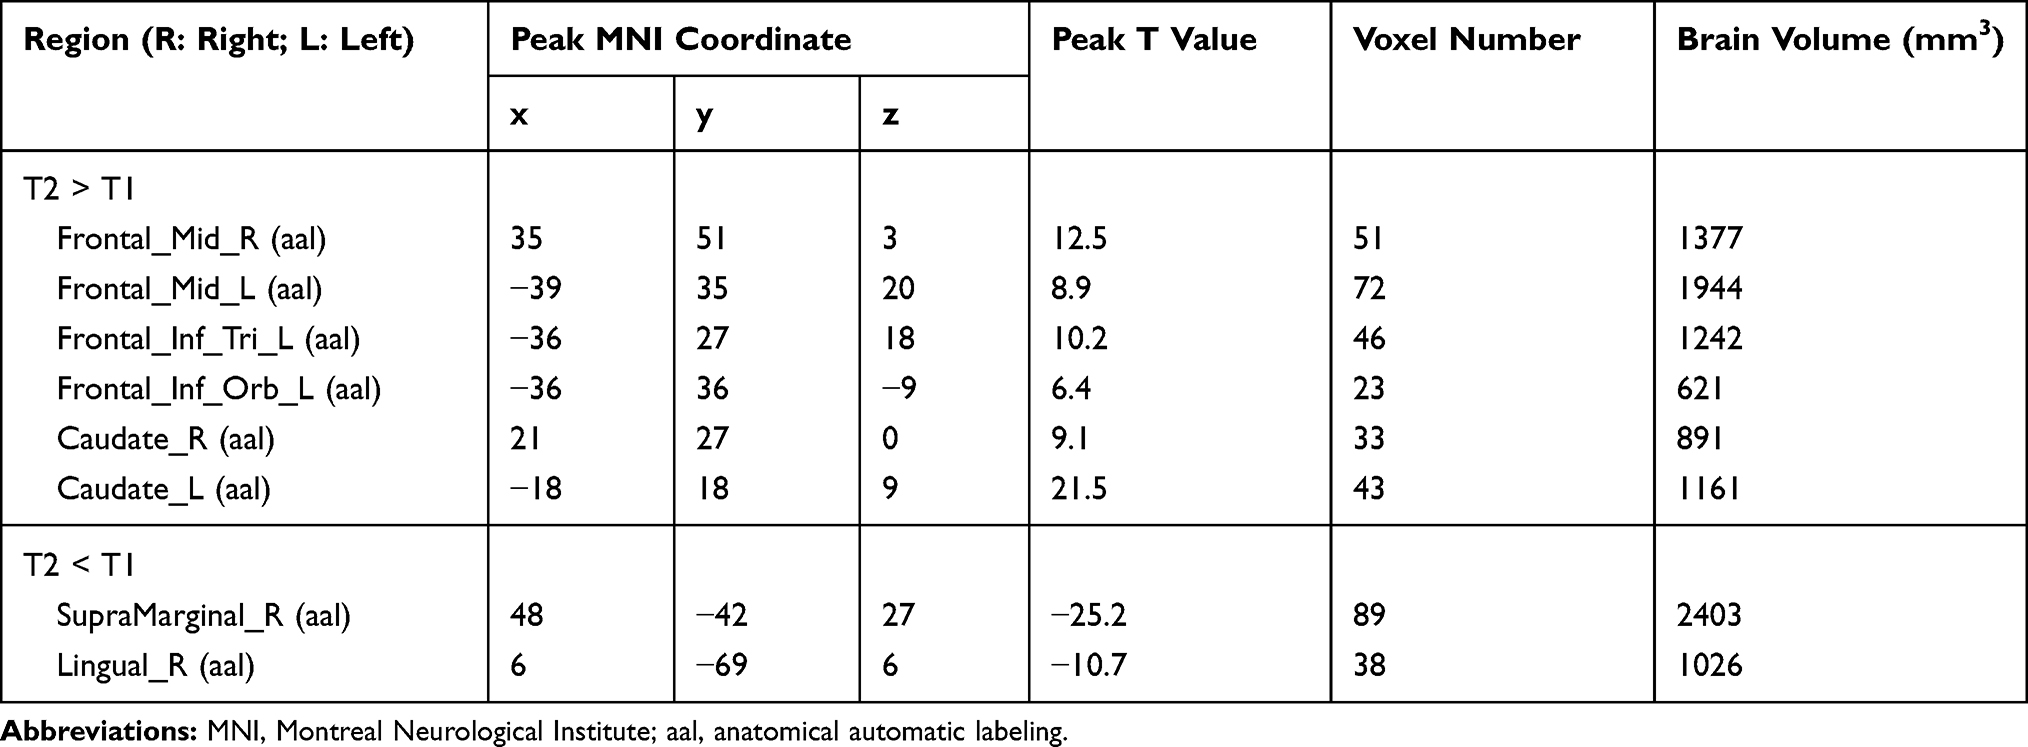 |
Table 3 Clusters with Different fALFF Values Six Months After Treatment |
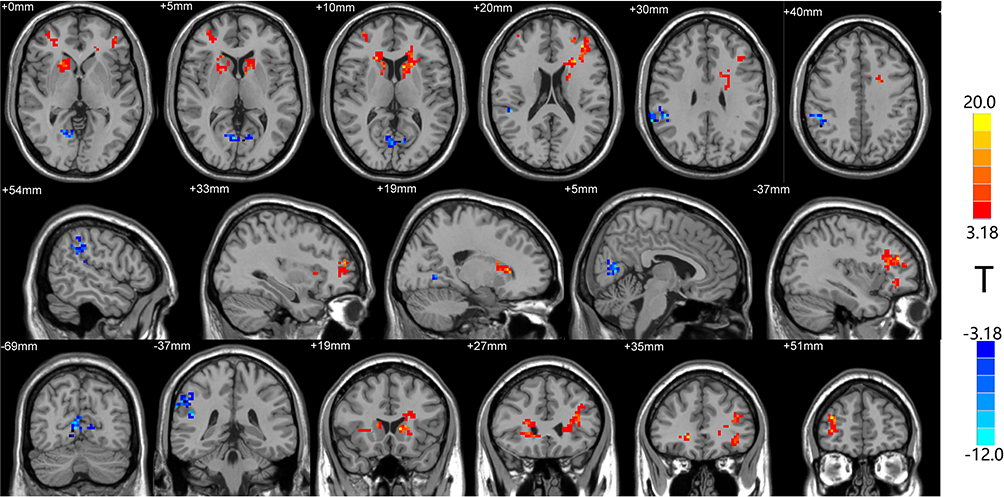 |
Figure 2 The distribution of fALFF differential brain areas in PHN patients before and after treatment. The warm colors indicate higher fALFF, and cool colors indicate lower fALFF in PHN brain after treatment (P < 0.05, AlphaSim corrected, paired t-test, n=15). After treatment, brain showed significantly increased fALFF mainly in the bilateral frontal lobe (bilateral middle frontal gyrus, bilateral inferior gyrus, bilateral caudate). Lower fALFF values were observed in the SupraMarginal_R (aal) and Lingual_R (aal). The detailed information for each cluster and their peak T values and coordinates are listed in Table 3. Abbreviation: aal, anatomical automatic labeling. |
Changes of GMV in PHN Patients Before and After Comprehensive Treatment
The VBM method was used to compare and analyze GMV of PHN brain before and after treatments. The GMV of the left cerebellum (Cerebelum_Crus1_L (aal)) increased significantly after treatments (P < 0.001, cluster size = 58), as shown in Figure 3.
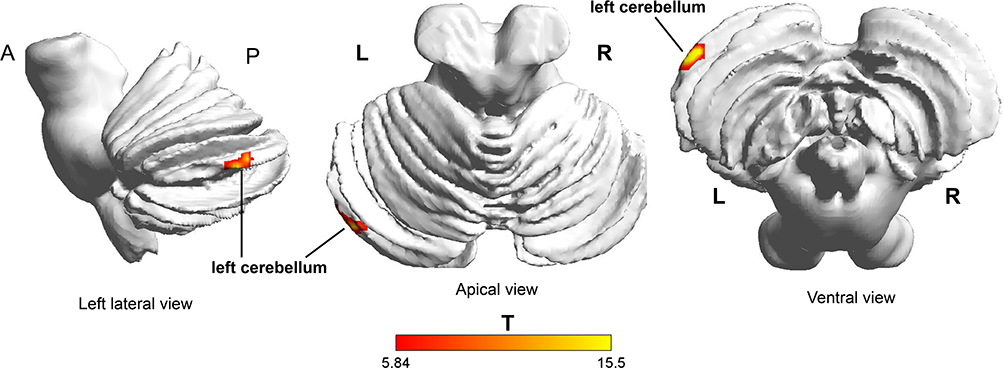 |
Figure 3 VBM analysis shows brain structural changes in PHN patients after treatment. The left cerebellum (Cerebelum_Crus1_L (aal)) indicated with red and yellow color shows increased GMV after treatment (P <0.05, AlphaSim correction). Abbreviation: aal, anatomical automatic labeling. |
Analyses of DKI Before and After Treatment in PHN Patients
Comparison of DKI parameters before and after treatments in 15 PHN patients indicated that AD values of the right thalamus were significantly reduced after treatments (Figure 4A). In addition, the FA value of the right superior temporal gyrus (Temporal_Sup_R (aal), Figure 4B) and the AK values of the right temporal gyrus (Temporal_Mid_R (aal), Figure 4C) increased after treatments (P <0.05, AlphaSim correction). No significant change of DKI was found in other brain regions.
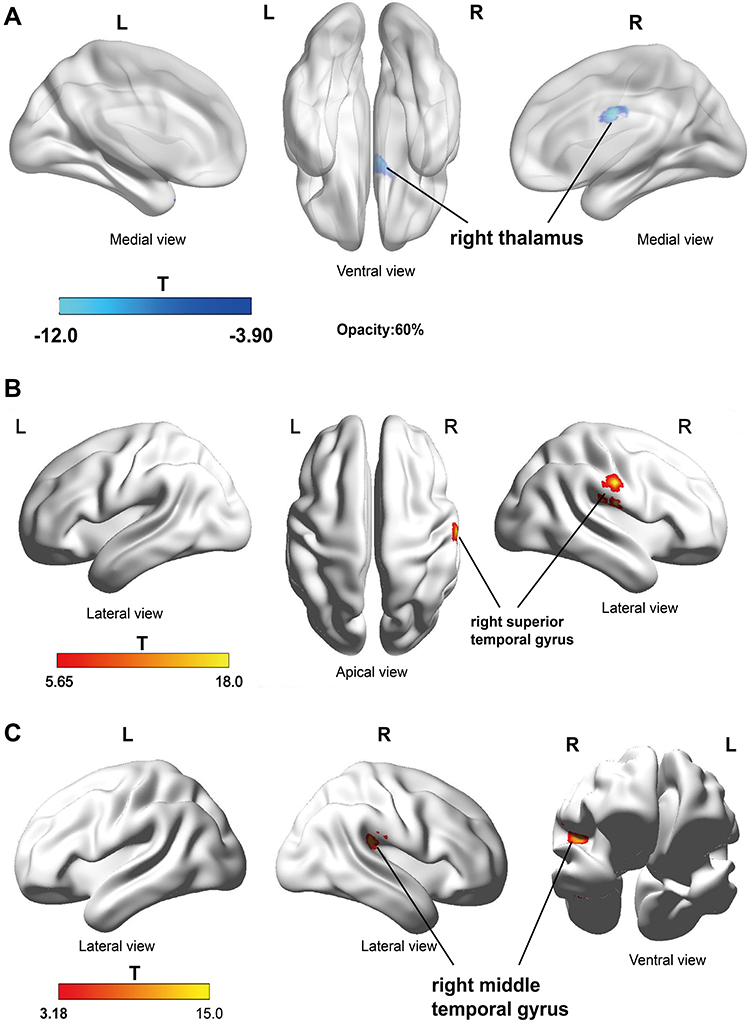 |
Figure 4 DKI analyses suggest brain structural changes in PHN patients after treatment. (A) AD value of right thalamus (Thalamus_R (aal)) was significantly reduced after treatment; (B) FA values in the right superior temporal gyrus (Temporal_Sup_R (aal)) increased after treatment; (C) AK values in the right temporal gyrus (Temporal_Mid_R (aal)) increased after treatment (P <0.05, AlphaSim correction). The blue color indicates the GMV is significantly reduced after treatment, and the red and yellow colors indicate the GMV is significantly increased after treatment. Abbreviation: aal, anatomical automatic labeling. |
Discussion
As shown by ReHo, fALFF, VBM, and DKI results, 6 months after the relief of herpetic neuralgia, the brain activity, GMV, and gray matter intensities in several brain regions are different in the 15 PHN patients. All of these differential brain areas, such as the frontal lobe, cerebellum, thalamus, cingulated gyrus, parietal lobe, cuneus, and temporal gyrus were reported as differential brain areas between PHN and healthy subjects.12,15,16,20,22 These MRI results indicate that a period of time after pain relief (e.g., 6 months), abnormalities in the PHN brain could be reversible.
As expected, most of these differential areas, including the cerebellum, thalamus, cingulated gyrus, and frontal lobe, are parts of the “pain matrix”, which was defined as regions that exhibited activation in response to pain.40–43 This means the changes in the brain of cured PHN patients mostly happen in pain-related brain areas. Decreased ACC, cuneus, and increased frontal lobe activity were found after treatment, which showed a reverse trend in PHN brain compared with healthy brain.13,16 In addition, after treatment, FA values in the right superior temporal gyrus and AK values in the right middle temporal gyrus increased remarkably, which also showed a reverse trend in PHN brain compared with healthy brain.20 These changes suggest that after a period of pain relief, for some differential brain regions, the functional and structural abnormalities in PHN brain may be reversible.
In this study, after 6 months of effective treatment, the GMV of the cerebellum was increased, and the previously reduced FA and AK values in the temporal lobe20 were significantly increased, indicating that the GMV loss and microstructural abnormalities in PHN brain were partially recovered after effective treatments. Interestingly, the cerebellum GMV has been reported to be increased in PHN patients compared with healthy controls22 or herpes zoster patients,17 furthermore, our data indicate that its volume continued to increase 6 months after herpetic-pain relief. Cerebellum is part of pain matrix and activates in painful events in healthy controls44 and in patients with chronic pain.45 It is reported that cerebellar activity correlated well with rat neuropathic pain development in an eight-week longitudinal study.46 Under the circumstances of chronic pain, the GMV of cerebellum could be increased or decreased. For example, it was increased in patients with fibromyalgia47 or cluster headache,48 but decreased in trigeminal neuralgia49,50 or burn moth syndrome.51 Cerebellar direct current stimulation (tcDCS) could modulate pain perception and its cortical correlates;52 therefore, the cerebellum is thought to be one of the potential targets for chronic pain treatment.
Whether there is a causal relationship between changes in brain structure and chronic pain remains unclear. Rodriguez-Raecke et al53 found that long-term pain-suffering patients with hip arthritis may develop GMV reduction in brain areas such as ACC, and the GMV loss recovered in patients received hip replacement. DeSouza et al54 found that the FA, MD, and RD values of the right anterior insular lobe and the gray matter at the entrance of the trigeminal nerve of patients with trigeminal neuralgia were reversible 2–6 months after effective treatment, indicating gradual recovery of the damaged microstructure in the brain. In the present study, 6 months after pain relief, the FA and AK values of temporal lobe significantly increased, indicating that maybe the abnormality of brain microstructure is reversible after effective treatment in PHN patients.
Detections at longer recovery time points (e.g., one year or two years) will be helpful to evaluate the functional and structural changes in the brain of cured PHN patients. It should be realized that a high false-positive rate may exist in fMRI studies using conventional software.55 Alternative neuroscience methods are warranted to identify functional and structural abnormalities in brains of patients with chronic pain.
Conclusions
Evaluations of ReHo, fALFF, VBM, and DKI indicate that 6 months after the relief of herpetic neuralgia, the brain activity, GMV, and gray matter intensities of PHN brain are different. Successful treatment may partly reverse functional and structural abnormalities in areas such as ACC, frontal lobe, and temporal lobe in PHN brain. These data indicate reversible central plasticity after the relieving of chronic pain.
Data Sharing
No further data will be shared.
Disclosure
The authors report no conflicts of interest in this work.
References
1. Cohen JI, Solomon CG. Clinical practice: herpes zoster. N Engl J Med. 2013;369(3):255–263. doi:10.1056/NEJMcp1302674
2. Schmader K. Postherpetic neuralgia in immunocompetent elderly people. Vaccine. 1998;16(18):1768–1770. doi:10.1016/S0264-410X(98)00137-6
3. Keating GM. Shingles (Herpes Zoster) vaccine (Zostavax®): a review in the prevention of herpes zoster and postherpetic neuralgia. Biodrugs. 2016;30(3):243–254. doi:10.1007/s40259-016-0180-7
4. Friesen KJ, Falk J, Alessi-Severini S, Chateau D, Bugden S. Price of pain: population-based cohort burden of disease analysis of medication cost of herpes zoster and postherpetic neuralgia. J Pain Res. 2016;9:543. doi:10.2147/JPR.S107944
5. Yang F, Yu S, Fan B, et al. The epidemiology of herpes zoster and postherpetic neuralgia in China: results from a cross-sectional study. Pain Ther. 2019;8(2):249–259. doi:10.1007/s40122-019-0127-z
6. Pickering G, Gavazzi G, Gaillat J, Paccalin M, Bloch K, Bouhassira D. Is herpes zoster an additional complication in old age alongside comorbidity and multiple medications? Results of the post hoc analysis of the 12-month longitudinal prospective observational ARIZONA cohort study. BMJ Open. 2016;6(2):e009689. doi:10.1136/bmjopen-2015-009689
7. Sah DWY, Ossipo MH, Frank P. Neurotrophic factors as novel therapeutics for neuropathic pain. Nat Rev Drug Discov. 2003;2(6):460–472. doi:10.1038/nrd1107
8. Denkinger MD, Lukas A, Nikolaus T, Peter R, Franke S, Group AS. Multisite pain, pain frequency and pain severity are associated with depression in older adults: results from the ActiFE Ulm study. Age Ageing. 2014;43(4):510–514. doi:10.1093/ageing/afu013
9. Cao S, Zhang D, Yuan J, et al. MicroRNA and circular RNA expression in affected skin of patients with postherpetic neuralgia. J Pain Res. 2019;12:2905–2913. doi:10.2147/JPR.S221615
10. Geha PY, Baliki MN, Chialvo DR, Harden RN, Paice JA, Apkarian AV. Brain activity for spontaneous pain of postherpetic neuralgia and its modulation by lidocaine patch therapy. Pain. 2007;128(1):88–100. doi:10.1016/j.pain.2006.09.014
11. Geha PY, Baliki MN, Wang X, Harden RN, Paice JA, Apkarian AV. Brain dynamics for perception of tactile allodynia (touch-induced pain) in postherpetic neuralgia. Pain. 2008;138(3):641–656. doi:10.1016/j.pain.2008.02.021
12. Zhang Y, Liu J, Li L, et al. A study on small-world brain functional networks altered by postherpetic neuralgia. Magn Reson Imaging. 2014;32(4):359–365. doi:10.1016/j.mri.2013.12.016
13. Gu L, Hong S, Jiang J, et al. Bidirectional alterations in ALFF across slow-5 and slow-4 frequencies in the brains of postherpetic neuralgia patients. J Pain Res. 2019;12:39–47. doi:10.2147/JPR.S179077
14. Li J, Huang X, Sang K, Bodner M, Ma K, Dong XW. Modulation of prefrontal connectivity in postherpetic neuralgia patients with chronic pain: a resting-state functional magnetic resonance-imaging study. J Pain Res. 2018;11:2131–2144. doi:10.2147/JPR.S166571
15. Cao S, Li Y, Deng W, et al. Local brain activity differences between herpes zoster and postherpetic neuralgia patients: a resting-state functional MRI study. Pain Physician. 2017;20(5):E687–E699.
16. Cao S, Song G, Zhang Y, et al. Abnormal local brain activity beyond the pain matrix in postherpetic neuralgia patients: a resting-state functional MRI study. Pain Physician. 2017;20(2):E303–E314.
17. Cao S, Qin B, Zhang Y, et al. Herpes zoster chronification to postherpetic neuralgia induces brain activity and grey matter volume change. Am J Transl Res. 2018;10(1):184–199.
18. Bliss TV, Collingridge GL, Kaang BK, Zhuo M. Synaptic plasticity in the anterior cingulate cortex in acute and chronic pain. Nat Rev Neurosci. 2016;17(8):485–496.
19. Kuner R, Flor H. Structural plasticity and reorganisation in chronic pain. Nat Rev Neurosci. 2016;18(1):20–30. doi:10.1038/nrn.2016.162
20. Zhang Y, Yu T, Qin B, Li Y, Song G, Yu B. Microstructural abnormalities in gray matter of patients with postherpetic neuralgia: a diffusional kurtosis imaging study. Pain Physician. 2016;19(4):E601–E611.
21. Chen F, Chen F, Shang Z, et al. White matter microstructure degenerates in patients with postherpetic neuralgia. Neurosci Lett. 2017;656:152–157. doi:10.1016/j.neulet.2017.07.023
22. Liu J, Gu L, Huang Q, et al. Altered gray matter volume in patients with herpes zoster and postherpetic neuralgia. J Pain Res. 2019;12:605–616. doi:10.2147/JPR.S183561
23. Ceko M, Shir Y, Ouellet JA, Ware MA, Stone LS, Seminowicz DA. Partial recovery of abnormal insula and dorsolateral prefrontal connectivity to cognitive networks in chronic low back pain after treatment. Hum Brain Mapp. 2015;36(6):2075–2092. doi:10.1002/hbm.22757
24. Seminowicz DA, Wideman TH, Naso L, et al. Effective treatment of chronic low back pain in humans reverses abnormal brain anatomy and function. J Neurosci. 2011;31(20):7540–7550. doi:10.1523/JNEUROSCI.5280-10.2011
25. Gwilym SE, Filippini N, Douaud G, Carr AJ, Tracey I. Thalamic atrophy associated with painful osteoarthritis of the hip is reversible after arthroplasty: a longitudinal voxel-based morphometric study. Arthritis Rheum. 2010;62(10):2930–2940. doi:10.1002/art.27585
26. Rodriguez-Raecke R, Niemeier A, Ihle K, Ruether W, May A, Langguth B. Structural brain changes in chronic pain reflect probably neither damage nor atrophy. PLoS One. 2013;8(2):e54475. doi:10.1371/journal.pone.0054475
27. Merskey H, Bogduk N. Classification of Chronic Pain: Descriptions of Chronic Pain Syndromes and Definitions of Pain Terms.
28. Mallick-Searle T, Snodgrass B, Brant JM. Postherpetic neuralgia: epidemiology, pathophysiology, and pain management pharmacology. J Multidiscip Healthc. 2016;9:447–454. doi:10.2147/JMDH.S106340
29. Yan C, Zang Y. DPARSF: a MATLAB toolbox for ”pipeline” data analysis of resting-state fMRI. Front Syst Neurosci. 2010;4:13. doi:10.3389/fnsys.2010.00009
30. Greicius MD, Ben K, Reiss AL, Vinod M. Functional connectivity in the resting brain: a network analysis of the default mode hypothesis. Proc Natl Acad Sci U S A. 2003;100(1):253–258. doi:10.1073/pnas.0135058100
31. Song XW, Dong ZY, Long XY, et al. REST: a toolkit for resting-state functional magnetic resonance imaging data processing. PLoS One. 2011;6(9):e25031. doi:10.1371/journal.pone.0025031
32. Zang Y, Jiang T, Lu Y, He Y, Tian L. Regional homogeneity approach to fMRI data analysis. Neuroimage. 2004;22(1):394–400. doi:10.1016/j.neuroimage.2003.12.030
33. Li Z, Kadivar A, Pluta J, Dunlop J, Wang Z. Test–retest stability analysis of resting brain activity revealed by blood oxygen level‐dependent functional MRI. J Magn Reson Imaging. 2012;36(2):344–354. doi:10.1002/jmri.23670
34. Wang L, Li K, Zhang Q, et al. Short-term effects of escitalopram on regional brain function in first-episode drug-naive patients with major depressive disorder assessed by resting-state functional magnetic resonance imaging. Psychol Med. 2014;44(7):1417–1426. doi:10.1017/S0033291713002031
35. Zou QH, Zhu CZ, Yang Y, et al. An improved approach to detection of amplitude of low-frequency fluctuation (ALFF) for resting-state fMRI: fractional ALFF. J Neurosci Methods. 2008;172(1):137–141. doi:10.1016/j.jneumeth.2008.04.012
36. Haag LM, Heba S, Lenz M, et al. Resting BOLD fluctuations in the primary somatosensory cortex correlate with tactile acuity. Cortex. 2015;64:20–28. doi:10.1016/j.cortex.2014.09.018
37. Tu Y, Yu T, Wei Y, Sun K, Zhao W, Yu B. Structural brain alterations in hemifacial spasm: a voxel-based morphometry and diffusion tensor imaging study. Clin Neurophysiol. 2016;127(2):1470–1474. doi:10.1016/j.clinph.2015.07.036
38. Tabesh A, Jensen JH, Ardekani BA, Helpern JA. Estimation of tensors and tensor-derived measures in diffusional kurtosis imaging. Magn Reson Med. 2011;65(3):823–836. doi:10.1002/mrm.22655
39. Ledberg A, Åkerman S, Roland PE. Estimation of the probabilities of 3D clusters in functional brain images. Neuroimage. 1998;8(2):113–128. doi:10.1006/nimg.1998.0336
40. Peyron R, Laurent B, García-Larrea L. Functional imaging of brain responses to pain. A review and meta-analysis (2000). Neurophysiol Clin. 2000;30(5):263–288. doi:10.1016/S0987-7053(00)00227-6
41. Jensen KB, Kosek E, Wicksell R, et al. Cognitive behavioral therapy increases pain-evoked activation of the prefrontal cortex in patients with fibromyalgia. Pain. 2012;153(7):1495–1503. doi:10.1016/j.pain.2012.04.010
42. Treede RD, Kenshalo DR, Gracely RH, Jones AK. The cortical representation of pain. Pain. 1999;79(2):105–111. doi:10.1016/S0304-3959(98)00184-5
43. Seifert F, Maihöfner C. Central mechanisms of experimental and chronic neuropathic pain: findings from functional imaging studies. Cell Mol Life Sci. 2009;66(3):375–390. doi:10.1007/s00018-008-8428-0
44. Helmchen C, Mohr C, Erdmann C, Petersen D, Nitschke M. Differential cerebellar activation related to perceived pain intensity during noxious thermal stimulation in humans: a functional magnetic resonance imaging study. Neurosci Lett. 2003;335(3):202–206. doi:10.1016/S0304-3940(02)01164-3
45. Jensen KB, Regenbogen C, Ohse MC, Frasnelli J, Freiherr J, Lundström JN. Brain activations during pain: a neuroimaging meta-analysis of patients with pain and healthy controls. Pain. 2016;157(6):1279–1286. doi:10.1097/j.pain.0000000000000517
46. Kim J, Shin J, Oh J-H, et al. Longitudinal FDG microPET imaging of neuropathic pain: does cerebellar activity correlate with neuropathic pain development in a rat model? Acta Neurochir (Wien). 2015;157(6):1051–1057. doi:10.1007/s00701-015-2415-7
47. Shi H, Yuan C, Dai Z, Ma H, Sheng L. Gray matter abnormalities associated with fibromyalgia: a meta-analysis of voxel-based morphometric studies. Semin Arthritis Rheum. 2016;46(3):330–337. doi:10.1016/j.semarthrit.2016.06.002
48. Naegel S, Holle D, Desmarattes N, et al. Cortical plasticity in episodic and chronic cluster headache. Neuroimage Clin. 2014;6:415–423. doi:10.1016/j.nicl.2014.10.003
49. Li M, Yan J, Li S, et al. Reduced volume of gray matter in patients with trigeminal neuralgia. Brain Imaging Behav. 2016;11(2):486–92.
50. Obermann M, Rodriguez-Raecke R, Naegel S, et al. Gray matter volume reduction reflects chronic pain in trigeminal neuralgia. Neuroimage. 2013;74:352–358. doi:10.1016/j.neuroimage.2013.02.029
51. Sinding C, Gransjoen AM, Schlumberger G, Grushka M, Frasnelli J, Singh PB. Grey matter changes of the pain matrix in patients with burning mouth syndrome. Eur J Neurosci. 2016;43(8):997–1005. doi:10.1111/ejn.13156
52. Bocci T, Santarcangelo E, Vannini B, et al. Cerebellar direct current stimulation modulates pain perception in humans. Restor Neurol Neurosci. 2015;33(5):597–609. doi:10.3233/RNN-140453
53. Rodriguez-Raecke R, Niemeier A, Ihle K, Ruether W, May A. Brain gray matter decrease in chronic pain is the consequence and not the cause of pain. J Neurosci. 2009;29(44):13746–13750. doi:10.1523/JNEUROSCI.3687-09.2009
54. DeSouza DD, Davis KD, Hodaie M. Reversal of insular and microstructural nerve abnormalities following effective surgical treatment for trigeminal neuralgia. Pain. 2015;156(6):1112–1123. doi:10.1097/j.pain.0000000000000156
55. Eklund A, Nichols TE, Knutsson H. Cluster failure: why fMRI inferences for spatial extent have inflated false-positive rates. Proc Natl Acad Sci. 2016;113(28):7900–5.
 © 2020 The Author(s). This work is published and licensed by Dove Medical Press Limited. The full terms of this license are available at https://www.dovepress.com/terms.php and incorporate the Creative Commons Attribution - Non Commercial (unported, v3.0) License.
By accessing the work you hereby accept the Terms. Non-commercial uses of the work are permitted without any further permission from Dove Medical Press Limited, provided the work is properly attributed. For permission for commercial use of this work, please see paragraphs 4.2 and 5 of our Terms.
© 2020 The Author(s). This work is published and licensed by Dove Medical Press Limited. The full terms of this license are available at https://www.dovepress.com/terms.php and incorporate the Creative Commons Attribution - Non Commercial (unported, v3.0) License.
By accessing the work you hereby accept the Terms. Non-commercial uses of the work are permitted without any further permission from Dove Medical Press Limited, provided the work is properly attributed. For permission for commercial use of this work, please see paragraphs 4.2 and 5 of our Terms.