")
Back to Journals » Therapeutics and Clinical Risk Management » Volume 11
Functional and histological improvement after everolimus rescue of chronic allograft dysfunction in renal transplant recipients
Authors Chow KM, Szeto CC, Lai FM, Luk CC, Kwan BC, Leung CB, Li PK
Received 5 March 2015
Accepted for publication 26 March 2015
Published 19 May 2015 Volume 2015:11 Pages 829—835
DOI https://doi.org/10.2147/TCRM.S84030
Checked for plagiarism Yes
Review by Single anonymous peer review
Peer reviewer comments 4
Editor who approved publication: Professor Garry Walsh
Kai Ming Chow,1 Cheuk Chun Szeto,1 Fernand Mac-Moune Lai,2 Cathy Choi-Wan Luk,1 Bonnie Ching-Ha Kwan,1 Chi Bon Leung,1 Philip Kam-Tao Li1
1Department of Medicine and Therapeutics, 2Department of Anatomical and Cellular Pathology, The Chinese University of Hong Kong, Prince of Wales Hospital, Shatin, Hong Kong
Background: We tested the strategy of mTOR inhibitors with calcineurin inhibitor minimization in renal transplant recipients with known chronic allograft dysfunction.
Methods: In this open-label, single-arm study, renal transplant patients were recruited after biopsy-confirmed chronic allograft dysfunction in the absence of acute rejection episode within 2 months, with proteinuria <0.8 g/day, and serum creatinine <220 µmol/L or estimated glomerular filtration rate >40 mL/min/1.73 m2. They were converted to everolimus (aiming for trough everolimus level 3–8 ng/mL) with cyclosporine minimization, to assess the effect on renal function, rate of glomerular filtration rate decline, and longitudinal transplant biopsy at 12 months.
Results: Seventeen Chinese patients (median transplant duration, 4.2 years) were recruited; no patients discontinued study medication. The mean slope of the glomerular filtration rate over time was -4.31±6.65 mL/min/1.73 m2 per year in the year before everolimus, as compared with 1.29±5.84 mL/min/1.73 m2 per year in the 12 months of everolimus therapy, a difference of 5.61 mL/min/1.73 m2 per year (95% confidence interval [CI], 0.40–10.8) favoring everolimus therapy (P=0.036). Serial renal biopsy histology showed significant decrease of tubular atrophy (15.7%±11.3% versus 7.1%±7.3%, P=0.005) and interstitial fibrosis (14.8%±11.5% versus 7.2%±8.2%, P=0.013). Intrarenal expression of TGF-β1 mRNA showed a nonsignificant decrease after everolimus treatment.
Conclusion: In renal transplant recipients with biopsy-confirmed chronic allograft dysfunction, we found a significant beneficial effect of everolimus rescue therapy and calcineurin inhibitor minimization strategy on the improvement of glomerular filtration rate decline rate. In secondary analysis, everolimus was shown to slow down the disease progression by reducing the tubular atrophy and interstitial fibrosis scoring.
Keywords: cyclosporine, calcineurin inhibitor, everolimus, glomerular filtration rate, renal transplantation, mTOR inhibitor, immunosuppression
Background
Despite the remarkable improvement in short-term patient and graft survival among the recipients of kidney transplants, the progressive renal dysfunction (chronic allograft dysfunction) accompanied by chronic interstitial fibrosis, tubular atrophy, vascular occlusive changes, and glomerulosclerosis remains the chief cause of graft loss.1–3 As a result of this damage from immunologic and nonimmunologic injury, the long-term survival of kidney transplants has changed little during the past decade.3 And, among the nonimmunologic factors, calcineurin inhibitor nephrotoxicity has been shown to be the most common factor leading to long-term graft damage and progression to graft failure. This is further supported by the previous finding that long-term use of calcineurin-inhibitor-based therapy leads to deterioration in kidney function, even in recipients of nonrenal organ transplants.
The growing interest in calcineurin-inhibitor minimization protocols to optimize renal transplant outcome offers a new therapeutic option in the management of patients with chronic allograft dysfunction. Among the treatment strategies, mTOR inhibitors, including everolimus, have been shown to achieve an improvement of long-term function through an early modulation of immunosuppressive regimen.2,4,5 However, existing evidence has been limited by the lack of histological assessment. In this aspect, percutaneous renal graft biopsy represents an important diagnostic tool to allow visualization of the lesions of chronic allograft dysfunction and, therefore, the ability to delineate the potential improvement after introduction of everolimus. Histologic findings from protocol-mandated biopsies obtained from renal transplant recipients who are suffering from chronic allograft dysfunction and treated with everolimus would strengthen the evidence for the drug’s efficacy, if confirmed.
The main objective of the present study is to evaluate the a priori hypothesis that calcineurin inhibitor minimization and rescue immunosuppression with everolimus-based therapy would attenuate the renal parenchymal injury associated with long-term use of calcineurin inhibitors in renal transplant recipients with declining kidney function. We hypothesized that everolimus would benefit carefully selected patients with low immunological risks. The second objective of this study is to elucidate the efficacy of our approach to arrest the progression of allograft dysfunction by means of protocol-specified renal allograft biopsy.
Patients and methods
Study design
In this open-label, single arm study, we studied 17 patients who underwent ABO-compatible renal transplantation, received cyclosporine, and developed biopsy-proven chronic allograft dysfunction. Patients were enrolled from 2008 to 2010. Key inclusion criteria were patients with proteinuria less than 0.8 g daily before conversion because it was shown to be the only significant predictor of response, with a positive predictive value of 90% in a multivariate analysis.6 We elected to include patients aged 18–65 years who had biopsy-confirmed chronic allograft dysfunction in the absence of acute rejection episode within the preceding 2 months, proteinuria less than 0.8 g/day, and serum creatinine less than 220 μmol/L or estimated glomerular filtration rate greater than 40 mL/min/1.73 m by the Nankivell formula, which had been validated in kidney transplant recipients. This equation was expressed for use with a standard serum creatinine assay: glomerular filtration rate =6.7/(standardized serum creatinine in μmol/L/1,000) + weight (kg)/4 – urea (mmol/L)/2 – 100 /height2 (m) +35 if the subject is male (or 25 if the subject is female).7 Exclusion criteria were pregnancy, lactating or childbearing potential without effective method of birth control, severe gastrointestinal disorders interfering with ability to receive or absorb oral medication, serum cholesterol levels greater than 7.8 mmol/L or triglyceride levels greater than 4.5 mmol/L despite lipid-lowering agents before conversion, previous treatment with everolimus or sirolimus, chronic lung disease, known history of sensitivity or allergy to everolimus, and history of nonadherence or conditions interfering with the patient’s ability to understand the requirement of the study.
The study was approved by the clinical research ethics committee of the Chinese University of Hong Kong. All patients provided informed consent, and the study was performed in accordance with the International Conference on Harmonisation Guidelines for Good Clinical Practice and consistent with the Principles of the Declaration of Istanbul as outlined in the “Declaration of Istanbul on Organ Trafficking and Transplant Tourism.” The trial is registered at www.clinicaltrials.gov (NCT01046045).
Percutaneous baseline renal allograft biopsy was performed prior to recruitment on clinical grounds (as the standard of care for patients with slowly deteriorating renal function). After written informed consent was obtained, patients were recruited within 2 months of renal biopsy. At week 0, all patients received everolimus at an initial daily loading dose between 1 and 4 mg. The dose of everolimus was adjusted from week 1 onward to maintain a trough everolimus level between 3 and 8 ng/mL; everolimus trough levels less than 3 ng/mL have been shown to be associated with higher rates of biopsy-proven acute rejection.8 We allowed 50% reduction in cyclosporine on the first day of everolimus introduction. During the subsequent clinical evaluation, blood chemical measurements including everolimus trough levels were performed, and information was obtained on adverse events. We allowed cyclosporine dose reduction to as low as 25% of the original dose, after stable everolimus levels were achieved. Antihypertensive therapy and lipid-lowering agents were allowed and titrated throughout the study period. We documented all cases of acute clinical rejection by histopathological evidence, according to the consensus rules of the international Banff classification criteria.9
Histological study
Follow-up renal biopsy was repeated at the end of 52 weeks of everolimus treatment. One renal pathologist retrospectively reviewed all baseline and follow-up renal biopsies, blinded for clinical data. For light microscopy, serial tissue sections were stained with hematoxylin and eosin, periodic acid-Schiff (PAS), and methenamine silver. All the biopsies were scored according to the Banff classification.9,10 In particular, interstitial fibrosis and tubular atrophy (IF/TA) were studied because they have been proven to be correlates of subsequent allograft dysfunction and graft loss.11–13 Analysis of interstitial fibrosis and tubular atrophy (IF/TA) was determined on 4 μm paraffin-embedded sections stained by PAS or Jones silver stain. The severity of interstitial fibrosis and tubular atrophy was scored subjectively by an experienced pathologist who was blinded to the results of molecular studies. Ten microscopic fields were viewed at a magnification of 200× and scored subjectively from 0% to 100% for each patient. The severity of tubulointerstitial scarring was represented by the mean of ten scores.
Intrarenal gene expression
In order to examine the potential antifibrotic actions of everolimus, intrarenal expression of transforming growth factor beta-1 (TGF-β1) genes were measured before and after everolimus treatment. TGF-β1 was chosen because it is a key fibrogenic cytokine involved in the fibrosis of many chronic kidney diseases. Among renal transplant patients with chronic allograft dysfunction, a decrease in urinary TGF-β1 has been found after conversion from calcineurin inhibitors to mTOR inhibitors.14 We used specimens from protocol-specified renal biopsies at baseline and 12 months after everolimus to quantify mRNA transcripts of TGF-β1. Briefly, the biopsies were homogenized and the total mRNA was extracted from the lysate using Ambion, RNAqueous-Micro Kit (Life Technologies, Carlsbad, CA, USA) according to the manufacturer protocol. cDNA was generated form the total RNA using High Capacity cDNA Reverse Transcription kit (ABI, Waltham, MA, USA) following the manufacturer protocol. Quantitative real-time PCR was performed by mixing Taqman Universal PCR Master Mix (ABI) with a specific commercial gene expression assay. The primers and probe set was designed across the intron–exon boundary so the genomic DNA was not detectable. The reaction was performed according to the standard protocol. Analysis was carried out in triplicate for each sample. GAPDH was used as house-keeping gene. Each mRNA was then log10-transformed to reduce positive skewness.
Study end points
The primary outcome measure of this study is the change in glomerular filtration rate decline rate before and after treatment with everolimus, as well as the histological degree of fibrosis. The change in glomerular filtration rate decline was assessed by measuring the mean slope of the estimated glomerular filtration rate over time, as recorded in the 12 months before and after everolimus rescue. The histological assessment was measured by the percentage of IF/TA at baseline and at 12 months after everolimus. The predefined secondary end points include the estimated glomerular filtration rate at 12 months and TGF-β1 intrarenal expression before and after everolimus conversion. An additional predefined secondary outcome was the safety analysis, including acute rejection and adverse effects associated with everolimus.
Statistical analysis
Data were expressed in mean ± SD (standard deviation). The change in proteinuria, renal function and other morphometric markers before and after treatment was compared by paired Student’s t-test or Wilcoxon’s matched-pairs signed-rank test as appropriate. Calculation was performed by SPSS for Windows software version 16.0 (SPSS Inc, Chicago, IL, USA). Unless noted, all analyses were prespecified. A P-value of below 0.05 was considered statistically significant. All probabilities were two-tailed.
We initially designed the study to enroll 33 patients. The sample size was estimated by the Power Analysis and Sample Size for Windows software (PASS 2000, NCSS, Kaysville, UT, USA). On the basis of a previous pilot study,15 the rates of renal function decline are 0.18 and 0.04 mL/min/month before and after conversion to an mTOR inhibitor, respectively, with standard deviation of renal function decline of 0.2 mL/min/month. A sample size of 33 would achieve 80% power to detect an improvement of 0.14 mL/min/month after everolimus therapy at a significance level (alpha) of 0.05 using a two-sided paired Student’s t-test.
Results
Patient disposition is shown in Figure 1. Seventeen Chinese patients were recruited and all of them completed the study. No patients discontinued study medication. Of these 17 patients, one declined follow-up renal biopsy but agreed for all other assessments according to the study protocol. Baseline demographics and clinical characteristics are shown in Table 1. The mean age of enrolled patents was 46 years, and the majority of patients were men (70.6%). Their median time from transplantation to study entry was 4.2 years. The baseline serum creatinine was 168.9±34.6 μmol/L, and the glomerular filtration rate calculated by the Nankivell formula was 58.0±14.0 mL/min/1.73 m2. None of the patients had histological features of transplant glomerulopathy.
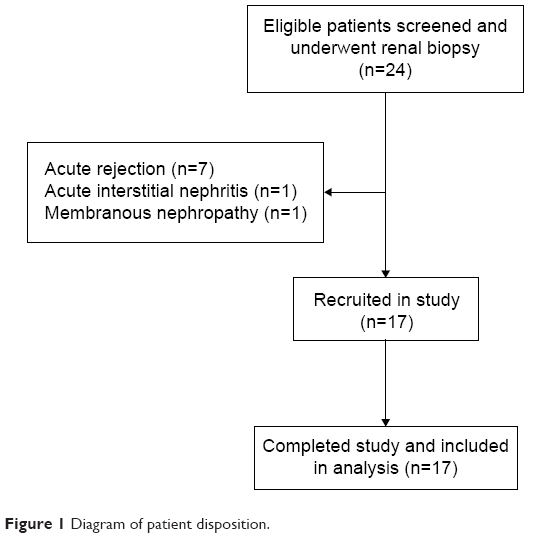 | Figure 1 Diagram of patient disposition. |
 | Table 1 Baseline demographic characteristicsa |
The stable daily everolimus dose was 1.25±0.41 mg, and the mean everolimus trough level was 4.0±1.28 ng/mL Mean daily cyclosporine dose and trough levels at 12 months were 61.5±15.0 mg and 30.3±14.3 ng/mL, respectively. The cyclosporine dose after everolimus represented 39% of the original dose.
Primary outcomes
The mean slope of the glomerular filtration rate (estimated by the Nankivell formula) over time (Figure 2) was −4.31±6.65 mL/min/1.73 m2 per year in the year before everolimus, as compared with 1.29±5.84 mL/min/1.73 m2 per year in the 12 months of everolimus therapy, a difference of 5.61 mL/min/1.73 m2 per year (95% confidence interval [CI], 0.40–10.8) favoring everolimus therapy (P=0.036). To investigate the robustness of the results, the analyses were repeated using two different prediction equations to estimate the glomerular filtration rate. Similar findings, as shown in Table 2, were noted when the Modification of Diet in Renal Disease (MDRD) Study equation16 and the Chronic Kidney Disease Epidemiology Collaboration (CKD-EPI) equation17 were used.
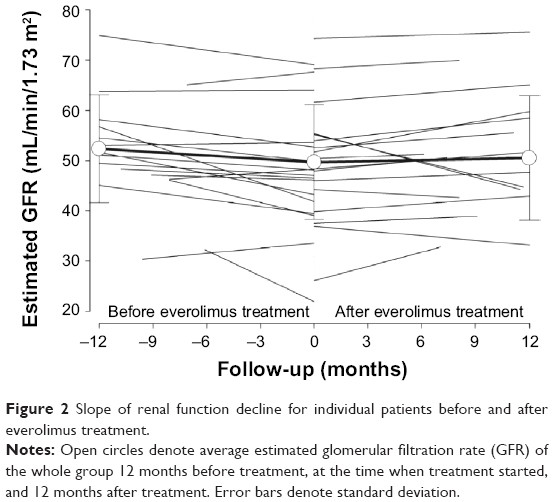 | Figure 2 Slope of renal function decline for individual patients before and after everolimus treatment. |
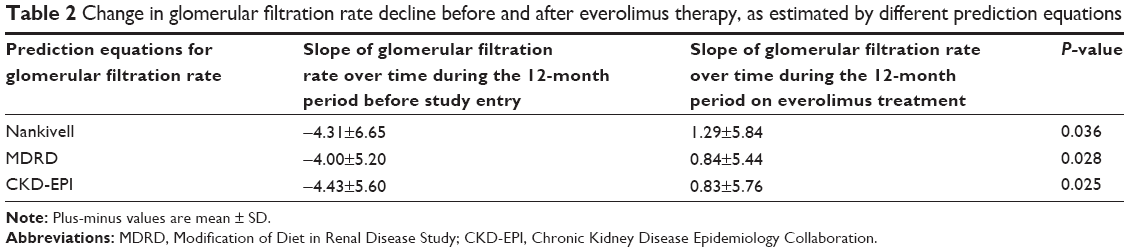 | Table 2 Change in glomerular filtration rate decline before and after everolimus therapy, as estimated by different prediction equations |
The degrees of tubular atrophy and interstitial fibrosis were compared between baseline and 12-month renal biopsy specimens. Average percentage of tubular atrophy was 15.7%±11.3% in the baseline biopsy specimens. We observed a significant decrease of tubular atrophy (7.1%±7.3%, P=0.005) after 12 months of everolimus treatment. The percentage of interstitial fibrosis was also significantly reduced after 12 months of everolimus treatment (14.8%±11.5% versus 7.2%±8.2%, P=0.013). Histological improvement is summarized in Figures 3 and 4.
 | Figure 3 Histological scores of tubular atrophy before and after everolimus. |
 | Figure 4 Histological scores of interstitial fibrosis before and after everolimus. |
Secondary outcomes
There were no major tolerability problems after using everolimus. No patients developed acute rejection over the duration of the study period. Table 3 shows the clinical secondary end points. Glomerular filtration rate estimated by Nankivell formula at baseline and at 12 months was 58.0±14.0 mL/min/1.73 m2 and 60.1±18.0 mL/min/1.73 m2, respectively (P=0.24). We found no significant change in mean arterial pressure, proteinuria, or serum cholesterol levels, but there was a trend of increasing use of 3-hydroxy-3-methylglutaryl-coenzyme A (HMG-CoA) reductase inhibitor and angiotensin converting enzyme inhibitor (or angiotensin receptor blocker) after everolimus.
 | Table 3 Secondary clinical end points and parameters after everolimus therapy |
Wilcoxon rank sum test on 16 pairs of sequential renal biopsies showed a nonsignificant decrease in TGF-β1 mRNA expression (4,270.1±4,567.4 versus 2,515.7±2,320.6 copies per 1,000 copies of the housekeeping gene, P=0.26).
Discussion
Slowing down the slope of glomerular filtration rate decline and amelioration of the histological deterioration are integral components of rescue therapy in renal transplant patients with worsening graft function.18,19 Our study provides evidence that the use of everolimus and minimization of calcineurin inhibitors improves both components. Strengths of the study include the complete follow-up without dropout, availability of histology before and after everolimus use, and good adherence to study medication.
Histological improvement, as shown by mean tubular atrophy score of serial protocol-mandated renal biopsy 36 months after conversion to sirolimus, has been previously reported in a large multicenter study.20 Regression of TA/IF, as shown by paired renal biopsies before and after 12 months of everolimus in our study, adds to the evidence that everolimus was effective in slowing down the glomerular filtration rate decline after minimizing the calcineurin inhibitor use, and addresses some of the lingering clinical questions. One question concerns the timing of everolimus conversion and the irreversibility of tissue damage by the time everolimus rescue is initiated. It should be borne in mind that late introduction of everolimus in the ASCERTAIN study (average time 5 years posttransplant) did not result in overall renal benefit.21 Our data indicate that everolimus rescue therapy can still be effective in patients after a median period of 4.5 years from transplantation. Benefit of late conversion of renal transplant from cyclosporine has also been recently shown in a randomized study that followed up renal function for 5 years.22 Glomerular filtration rate inclusion criteria for our study cohort (greater than 40 mL/min/1.73 m2) conform to the levels recommended by the 2009 Kidney Disease: Improving Global Outcomes (KDIGO) clinical practice guideline.23 Our strategy of renal biopsy before recruitment, rather than empiric conversion and calcineurin inhibitor minimization, could have offered opportunities to show the benefit of mTOR inhibitors. An “entry passport” as obtained from graft biopsy before mTOR inhibitor conversion serves to measure the immune status of the transplant recipients (by excluding those with cellular rejection) because everolimus conversion might worsen the renal outcomes in the presence of high rejection risk. To provide some perspective, among the 24 screened subjects with chronic allograft dysfunction in our study, almost one-third were excluded because of biopsy evidence of rejection (Figure 1). Of those recruited, more than three-quarters had no history of kidney rejection. Considering the relatively high frequency with which subclinical rejection is encountered, we believe it is imperative to attempt renal biopsy before everolimus conversion. In other words, case selection is probably more important than the timing of everolimus conversion.
Despite the improvement of glomerular filtration decline rate after everolimus, the protective mechanism of mTOR inhibitors remains elusive. As such, animal models have been developed to assess the effect of mTOR inhibitors on progression of kidney disease. Based on experiments with everolimus use 2 weeks after 5/6 nephrectomy in Wistar rats,24 mTOR and TGF-β inhibition had been shown to explain the antifibrotic effects, and hence protection of the remnant kidney. Although we were unable to prove a statistically significant blunting in TGF-β mRNA expression in the transplant kidney as had been shown in animals, it could have been related to the inadequate sample size. Moreover, the improvement of glomerular filtration decline rate could also be attributed to a lower dose of cyclosporine which is known to act as a vasoconstrictor in the afferent arteriole of the glomerulus.25
There are limitations to our study. First, this was an open-label trial and thus subject to reporting biases. However, clinical outcomes were prespecified, objectively defined, and independently assessed by a pathologist who was blinded to the clinical data. All these factors minimize the potential for bias. In addition, our results may be influenced by the presence of residual confounding since new treatments were allowed during the study period, which could have had an effect on the glomerular filtration rate and histological improvement. Examples include the use of angiotensin converting enzyme inhibitor or angiotensin receptor blocker. Angiotensin II blockade has been recently shown to prevent the expansion of cortical interstitial compartment, although there was no significant reduction in interstitial fibrosis or tubular atrophy.26 It should be noted that no appreciable change in blood pressure control has been observed throughout the study period in our study cohort.
In conclusion, we systematically evaluated the glomerular filtration rate decline and histological characteristics before and after late everolimus conversion in a cohort of renal transplant recipients with chronic allograft dysfunction. We found that everolimus conversion and calcineurin inhibitor minimization among carefully selected renal transplant recipients can improve their glomerular filtration rate decline rate and ameliorate the degrees of TA/IF. These results may also be relevant to the use of everolimus in other solid organ transplant recipients with kidney dysfunction.
Acknowledgments
The study was supported in part by the Hong Kong Society of Nephrology Research Grant and the Chinese University of Hong Kong Research Grant Account 6900570.
Disclosure
The authors report no conflicts of interest in this work.
References
Colvin RB. Chronic allograft nephropathy. N Engl J Med. 2003;349:2288–2290. | ||
Wali RK, Mohanlal V, Ramos E, et al. Early withdrawal of calcineurin inhibitors and rescue immunosuppression with sirolimus-based therapy in renal transplant recipients with moderate to severe renal dysfunction. Am J Transplant. 2007;7:1572–1583. | ||
Meier-Kriesche HU, Schold JD, Kaplan B. Long-term renal allograft survival: have we made significant progress or is it time to rethink our analytic and therapeutic strategies? Am J Transplant. 2004;4:1289–1295. | ||
Afzali B, Taylor AL, Goldsmith DJ. What we CAN do about chronic allograft nephropathy: role of immunosuppressive modulations. Kidney Int. 2005;68:2429–2443. | ||
Mjörnstedt L, Sørensen SS, von zur Mühlen B, et al. Improved renal function after early conversion from a calcineurin inhibitor to everolimus: a randomized trial in kidney transplantation. Am J Transplant. 2012;12:2744–2753. | ||
Diekmann F, Budde K, Oppenheimer F, Fritsche L, Neumayer HH, Campistol JM. Predictors of success in conversion from calcineurin inhibitor to sirolimus in chronic allograft dysfunction. Am J Transplant. 2004;4:1869–1875. | ||
Nankivell BJ, Gruenewald SM, Allen RD, Chapman JR. Predicting glomerular filtration rate after kidney transplantation. Transplantation. 1995;59:1683–1689. | ||
Chan L, Hartmann E, Cibrik D, Cooper M, Shaw LM. Optimal everolimus concentration is associated with risk reduction for acute rejection in de novo renal transplant recipients. Transplantation. 2010;90:31–37. | ||
Solez K, Covin RB, Racusen LC, et al. Banff 07 classification of renal allograft pathology: updates and future directions. Am J Transplant. 2008;8:753–760. | ||
Colvin RB. CADI, Canti, Cavi. Transplantation. 2007;83:677–678. | ||
Rush D. Protocol transplant biopsies: an underutilized tool in kidney transplantation. Clin J Am Soc Nephrol. 2006;1:138–143. | ||
Nankivell BJ, Fenton-Lee CA, Kuypers DR, et al. Effect of histological damage on long-term kidney transplant outcome. Transplantation. 2001;71:515–523. | ||
Nankivell BJ, Borrows RJ, Fung CL, O’Connell PJ, Chapman JR, Allen RD. Delta analysis of posttransplantation tubulointerstitial damage. Transplantation. 2004;78:434–441. | ||
Saurina A, Campistol JM, Lario S, Oppenheimer F, Diekmann F. Conversion from calcineurin inhibitors to sirolimus in kidney transplant patients reduces the urinary transforming growth factor-β1 concentration. Transplant Proc. 2007;39:2138–2141. | ||
Sumethkul V, Changsirikulchai S, Lothuvachai T, Chalermsanyakorn P. Sirolimus attenuates the rate of progression of early chronic allograft nephropathy. Transplant Proc. 2006;38:3470–3472. | ||
Levey AS, Bosch JP, Lewis JB, Greene T, Rogers N, Roth D; Modification of Diet in Renal Disease Study Group. A more accurate method to estimate glomerular filtration rate from serum creatinine: a new prediction equation. Ann Intern Med. 1999;130:461–470. | ||
Levy AS, Stevens LA, Schmid CH, et al; CKD-EPI (Chronic Kidney Disease Epidemiology Collaboration). A new equation to estimate glomerular filtration rate. Ann Intern Med. 2009;150:604–612. | ||
Moranne O, Maillard N, Fafin C, Thibaudin L, Alamartine E, Mariat C. Rate of renal graft function decline after one year is a strong predictor of all-cause mortality. Am J Transplant. 2013;13:695–706. | ||
Park WD, Griffin MD, Cornell LD, Cosio FG, Stegall MD. Fibrosis with inflammation at one year predicts transplant functional decline. J Am Soc Nephrol. 2010;21:1987–1997. | ||
Mota A, Arias M, Taskinen EI, et al; Rapamune Maintenance Regimen Trial. Sirolimus-based therapy following early cyclosporine withdrawal provides significantly improved renal histology and function at 3 years. Am J Transplant. 2004;4:953–961. | ||
Holdaas H, Rostaing L, Serón D, et al; ASCERTAIN Investigators. Conversion of long-term kidney transplant recipients from calcineurin inhibitor therapy to everolimus: a randomized, multicenter, 24-month study. Transplantation. 2011;92:410–418. | ||
Budde K, Sommerer C, Rath T, et al. Renal function to 5 years after late conversion of kidney transplant patients to everolimus: a randomized trial. J Nephrol. Epub September 6, 2014. | ||
Kasiske BL, Zeier MG, Chapman JR, et al; Kidney Disease: Improving Global Outcomes. KDIGO clinical practice guideline for the care of kidney transplant recipients: a summary. Kidney Int. 2010;77:299–311. | ||
Kurdián M, Herrero-Fresneda I, Lloberas N, et al. Delayed mTOR inhibiton with low dose of everolimus reduces TGFβ expression, attenuates proteinuria and renal damage in the renal mass reduction model. PLoS One. 2012;7:e325. | ||
Chapman JR. Chronic calcineurin inhibitor nephrotoxicity – lest we forget. Am J Transplant. 2011;11:693–697. | ||
Ibrahim HN, Jackson S, Connaire J, et al. Angiotensin II blockade in kidney transplant recipients. J Am Soc Nephrol. 2013;24:320–327. |
 © 2015 The Author(s). This work is published and licensed by Dove Medical Press Limited. The full terms of this license are available at https://www.dovepress.com/terms.php and incorporate the Creative Commons Attribution - Non Commercial (unported, v3.0) License.
By accessing the work you hereby accept the Terms. Non-commercial uses of the work are permitted without any further permission from Dove Medical Press Limited, provided the work is properly attributed. For permission for commercial use of this work, please see paragraphs 4.2 and 5 of our Terms.
© 2015 The Author(s). This work is published and licensed by Dove Medical Press Limited. The full terms of this license are available at https://www.dovepress.com/terms.php and incorporate the Creative Commons Attribution - Non Commercial (unported, v3.0) License.
By accessing the work you hereby accept the Terms. Non-commercial uses of the work are permitted without any further permission from Dove Medical Press Limited, provided the work is properly attributed. For permission for commercial use of this work, please see paragraphs 4.2 and 5 of our Terms.