")
Back to Journals » Neuropsychiatric Disease and Treatment » Volume 16
Functional Analysis of the 3ʹ Untranslated Region of the Human GRIN1 Gene in Regulating Gene Expression in vitro
Authors Liu Y, Wu X, Meng J, Yao J , Wang B
Received 21 June 2020
Accepted for publication 12 September 2020
Published 12 October 2020 Volume 2020:16 Pages 2361—2370
DOI https://doi.org/10.2147/NDT.S268753
Checked for plagiarism Yes
Review by Single anonymous peer review
Peer reviewer comments 2
Editor who approved publication: Dr Jun Chen
Yong-ping Liu, Xue Wu, Jing-hua Meng, Jun Yao, Bao-jie Wang
School of Forensic Medicine, China Medical University, Shenyang 110122, People’s Republic of China
Correspondence: Bao-jie Wang
School of Forensic Medicine, China Medical University, No. 77 Puhe Road, Shenbei New District, Shenyang 110122, People’s Republic of China
Tel +8618842462979
Email [email protected]
Purpose: Abnormal expression of the NR1 subunit of the N-methyl-d-aspartate (NMDA) receptor may potentially increase the susceptibility to neuropsychiatric diseases. The purpose of this study was to investigate the functional sequence of the 3ʹUTR of the human GRIN1 gene, which encodes the GluN1 receptor to determine the effect on the expression of GluN1 receptor.
Methods: We transferred seven recombinant pmirGLO recombinant vectors containing the 3ʹUTR truncated fragment of the GRIN1 gene into HEK-293, SK-N-SH, and U87 cell lines and compared the relative fluorescence intensity of adjacent length fragments. The TargetScan database was used to predict miRNAs. Then, miRNA mimics/inhibitors were co-transfected into the three cell lines with the 3ʹUTR of GRIN1 (pmirGLO - GRIN1), to investigate their influence on GRIN1 gene expression.
Results: Compared with the pmirGLo-Basic vector, the relative fluorescence intensity of the complete GRIN1 gene 3ʹUTR recombinant sequence − 27 bp – +1284 bp (the next base of the stop codon is +1) was significantly decreased in all three cell lines. The relative fluorescence intensities were significantly different between − 27 bp – +294 bp and − 27 bp – +497 bp regions, and between − 27 bp – +708 bp and − 27 bp – +907 bp regions. According to the prediction of the TargetScan database and analysis, miR-212-5p, miR-324-3p and miR-326 may bind to +295 bp – +497 bp, while miR-491-5p may bind to +798 bp – +907 bp. After co-transfection of miRNA mimic/inhibitor or mimic/inhibitor NC with a recombinant vector in the 3ʹUTR region of GRIN1 gene, we found that has-miR-491-5p inhibited GRIN1 expression significantly in all three cell lines, while has-miR-326 inhibitor upregulated GRIN1 expression in HEK-293 and U87 cells.
Conclusion: miR-491-5p may bind to the 3ʹUTR of the GRIN1 gene (+799 bp – +805 bp, the next base of the stop codon is +1) and down-regulate gene expression in HEK-293, SK-N-SH, and U87 cell lines, which implicates a potential role of miR-491-5p in central nervous system diseases.
Keywords: human GRIN1 gene, 3ʹUTR, miRNA, GluN1 receptor, Parkinson’s disease
Introduction
The N-methyl-D-aspartate (NMDA) receptor is a subtype of glutamate receptors, and has been shown to be closely linked to neuronal activities such as synapse formation, synaptic plasticity, and excitotoxicity.1 NMDA receptors play an important role in neuronal activities of the nervous system, and thus potential therapeutic targets for pathological mechanisms of neurological diseases such as bipolar disorder,2 epilepsy,3 schizophrenia,4 and major depression.5 Two essential GluN1 subunits combine with two GluN2 or/and GluN3 subunits to form a heterotetramer of functional NMDA receptors.6 Therefore, the GluN1 subunit is indispensable for the NMDA receptor to play its important biological role.7 It was previously shown that changes in the number of membrane-related receptors may lead to abnormal receptor activity, resulting in pathological NMDA receptor effects. Animal models and post-mortem studies have confirmed that transcription and protein expression levels of the GluN1 subunit in schizophrenia were different from normal controls, although there were various changes in different regions of the brain.8 For example, GluN1 protein expression increased in the anterior cingulate cortex9 but decreased in the prefrontal cortex and hippocampus.10 At the transcriptional level, GluN1 mRNA expression in the hippocampus11 and thalamus12 of schizophrenic patients were reduced. In situ hybridization experiments demonstrated that GluN1 transcript expression was significantly reduced in bipolar disorder. Of these, GluN1 mRNA expression in the CA3 region of the hippocampus decreased the most, reaching 33%.13 In addition, as the pathologic severity of Alzheimer’s disease increased, mRNA and protein expression of the GluN1 subunit significantly decreased.14 In summary, abnormal expression of the GluN1 subunit of the NMDA receptor is an potential factor that leads to increased susceptibility to neuropsychiatric diseases.
The GluN1 subunit of NMDA receptors is encoded by the glutamate ionotropic receptor NMDA type subunit 1 (GRIN1) gene located on chromosome 9q34.3.15 In addition to the traditional 5ʹuntranslated region (5ʹUTR) or 5ʹflanking region, another important regulatory domain of the GRIN1 gene is the 3ʹuntranslated region (3ʹUTR) or 3ʹflanking region, which has been poorly studied. microRNAs (miRNAs) are small, non-coding RNAs of 21 to 25 nucleotides, whose “seed regions” span 2–7 nucleotides at the 5ʹ end,16 and regulate target mRNA expression by direct interaction with complementary sequences in the 3ʹUTR.17 miRNAs mainly reduce the expression of target mRNA by reducing the stability of mRNA or inhibiting translation, thus exerting their function post-transcriptionally.18 Current research has indicated that miRNA not only participates in the course of cancer19 and cardiovascular diseases,20 but also plays an important role in the pathogenesis of nervous system disorders.21,22
A luciferase report assay showed that overexpression of miR-1908-5p significantly reduced the luciferase activity of the 3ʹUTR recombinant vector of neuronal glutamatergic synapse-related genes, including DLGAP4, STX1A, CLSTN1, GRM4 and GRIN1 (gene encoding the NR1 subunit).18 Interestingly, miR-1908 has been identified as one of the most promising miRNAs related to bipolar disorder in recent genome-wide association studies (GWAS). It has been shown that the irregular calmodulin-dependent protein kinase II (CaMKII)/NMDA receptor pathway is one of the common pathways in various diseases, especially neuropsychiatric disorders. miR-219, a brain-specific miRNA, has been shown to negatively regulate the function of NMDA receptors by targeting CaMKII.23 Treatment of kainic acid (KA)-induced epilepsy with miR-219 has been shown to reduce seizures and reduce the levels of CaMKIIγ and NR1.23 Lentiviral-mediated miR-219-5p reduces the expression of the NR1 subunit, resulting in decreased morphine tolerance.24 In addition, miR-219 upregulation in a type 2 diabetes mellitus mouse model leads to decreased mRNA and protein levels of CaMKII and NR1 in the hippocampus.25 The hippocampus has an indispensable responsibility for human learning and memory, and its aging and dysfunction can lead to cognitive impairment.26 Primary hippocampal neurons transfected with miR-204 mimics reduced GluN1 expression and inhibited the expression of EphB2, a known regulator of synaptic plasticity in hippocampal neurons.27 Moreover, injection of miR-34c in epileptic rats caused downregulation of NR1 and aggravated loss of learning and memory function in the Morris water maze test in epileptic rats.28 The above evidence indicates that miRNA can participate in the pathogenesis of neuropsychiatric diseases through the NR1 subunit.
Therefore, we constructed recombinant vectors containing sequences of different lengths of the 3ʹUTR of the GRIN1 gene to identify functional fragments, and we predicted miRNAs that may bind to them. Then, miRNA mimics/inhibitors were co-transfected into three cell lines with the 3ʹUTR of GRIN1 (pmirGLO - GRIN1) to explore their influence on GRIN1 gene expression.
Methods
Construction of pmirGLO-GRIN1 (3ʹUTR) Recombinant Vectors
Primer 5.0 software was used to design the target 3ʹUTR amplified fragment of the GRIN1 gene. According to the pmirGLO plasmid polyclonal sites, the NheI and SbfI cleavage sites for the restriction enzymes were introduced into the 5ʹ end of the forward and reverse primers, respectively (Table 1). The 3ʹUTR fragment of this study is located at −27 bp – +1284 bp (the next base of the stop codon is +1). Six other 3ʹ-truncated fragments were constructed using this fragment as an amplification template. Purified PCR products were first cloned into a pGM-T vector and transformed with T-fast competent cells. Sanger sequencing was used to screen the target fragments with the correct sequence, and the screened fragments were cloned into pmirGLO vector.29 Recombinant pmirGLO-GRIN1 vectors were used for subsequent experiments.
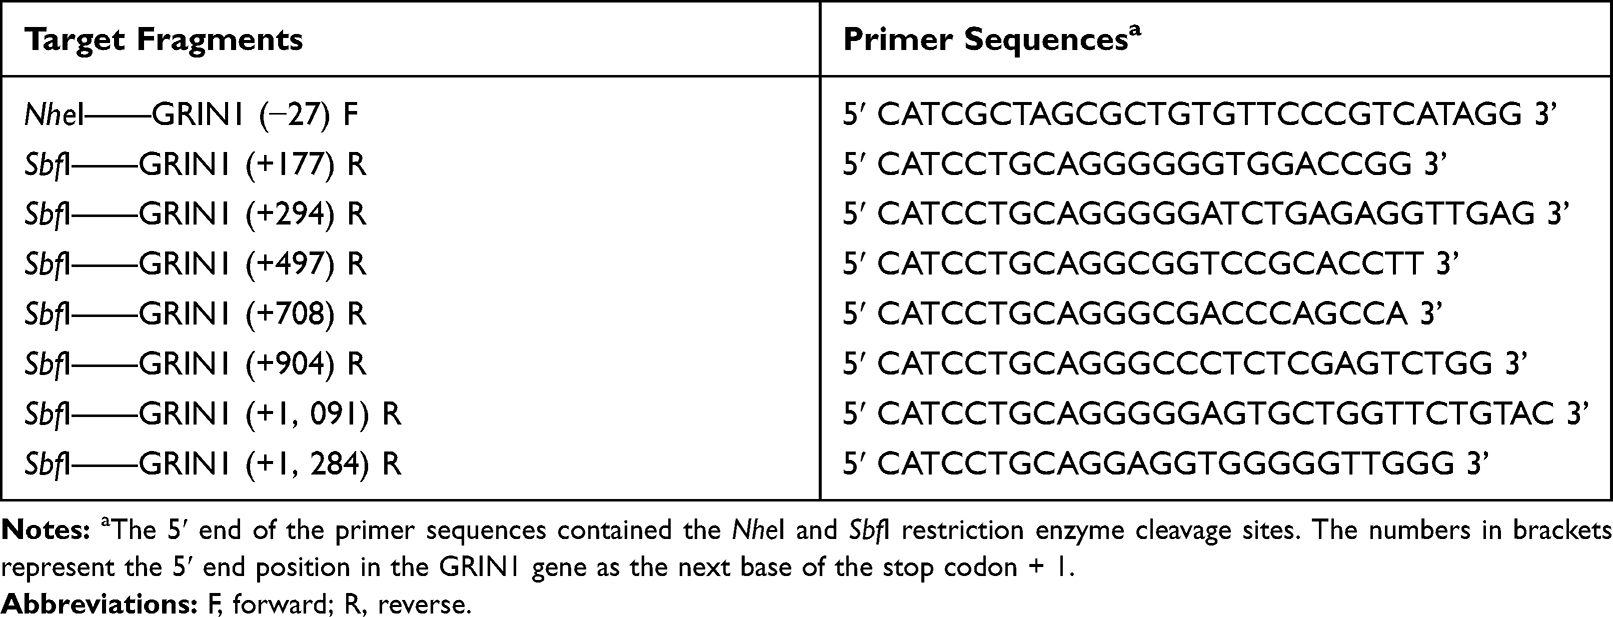 |
Table 1 Primer Sequences of Target Fragments Containing Cleavage Sites |
Cell Culture
The human embryonic kidney cell line, HEK-293; the human glioma cell line, U87; and the human neuroblastoma cell line, SK-N-SH line (Shanghai Institute of Biological Sciences, Chinese Academy of Sciences, Shanghai, China) were used for transfecting recombinant vectors. HEK-293 cells and U87 cells were cultured with HyCloner high glucose DMEM containing 10% fetal bovine serum (Thermo Fisher Scientific, Chelmsford, Mass). SK-N-SH cells were cultured in KeyGRN BioTECH® high glucose DMEM (with 0.011 g/L sodium pyruvate) with 15% fetal bovine serum. All three cell lines were cultured at 37°C in 5% CO2 + 95% mixed air.
microRNA Prediction
Bioinformatics analysis was performed on differentially functional fragments with significantly increased protein expression relative to adjacent longer fragments. TargetScanHuman (Release 7.2, http://www.targetscan.org/vert_72/) and miRbase (http://www.mirbase.org/) databases were used to predict the miRNA of the GRIN1 gene 3ʹUTR functional sequence.
Transient Transfection and Dual Luciferase Reporter Assay
Transient Transfection of pmirGLO-GRIN1 Recombinant Vectors
When cell density reached 90%, cells were seeded into 24-well plates at a concentration of 2×10⁵ cells per well, and incubated for 36–48 h. Transfection of seven recombinant vectors and pmirGLO basic vector was performed using the Lipofectamine® 3000 reagent (Invitrogen, Carlsbad, California, USA). Cell lysates were collected after incubating the cells for 24 h, and luciferase substrate and STOP reagent (Promega) was then added to the cell lysate to detect the protein expression of firefly luciferase (LUC) and renilla luciferase (TK), respectively. LUC/TK is the relative fluorescence intensity. Each recombinant pmirGLO vectors was tested in triplicate wells with a total of three experiments.
Co-Transfection of pmirGLO-GRIN1 (−27 Bp – +1284) with hsa-miR-212-5p, hsa-miR-324-3p, has-miR-326 or has-miR-491-5p
An amount of 100 ng pmirGLO-GRIN1 (−27 bp – +1284 bp) plus 1 μL (0.264 μg) has-miR-212-5p or has-miR-324-3p or has-miR-326 or has miR-491-5p mimic/inhibitor or miRNA NC mimic/inhibitor were co-transferred into cells per well using 1 μL Lipofectamine® 3000 reagent (GenePharma, Shanghai, China) at the time point of exponential growth. Cell lysates were collected after 24 h and the relative fluorescence intensity was measured. Each sample was tested in triplicate wells with a total of three experiments.
Statistical Calculations
The relative fluorescence intensity of each sample is expressed as the mean ± standard deviation. Differences between all vectors were compared using one-way ANOVA. To reduce type I error, the least significant difference (LSD)-t-test was used to compare two adjacent fragments. SPSS 20.0 software (IBM, Armonk, NY, USA) was used for calculations, and p values of less than 0.05 were considered statistically significant.
Results
Comparative Analysis of Relative Fluorescence Intensity of GRIN1 Gene Recombinant Vectors
Seven recombinant vectors of the 3ʹUTR of the GRIN1 gene, with different lengths (Figure 1), and the pmirGLO Basic vector were transfected into HEK-293, SK-N-SH, and U87 cell lines to evaluate the effect of different sequence locations in the 3ʹUTR region on protein expression. Compared with the pmirGLO-Basic vector, the relative fluorescence intensity of the complete GRIN1 gene 3ʹUTR recombinant sequence (−27 bp – +1284 bp) was significantly decreased in all three cell lines (p < 0.001 in SK-N-SH cells, p < 0.001 in U87 cells, and p = 0.002 in HEK-293 cells). The results of one-way ANOVA showed that the relative fluorescence intensity of all recombinant vectors with target fragments in the three cell lines showed statistically significant differences. Specifically, in SK-N-SH cells, p < 0.001, F = 84.658; in U87 cells, p < 0.001, F = 26.226; In HEK-393 cells, p = 0.002, F = 3.720. The common characteristic of protein expression in the adjacent fragments in all three cell lines was that the relative fluorescence intensity was significantly different between (−27 bp – +294 bp) and (−27 bp – +497 bp). Moreover, only this adjacent fragment was shown to have a different expression in HEK-293 cells (Figure 2).
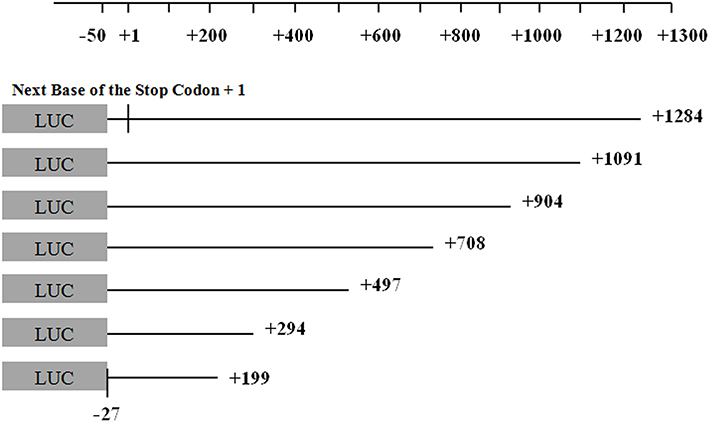 |
Figure 1 The seven constructed pmirGLO recombinant vectors contained the desired fragment. The locations of the target fragments of the seven recombinant vectors, which contained a deletion from the 3ʹ end of the GRIN1 gene are shown. The longest target fragment was located in the − 27 bp to + 1284 bp region, as the next base of the stop codon + 1. The 5ʹ end positions of the other amplified fragments were unchanged. All fragments removed from the 3ʹ end were approximately 100 bp to 200 bp in length. |
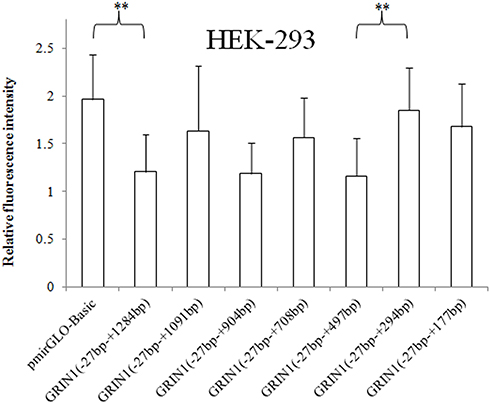 |
Figure 2 Relative fluorescence intensities of the pmirGLO basic vector and seven recombinant vectors with the 3ʹ end deletion in the HEK-293 cell line. The relative intensity of the 3ʹUTR complete sequence ranging from − 27 bp to + 1284 bp was significantly decreased. The sequence +295 bp to +497 bp showed an inhibitory effect on protein expression in HEK-293 cells. The relative fluorescence intensity is expressed as the mean ± standard deviation, and the difference in relative fluorescence intensity between adjacent sequences was determined by the least significant difference-t-test. **0.001 < p < 0.02. |
For SK-N-SH cells, relative luciferase expression of (−27 bp – +708 bp) versus (−27 bp – +904 bp) and (−27 bp – +177 bp) versus (−27 bp – +294 bp) were also statistically different in addition to (−27 bp – +294bp) versus (−27 bp – +497 bp), p values were all < 0.001 (Figure 3). For U87 cells, besides the differentially expressed fragments shared by the three cell lines, fragments (−27 bp – +1091 bp) versus (−27 bp – +1284 bp) and (−27 bp – +497 bp) versus (−27 bp – +708 bp) showed statistically different expression patterns (Figure 4).
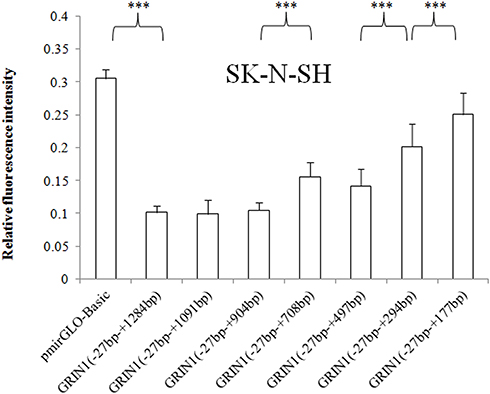 |
Figure 3 Relative fluorescence intensities of the pmirGLO basic vector and seven recombinant vectors with the 3ʹ end deletion in the SK-N-SH cell line. The relative intensity of the 3ʹUTR complete sequence ranging from − 27 bp to + 1284 bp was significantly decreased. The sequence +178 bp to +294 bp, +295 bp to +497, and +709 bp to +904 showed an inhibitory effect on protein expression in SK-N-SH cells. The relative fluorescence intensity is expressed as the mean ± standard deviation, and the difference in relative fluorescence intensity between adjacent sequences was determined by the least significant difference-t-test. ***p < 0.001. |
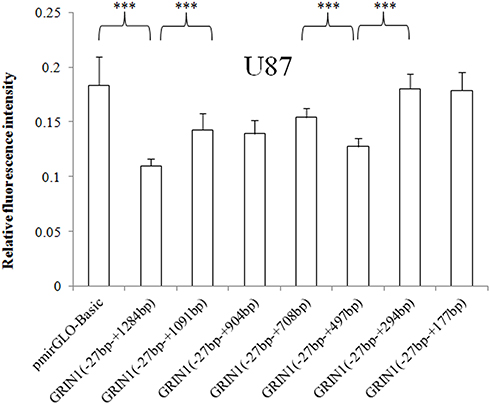 |
Figure 4 Relative fluorescence intensities of the pmirGLO basic vector and seven recombinant vectors with a 3ʹ end deletion in the U87 cell line. The relative intensity of the 3ʹUTR complete sequence ranging from − 27 bp to + 1284 bp was significantly decreased. The sequence +178 bp to +294 bp and +1092 bp to 1284 bp showed an inhibitory effect on protein expression in U87 cells. The relative fluorescence intensity is expressed as the mean ± standard deviation, and the difference in relative fluorescence intensity between adjacent sequences was determined by the least significant difference-t-test. ***p < 0.001. |
miRNA Prediction
After searching with the gene symbol “GRIN1” in the Target Scan database, three transcripts of 3ʹUTR with lengths of 1235 nucleotides (nt) (ENST00000371561.3), 1377 nt (ENST00000350902.5) and 920 nt (ENST00000315048.3) were identified. The transcript of 1235 nt (ENST00000371561.3) was chosen for use in this study as it was more prevalent. The Target Scan 7.2 database indicates that some miRNAs, such as miR-212-5p, miR-338-3p, miR-15-5p/16-5p/195-5p/424-5p/497-5p, miR-324-3p, and miR-326 may recognize the functional sequences from +295 bp to +497 bp, while miR-491-5p may recognize the functional sequences from +708 bp to +904 bp (Figure 5), which could play a key role in the pathology of neuropsychiatric diseases.
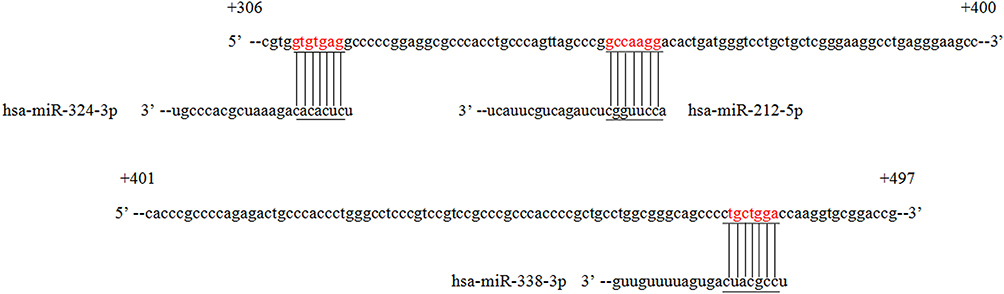 |
Figure 5 Prediction of miRNAs that recognize the GRIN1 gene 3ʹUTR region. Based on the number of combined bases and cell expression, TargetScanHuman 7.2 software showed that hsa-miR-324-3p, hsa-miR-212-5p, has-miR-338-5p and has-miR-491-5p were most likely to regulate expression of the GRIN1 gene, and the recognition sequences were located at +310 bp to +316 bp, +351 bp to +358 bp, +476 bp to +482 bp and +799 bp to +805 bp. The numbers represent the position of the gene (the next base of the stop codon is +1) and the horizontal and vertical lines represent matching bases. |
hsa-miR-491-5p Significantly Down-Regulated the Relative Fluorescence Intensity of the (−27 Bp – +1284 Bp) Sequence
The pmirGLO-GRIN1 (−27 bp – +1284 bp) was co-transfected with has-miR-212-5p/has-miR-324-3p/has-miR-326/has-mir-491-5p mimic/inhibitor or miRNA NC mimic/inhibitor. The results showed that the relative fluorescence intensity of pmirGLO-GRIN1 (−27 bp – +1284 bp) + has-miR-491-5p mimic was significantly reduced in HEK-293 cells (Figure 6), U87 cells (Figure 7) and SK-N-SH cells (Figure 8) compared with pmirGLO-GRIN1 (−27 bp – +1284 bp) + miRNA NC mimic (p values were 0.021, 0.000267, and 0.029, respectively). Moreover, this statistical significance disappeared in all three cell lines when the relative fluorescence intensity of pmirGLO-GRIN1 (−27 bp – +1284 bp) + has-miR-491-5p inhibitor was compared with that of pmirGLO-GRIN1 (−27 bp – +1284 bp) + miRNA NC inhibitor. In addition, inhibition of has-miR-326 significantly increased pmirGLO-GRIN1 (−27 bp – +1284 bp) expression in HEK-293 and U87 cells.
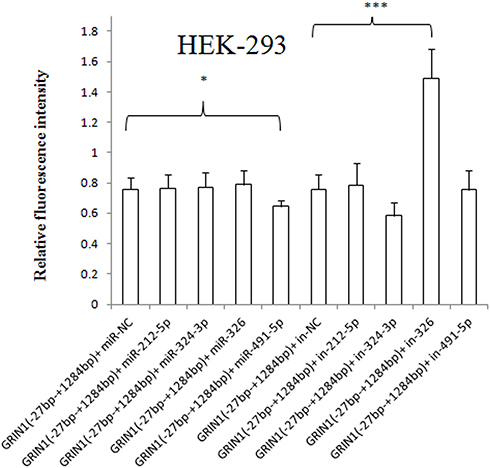 |
Figure 6 Effect of has-miR-212-5p, has-miR-324-3p, has-miR-326, and has-miR-491-5p on GRIN1 gene expression in HEK-293 cells. The relative fluorescence intensity of pmirGLO-GRIN1 (−27 bp – +1284 bp) + has-miR-491-5p mimic was significantly lower than that of the pimiGLO-GRIN1 (−27 bp – +1284 bp) + miRNA NC mimic in HEK-293 cells. Moreover, has-miR-326 inhibitor significantly increased protein expression of pimiGLO-GRIN1 (−27 bp – +1284 bp). *0.02 < p < 0.05, ***p < 0.001. |
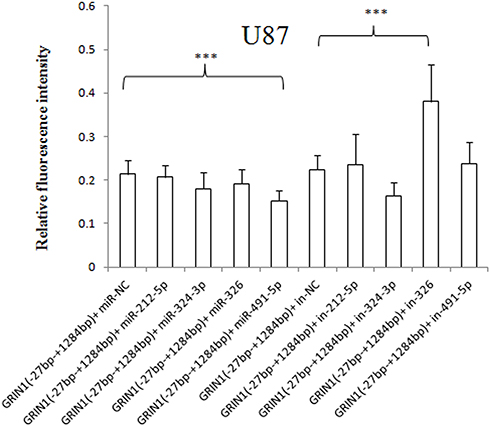 |
Figure 7 Effect of has-miR-212-5p, has-miR-324-3p, has-miR-326, and has-miR-491-5p on GRIN1 gene expression in U87 cells. The relative fluorescence intensity of the pmirGLO-GRIN1 (−27 bp – +1284 bp) + has-miR-491-5p mimic was significantly lower than that of the pimiGLO-GRIN1 (−27 bp – +1284 bp) + miRNA NC mimic in U87 cells. Moreover, the has-miR-326 inhibitor significantly increased protein expression of pimiGLO-GRIN1 (−27 bp – +1284 bp). ***p < 0.001. |
 |
Figure 8 Effect of has-miR-212-5p, has-miR-324-3p, has-miR-326, and has-miR-491-5p on GRIN1 gene expression in SK-N-SH cells. The relative fluorescence intensity of the pmirGLO-GRIN1 (−27 bp – +1284 bp) + has-miR-491-5p mimic was significantly lower than that of the pimiGLO-GRIN1 (−27 bp – +1284 bp) + miRNA NC mimic in SK-N-SH cells. *0.02 < p < 0.05. |
Discussion
Seven recombinant pmirGLO vectors with different length segments were constructed to study the functional sequence of the 3ʹUTR of the GRIN1 gene. The recombinant vector was transfected into human embryonic kidney cells, HEK-293, human glioma cells, U87, and human neuroblastoma cells, SK-N-SH and its protein expression was analyzed. The mimics and inhibitors of miR-212-5p, miR-324-3p, miR-326, and miR-491-5p were then co-transfected with the recombinant pmirGLO vector containing a complete GRIN1 gene 3ʹUTR fragment to demonstrate whether the predicted miRNA had an overall regulatory effect on the GRIN1 gene. HEK-293 cells are easily cultured with a high transfection efficiency, and are commonly used as tool cells.30 These characteristics also make HEK-293 cells a suitable mammalian cell line for producing protein on a laboratory scale.31 U87 is a human glioblastoma cell line derived from astrocytes, glial progenitor cells or cancer stem cells.32 The human neuroblastoma cell line, SK-N-SH, has a high level of dopamine-/9-hydroxylase activity (only distributed in sympathetic nerve tissue), which proves where the cell line is derived from neurons.33
The luciferase report analysis showed that in HEK-293, SK-N-SH and U87 cell lines, protein expression increased significantly when the sequences located at +295 bp – +497 bp were truncated. There may be one or more miRNA “seed region” binding sites in +295 bp – +497 bp. Sequence analysis was performed using TargetScan database, and multiple candidate miRNAs were found in this region. miRNA is considered “conserved” because its binding site is maintained between different species. The conservation level is an important parameter that can reflect the reliability of miRNA prediction, because it demonstrates that the predicted miRNA is a functional miRNA selected by positive natural selection.34 Therefore, we first focused on these conserved miRNAs including miR-212-5p, miR-338-3p, miR-15-5p/16-5p/195-5p/424-5p/497-5p, miR-324-3p and miR-326. Furthermore, according to the rankings of the conserved 8mer, 7mer, and 6mer sites that matched in the miRNA seed region and the context scores,35 the strong candidate miRNAs in +295 bp – +497 bp were miR-212-5p, miR-324-3p and miR-326 (Figure 5). Studies have shown that miR-212-5p overexpression inhibits MPP+-induced SK-N-SH cell apoptosis, inflammation and cytotoxicity.36 miR-212-5p can also prevent the death of dopaminergic neurons in a mouse model of Parkinson’s disease (PD).37 This evidence indicates that miR-212-5p plays a regulatory role and exhibits neuroprotective effects in PD. In addition, miR-324-3p is down-regulated in PD patients,38 while miR-326 promotes autophagy in dopaminergic neurons in PD mice,39 inhibits apoptosis and promotes proliferation of dopaminergic neurons in PD,40 which demonstrates that miR-324-3p and miR-326 are ideal new targets for PD treatment in the future. Moreover, recent studies by He et al41 have demonstrated that miR-326 improved cognitive function and inhibited neuronal apoptosis in mice with Alzheimer’s disease (AD) through a related signaling pathway. These results suggest that miR-212-5p, miR-324-3p and miR-326 may contribute to various neurodegenerative diseases by regulating expression levels of the GRIN1 gene. However, when miR-212-5p, mR-324-3p, and miR-326 mimics were transferred into cells with pmirGLO-GRIN1 (−27 bp – +1284 bp), no significant down-regulation was observed in the present study. Gene expression may be regulated by a network composed of miRNA and its related regulatory factors, and their effects may be mutually enhanced or offset, leading to the overall phenomenon of “not participating in regulation”. This hypothesis was supported by the results presented here, in that although overexpression of has-miR-326 did not down-regulate the expression of pmirGLO-GRIN1 (−27 bp – +1284 bp), inhibition of has-miR-326 significantly enhanced expression of pmirGLO-GRIN1 (−27 bp – +1284 bp) in HEK-293 and U87 cell lines.
We can observe that, in SK-N-SH cells, the relative luciferase expression significantly increased after the sequence fragments located at +709 bp to +904 bp were truncated. However, it should be noted that the p-value in the protein expression comparison of fragments (−27 bp - +708 bp) versus (−27 bp –+ 904 bp) in U87 cells was 0.046, which was close to the threshold of statistical difference. Furthermore, we found that, compared with co-transfected with miR-491-5p mimics NC, the expression of exogenous GRIN1 3ʹUTR was significantly down-regulated when co-transfected with the miR-491-5p mimic. In addition, the miR-491-5p inhibitor restored the expression of pmirGLO-GRIN1 to miR-491-5p inhibitor NC levels in the U87 cell line. Overexpression or inhibition of miR-491-5p in HEK-293 cells also showed a similar trend to U87 cells, with higher overall expression level, indicating that miR-491-5p may regulate gene expression through the 3ʹUTR region of the GRIN1 gene. To the best of our knowledge, miR-491-5p mainly participates in tumor events by regulating intermediate genes;42–44 the current results suggest that miR-491-5p could participate in nervous system related events by regulating the GRIN1 gene. Kim et al18 preliminarily demonstrated that the GRIN1 gene 3ʹUTR is one of the targets of has-miR-1908-5p. The TargetScan database showed that GRIN1 mRNA has two candidate binding sites of has-miR-1908-5p located at +1033 bp – +1039 bp and +1062 bp – +1068 bp, corresponding to the range of +905 bp to +1091 bp in our study. However, current research shows that (−27 bp - +904 bp) and (−27 bp - +1091 bp) did not show differential expression in any of the three cell lines in our investigation. It is speculated that miR-1908-5p may have a differential cell type enrichment effect.
In U87 cells, besides the differentially expressed fragments shared with SK-N-SH and HEK-293 cell lines: (−27 bp – +294 bp) versus (−27 bp – +497 bp) and the differentially expressed fragments nominally shared with SK-N-SH cells (−27 bp – +497 bp) versus (−27 bp – +708 bp), the fragments (−27 bp – +1091 bp) and (−27 bp – +1284 bp) also showed statistically different expression patterns. Therefore, in order to provide a basic background for future studies, miRNAs that may bind to these sequences are also discussed, although our results show that only one cell line supports the notion that the miRNAs may bind to +1091 bp – +1284 bp. According to the TargetScan software, we screened out miRNAs that may act on this region, including miR-184 and miR-425-5p, which may bind to the GRIN1 gene 3ʹUTR +1147 bp to + 1153 bp and +1142 bp to + 1148 bp, respectively. These two miRNAs have been widely studied. It has been previously reported that miR-423-5p and miR‑184 are widely dysregulated in various human cancers, including glioblastoma,45,46 tongue squamous cell carcinoma,47 nasopharyngeal cancer,48 lung adenocarcinoma,49 and ovarian cancer,50 suggesting that these two miRNAs may play an important role in tumorigenesis. It is worth noting that miR-184 and miR-423-5p have also been reported to be involved in the process of central nervous system diseases. For example, a luciferase reporting study showed that miR-184 can target 3ʹUTR of NR4A2, which is known to be involved in cognitive function and long-term memory,51 suggesting its potential role in Alzheimer’s disease; has-miR-184 was found to be differentially expressed in the anterior cingulate cortex of patients with major depressive disorder52 and in patients with late-life depression.53 Another study demonstrated that miR-423-5p in cerebrospinal fluid can be selected as one of the members of Parkinson’s biomarker panel.54
In the current study, we truncated the 3ʹUTR of the GRIN1 gene, and initially confirmed the potential functional sequence of the 3ʹ regulatory region of the GRIN1 gene by means of the luciferase reporter assay. Although bioinformatics tools showed the presence of multiple miRNA binding sites in the +295 bp – + 497 bp region, including miR-212-5p, miR-324-3p and miR-326, further overexpression experiments did not directly demonstrate the regulatory effect of these miRNAs on GRIN1 gene expression. However, through TargetScan software and subsequent overexpression and inhibition verification, we found that miR-491-5p could bind to the 3ʹUTR of the GRIN1 gene (+799 bp – +805 bp, the next base of the stop codon is +1) and down-regulate gene expression in HEK-293, SK-N-SH, and U87 cell lines, implicating the potential role of miR-491-5p in central nervous system diseases. Future studies are required to further determine other miRNAs that regulate GRIN1 gene expression, and related factors involving the miRNA regulatory network.
Conclusions
miR-491-5p can down-regulate GRIN1 gene expression in HEK-293, SK-N-SH, and U87 cell lines, highlighting the potential role of miR-491-5p in the pathogenesis of central nervous system diseases, such as schizophrenia, Parkinson’s disease, and Alzheimer’s disease. Further studies are needed to identify other miRNAs that act on the GRIN1 gene and their actual roles in central nervous system-related diseases.
Acknowledgments
We would like to thank Professor Mei Ding for her guidance and review of the data analysis.
Disclosure
The authors declare that they have no conflicts of interest for this work.
References
1. Papouin T, Oliet SH. Organization, control and function of extrasynaptic NMDA receptors. Philos Trans R Soc Lond B Biol Sci. 2014;369:20130601. doi:10.1098/rstb.2013.0601
2. Fountoulakis KN. The possible involvement of NMDA glutamate receptor in the etiopathogenesis of bipolar disorder. Curr Pharm Des. 2012;18:1605–1608.
3. Symonds JD, Zuberi SM, Johnson MR. Advances in epilepsy gene discovery and implications for epilepsy diagnosis and treatment. Curr Opin Neurol. 2017;30:193–199.
4. Balu DT. The NMDA receptor and schizophrenia: from pathophysiology to treatment. Adv Pharmacol. 2016;76:351–382.
5. Kuhner D, Stahl M, Demircioglu DD, et al. From cells to muropeptide structures in 24 H: peptidoglycan mapping by UPLC-MS. Sci Rep. 2014;4:7494. doi:10.1038/srep07494
6. Vyklicky V, Korinek M, Smejkalova T, et al. Structure, function, and pharmacology of NMDA receptor channels. Physiol Res. 2014;63(Suppl 1):S191–203. doi:10.33549/physiolres.932678
7. Kalev-Zylinska ML, Symes W, Young D, et al. Knockdown and overexpression of NR1 modulates NMDA receptor function. Mol Cell Neurosci. 2009;41:383–396. doi:10.1016/j.mcn.2009.04.003
8. Ding J, Zhou HH, Ma QR, et al. Expression of NR1 and apoptosis levels in the hippocampal cells of mice treated with MK801. Mol Med Rep. 2017;16:8359–8364. doi:10.3892/mmr.2017.7674
9. Kristiansen LV, Huerta I, Beneyto M, et al. NMDA receptors and schizophrenia. Curr Opin Pharmacol. 2007;7:48–55. doi:10.1016/j.coph.2006.08.013
10. Park JK, Lee SJ, Kim TW. Treadmill exercise enhances NMDA receptor expression in schizophrenia mice. J Exerc Rehabil. 2014;10:15–21. doi:10.12965/jer.140088
11. Law AJ, Deakin JF. Asymmetrical reductions of hippocampal NMDAR1 glutamate receptor mRNA in the psychoses. Neuroreport. 2001;12:2971–2974. doi:10.1097/00001756-200109170-00043
12. Ibrahim HM, Hogg AJ, Healy DJ, et al. Ionotropic glutamate receptor binding and subunit mRNA expression in thalamic nuclei in schizophrenia. Am J Psychiatry. 2000;157:1811–1823. doi:10.1176/appi.ajp.157.11.1811
13. Mccullumsmith RE, Kristiansen LV, Beneyto M, et al. Decreased NR1, NR2a, and Sap102 transcript expression in the hippocampus in bipolar disorder. Brain Res. 2007;1127:108–118. doi:10.1016/j.brainres.2006.09.011
14. Mishizen-Eberz AJ, Rissman RA, Carter TL, et al. Biochemical and molecular studies of NMDA receptor subunits NR1/2a/2b in hippocampal subregions throughout progression of Alzheimer’s disease pathology. Neurobiol Dis. 2004;15:80–92. doi:10.1016/j.nbd.2003.09.016
15. Day GS, Pruss H, Benseler SM, et al. GRIN1 polymorphisms do not affect susceptibility or phenotype in NMDA receptor encephalitis. Neurol Neuroimmunol Neuroinflamm. 2015;2:e153. doi:10.1212/NXI.0000000000000153
16. Bartel DP. Micrornas: target recognition and regulatory functions. Cell. 2009;136:215–233. doi:10.1016/j.cell.2009.01.002
17. Shukla GC, Singh J, Barik S. Micrornas: processing, maturation, target recognition and regulatory functions. Mol Cell Pharmacol. 2011;3:83–92.
18. Kim Y, Zhang Y, Pang K, et al. Bipolar disorder associated microRNA, Mir-1908-5p, regulates the expression of genes functioning in neuronal glutamatergic synapses. Exp Neurobiol. 2016;25:296–306. doi:10.5607/en.2016.25.6.296
19. Rupaimoole R, Slack FJ. MicroRNA therapeutics: towards a new era for the management of cancer and other diseases. Nat Rev Drug Discov. 2017;16:203–222. doi:10.1038/nrd.2016.246
20. Wojciechowska A, Braniewska A, Kozar-Kaminska K. MicroRNA in cardiovascular biology and disease. Adv Clin Exp Med. 2017;26:865–874. doi:10.17219/acem/62915
21. Singh A, Sen D. MicroRNAs in Parkinson’s disease. Exp Brain Res. 2017;235:2359–2374. doi:10.1007/s00221-017-4989-1
22. Herrera-Espejo S, Santos-Zorrozua B, Alvarez-Gonzalez P, et al. A systematic review of microRNA expression as biomarker of late-onset Alzheimer’s disease. Mol Neurobiol. 2019;56:8376–8391. doi:10.1007/s12035-019-01676-9
23. Zheng H, Tang R, Yao Y, et al. Mir-219 protects against seizure in the kainic acid model of epilepsy. Mol Neurobiol. 2016;53:1–7. doi:10.1007/s12035-014-8981-5
24. Wang J, Xu W, Shao J, et al. Mir-219-5p targets camkiigamma to attenuate morphine tolerance in rats. Oncotarget. 2017;8:28203–28214. doi:10.18632/oncotarget.15997
25. Zhang L, Chen ZW, Yang SF, et al. MicroRNA-219 decreases hippocampal long-term potentiation inhibition and hippocampal neuronal cell apoptosis in type 2 diabetes mellitus mice by suppressing the NMDAR signaling pathway. CNS Neurosci Ther. 2019;25:69–77. doi:10.1111/cns.12981
26. Burgess N, Maguire EA, O’keefe J. The human hippocampus and spatial and episodic memory. Neuron. 2002;35:625–641.
27. Mohammed CP, Rhee H, Phee BK, et al. Mir-204 downregulates EPHB2 in aging mouse hippocampal neurons. Aging Cell. 2016;15:380–388. doi:10.1111/acel.12444
28. Huang Y, Liu X, Liao Y, et al. Role of mir-34c in the cognitive function of epileptic rats induced by pentylenetetrazol. Mol Med Rep. 2018;17:4173–4180.
29. Wu X, Ding M, Liu Y, et al. Hsa-Mir-3177-5p and hsa-mir-3178 inhibit 5-ht1a expression by binding the 3ʹ-UTR region in vitro. Front Mol Neurosci. 2019;12:13. doi:10.3389/fnmol.2019.00013
30. Geisse S, Henke M. Large-scale transient transfection of mammalian cells: a newly emerging attractive option for recombinant protein production. J Struct Funct Genomics. 2005;6:165–170. doi:10.1007/s10969-005-2826-4
31. Nettleship JE, Watson PJ, Rahman-Huq N, et al. Transient expression in hek 293 cells: an alternative to E. coli for the production of secreted and intracellular mammalian proteins. Methods Mol Biol. 2015;1258:209–222.
32. Gonzalez-Arenas A, De La Fuente-granada M, Camacho-Arroyo I, et al. Tibolone effects on human glioblastoma cell lines. Arch Med Res. 2019;50:187–196. doi:10.1016/j.arcmed.2019.08.001
33. Biedler JL, Helson L, Spengler BA. Morphology and growth, tumorigenicity, and cytogenetics of human neuroblastoma cells in continuous culture. Cancer Res. 1973;33:2643–2652.
34. Riffo-Campos AL, Riquelme I, Brebi-Mieville P. Tools for sequence-based miRNA target prediction: what to choose? Int J Mol Sci. 2016;17:1987. doi:10.3390/ijms17121987
35. Akhtar MM, Micolucci L, Islam MS, et al. A practical guide to miRNA target prediction. Methods Mol Biol. 2019;1970:1–13.
36. Liu R, Li F, Zhao W. Long noncoding RNA NEAT1 knockdown inhibits MPP(+)-induced apoptosis, inflammation and cytotoxicity in SK-N-SH cells by regulating miR-212-5p/RAB3IP axis. Neurosci Lett. 2020;731:135060. doi:10.1016/j.neulet.2020.135060
37. Sun S, Han X, Li X, et al. MicroRNA-212-5p prevents dopaminergic neuron death by inhibiting SIRT2 in MPTP-induced mouse model of Parkinson’s disease. Front Mol Neurosci. 2018;11:381. doi:10.3389/fnmol.2018.00381
38. Vallelunga A, Ragusa M, Di Mauro S, et al. Identification of circulating microRNAs for the differential diagnosis of Parkinson’s disease and multiple system atrophy. Front Cell Neurosci. 2014;8:156. doi:10.3389/fncel.2014.00156
39. Zhao XH, Wang YB, Yang J, et al. MicroRNA-326 suppresses INOS expression and promotes autophagy of dopaminergic neurons through the JNK signaling by targeting XBP1 in a mouse model of Parkinson’s disease. J Cell Biochem. 2019;120:14995–15006. doi:10.1002/jcb.28761
40. Zhang Y, Xu W, Nan S, et al. MicroRNA-326 inhibits apoptosis and promotes proliferation of dopaminergic neurons in Parkinson’s disease through suppression of KLK7-mediated MAPK signaling pathway. J Mol Neurosci. 2019;69:197–214. doi:10.1007/s12031-019-01349-1
41. He B, Chen W, Zeng J, et al. MicroRNA-326 decreases tau phosphorylation and neuron apoptosis through inhibition of the JNK signaling pathway by targeting VAV1 in Alzheimer’s disease. J Cell Physiol. 2020;235:480–493. doi:10.1002/jcp.28988
42. Lu L, Cai M, Peng M, et al. Mir-491-5p functions as a tumor suppressor by targeting IGF2 in colorectal cancer. Cancer Manag Res. 2019;11:1805–1816. doi:10.2147/CMAR.S183085
43. Yu T, Wang LN, Li W, et al. Downregulation of miR-491-5p promotes gastric cancer metastasis by regulating snail and FGFR4. Cancer Sci. 2018;109:1393–1403.
44. Xu Y, Hou R, Lu Q, et al. Mir-491-5p negatively regulates cell proliferation and motility by targeting PDGFRA in prostate cancer. Am J Cancer Res. 2017;7:2545–2553.
45. Feng L, Ma J, Ji H, et al. Mir-184 retarded the proliferation, invasiveness and migration of glioblastoma cells by repressing stanniocalcin-2. Pathol Oncol Res. 2018;24:853–860. doi:10.1007/s12253-017-0298-z
46. Zhao P, Sun S, Zhai Y, et al. Mir-423-5p inhibits the proliferation and metastasis of glioblastoma cells by targeting phospholipase C beta 1. Int J Clin Exp Pathol. 2019;12:2941–2950.
47. Chen D, Li J, Li S, et al. Mir-184 promotes cell proliferation in tongue squamous cell carcinoma by targeting SOX7. Oncol Lett. 2018;16:2221–2228.
48. Zhu HM, Jiang XS, Li HZ, et al. Mir-184 inhibits tumor invasion, migration and metastasis in nasopharyngeal carcinoma by targeting notch2. Cell Physiol Biochem. 2018;49:1564–1576. doi:10.1159/000493459
49. Sun G, Ding X, Bi N, et al. Mir-423-5p in brain metastasis: potential role in diagnostics and molecular biology. Cell Death Dis. 2018;9:936. doi:10.1038/s41419-018-0955-5
50. Tang X, Zeng X, Huang Y, et al. Mir-423-5p serves as a diagnostic indicator and inhibits the proliferation and invasion of ovarian cancer. Exp Ther Med. 2018;15:4723–4730.
51. Annese A, Manzari C, Lionetti C, et al. Whole transcriptome profiling of late-onset Alzheimer’s disease patients provides insights into the molecular changes involved in the disease. Sci Rep. 2018;8:4282. doi:10.1038/s41598-018-22701-2
52. Azevedo JA, Carter BS, Meng F, et al. The microRNA network is altered in anterior cingulate cortex of patients with unipolar and bipolar depression. J Psychiatr Res. 2016;82:58–67. doi:10.1016/j.jpsychires.2016.07.012
53. Mendes-Silva AP, Fujimura PT, Silva J, et al. Brain-enriched microRNA-184 is downregulated in older adults with major depressive disorder: a translational study. J Psychiatr Res. 2019;111:110–120. doi:10.1016/j.jpsychires.2019.01.019
54. Dos Santos MCT, Barreto-Sanz MA, Correia BRS, et al. Mirna-based signatures in cerebrospinal fluid as potential diagnostic tools for early stage Parkinson’s disease. Oncotarget. 2018;9:17455–17465. doi:10.18632/oncotarget.24736
 © 2020 The Author(s). This work is published and licensed by Dove Medical Press Limited. The full terms of this license are available at https://www.dovepress.com/terms.php and incorporate the Creative Commons Attribution - Non Commercial (unported, v3.0) License.
By accessing the work you hereby accept the Terms. Non-commercial uses of the work are permitted without any further permission from Dove Medical Press Limited, provided the work is properly attributed. For permission for commercial use of this work, please see paragraphs 4.2 and 5 of our Terms.
© 2020 The Author(s). This work is published and licensed by Dove Medical Press Limited. The full terms of this license are available at https://www.dovepress.com/terms.php and incorporate the Creative Commons Attribution - Non Commercial (unported, v3.0) License.
By accessing the work you hereby accept the Terms. Non-commercial uses of the work are permitted without any further permission from Dove Medical Press Limited, provided the work is properly attributed. For permission for commercial use of this work, please see paragraphs 4.2 and 5 of our Terms.