")
Back to Journals » OncoTargets and Therapy » Volume 14
FSTL3 is a Prognostic Biomarker in Gastric Cancer and is Correlated with M2 Macrophage Infiltration
Authors Liu YJ , Li JP, Zhang Y, Nie MJ, Zhang YH, Liu SL, Zou X
Received 9 April 2021
Accepted for publication 22 June 2021
Published 6 July 2021 Volume 2021:14 Pages 4099—4117
DOI https://doi.org/10.2147/OTT.S314561
Checked for plagiarism Yes
Review by Single anonymous peer review
Peer reviewer comments 4
Editor who approved publication: Dr Sanjeev K. Srivastava
Yuan-Jie Liu,1,2 Jie-Pin Li,1– 3 Ying Zhang,1,2 Meng-Jun Nie,1,2 Yong-Hua Zhang,3 Shen-Lin Liu,1,2 Xi Zou1
1Affiliated Hospital of Nanjing University of Chinese Medicine, Jiangsu Province Hospital of Chinese Medicine, Nanjing, Jiangsu, 210029, People’s Republic of China; 2No. 1 Clinical Medical College, Nanjing University of Chinese Medicine, Nanjing, Jiangsu, 210023, People’s Republic of China; 3Department of Oncology, Zhangjiagang TCM Hospital Affiliated to Nanjing University of Chinese Medicine, Zhangjiagang, Jiangsu, 215600, People’s Republic of China
Correspondence: Shen-Lin Liu; Xi Zou Email [email protected]; [email protected]
Purpose: Follistatin-related gene 3 (FSTL3), an established oncogene, can modulate target gene expression via members of the transforming growth factor β (TGF-β) superfamily. The present study was conducted to evaluate the expression of FSTL3 in gastric cancer (GC) and to determine its prognostic significance. We also evaluated the possible mechanisms involved in the oncogenic role of FSTL3 in gastric carcinogenesis and development.
Methods: We obtained data from the Human Protein Atlas, MethSurv, cBioPortal, UALCAN, TIMER, GEPIA, STRING, GeneMANIA, ONCOMINE, and MEXPRESS databases and examined it using R software. RNAi was used to establish stable FSTL3-knockdown (shFSTL3) and overexpression (OE) cell strains. Western blot; enzyme-linked immunosorbent (ELISA); and immunohistochemical (ICH), immunofluorescence, and phalloidin staining were used for examining protein expression. Cell invasion and migration were determined using transwell and scratch-wound assays. After tumor-associated macrophage (TAM) generation, co-culturing of cancer cells with TAMs was performed to confirm the relationship between FSTL3 and TAMs.
Results: In GC patients, FSTL3 mRNA and protein levels were upregulated. FSTL3 expression was significantly linked to cancer stage as well as to pathological tumor grade in GC. Moreover, a high expression of FSTL3 was associated with a dismal survival duration in patients with GC. Furthermore, functional enrichment analysis demonstrated that FSTL3 overexpression could activate epithelial–mesenchymal transition (EMT) by promoting F-actin expression and BMP/SMAD signaling. Finally, immunofluorescence staining confirmed that the overexpression of FSTL3 promoted the proliferation of M2 TAMs.
Conclusion: Taken together, our findings suggest that FSTL3 may be involved in GC progression via the promotion of BMP/SMAD signaling-mediated EMT and M2 macrophage activation.
Keywords: FSTL3, biomarker, gastric cancer, EMT, M2 macrophages
Introduction
Gastric cancer (GC) is the second most common cause of cancer-related death worldwide, and its morbidity and mortality are very high, posing a serious threat to human health.1–6 Most patients with early GC have no obvious symptoms, and a few have non-specific upper gastrointestinal symptoms similar to those of gastric ulcers. According to the National Comprehensive Cancer Network (NCCN) guidelines released in 2021,7 the current primary treatment option for GC is surgery, and chemotherapy, radiotherapy, targeted therapy, and immunotherapy can be administered depending on the surgical stage. Owing to the development of biomedical detection technology and improved understanding of the immune microenvironment of GC, the latest NCCN guidelines place a greater emphasis on precision therapy-based testing, and specifically, testing for prognostic biomarkers, drug targets, and immune-related genes. Unfortunately, many GC tumor biomarkers lack sensitivity and specificity. Therefore, novel biomarkers are needed to diagnose GC more effectively and predict tumor recurrence.
The FSTL3 gene is the target of a novel chromosomal rearrangement discovered by Hayette et al in 1998 in B cells of patients with chronic lymphocytic leukemia.8 In recent years, studies have found that FSTL3 regulates multiple biological processes, including cell differentiation, aging, obesity development, arteriosclerosis development, and tumor progression.8–10 Several studies have confirmed that FSTL3 is an oncogene and may be closely associated with tumor cell proliferation and metastasis. One study found that FSTL3 promotes the proliferation of tumor cells by counteracting the action of activin in breast cancer and is thus a promising therapeutic target for this disease.11 FSTL3 has also been found to be a novel oncogene in non-small-cell lung cancer, where it is regulated by DSCAM-AS1 and miR-122-5p.12
Although there has been a small amount of research on FSTL3, the exact mechanism by which FSTL3 functions as an oncogene remains unclear to date. Therefore, in the present study, we aimed to explore the molecular mechanism of FSTL3 involvement in gastric carcinogenesis and development, and to evaluate its value as a prognostic biomarker and potential therapeutic target for GC.
Materials and Methods
Cell Culture
AGS (moderately differentiated GC cells), HGC-27 (undifferentiated GC cells), GES-1 (healthy gastric epithelial cells), and THP-1 cells (human monocytic cells) were purchased from the cell bank of the Chinese Academy of Sciences (Shanghai, China). MKN-74 and MKN-45 cells (well-differentiated and poorly differentiated GC cells, respectively) were purchased from the Japanese Collection of Research Bioresources Cell Bank. GC cells were cultured in RPMI-1640 medium (Gibco, USA, Lot: 8121248) supplemented with 10% fetal bovine serum (FBS) (Gibco, USA, Lot: 42F1376K) in an incubator at 37°C in 5% CO2. GES-1 cells were cultured in DMEM (Gibco, USA, Lot: 8121032) with 10% FBS at 37°C in 5% CO2.
Lentiviral Vector Construction and Transfection for FSTL3 Overexpression and Knockdown by shRNA Interference
Lentiviral vectors were used for the overexpression and knockdown of FSTL3. Viruses were designed, synthesized, and produced by GeneChem Corporation (Shanghai, China, Lot: 136427D). Transfection was performed as per supplier protocol. HGC-27 cells were transduced for 24 hours with the recombinant lentivirus in the presence of 2 μg/mL polybrene (GeneChem, China. Lot: 134146B). After transduction, the cells were cultured for 72 hours. Stable transfected cell lines expressing GFP were screened for using 1.5 μg/mL puromycin (Beyotime Biotechnology, China. Lot:041321210517). The overexpression and knockdown of FSTL3, as well as the transduction efficiency of the FSTL3 (shFSTL3) constructs, were subsequently confirmed using Western blot.
Western Blot Assessment
Western blotting was performed as described previously.13 The specific primary anti-FSTL3 (Invitrogen, USA. Lot: SI2436032) and anti-β-actin antibodies (Invitrogen, USA. Lot: RI2265993); the E-cadherin, N-cadherin, MMP2, MMP9, and SMAD2/3 Antibody Sampler Kits; and the SMAD 1/5/9 Antibody Sampler Kit (Cell Signaling Technology, USA. Lot: 2, 12, 7, 9, 14, 2) were used. Anti-Vimentin, anti-TGF-β1 (Proteintech, China. Lot: 00017056, 00021336), and anti-BMP1 (Abcam, UK. Lot: GR232094-5) antibodies were also used. The primary (1:1000) and secondary antibodies purchased from Zhongshan Golden Bridge Biotechnology (Beijing, China. Lot: 205001014, 203700821, 20500927) (1:5000) were added for the binding reaction. Exposure was detected in a gel image processing system (ChemiDoc XRS+) to analyze the target/β-actin bands, and the relative amounts of protein were calculated.
Enzyme Linked Immunosorbent Assay (ELISA)
Considering that FSTL3 is a secreted protein, we used the FSTL3 ELISA kit (Jymbio, Colorful Gene Biological Technology, China. Lot: GR2021-03) to detect its protein content in the cell supernatant. Supernatant from the culture was collected into sterile tubes. After centrifugation for 20 minutes at 2000 rpm, the supernatant was carefully collected. ELISA was performed according to the manufacturer’s instructions (Supplementary Document 1) and the optical density of each well was examined immediately using a microplate reader (Bio-tek synergy HT) at 450 nm.
Immunohistochemical Staining
Ten patients with GC were enrolled from the Jiangsu Provincial Hospital of Traditional Chinese Medicine. None of the patients had received any treatment, including chemotherapy, radiotherapy, and antitumor treatment with biological products, before surgery. Tumor staging and grading for each patient were performed using the American Joint Committee on Cancer (AJCC) TNM staging system.14 The study protocol was approved by the ethics committee of the Jiangsu Province Hospital of Chinese Medicine, and clinicians and patients provided informed consent for the use of the tissue for research (2019NL-166-02). Immunohistochemical (IHC) staining was performed as previously described.15 After blocking tissue sections with protein blocking solution, slides were incubated with anti-FSTL3 antibody (Invitrogen, USA Lot: SI2436032). IHC results (intensity and extent of staining) were independently scored by two observers. Staining intensity was graded as follows: 0, negative staining; 1, weak staining; 2, moderate staining; and 3, strong staining. The extent of staining was scored based on the proportion of positively stained cells per specimen, as follows: 0, no positively stained cells; 1 <10% positively stained cells; 2, 10–50% positively stained cells; and 3, >50% positively stained cells. The histochemistry score (H-SCORE), which represents the proportion of positively stained cells and the intensity of expression, was calculated as follows: H-SCORE= ∑(PI × I) = (percentage of cells with weak intensity × 1) + (percentage of cells with moderate intensity × 2) + (percentage of cells with strong intensity × 3). In the formula, PI represents the percentage of positive cells to the total number of cells in a particular field and I represents the intensity of staining. The H-SCORE ranges from 0 to 300, with a higher score representing stronger positive staining.
Establishment of a Co-Culture System
To induce macrophage differentiation, THP-1 cells (1 × 10⁵ cells/mL) were cultured in 6-well plates and treated with phorbol 12-myristate 13-acetate (PMA) (Sigma-Aldrich, USA. Lot: SLBX8899) (20 ng/mL) for 24 hours.16,17 The PMA-containing medium was replaced with serum-free medium and the cells were cultured for another day. Two days prior to the co-culture experiment, cells (1 × 10⁵ cells/mL) from the control group, knock-down group, overexpression (OE) group, and negative control (NC) group were seeded onto 0.4-μM transwell inserts. For co-culture, the culture medium in the inserts with GC cells was removed and transferred to the top of the 6-well plates with differentiated THP-1 cells. The cells were co-cultured for an additional 48 hours, and cells were harvested for immunofluorescence staining.
Transwell Invasion Experiment
Invasion assays were carried out using a Transwell invasion (pre-glue) chamber as previously described.18 The membrane in the chamber was cut and photographed under a microscope (Olympus CKX41), and cells were counted using Image J software.
Scratch-Wound Assay
Scratch-wound assay was performed as previously described.19 Photographs were taken under a microscope (Olympus CKX41) at 0 h, 12 h, and 24 h after scribing.
Immunofluorescence Staining
Immunofluorescence staining was performed as previously described.20 Briefly, the cells cultured on cover slips were fixed, permeabilized with 0.5% Triton X-100, and incubated with anti-CD163 and anti-CD206 polyclonal antibodies (Proteintech, China. Lot: 00091171 and 00089604, respectively) (1:500) overnight at 4°C. Subsequently, the slides were incubated with secondary antibodies conjugated with Alexa Fluor 488 AffiniPure goat anti-mouse IgG (H+L) (FcMACS, China. Lot: 136908), goat anti-mouse IgG (H+L) CoraLite594 (Proteintech, China. Lot: 20000154), and goat anti-rabbit IgG (H+L) R-PE conjugate (Proteintech, China. Lot: 20000129) (1:1000). Nuclei were stained using 4ʹ,6-diamidino-2-phenylindole (DAPI) for 3 min, and the cells were incubated in the dark for 3 min. The slides were washed with PBS four times, for 5 min each. Then, the slides were sealed with sealing solution containing a fluorescence quencher and observed and imaged under a fluorescence microscope. Immunofluorescence was examined under an epi-fluorescence microscope (Olympus, BX60-32FB2-A03). By changing the filters, the different secondary antibodies could be identified in double-stained sections. Images were captured with a digital camera (Olympus, DP50).
Phalloidin Staining
F-actin is the main component of microfilaments and is capable of binding with phalloidin. Therefore, Alexa Fluor™ 594-phalloidin (Invitrogen, Lot: 1275737) can be used to stain cellular microfilaments. Phalloidin staining was performed as previously described.21
Expression Analysis
The expression level of the FSTL3 gene in various types of cancers was identified in the Oncomine database.22 The query terms employed in the present study were: i) gene: FSTL3 and ii) analysis type: GC vs normal tissue. P < 0.05 indicated statistical significance; the fold change was set to 1.5 and the gene rank to 5%. We employed an unpaired t-test to compare two groups. We then employed TIMER database23 to assess differences in FSTL3 expression levels in GC. On the UALCAN analysis24 page, expression data for FSTL3 was obtained using UALCAN and the “STAD” dataset. Student’s t test was used to generate a P value. The P value cutoff was 0.05. Moreover, the correlations between FSTL3 expression and Bone Morphogenetic Protein (BMP) signals as well as lymphocyte markers were analyzed using GEPIA.25 The Spearman approach was employed to establish the correlation coefficient, and partial results were visualized with the “corrplot” package.
Survival Curve Analysis
We first employed GEPIA and Kaplan–Meier plotter web-based data resource26 to develop survival curves for Overall survival (OS), disease-free survival (DFS), and post-progression survival (PPS) in GC based on FSTL3 expression. Then we used TCGA-STAD to further conduct survival analysis for disease-free interval (DFI), disease specific survival (DSS), and progression-free interval (PFI). Log rank test was conducted and P < 0.05 signified statistical significance.
Immune Cell Infiltration Analysis
To make reliable immune infiltration estimations, we utilized the CIBERSORT algorithm.27 All the results from the above analysis methods and R package were obtained using the ‘ggplot2ʹ and “pheatmap” packages. In addition, the immune module of the TIMER database, which is a useful online tool for the comprehensive evaluation of tumor-invading immune cells,28 was used to further calculate the correlation coefficients between FSTL3 and the abundance of macrophage infiltration.
Enrichment Analysis
We imported the FSTL3 gene into the STRING and GeneMANIA databases to obtain its associated genes29,30 and then imported the FSTL3 gene and FSTL3-associated genes into the Metascape database to conduct enrichment analysis.31 The following gene ontology modules were analyzed: Biological Process, Molecular Function, and Cellular Component. Further, Kyoto Encyclopedia of Genes and Genomes (KEGG) pathway analysis was also performed.
Gene set enrichment analysis (GSEA) is extensively employed to establish whether predefined gene sets are differentially expressed across different tissues.32 In the present study, P < 0.05 signified remarkably enriched gene sets. The TCGA-STAD dataset33 (n = 408) was assessed using GSEA. Herein, the GSEA evaluation generated an ordered list of all the genes based on their relationship with the expression of FSTL3, and then generated a predefined gene set (biosignature of gene expression observed upon the perturbation of a certain cancer-linked gene). Enrichment scores, which are a measure of the statistical evidence supporting the rejection of the null hypothesis (ie, that all members are distributed randomly in the ordered list), were obtained. FSTL3 levels were employed as the phenotype label, and the “Metric for ranking genes” was set to Pearson correlation. All other basic and advanced fields were set to default. The Hallmark, microRNA targets, GO, and KEGG gene data resources (c2. KEGG.v4.0) from the Molecular Signatures Database–MsigDB (http://www.broad. mit.edu/gsea/msigdb/index.jsp) were utilized for enrichment analysis.
DNA Methylation and Genetic Alteration Analysis
Waterfall plots of the methylation levels of the FSTL3 gene were generated using the MethSurv tool,34 and the prognostic significance of all the methylation sites of FSTL3 was analyzed and visualized using Kaplan–Meier plots. The relationship of DNA methylation with the gene expression of FSTL3 was determined using Pearson’s tests. Correlation coefficients (R) as well as Benjamini-Hochberg-adjusted P-values for different methylation probes were determined.
The alteration frequency of the FSTL3 gene in several studies of GC was analyzed via the cBioPortal database. In addition, we conducted TIMER to analyze the differential expression of the FSTL3 gene between wild and mutant type.
Statistical Analysis
Continuous data are reported as means ± SD. Comparisons between two groups were analyzed by performed using t-tests, and comparisons among multiple groups were performed using one-way ANOVA. Data analyses were performed using SPSS 26.0 (SPSS Inc., USA) and data were presented with GraphPad Prism 8.0 (GraphPad Software, Inc., USA). All experiments were carried out at least three times. **P<0.01 and *P<0.05 were defined as statistically significant.
Results
Expression Levels of FSTL3 in GC
In order to assess the distinct prognostic and prospective therapeutic significance of different FSTL3 in GC patients, as indicated in Figure 1A, the expressions of FSTL3 in 20 types of cancers was first determined and then compared with that in healthy tissues using the ONCOMINE web resource (www.oncomine. org). FSTL3 expression was elevated in GC. Furthermore, the expression level of FSTL3 in diverse types of tumors was assessed using TIMER (http://timer.cistrome.org/) and TCGA (*P < 0.05, **P < 0.01, ***P < 0.001). As shown in Figure 1B, FSTL3 was highly expressed in GC. Receiver operating characteristic (ROC) curves based on GSE118919 (n=32) were employed to detect the prediction accuracy of FSTL3 in distinguishing GC from healthy tissue. The area under the curve (AUC) for FSTL3 was found to be 0.8335 (Figure 1C). Then, we assessed the expression of FSTL3 in healthy gastric epithelial cells and GC cells at different degrees of differentiation using Western blotting as well as ELISA. The ELISA results showed FSTL3 was highly expressed in the supernatant of GC cells at different degrees of differentiation (Figure 1D; **P < 0.01, *P < 0.05; ANOVA). Western blotting (Figure 1E and F) indicated that the levels of FSTL3 in HGC-27 and MKN-45 cells were significantly different from those in GES-1 cells (**P < 0.01, ANOVA). Further, the expression levels in AGS cells were also significantly different from those in GES-1 cells (*P < 0.05, ANOVA). However, there was no difference in FSTL3 expression between MKN-74 and GES-1 cells (P > 0.05, ANOVA).
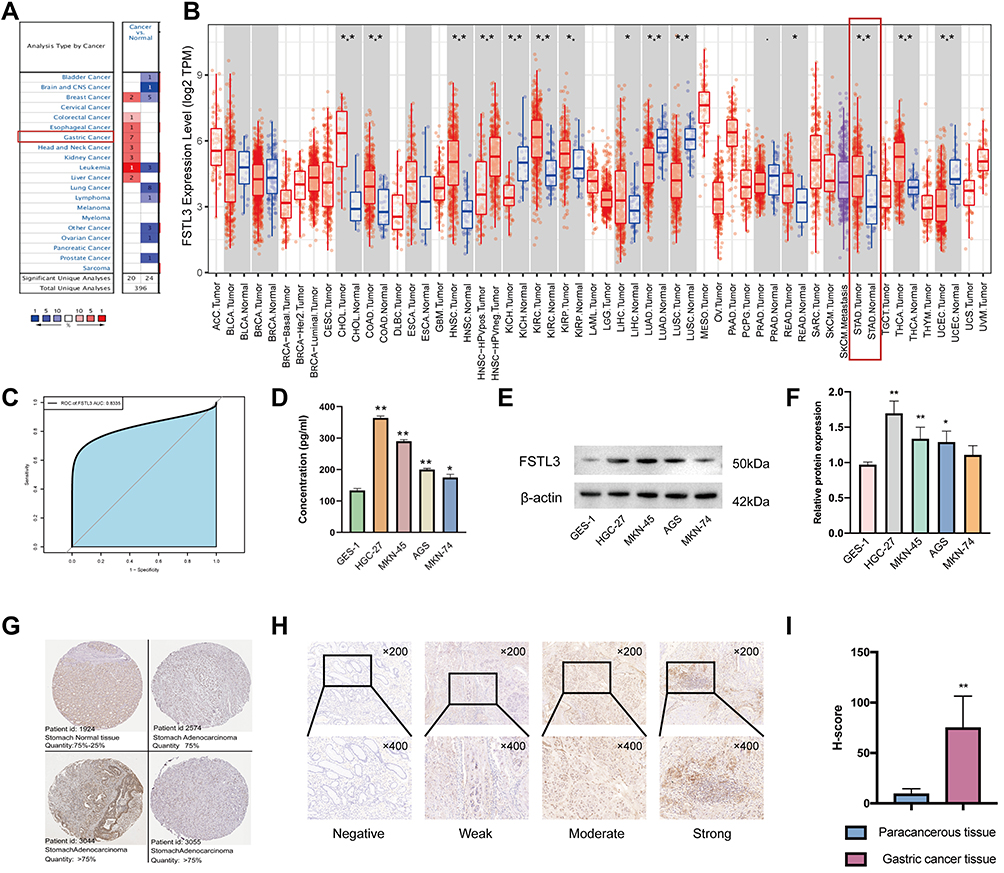 |
Figure 1 Expression levels of FSTL3 in gastric cancer (GC). (A-B) Differences in FSTL3 expression between different types of human cancers (*P < 0.05, **P < 0.01, ***P < 0.01). (C) Receiver operating characteristic (ROC) curves and area under the curve (AUC) values for the utility of FSTL3 expression in distinguishing GC from healthy tissue (n = 32). (D-F) Differential expression of FSTL3 in normal gastric epithelial cells and GC cells (*P < 0.05, **P < 0.01). (G) Representative immunohistochemistry images of FSTL3 staining in GC tissues and normal gastric tissues (Human Protein Atlas). (H) Representative images of different immunohistochemical staining intensities for FSTL3. (I) Statistical comparison of FSTL3 expression levels (H‑SCORE) in paracancerous and GC tissue (n=10) (**P < 0.01). |
Next, we detected the expression level of the FSTL3 protein in GC using the human protein atlas database. The results showed that the FSTL3 protein was expressed at a moderate level in healthy gastric tissue, while it was expressed at high levels in gastric adenocarcinoma (Figure 1G). To further investigate the expression of FSTL3 in carcinoma and paracarcinoma tissue in GC patients, IHC staining of 10 GC tumor tissue samples and paired paracarcinoma tissue was performed. The different intensities of IHC staining are shown in Figure 1H. The mean H-SCORE for FSTL3 expression in GC cancer tissue was 74.9, while that for paracarcinoma tissue was 9.34. Hence, FSTL3 levels in tumor tissues were significantly higher than those in paracarcinoma tissue (P < 0.01; Figure 1I). Overall, the results suggested that FSTL3 is overexpressed in GC.
Relationship Between FSTL3 mRNA Expression Levels and Clinicopathological Parameters in Patients with GC
Since we observed that FSTL3 mRNA and protein levels were upregulated in GC, we studied the relationship between FSTL3 mRNA expression and the clinicopathological features of GC patients, including lymph node metastasis, tumor grade, age, sex, race, and individual cancer stages. As shown in Figures 2A–F, the mRNA expression of FSTL3 was positively correlated with tumor grade. The highest FSTL3 mRNA levels were observed for grade 3 tumors. FSTL3 mRNA levels in stage 3 tumors appeared to be higher than those in stage 4 tumors, likely because of the small sample size. To evaluate the association of FSTL3 expression levels with survival rate in GC patients, we employed the Kaplan–Meier plotter and GEPIA database. As indicated in Figure 2G and H, we observed lower rates of OS (Log rank test, P = 0.047) and DFS (Log rank test, P = 0.025) in the high FSTL3 expression group than in the low FSTL3 expression group. Kaplan–Meier survival curves indicated that the OS (Log rank test, P = 1.4e-14) and PPS (Log rank test, P < 1e-16) of patients with low FSTL3 expression was remarkably higher than that of those with high expression levels (Figure 2I and J).
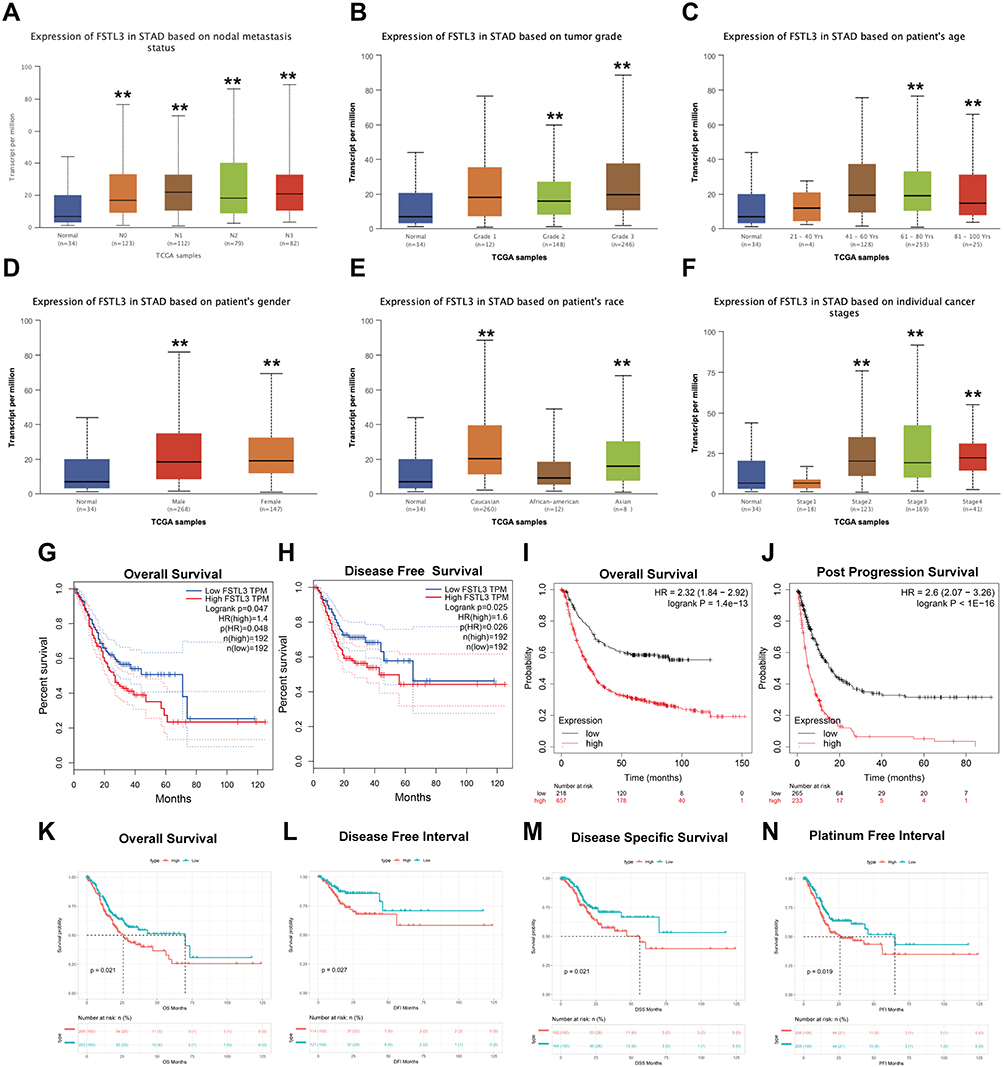 |
Figure 2 Association of FSTL3 mRNA expression with tumor grades, cancer stages and prognosis in gastric cancer (GC) patients. (A-F) Association of FSTL3 mRNA expression with nodal metastasis status, tumor grade, patient’s age, patient’s sex, patient’s race, and individual cancer stages in GC patients (**P < 0.01); (G) Overall survival (OS) from the GEPIA database (n=384). (H) Disease-free survival (DFS) from the GEPIA database (n=384). (I) OS from the Kaplan–Meier plotter database (n=881). (J) Post-progression survival (PPS) from the Kaplan–Meier plotter database (n=503). (K–N) OS, disease-free interval (DFI), disease-specific survival (DSS), and platinum-free interval (PFI) based on TCGA-STAD data (n=443). |
In addition, we also analyzed TCGA-STAD data ourselves. As shown in Figure 2K–N, low OS (Log rank test, P = 0.021), DFI (Log rank test, P = 0.027), DSS (Log rank test, P = 0.021), and PFI (Log rank test, P = 0.019) were associated with high FSTL3 expression levels in GC patients. Univariate and multivariate Cox regression analysis suggested that FSTL3 can be an independent prognostic factor for the PFI in GC patients (P < 0.05) (Supplementary Document 2). Thus, FSTL3 may be involved in GC progression.
FSTL3 Genetic Alterations in Patients with GC
Next, we investigated the frequency of alterations in three groups of GC cases via the cBioPortal web resource. Overall, 1213 samples from TCGA GC database were studied (Figure 3A), and the mutation rate was found to be low (0–1%) in TCGA pub, TCGA, and TCGA pancan 2018. The type as well as the location of distinct mutations are indicated in Figure 3D. Missense mutations (n=6) were found to be the most frequent. Kaplan–Meier plotter results as well as the Log rank test showed a considerable difference in OS (Figure 3C, P = 0.002387) between FSTL3 wild and mutant type. However, there was no significant difference in the level of FSTL3 expression between individuals with the wild type and mutant type of the gene (Figure 3B, P = 0.63). These data demonstrated that the mutations in FSTL3 may not be of clinical value.
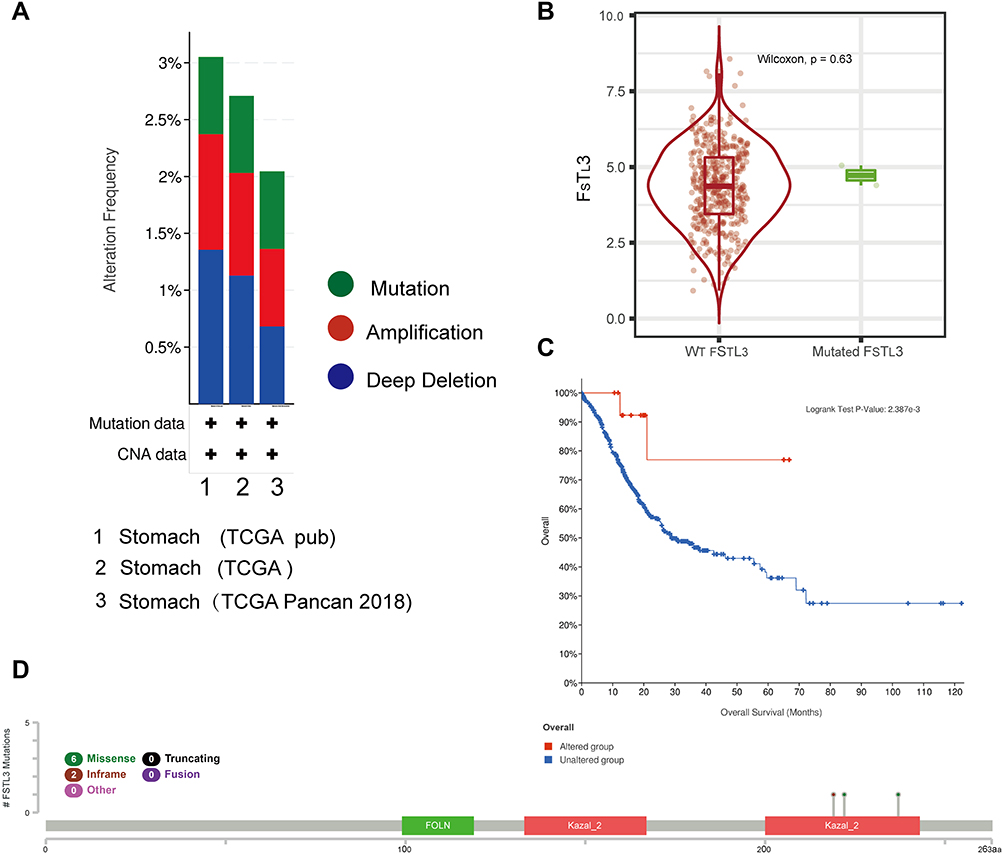 |
Figure 3 Genetic alterations in FSTL3 and their association with overall survival (OS) in gastric cancer (GC) patients (cBioPortal, n=1213). (A) Frequencies of FSTL3 mutations and copy number alterations (CNA) in the three datasets. (B) Expression of FSTL3 wild type and mutant genes. (C) Kaplan–Meier plots comparing Overall survival (OS) in individuals with and without FSTL3 gene alterations. (D) Mutation site profile of the FSTL3 gene. |
Analysis of FSTL3 DNA Methylation in GC
Considering that FSTL3 mutation and copy number variation had no obvious significance in GC, we investigated whether FSTL3 expression was associated with FSTL3 DNA methylation. Based on methylation data from TCGA-STAD, we established that the methylation values obtained from the four methylation probes cg22305455, cg15195495, cg15488009, and cg23260026 were positively related with FSTL3 expression levels. Further, we found that values obtained from the methylation probes cg17710576 and cg26459430 were negatively linked with FSTL3 expression levels (Figure 4A, P < 0.05). After including all methylation probe sites in the survival analysis (Figure 4B–N), we found that results were only statistically significant for a few (Figure 4E and F). Hypermethylation observed using the methylation probes cg15195495 and cg15488009 indicated a poor survival (P < 0.05).
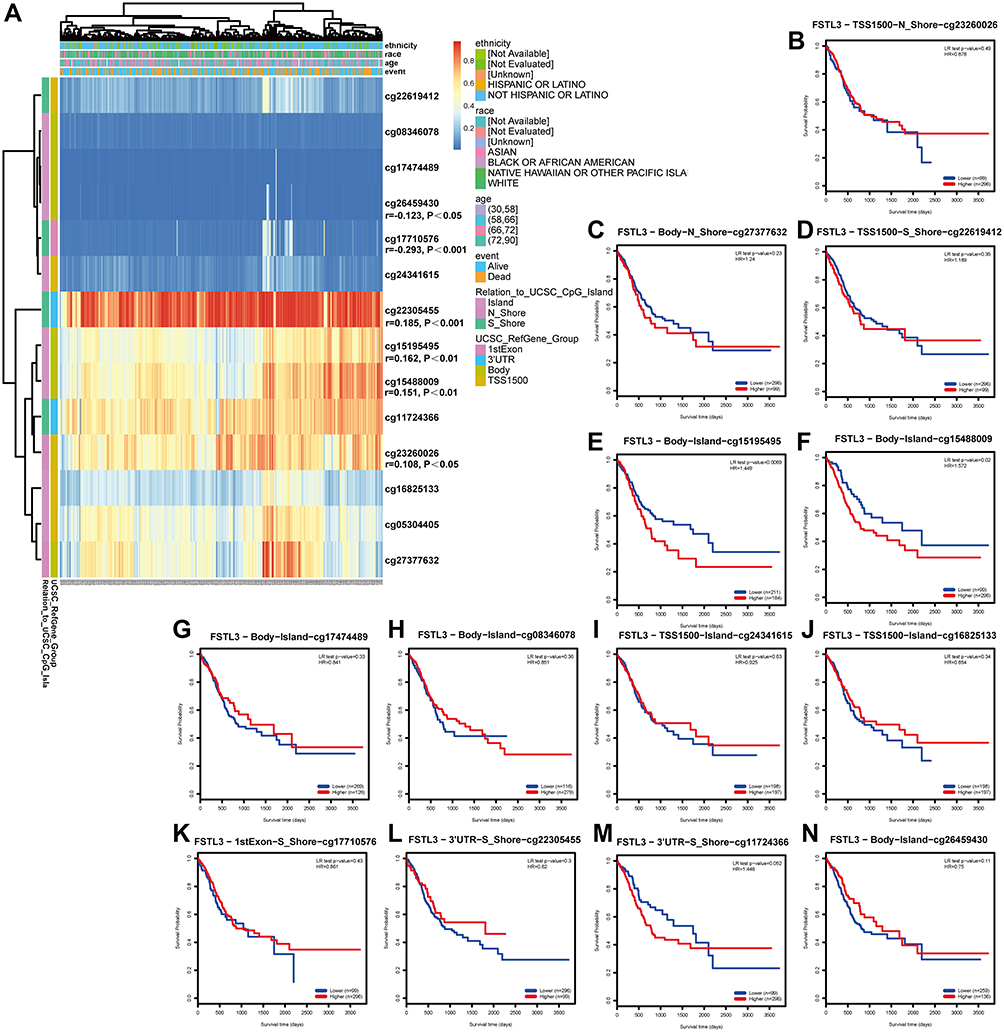 |
Figure 4 Waterfall plots and analysis using potential methylation probes targeting the FSTL3 gene (n=395). (A) Waterfall plot of the methylation levels in the FSTL3 gene. The correlations between FSTL3 methylation or expression levels and the survival rate were also analyzed. (B–N) Survival analysis based on all methylation probes; P < 0.05 was considered statistically significant. |
Functional Enrichment Analysis of FSTL3
A few genes related to FSTL3 were searched for using the STRING database (Figure 5A). Next, GO and KEGG analysis were used to predict the function of FSTL3 and its related genes. FSTL3 and its related genes showed enrichment for terms such as “transmembrane receptor protein serine/threonine kin”, “TGF-beta signaling pathway”, “regulation of pathway-restricted SMAD protein phosphorylation”, “gastrulation”, “activin receptor complex”, “regulation of growth factor binding”, “integrin binding”, “transmembrane receptor protein tyrosine kinase signal”, “growth factor activity”, “bone development”, “ameboidal-type cell migration” (Figure 5B). A GeneMANIA-based functional network of the interaction among the neighboring genes of FSTL3 in GC yielded physical interactions, co-expression patterns, predicted co-localization, common pathways, genetic interactions, and shared protein domains (Figure 5C). The enrichment analysis of these genes showed that FSTL3 may be involved in “extracellular matrix organization”, “regulation of transmembrane receptor protein serine”, “activin receptor signaling pathway”, “epithelial cell proliferation”, “ameboidal-type cell migration” (Figure 5D).We then sorted the genes based on P-values to select the top 30 entries from both enrichment analyses, and the intersection was as follows: “SMAD protein signal transduction”, “regulation of transmembrane receptor protein serine/threonine kinase signaling pathway”, and “BMP signaling pathway” (Figure 6A). This suggested that FSTL3 is most likely involved in the BMP/SMAD signaling pathway. The putative mechanism underlying the BMP/SMAD signaling pathway is shown in Figure 6B. Further, the expression of FSTL3 was positively correlated with that of TGFβ1, TGFβ2, TGFβ3, BMP1, BMP6, SMAD2, SMAD3, SMAD1, SMAD5, and SMAD8 (Figure 6C and D).
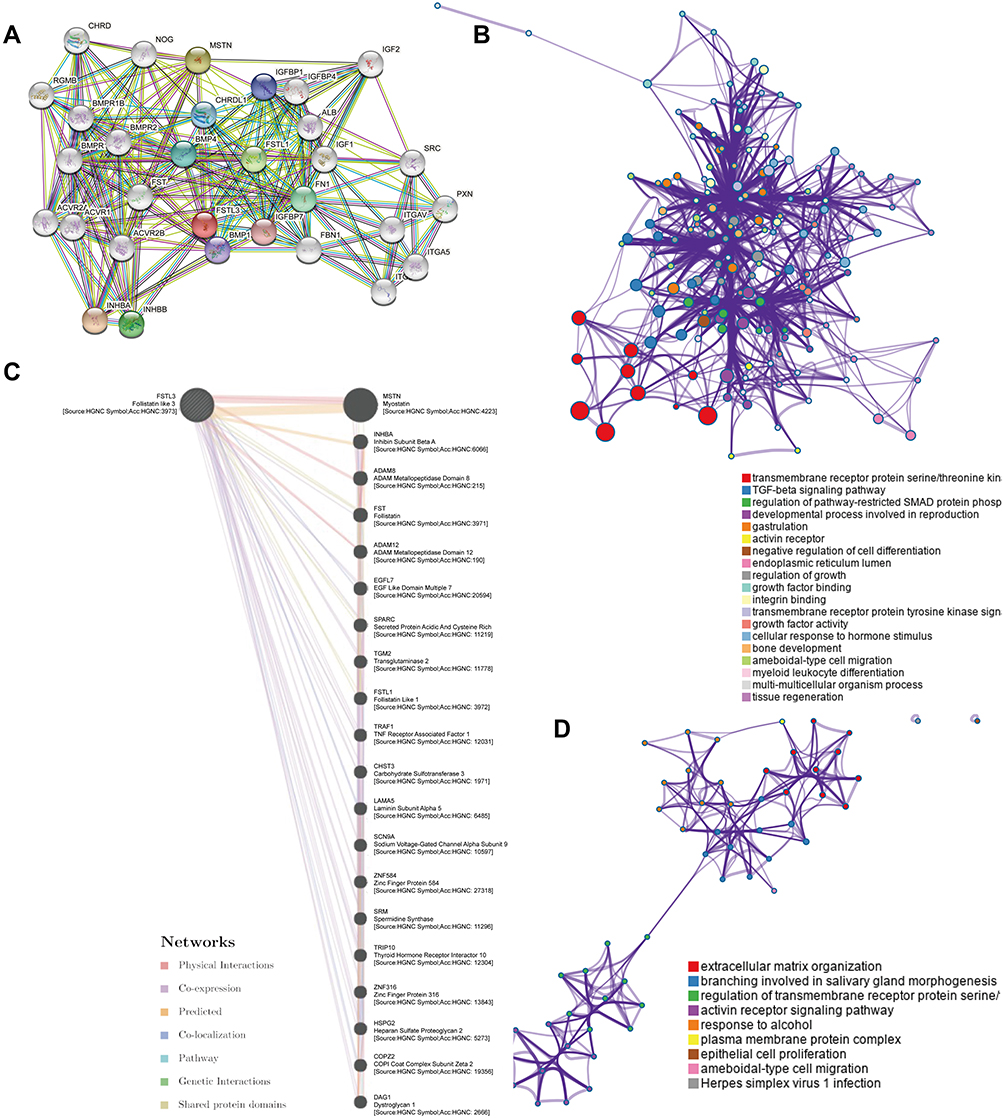 |
Figure 5 Functional enrichment analysis of FSTL3. (A) The protein–protein interaction (PPI) network of FSTL3 and its related proteins obtained from the STRING database. (B) GeneOntology (GO) and Kyoto Encyclopedia of Genes and Genomes (KEGG) enrichment analyses of FSTL3 and its related proteins using the STRING database. (C) FSTL3 and its neighboring genes showing physical interactions, co-expression, predicted interactions, co-localization, pathway interactions, genetic interaction, and shared protein domains. (D) GO and KEGG enrichment analysis of FSTL3 and its neighboring genes using GeneMANIA. |
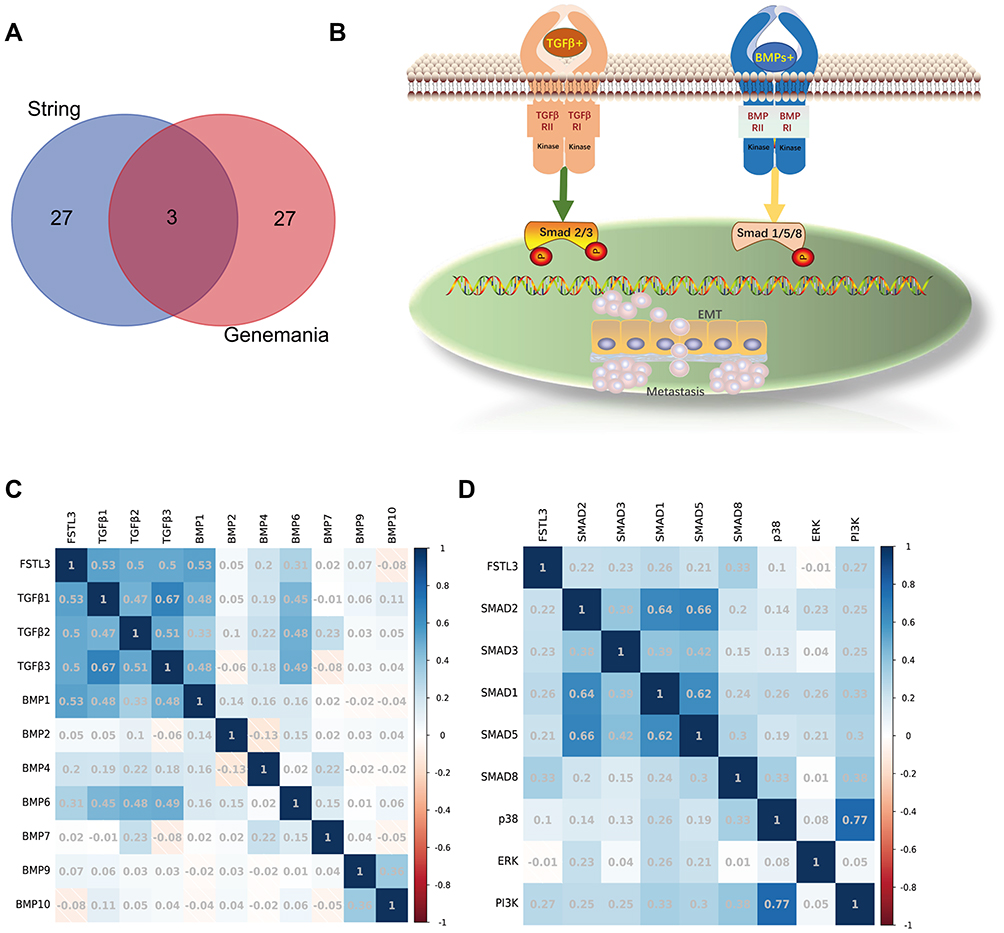 |
Figure 6 Correlation between FSTL3 expression and BMP/SMAD signals. (A) The “VennDiagram” R package was used for the common enrichment terms. (B) Two classical BMP/SMAD signaling pathways. (C) Correlation between FSTL3 expression and that of its ligands. (D) Correlation between FSTL3 expression and that of its mediators. |
Overexpression of FSTL3 Promotes the EMT Phenotype and is Involved in BMP/SMAD Signaling
GSEA of FSTL3 showed that FSTL3 may be involved in “epithelial mesenchymal transition” and “TGF-beta signaling”. Based on the results of GSEA (Figure 7A), we conducted molecular experiments in vitro. After shRNA transfection targeting FSTL3 in HGC-27 cells, the expression levels of FSTL3 significantly changed (Supplementary Document 3). FSTL3 knockdown decreased tumor cell migration and invasion (Figure 7B–D). However, FSTL3-overexpressing cells showed the opposite trend. Furthermore, we detected EMT related proteins in the control, NC, FSTL3 knockdown and FSTL3 overexpression group. FSTL3 silencing upregulated E-cad and downregulated TGFB1, Matrix metalloproteinase 2 (MMP2), Matrix metalloproteinase 9 (MMP9), N-Cadherin (N-cad), and Vimentin (VIM). Conversely, FSTL3 overexpression upregulated TGFB1, MMP2, MMP9, N-cad, and vimentin but downregulated E-Cadherin (E-cad) protein expression in HGC-27 cells (Figure 7E and F). In addition, correlation analysis from the TIMER database also showed that FSTL3 expression was positively correlated with TGFB1 (R = 0.519, P = 5.92e−30), CDH2 (R = 0.476, P = 0), MMP2 (R = 0.553, P = 0), MMP9 (R = 0.092 P = 6.24e−02), and VIM expression (R = 0.468, P = 6.11e−24) and negatively correlated with CDH1 expression (R = −0.143, P = 3.49e−3), consistent with the in vitro experiments (Figure 7G). Based on the above results, it appeared that FSTL3 regulates EMT signaling in HGC-27 cells in vitro.
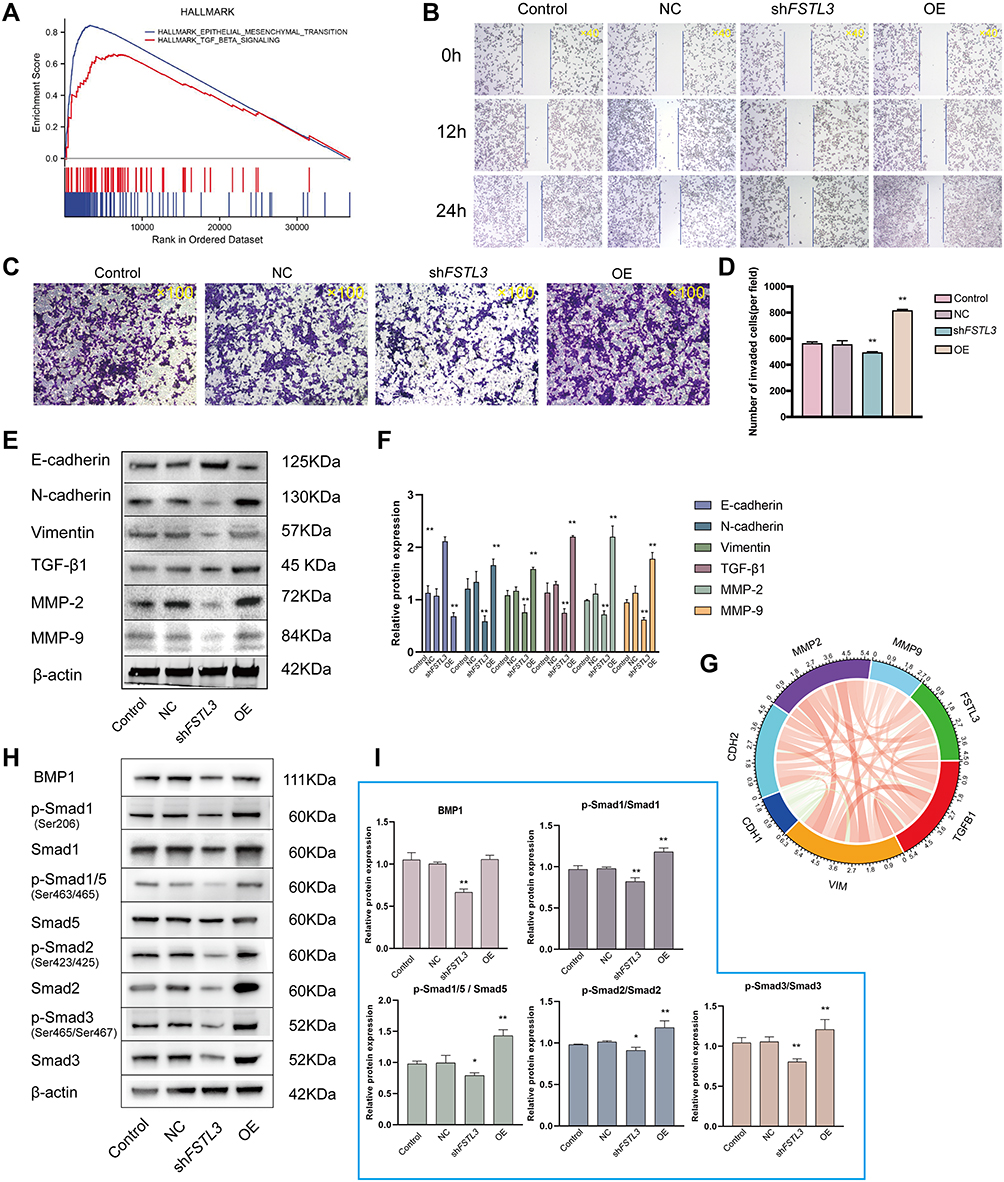 |
Figure 7 Effect of FSTL3 on invasion and migration and its relationship with epithelial–mesenchymal transition (EMT)-related proteins and BMP/SMAD signals. (A) Gene Set Enrichment Analysis (GSEA) of FSTL3. (B–D) Effect of FSTL3 knock‐down and overexpression on the migratory and invasive abilities of gastric cancer cells assessed using transwell migration and scratch-wound cell migration assays (**P < 0.01). (E and F) The levels of EMT-related proteins were analyzed using Western blotting 24 hours after transfection (**P < 0.01). (G) Correlation coefficient circles for FSTL3 and EMT-related genes from the TIMER database. Red represents positive correlations and green represents negative correlations; stronger correlations are indicated in darker colors. (H and I) FSTL3 modulates BMP/SMAD signals (*P < 0.05, **P < 0.01). |
Subsequently, we investigated the role of FSTL3 in BMP/SMAD signaling. FSTL3 appeared to regulate SMAD phosphorylation. As shown in Figure 7H and I, knocking down FSTL3 reduced the expression of BMP1, but FSTL3 over-expression had no significant effect on BMP1 expression (*P < 0.05, **P < 0.01, ANOVA).
Overexpression of FSTL3 Promotes Cytoskeletal Remodeling
GSEA of FSTL3 showed that FSTL3 was functionally enriched for the terms “lamellipodium membrane”, “filamentous actin”, “invadopodium”, and “gamma tubulin binding”. Based on the results of GSEA (Figure 8A), we examined the effect of FSTL3 on the cytoskeleton in vitro. An increase in FSTL3 expression significantly increased the expression of F-actin (red) (Figure 8B and C) and filopodia (yellow arrows) (Figure 8D). Fluorescence intensity also showed statistically significant changes (*P < 0.05, **p < 0.01, ANOVA).
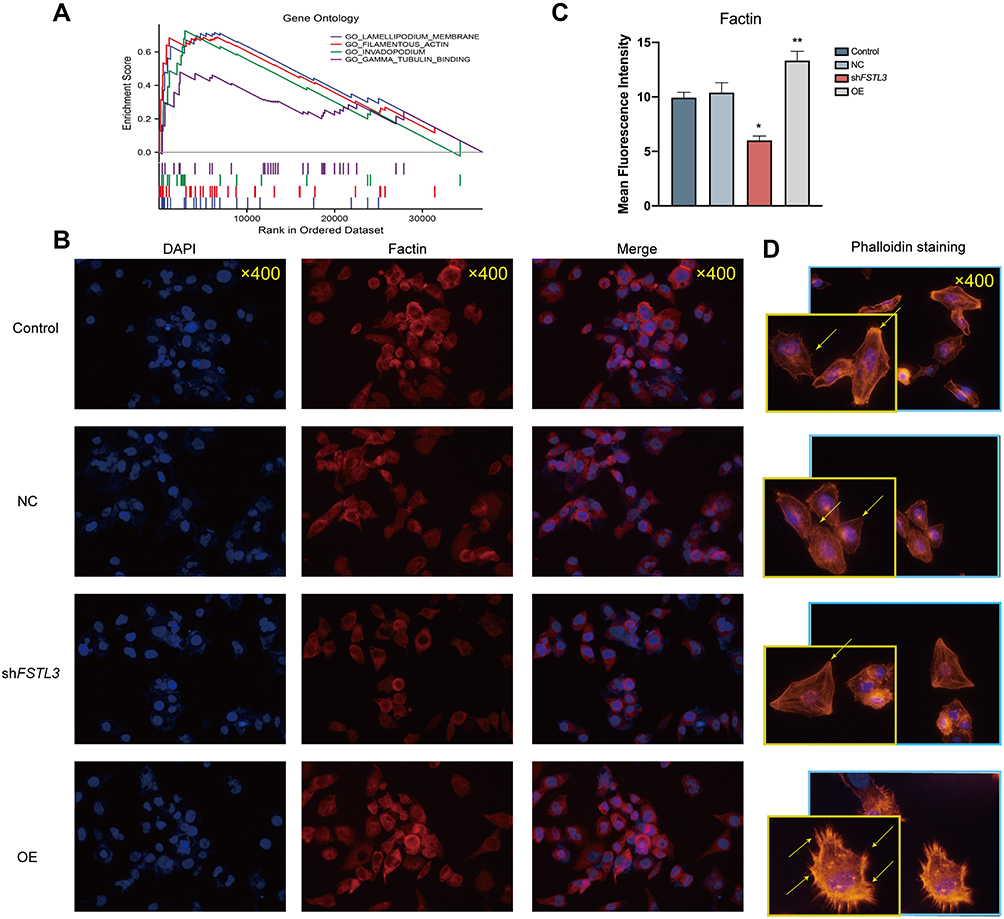 |
Figure 8 Immunofluorescence staining of F-actin under different levels of FSTL3 expression. (A) Gene Set Enrichment Analysis (GSEA) of FSTL3. (B–D) Effect of FSTL3 knock‐down and overexpression on F-actin and the cytoskeleton, detected using immunofluorescence and phalloidin staining 48 hours after transfection (*P < 0.05, **P < 0.01). |
FSTL3 Expression is Related to M2 Macrophage Infiltration
CIBERSORT analysis of the proportion of tumor-initiating cells (TICs) showed a positive correlation between FSTL3 expression and the presence of regulatory T cells, activated mast cells, and M2 macrophages in patients with GC (Figure 9A). We then analyzed the correlation between FSTL3 expression and infiltration by the three subtypes of macrophages. TIMER Gene module analysis revealed that FSTL3 expression was only positively linked to M2 macrophage infiltration (R = 0.21, P = 3.69e-05), but not to M0 or M1 macrophage infiltration (P > 0.05) (Figure 9B). Cancer cells were co-cultured with macrophages, as described in the materials and methods (Figure 10A), and immunofluorescence staining of M2 TAM surface markers was performed (Figure 10B and C). After FSTL3 overexpression, in HGC-27 cells co-cultured with M0 macrophages, the surface markers of M2 type TAM (CD206 and CD163) increased significantly (*P < 0.05, **P < 0.01, ANOVA). Correlation analysis based on the TIMER database also showed that the expression of FSTL3 was positively correlated with that of CD163 (R = 0.288, P = 2.54e-09) and CD206 (R = 0.277, P = 1.14e-08) (Figure 10D).
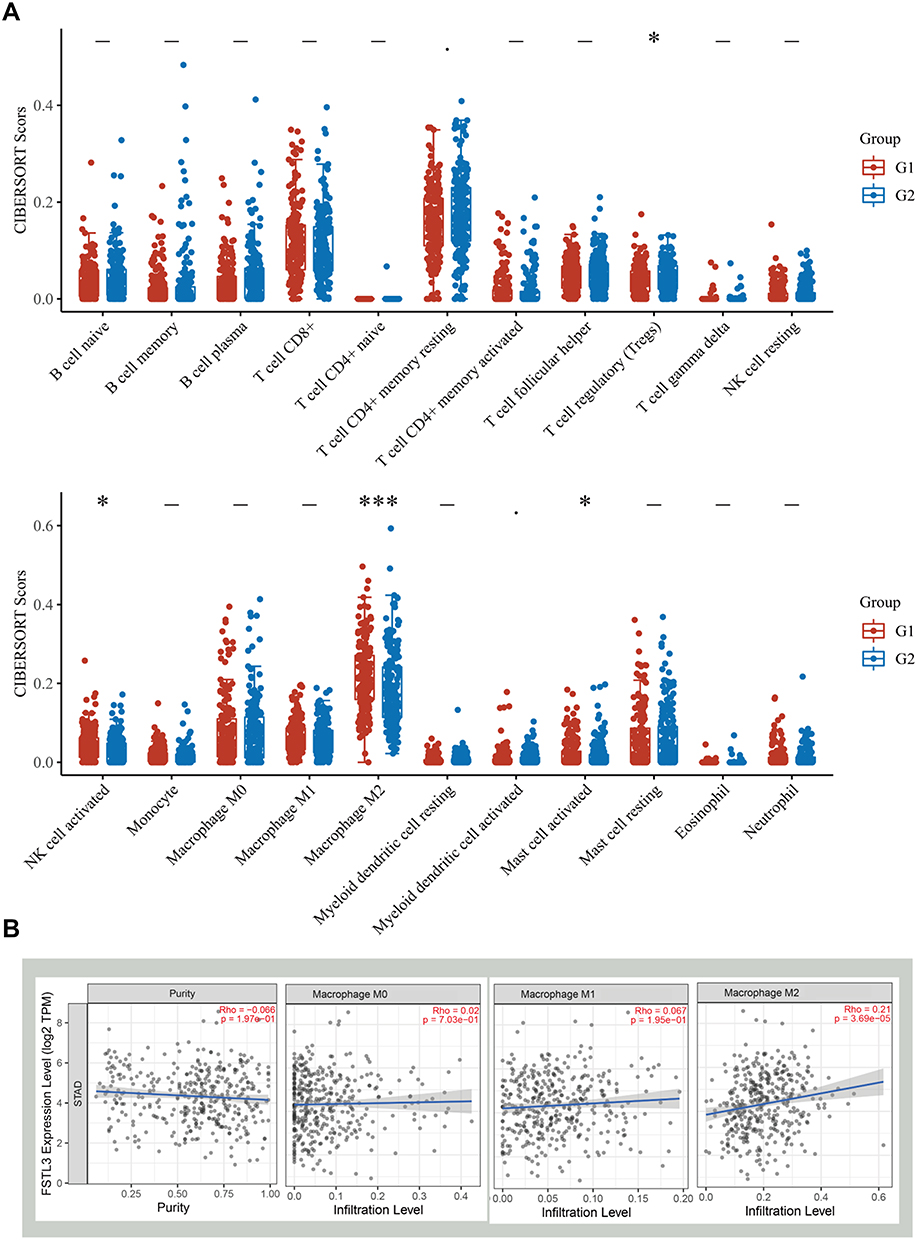 |
Figure 9 Relationship between FSTL3 levels and the abundance of immune cell infiltration. (A) Score distribution of immune cells in gastric cancer (GC) tissues and normal tissues, where the horizontal axis represents different groups of samples, the vertical axis represents the gene expression distribution, G1 represents the FSTL3 high expression group, and G2 represents the FSTL3 low expression group. P-values are indicated in the upper left corner and asterisks represent the level of significance (*P < 0.05, ***P < 0.001). (B) Correlation between FSTL3 expression and the abundance of macrophages analyzed using TIMER. |
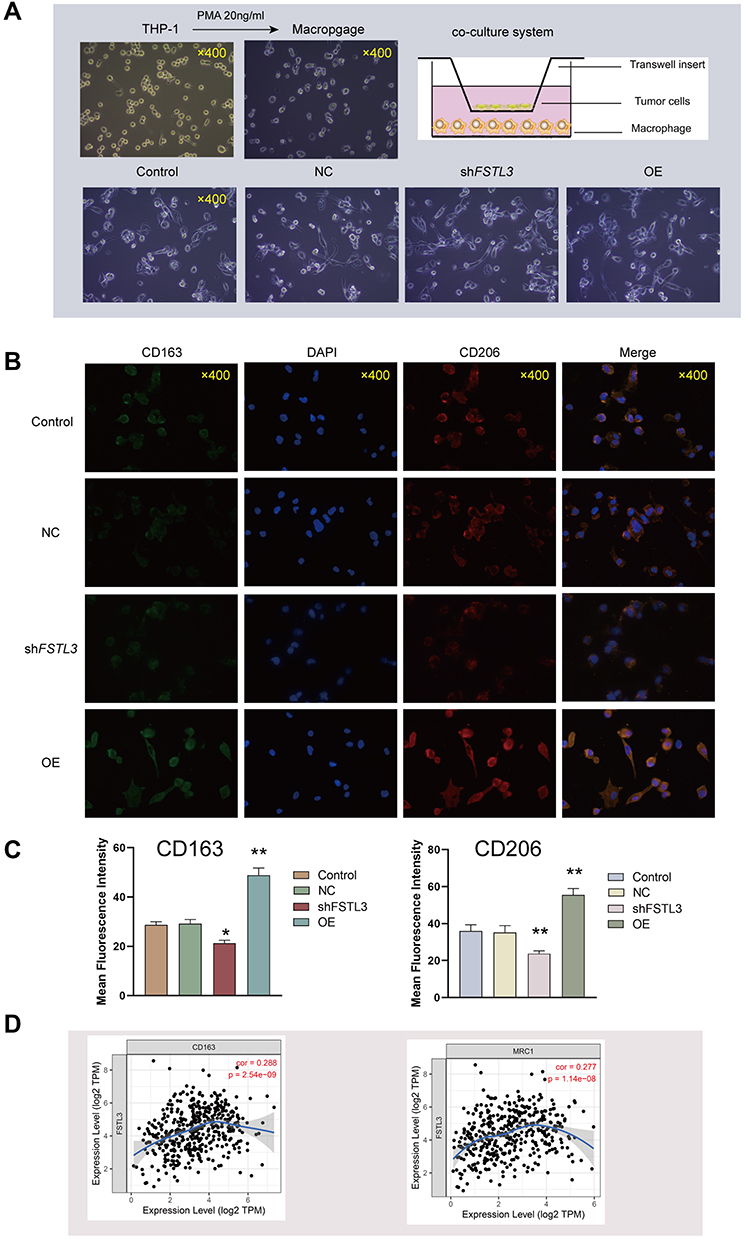 |
Figure 10 Relationship between FSTL3 expression and the abundance of M2 tumor-associated macrophage infiltration. (A) A co-culture system was established by incubating differentiated M0 macrophages with cancer cells in a 1:1 ratio in RPMI medium for 72 h. (B) Double immunofluorescence staining for CD206 (red) and CD163 (green) as specific markers of M2 macrophages; nuclei are stained with DAPI (blue). (C) Immunofluorescence intensities expressed as mean intensity ± SD (*P < 0.05, **P < 0.01). (D) Correlation analysis between FSTL3 expression and CD163 and CD206 (MRC1) expression using TIMER. |
Discussion
FSTL3, also referred to as FLRG, is a protein coding gene located on the q13.3 region of chromosome 19. It is 7 kb in length and consists of five exons and four introns, which encode a signal peptide, an N-terminal domain, two FS regions, and a C-terminal domain, respectively.8 This gene is part of the follistatin family, and FSTL3 shares 45% homology with follistatin in mammals.9,35 Li et al studied the expression profiles of serum tumor markers in breast cancer patients and found remarkable differences in FSTL3 expression, which were speculated to be linked to a dismal prognosis.36 FSTL3 is differentially expressed between benign and malignant breast masses and can remarkably distinguish benign tissue from malignant tissue. FSTL3 is expressed more commonly in the capillaries around endometrial carcinoma, indicating that it can modulate angiogenesis in these tumors.37 Further, serum FSTL3 expression is remarkably higher in individuals with non-small-cell lung cancer than in healthy subjects.38
The present study showed remarkable differences in FSTL3 protein expression levels between gastric epithelial cells and GC cells at different stages of differentiation. Further, IHC confirmed that FSTL3 protein expression was remarkably elevated in GC tissues. We found that the expression of FSTL3 is linked to poor prognosis, suggesting that FSTL3 acts as a cancer-promoting gene in GC.
We analyzed the effect of genetic alterations on the expression of the FSTL3 gene, and mutations in FSTL3 were found to have no effect on gene expression levels. Therefore, we examined the effects of methylation, which is as an important epigenetic modification. Notably, among the six methylation probes for FSTL3, two showed a correlation with prognosis in GC patients. Moreover, cg15195495 and cg15488009 methylation was positively linked with FSTL3 expression levels. Survival analysis also showed that high levels of methylation at these two sites were linked to a poor prognosis. Therefore, high levels of methylation at these sites may lead to a high expression of FSTL3 in GC.
Follistatin, by binding to TGF-β superfamily members such as BMPs and activin A, modulates their biological activity in a broad range of cells.39 FSTL3 can specifically bind to these members, inhibiting the transduction of the intracellular signals transduced by SMAD proteins, and modulating the expression of target genes via the regulation of TGF-β superfamily members.40 It is well known that TGF-β is a major inducer of EMT, a process that is vital for epithelium-derived malignant cells to acquire migration and invasion capabilities.41 Atypical BMP expression or mutations in elements from BMP-associated cascades have been documented in various malignancies, including lung cancer and GC.42,43 The pro-tumor effect of FSTL3 may be related to its TGF-β binding domain. Based on previous studies, we performed a series of multifaceted enrichment analyses to explore the biological processes that FSTL3 may be involved in. We observed that FSTL3 may participate in the BMP signaling pathway and SMAD protein signal transduction. Further analysis confirmed that FSTL3 expression shows positive correlation with that of several of these factors, indicating the existence of a co-activation relationship between FSTL3 and BMP/SMAD signals. In subsequent in vitro experiments, we confirmed that FSTL3 regulates SMAD phosphorylation and can activate EMT. There is increasing evidence that the BMP/SMAD signaling pathway can promote EMT. Thus, FSTL3 may induce EMT through BMP/SMAD signals. GSEA interestingly showed that FSTL3 has functional roles related to the lamellipodium membrane, filamentous actin, invadopodium, and gamma tubulin binding. Filamentous actin is necessary for the formation and growth of pseudopodium, including lamellipodium and invadopodium, and the pseudopodium plays an adhesive role in the initial stages of tumor invasion.44 Gamma tubulin is not a component of microtubules but is involved in microtubule assembly, which is essential for the lengthening of invadopodium.45 We demonstrated that FSTL3 can promote the expression of actin, which is also one of the facilitators of EMT. These results together suggest that FSTL3 is an important player in the process of EMT. A guidance diagram that illustrates all the experimentally validated processes that may be associated with FSTL3 has been provided in Supplementary Document 4.
In some studies, the presence of tumor-infiltrating lymphocytes (TILs) in GC is associated with a better prognosis and has been interpreted as an indicator of a more effective immune response to the tumor. CIBERSORT analysis of the proportion of TICs showed a positive correlation between FSTL3 and regulatory T cells, activated mast cells, and M2 macrophages in patients with GC. The most statistically significant association was observed for M2 macrophages, which are not only an area of great interest in current tumor immunology research but are also inextricably linked to EMT. Considering that FSTL3 may be one of the players in the activation of EMT, we further analyzed the correlation between FSTL3 and infiltration by the three macrophage subtypes through online data. We found that FSTL3 expression was only positively correlated with the abundance of M2 macrophage infiltration. In a co-culture system, we verified that FSTL3 promotes the expression of the M2 macrophage surface markers CD163 and CD206 (MRC1). This result suggested that FSTL3 may promote the activation of M2 macrophages, which is currently considered strongly carcinogenic.
It has been well documented that TGFB1 is an important factor in the activation of M2 macrophages. Further, the inhibition of NF-kB anti-inflammatory activity is key in this activation, and the inhibitory genes SMAD, SMAD6, and SMAD7 are associated with this process.46 It has also been shown that the surface of M2 macrophages shows high levels of TGF-βRII and that TGF-β activates not only canonical SMAD2/3-mediated signaling but also SMAD1/5-mediated signaling, which is typically associated BMP stimulation.47 Here, we tentatively found that FSTL3 could promote the expression of several TGF-β superfamily members (TGFB1, SMAD1/5, and SMAD2/3). Considering the complex regulatory role of the TGFB1 cascade signaling network in GC, we speculate that this may be one of the mechanisms by which FSTL3 is able to promote M2 macrophage activation and ultimately exert immunosuppressive effects.
In conclusion, in the present study, using bioinformatics approaches combined with experimental validation, we have shown that FSTL3 may play an important role in the complex gene regulatory network of GC via processes such as EMT activation and remodeling of the immune microenvironment. As proposed by Guo et al,48,49 with the development of computational systems biology, novel methods can be used to generalize the dynamic process of cancer evolution while covering a large number of variables via approaches based on the intersection of biology, mathematics, physics, and information technology. Thus, the identification of new gene regulatory network nodes in a biological sense can provide a practical basis for computational systems biology and will provide more information for the early diagnosis and treatment of cancer.50 The identification of new diagnostic biomarkers is helpful to develop new targets and strategies for tumor therapy. The key to this process is how biomarkers participate in the development of tumors. However, in this study, observations were made only at the cellular level and could not be validated in a large number of clinical specimens. The biological function and mechanism of action of FSTL3 in GC have not been explored in depth and will be the focus of our next study, as more functional and regulatory mechanisms need to be clarified.
Data Sharing Statement
We promise that all the data in this article are authentic, valid and available.
Ethical Standards
The study was approved by Jiangsu Province Hospital of Chinese Medicine, Affiliated Hospital of Nanjing University of Chinese Medicine, Ethics and Research Committee (protocol number: 2019NL-166-02). About human tissues, the experimental use of surgical samples in this manuscript have been performed in accordance with the principles stated in the Declaration of Helsinki.
Acknowledgments
The present study was supported by the Youth Science and Technology Project of Suzhou (No. KJXW2019059); the Suzhou Science and Technology Development Plan (No. SYSD2019006); Foundation of A Project Funded by the Priority Academic Program Development of Jiangsu Higher Education Institutions (PAPD) (no. [2018] 87), the Open Projects of the Discipline of Chinese Medicine of Nanjing University of Chinese Medicine supported by the Subject of Academic Priority Discipline of Jiangsu Higher Education Institutions, Science and Technology Program for Social Development of Jiangsu Province, China (BE2019771), the State Administration of Traditional Chinese Medicine of the People’s Republic of China (JDZX2015090) and National Nature Science Foundation of china (81973782).
Author Contributions
Jiepin Li and Yuanjie Liu contributed equally to this work. All authors contributed to data analysis, drafting or revising the article, have agreed on the journal to which the article will be submitted, gave final approval of the version to be published, and agree to be accountable for all aspects of the work.
Disclosure
The authors have declared no conflicts of interest.
References
1. Sano T. Gastric cancer: asia and the world. Gastric Cancer. 2017;20(Suppl 1):1–2. doi:10.1007/s10120-017-0694-9
2. Bray F, Ferlay J, Soerjomataram I, et al. Global cancer statistics 2018: GLOBOCAN estimates of incidence and mortality worldwide for 36 cancers in 185 countries. CA Cancer J Clin. 2018;68(6):394–424. doi:10.3322/caac.21492
3. Deng Y, Wang M, Zhou L, et al. Global burden of larynx cancer, 1990-2017: estimates from the global burden of disease 2017 study. Aging. 2020;12(3):2545–2583. doi:10.18632/aging.102762
4. Hartgrink HH, et al. Gastric cancer. Lancet. 2009;374(9688):477–490.
5. Criscitiello C, Esposito A, Trapani D, et al. Prognostic and predictive value of tumor infiltrating lymphocytes in early breast cancer. Cancer Treat Rev. 2016;50:205–207. doi:10.1016/j.ctrv.2016.09.019
6. Bremnes RM, Busund L-T, Kilvær TL, et al. The Role of Tumor-Infiltrating Lymphocytes in Development, Progression, and Prognosis of Non-Small Cell Lung Cancer. J Thorac Oncol. 2016;11(6):789–800. doi:10.1016/j.jtho.2016.01.015
7. NCCN Guidelines Version 2.2021. Available from: https://www.nccn.org/guidelines/guidelines-detail?category=1&id=1434.
8. Hayette S, Gadoux M, Martel S, et al. FLRG (follistatin-related gene), a new target of chromosomal rearrangement in malignant blood disorders. Oncogene. 1998;16(22):2949–2954. doi:10.1038/sj.onc.1201807
9. Sidis Y, Tortoriello DV, Holmes WE, et al. Follistatin-related protein and follistatin differentially neutralize endogenous vs. exogenous activin. Endocrinology. 2002;143(5):1613–1624. doi:10.1210/endo.143.5.8805
10. Sidis Y, Schneyer AL, Keutmann HT. Heparin and activin-binding determinants in follistatin and FSTL3. Endocrinology. 2005;146(1):130–136. doi:10.1210/en.2004-1041
11. Razanajaona D, Joguet S, Ay A-S, et al. Silencing of FLRG, an antagonist of activin, inhibits human breast tumor cell growth. Cancer Res. 2007;67(15):7223–7229. doi:10.1158/0008-5472.CAN-07-0805
12. Gao L, Chen X, Wang Y, et al. Up-Regulation of FSTL3, Regulated by lncRNA DSCAM-AS1/miR-122-5p Axis, Promotes Proliferation and Migration of Non-Small Cell Lung Cancer Cells. Onco Targets Ther. 2020;13:2725–2738. doi:10.2147/OTT.S236359
13. Hirano S. Western blot analysis. Methods Mol Biol. 2012;926:87–97.
14. Edge SB, Compton CC. The American Joint Committee on Cancer: the 7th edition of the AJCC cancer staging manual and the future of TNM. Ann Surg Oncol. 2010;17(6):1471–1474. doi:10.1245/s10434-010-0985-4
15. Scanziani E. Immunohistochemical staining of fixed tissues. Methods Mol Biol. 1998;104:133–140. doi:10.1385/0-89603-525-5:133
16. Nakayama M, Niki Y, Kawasaki T, et al. IL-32-PAR2 axis is an innate immunity sensor providing alternative signaling for LPS-TRIF axis. Sci Rep. 2013;3(1):2960. doi:10.1038/srep02960
17. Csóka B, Németh ZH, Szabó I, et al. Macrophage P2X4 receptors augment bacterial killing and protect against sepsis. JCI Insight. 2018;3(11). doi:10.1172/jci.insight.99431.
18. Shibuya H, Hamamura K, Hotta H, et al. Enhancement of malignant properties of human osteosarcoma cells with disialyl gangliosides GD2/GD3. Cancer Sci. 2012;103(9):1656–1664. doi:10.1111/j.1349-7006.2012.02344.x
19. Gao L, Wang X-D, Niu -Y-Y, et al. Molecular targets of Chinese herbs: a clinical study of hepatoma based on network pharmacology. Sci Rep. 2016;6(1):24944. doi:10.1038/srep24944
20. Im K, Mareninov S, Diaz MF. et al. An Introduction to Performing Immunofluorescence Staining. Methods Mol Biol. 2019;1897:299–311.
21. Astanina K, Koch M, Jüngst C, et al. Lipid droplets as a novel cargo of tunnelling nanotubes in endothelial cells. Sci Rep. 2015;5(1):11453. doi:10.1038/srep11453
22. Rhodes DR, Yu J, Shanker K, et al. ONCOMINE: a cancer microarray database and integrated data-mining platform. Neoplasia. 2004;6(1):1–6. doi:10.1016/S1476-5586(04)80047-2
23. Pan JH, Zhou H, Cooper L, et al. LAYN Is a Prognostic Biomarker and Correlated With Immune Infiltrates in Gastric and Colon Cancers. Front Immunol. 2019;10:6. doi:10.3389/fimmu.2019.00006
24. Chandrashekar DS, Bashel B, Balasubramanya SAH, et al. UALCAN: a Portal for Facilitating Tumor Subgroup Gene Expression and Survival Analyses. Neoplasia. 2017;19(8):649–658. doi:10.1016/j.neo.2017.05.002
25. Tang Z, Li C, Kang B, et al. GEPIA: a web server for cancer and normal gene expression profiling and interactive analyses. Nucleic Acids Res. 2017;45(W1):W98–w102. doi:10.1093/nar/gkx247
26. Sun CC, Li S-J, Hu W, et al. Comprehensive Analysis of the Expression and Prognosis for E2Fs in Human Breast Cancer. Mol Ther. 2019;27(6):1153–1165. doi:10.1016/j.ymthe.2019.03.019
27. Chen B, Khodadoust MS, Liu CL. et al. Profiling Tumor Infiltrating Immune Cells with CIBERSORT. Methods Mol Biol. 2018;1711:243–259.
28. Li T, Fan J, Wang B, et al. TIMER: a Web Server for Comprehensive Analysis of Tumor-Infiltrating Immune Cells. Cancer Res. 2017;77(21):e108–e110. doi:10.1158/0008-5472.CAN-17-0307
29. Szklarczyk D, Morris JH, Cook H, et al. The STRING database in 2017: quality-controlled protein-protein association networks, made broadly accessible. Nucleic Acids Res. 2017;45(D1):D362–d368. doi:10.1093/nar/gkw937
30. Franz M, Rodriguez H, Lopes C, et al. GeneMANIA update 2018. Nucleic Acids Res. 2018;46(W1):W60–w64. doi:10.1093/nar/gky311
31. Zhou Y, Zhou B, Pache L, et al. Metascape provides a biologist-oriented resource for the analysis of systems-level datasets. Nat Commun. 2019;10(1):1523. doi:10.1038/s41467-019-09234-6
32. Subramanian A, Tamayo P, Mootha VK, et al. Gene set enrichment analysis: a knowledge-based approach for interpreting genome-wide expression profiles. Proc Natl Acad Sci U S A. 2005;102(43):15545–15550. doi:10.1073/pnas.0506580102
33. Tomczak K, Czerwińska P, Wiznerowicz M. The Cancer Genome Atlas (TCGA): an immeasurable source of knowledge. Contemp Oncol. 2015;19(1a):A68–77. doi:10.5114/wo.2014.47136
34. Modhukur V, Iljasenko T, Metsalu T, et al. MethSurv: a web tool to perform multivariable survival analysis using DNA methylation data. Epigenomics. 2018;10(3):277–288. doi:10.2217/epi-2017-0118
35. Bartholin L, Guindon S, Martel S, et al. Identification of NF-kappaB responsive elements in follistatin related gene (FLRG) promoter. Gene. 2007;393(1–2):153–162. doi:10.1016/j.gene.2007.02.007
36. Li L, Chen L, Zhang W, et al. Serum cytokine profile in patients with breast cancer. Cytokine. 2017;89:173–178. doi:10.1016/j.cyto.2015.12.017
37. Florio P, Ciarmela P, Toti P, et al. Human endometrium and decidua express follistatin-related gene (FLRG) mRNA and peptide. Mol Cell Endocrinol. 2004;218(1–2):129–135. doi:10.1016/j.mce.2003.12.019
38. Cai D, Xu Y, Ding R, et al. Extensive serum biomarker analysis in patients with non-small-cell lung carcinoma. Cytokine. 2020;126:154868. doi:10.1016/j.cyto.2019.154868
39. Arai KY, Tsuchida K, Li C, et al. Purification of recombinant activin A using the second follistatin domain of follistatin-related gene (FLRG). Protein Expr Purif. 2006;49(1):78–82. doi:10.1016/j.pep.2006.04.003
40. Tortoriello DV, Sidis Y, Holtzman DA, et al. Human follistatin-related protein: a structural homologue of follistatin with nuclear localization. Endocrinology. 2001;142(8):3426–3434. doi:10.1210/endo.142.8.8319
41. Dituri F, Cossu C, Mancarella S, et al. The Interactivity between TGFβ and BMP Signaling in Organogenesis, Fibrosis, and Cancer. Cells. 2019;8(10):1130. doi:10.3390/cells8101130
42. Maegdefrau U, Bosserhoff AK. BMP activated Smad signaling strongly promotes migration and invasion of hepatocellular carcinoma cells. Exp Mol Pathol. 2012;92(1):74–81. doi:10.1016/j.yexmp.2011.10.004
43. Lei H, Wang J, Lu P, et al. BMP10 inhibited the growth and migration of gastric cancer cells. Tumour Biol. 2016;37(3):3025–3031. doi:10.1007/s13277-015-4116-5
44. Schoumacher M, Goldman RD, Louvard D, et al. Actin, microtubules, and vimentin intermediate filaments cooperate for elongation of invadopodia. J Cell Biol. 2010;189(3):541–556. doi:10.1083/jcb.200909113
45. Chumová J, Kourová H, Trögelová L, et al. Microtubular and Nuclear Functions of γ-Tubulin: are They LINCed? Cells. 2019;8(3):259. doi:10.3390/cells8030259
46. Gratchev A. TGF-β signalling in tumour associated macrophages. Immunobiology. 2017;222(1):75–81. doi:10.1016/j.imbio.2015.11.016
47. Batlle E, Massagué J. Transforming Growth Factor-β Signaling in Immunity and Cancer. Immunity. 2019;50(4):924–940. doi:10.1016/j.immuni.2019.03.024
48. Guo Y, Khodadoust MS, Liu CL, et al. Multiscale Modeling of Inflammation-Induced Tumorigenesis Reveals Competing Oncogenic and Oncoprotective Roles for Inflammation. Cancer Res. 2017;77(22):6429–6441. doi:10.1158/0008-5472.CAN-17-1662
49. Wu X, et al. Network-based global inference of human disease genes. Mol Syst Biol. 2008;4:189. doi:10.1038/msb.2008.27
50. Tan A, Huang H, Zhang P, et al. Network-based cancer precision medicine: a new emerging paradigm. Cancer Lett. 2019;458:
 © 2021 The Author(s). This work is published and licensed by Dove Medical Press Limited. The full terms of this license are available at https://www.dovepress.com/terms.php and incorporate the Creative Commons Attribution - Non Commercial (unported, v3.0) License.
By accessing the work you hereby accept the Terms. Non-commercial uses of the work are permitted without any further permission from Dove Medical Press Limited, provided the work is properly attributed. For permission for commercial use of this work, please see paragraphs 4.2 and 5 of our Terms.
© 2021 The Author(s). This work is published and licensed by Dove Medical Press Limited. The full terms of this license are available at https://www.dovepress.com/terms.php and incorporate the Creative Commons Attribution - Non Commercial (unported, v3.0) License.
By accessing the work you hereby accept the Terms. Non-commercial uses of the work are permitted without any further permission from Dove Medical Press Limited, provided the work is properly attributed. For permission for commercial use of this work, please see paragraphs 4.2 and 5 of our Terms.