")
Back to Journals » Neuropsychiatric Disease and Treatment » Volume 14
Frontal lobe metabolic alterations in autism spectrum disorder: a 1H-magnetic resonance spectroscopy study
Authors Margari L, De Giacomo A , Craig F, Palumbi R, Peschechera A, Margari M, Picardi F, Caldarola M , Maghenzani MA, Dicuonzo F
Received 13 February 2018
Accepted for publication 3 May 2018
Published 20 July 2018 Volume 2018:14 Pages 1871—1876
DOI https://doi.org/10.2147/NDT.S165375
Checked for plagiarism Yes
Review by Single anonymous peer review
Peer reviewer comments 2
Editor who approved publication: Dr Roger Pinder
Lucia Margari,1 Andrea De Giacomo,1 Francesco Craig,2 Roberto Palumbi,1 Antonia Peschechera,1 Mariella Margari,1 Francesca Picardi,3 Marina Caldarola,3 Marilena Anna Maghenzani,4 Franca Dicuonzo3
1Department of Basic Medical Sciences, Neuroscience and Sense Organs, Child Neuropsychiatry Unit, University of Bari Aldo Moro, Azienda Ospedaliero Universitaria Consorziale Policlinico di Bari, Bari, Italy; 2Scientific Institute, IRCCS E. Medea, Unit for Severe Disabilities in Developmental Age and Young Adults, Developmental Neurology and Neurorehabilitation, Brindisi, Italy; 3Department of Basic Medical Sciences, Neuroscience and Sense Organs, Neuroradiology Unit, University of Bari Aldo Moro, Azienda Ospedaliero Universitaria Consorziale Policlinico di Bari, Bari, Italy; 4Emergency Department, Anesthesia and Intensive Care Unit, University of Bari Aldo Moro, Azienda Ospedaliero-Universitaria Policlinico di Bari, Bari, Italy
Purpose: Recently, neuroimaging studies were performed using 1H-magnetic resonance spectroscopy (1H-MRS), revealing a quantitative alteration of neurochemicals (such as neurotransmitters and metabolites) in several brain regions of patients with autism spectrum disorder (ASD). The involvement of the frontal lobe in the neurobiology of ASD has long been documented in the literature. Therefore, the aim of this study was to analyze the alterations of N-acetylaspartate/creatine (NAA/Cr) and choline/Cr (Cho/Cr) ratios in the frontal lobe subcortical white matter (WM) in ASD patients, in order to reveal any alteration of metabolites that might be the expression of specific clinical features of the disorder.
Patients and methods: An 1H-MRS study of the frontal lobe subcortical WM was performed in 75 children with ASD and in 50 age-matched controls to evaluate the functional activity of this brain region.
Results: NAA/Cr and Cho/Cr ratios were significantly altered in ASD, compared to control subjects. Moreover, in the ASD group, NAA/Cr was significantly lower in patients with a cognitive impairment.
Conclusion: Results from this study confirm the existence of brain metabolites’ alterations in frontal lobe WM in children with ASD, supporting the relevance of this brain region in the clinical expressions of this disorder, including its role in the cognitive impairment. Further 1H-MRS investigations will allow to comprehensively explain the relationship between metabolic alteration in a specific brain region and specific clinical features of ASD.
Keywords: autism, neurodevelopmental disorder, cognitive impairment, neuroimaging, brain metabolites
Introduction
Autism spectrum disorder (ASD) is a common neurodevelopmental disorder characterized by impairment of reciprocal social communication and social interaction and restricted, repetitive patterns of behavior, interests, or activities. Manifestations of the disorder may vary greatly depending on the severity of ASD, developmental level, and chronological age, hence the term “spectrum”.1
The prevalence of ASD has increased in the last decades; based on a recent Centers for Disease Control and Prevention (USA) report, ASD affects 1%–2% of the population in the USA, Europe, and Asia, with males being four times more likely to develop it than females. ASD is typically diagnosed at the age of 3; however, some characteristics can sometimes be observed at around 12 months of age.1,2
ASD is now widely considered a neurobiological disorder; although the etiology is yet unknown, it is believed that genetic and environmental factors in complex combinations are responsible.2–4 Magnetic resonance imaging (MRI) plays an important role in investigating the neurobiological basis of ASD. Recently, neuroimaging studies were performed using 1H-magnetic resonance spectroscopy (1H-MRS), revealing a quantitative alteration of neurochemicals (such as neurotransmitters and metabolites) in several brain areas in ASD.5
1H-MRS is a noninvasive MRI technique that allows to detect and quantify specific neurochemicals (such as neurotransmitters and metabolites), both in white matter (WM) and gray matter. Some of these neurochemicals detected are: N-acetylaspartate (NAA), a marker of neuronal density and viability and/or mitochondrial function;5–7 choline (Cho), a measure of membrane synthesis turnover;5,8–10 and creatine (Cr), a measure of cellular energy metabolism.5,9,10
In the last decade, 1H-MRS has been used as a research instrument, in order to obtain more data about the pathophysiology and the neurobiological basis of ASD. A recent review reports a widespread trend of decreased absolute concentrations of NAA or NAA/Cr and an increase in Cho peak level in patients with ASD.5 However, the authors underlined some limitations and criticism in 1H-MRS literature, arising from the variability of methodologies, including different 1H-MRS techniques, various regions of interest studied in the brain, and samples demographics. Few studies focused their attention on the alterations of NAA/Cr and Cho/Cr ratios in the WM of the frontal lobe, reporting conflicting results.11–14
In general, the 1H-MRS literature is inconsistent due to different metabolites studied, age of the patients recruited, the methodological techniques used, and the region of interest analyzed in the brain.5 The involvement of the frontal lobe in the neurobiology of ASD has long been documented in literature. In fact, the frontal lobe has a central role in the executive functions and emotion recognition; these processes are both compromised in ASD.12,16–18 Therefore, the aim of this study was to analyze the alteration of NAA/Cr and Cho/Cr ratios in the frontal lobe subcortical WM in ASD patients, in order to reveal any alterations of metabolites that might be the expression of specific clinical features of the disorder.
Patients and methods
Population
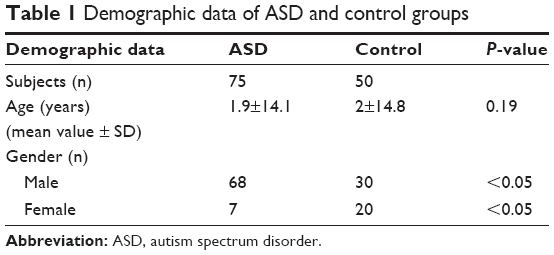
The study included a sample of 75 children with ASD (aged 21 months to 14 years and 1 month) admitted to the Child and Adolescent Neuropsychiatric Unit of the University of Bari “Aldo Moro” (Italy) between 2008 and 2016. The diagnosis of ASD was made according to the Diagnostic and Statistical Manual of Mental Disorders, Fourth edition – Text Revision (DSM-IV-TR) and Diagnostic and Statistical Manual of Mental Disorders, Fifth Edition (DSM-5) criteria1,19 by highly trained child neuropsychiatrists with expertise in the assessment of ASD, and it was supported by the following standardized tests: Autism Diagnostic Interview-Revised,20 Autistic Diagnostic Observation Schedule,21 and Childhood Autism Rating Scale.22 The cognitive assessment was performed using age-related scales including Wechsler Preschool and Primary Scale of Intelligence – third edition (WPSSI-III),23 Wechsler Intelligence Scale for Children – fourth edition,24 and Leiter International Performance Scale – Revised for subjects with verbal disorders;25 the global development was assessed using the Griffiths Mental Development Scales – Extended Revised.26 All patients underwent physical and neurological examination, routine laboratory tests, including blood count, liver, and renal functions, and metabolic laboratory tests (ammonemia, aminoacidemia, and aminoaciduria). No ASD patients used psychotropic medications.
Considering the difficulty in recruiting healthy subjects, ASD patients were compared with an age-matched control group, including 50 children (aged 2 years to 14 years and 8 months), randomly recruited from local state schools. Moreover, we identified two subgroups in ASD patients: the first subgroup, ASD subgroup 1, included patients with an intellectual disability (ID) or a global development delay (DD) and the second subgroup included patients without either a cognitive impairment or a DD (ASD subgroup 2). The ID has been defined by deficits in two domains: on one hand, by a cognitive impairment (intelligence quotient [IQ] <70, obtained with the administration of WPSSI-III,23 Wechsler Intelligence Scale for Children – fourth edition,24 and Leiter International Performance Scale – Revised25) and on the other hand, by deficits in adaptive behavior. DD has been defined by a development general quotient <76, obtained by the administration of the Griffiths Mental Development Scales – Extended Revised.26 Then we compared the NAA/Cr and Cho/Cr values between the two subgroups.
This study has been approved by the Local Ethics Committee of Azienda Ospedaliero-Universitaria Policlinico di Bari (Italy). All children were recruited after obtaining a written informed consent from their parents.
MRI and 1H-MRS study
Patients with ASD and control subjects underwent a routine MRI examination in order to exclude the presence of structural anomalies that could explain the autistic behavior otherwise or secondary headache. T1- and T2-weighted images were acquired using a 1.5 T MRI system (GE Signa; Milwaukee, WI, USA). Sleep sedation was performed in case of uncooperative patients using midazolam and/or diazepam for pre-anesthesia, followed by either administration of oxygen, air, and halogenated agents (for children under the age of 4) or propofol and oxygen (for children above the age of 4). Midazolam administration is mainly by the rectal way and its absorption is predominantly gastrointestinal. Then, midazolam is primarily metabolized in the liver and gut, and its metabolite is excreted in urine. This type of benzodiazepine-induced brief sedation is administered in all the exams where it is necessary; no differences were noted even in control patients, both in conventional and advanced sequences.27 The baseline MRI was evaluated by an expert neuroradiologist.
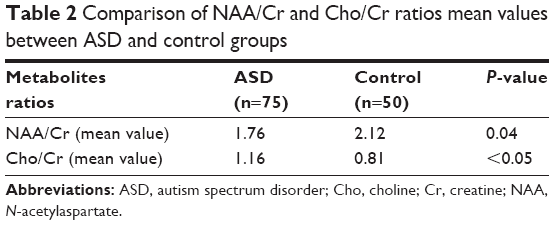
The 1H-MRS used was based on a single-voxel approach; the volume of interest only included the frontal lobe WM of the dominant hemisphere (Figures 1 and 2), in order to scan for a period of 30 minutes or less. 1H-MRS examination was performed using the point-resolved spectroscopy sequence method (echo time=35 ms, repetition time=1,500 ms, field of view=24, voxel size=20×20 mm). The duration of the sequence was 2:12 minutes. In this study, we analyzed NAA/Cr and Cho/Cr in the ASD group compared with the control subjects, since Cr concentration is relatively constant compared to the concentration of other metabolites.12–14
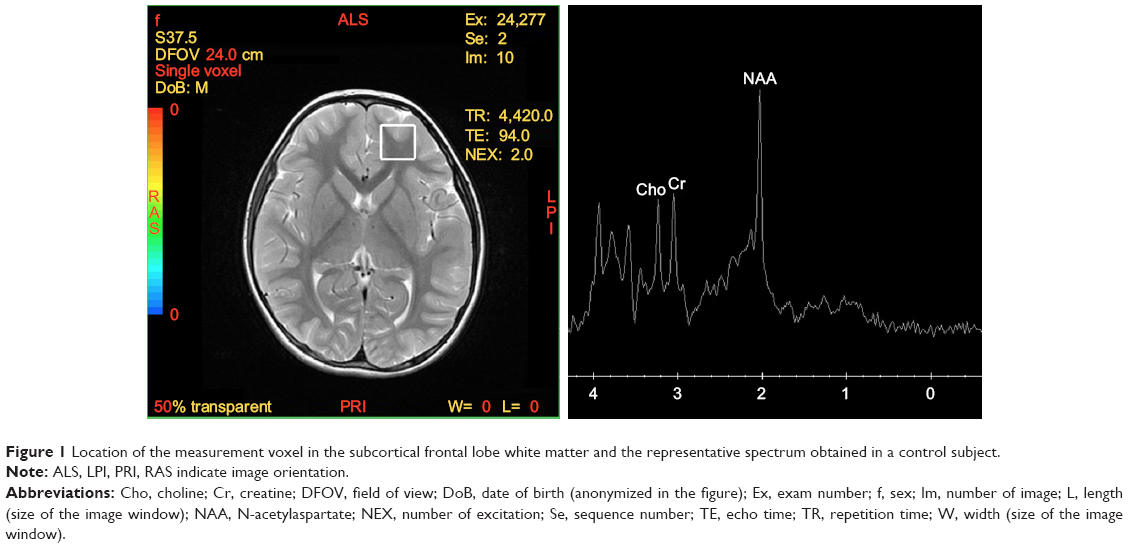 | Figure 1 Location of the measurement voxel in the subcortical frontal lobe white matter and the representative spectrum obtained in a control subject. |
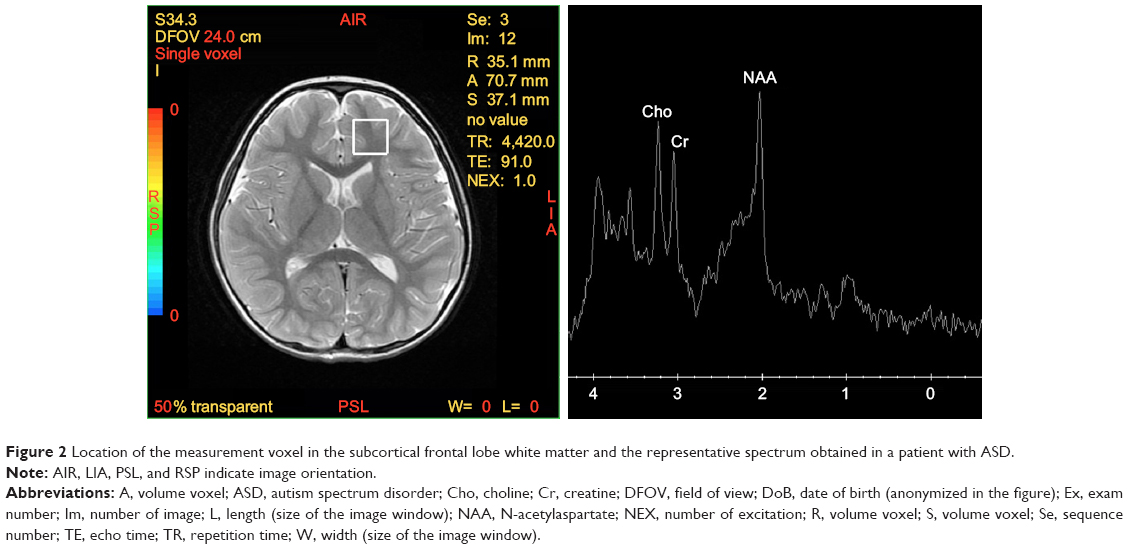 | Figure 2 Location of the measurement voxel in the subcortical frontal lobe white matter and the representative spectrum obtained in a patient with ASD. |
Statistical analysis
All demographic and clinical variables were subjected to statistical analysis. Descriptive analysis was conducted for sociodemographic variables featuring the two samples (ASD and control groups). To compare the gender between the ASD and control groups, we used the Fisher’s exact test. Student’s t-test was used to examine the differences in age, NAA/Cr (mean value), and Cho/Cr (mean value) between the ASD and control groups. In addition, the Student’s t-test was also used to examine the differences in NAA/Cr (mean value) and Cho/Cr (mean value) between children with ASD and children with ASD and cognitive impairment. Statistical significance was considered for a P-value ≤0.05. We used the statistical program Statistical Package for Social Science 20.0.
Results
Demographic data of the ASD and control groups are presented in Table 1. We found a significant prevalence of male patients with ASD; this result is consistent with the higher prevalence rates of the disorder in the male population. The two groups were age matched (P=0.19). No structural abnormalities were detected in the brain MRI in both ASD and control groups. In the frontal lobe WM, 1H-MRS detected a decrease in NAA/Cr and an increase in Cho/Cr, which were statistically significant in ASD compared to the control group (Table 2). The standardized neurocognitive evaluation was possible only in 40 ASD patients due to poor cooperation of the other 35 patients. In 25/40 ASD patients, we found an ID or a global DD. The two ASD subgroups were matched for age (P=0.72) and gender (0.31), as shown in Table 3. A statistically significant decrease in NAA/Cr was found between the two subgroups of ASD patients (Table 4).
 | Table 1 Demographic data of ASD and control groups |
 | Table 2 Comparison of NAA/Cr and Cho/Cr ratios mean values between ASD and control groups |
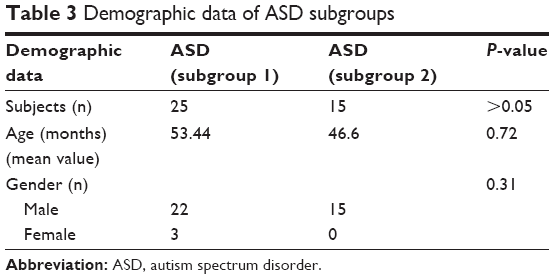 | Table 3 Demographic data of ASD subgroups |
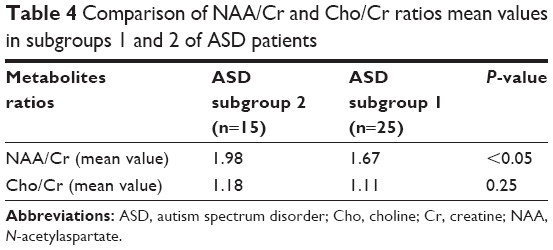 | Table 4 Comparison of NAA/Cr and Cho/Cr ratios mean values in subgroups 1 and 2 of ASD patients |
Discussion
In the present study, we found a statistically significant decrease of NAA/Cr in the frontal lobe WM in the ASD group, compared to the control group. This finding of NAA/Cr decrease is coherent with the previous 1H-MRS studies that examined the frontal lobe in children with ASD. Fuji et al compared 1H-MRS of 51 ASD patients with 28 healthy control subjects and found a statistically significant decrease of NAA/Cr in the left dorso-lateral-prefrontal cortex and the anterior cingulate cortex in patients with ASD.12 In another study, Kubas et al, in a comparison of 1H-MRS of 12 ASD patients with 16 healthy controls, found decreased NAA/Cr ratio in the frontal lobe WM and gray matter of ASD patients.13 Lastly, Hardan et al, in their comparison of 17 male children with 17 healthy controls, found decreased NAA/Cr levels in the anterior frontal WM and in the anterior middle centrum semiovale.28 Considering that Cr concentration is relatively stable, NAA/Cr reduction is related to a decrease in NAA levels. NAA is a precursor of the neurotransmitter N-Acetylaspartylglutamic acid.10 It is believed that NAA levels are markers of neural density and viability, and they may reflect neuronal integrity and metabolism.6,7,9,29 Thus, our finding of a NAA/Cr decrease in the frontal lobe WM may be the expression of neuronal damage in this brain area. Moreover, we found a statistically significant increase of Cho/Cr in the frontal lobe WM of the ASD group, compared to the control group. Some studies reported alterations in Cho/Cr levels in different brain regions of children with ASD, which are linked to the symptom severity;5 moreover, other studies describe a slight, but not statistically significant increase of Cho/Cr in different areas of the frontal lobe in ASD patients compared to the control group.11,12,14 Choline has an important role as a precursor for the neurotransmitter acetylcholine and as a component of cellular membrane phospholipids that make up 40% of myelin.10 Thus, in the WM, the Cho levels may reflect myelin integrity, while in the gray matter, they may be considered as indicators of the equilibrium of membrane phospholipids’ anabolism and catabolism.8,10 Also, the cholinergic system plays a role in cognitive development and function.30 Therefore, in ASD, the presence of reduced NAA/Cr levels and increased Cho/Cr levels in the frontal lobe WM may indicate an alteration of the neuronal integrity and the connectivity of this area. Previous functional MRI studies provided evidence of an underconnectivity between frontal and posterior areas in ASD which results in a functional impairment of these regions.31–33 Further neuroanatomical evidences of frontal lobe alterations in ASD were reported in a comprehensive review, which described consistent increases of both WM and gray matter in the frontal lobes.34,35 Two studies reported a volume increase in dorsolateral prefrontal and medial frontal cortex.36,37 Other studies identified abnormalities in the frontal function with single-photon emission computed tomography, reporting that blood flow was decreased in the frontal region of ASD patients.38,39 The frontal lobe plays a major role in executive functions that are impaired in ASD.12 Executive function deficits in ASD comprise a reduced capacity for planning, inappropriate repetition of previous thoughts or actions, repetitive movements or speech, deficits in working memory, difficulty to integrate isolated details, impaired ability to adapt behavioral responses in daily life, and inability to use cognitive functions in a meaningful manner.12,40–43 Lastly, in the present study, we found a statistically significant decrease of NAA/Cr in the ASD subgroup 1. Previous 1H-MRS studies described a relationship between NAA and cognitive abilities in healthy subjects.44 Some authors reported that NAA levels in WM were positively correlated with cognitive functioning.45–48 Furthermore, Yeo et al found a specific correlation between NAA levels in the frontal WM and the performance on a working memory task, suggesting that a better performance was associated with higher levels of NAA due to its role in dendritic branching development.49 In ASD, there are some evidences supporting the correlation between cognitive functions and metabolites’ alterations in the frontal lobe. Fujii et al investigated the relationship between IQ and NAA/Cr in the dorso-lateral-prefrontal cortex of 20 children with ASD and found a significantly lower ratio in patients whose IQ was below 50.12 Following studies confirmed the relationship between cognitive abilities of ASD patients and NAA absolute concentrations of the orbito-frontal cortex.50,51 This study has a limitation that deserves to be mentioned. Low spatial resolution of our 1H-MRS equipment did not allow to analyze the metabolites in a specific area of the frontal lobe.
Conclusion
Results from this study confirm the existence of brain metabolites’ alterations in frontal lobe WM in children with ASD, supporting the relevance of this brain region in the clinical expressions of this disorder. Further studies will allow to comprehensively examine correlations between specific symptom domains or IQ measures with the 1H-MRS findings.
Disclosure
The authors report no conflicts of interest in this work.
References
American Psychiatric Association. Diagnostic and Statistical Manual of Mental Disorders – Fifth Edition. Washington, DC: American Psychiatric Press; 2013. | ||
National Institute of Mental Health. Autism Spectrum Disorder. Bethesda, MD: Office of Science Policy; 2015. | ||
Sanders SJ. First glimpses of the neurobiology of autism spectrum disorder. Curr Opin Genet Dev. 2015;33:80–92. | ||
Vijayakumar NT, Judy MV. Autism spectrum disorders: Integration of the genome, transcriptome and the environment. J Neurol Sci. 2016;364:167–176. | ||
Ford TC, Crewther DP. A Comprehensive Review of the (1)H-MRS Metabolite Spectrum in Autism Spectrum Disorder. Front Mol Neurosci. 2016;9:14. | ||
Kleinhans NM. Schweinsburg BC, Cohen DN, Müller RA & Courchesne E. N-acetyl aspartate in autism spectrum disorders: regional effects and relationship to fMRI activation. Brain Res. 2007;1162:85–97. | ||
Levitt JG, O’Neill J, Blanton RE, et al. Proton magnetic resonance spectroscopic imaging of the brain in childhood autism. Biol Psychiatry. 2003;54(12):1355–1366. | ||
Bertholdo D, Watcharakorn A, Castillo M. Brain proton magnetic resonance spectroscopy: introduction and overview. Neuroimaging Clin N Am. 2013;23:359–380. | ||
Pouwels PJ, Frahm J. Regional metabolite concentrations in human brain as determined by quantitative localized proton MRS. Magn Reson Med. 1998;39(1):53–60. | ||
Rae CD. A guide to the metabolic pathways and function of metabolites observed in human brain 1H magnetic resonance spectra. Neurochem Res. 2014;39(1):1–36. | ||
Endo T, Shioiri T, Kitamura H, et al. Altered chemical metabolites in the amygdala-hippocampus region contribute to autistic symptoms of autism spectrum disorders. Biol Psychiatry. 2007;62(9):1030–1037. | ||
Fujii E, Mori K, Miyazaki M, Hashimoto T, Harada M, Kagami S. Function of the frontal lobe in autistic individuals: a proton magnetic resonance spectroscopic study. J Med Invest. 2010;57:35–44. | ||
Kubas B, Kułak W, Sobaniec W, Tarasow E, Lebkowska U, Walecki J. Metabolite alterations in autistic children: a 1H MR spectroscopy study. Adv Med Sci. 2012;57:152–156. | ||
Vasconcelos MM, Brito AR, Domingues RC, et al. Proton magnetic resonance spectroscopy in school-aged autistic children. J Neuroimaging. 2008;18(3):288–295. | ||
Osaka N, Osaka M, Kondo H, Morishita M, Fukuyama H, Shibasaki H. The neural basis of executive function in working memory: an fMRI study based on individual differences. Neuroimage. 2004;21:623–631. | ||
Ito A, Abe N, Fujii T, et al. The role of the dorsolateral prefrontal cortex in deception when remembering neutral and emotional events. Neurosci Res. 2011;69(2):121–128. | ||
Hill EL. Executive dysfunction in autism. Trends Cogn Sci. 2004;8(1):26–32. | ||
Kim SY, Choi US, Park SY, et al. Abnormal activation of the social brain network in children with autism spectrum disorder: an FMRI study. Psychiatry Investig. 2015;12(1):37–45. | ||
American Psychiatric Association. Diagnostic and Statistical Manual of Mental Disorders, IVth Edition, Text Revision. Washington, DC: American Psychiatric Press; 2007. | ||
Lord C, Rutter M, Le Couteur A. Autism Diagnostic Interview-Revised: a revised version of a diagnostic interview for caregivers of individuals with possible pervasive developmental disorders. J Autism Dev Disord. 1994;24(5):659–685. | ||
Ruhl DBS, Feineis-Matthews S, Poustka F. ADOS, Autism Diagnostic Observation Schedule for autistic disorder. Germany: Huber, Bern; 2004. | ||
Schopler E, Reichier RJ, Renner BR. The Childhood Autism Rating Scale (CARS). Los Angeles: Western Psychological Services; 1988. | ||
Wechsler D. Wechsler Preschool and Primary Scale of Intelligence. San Antonio: The Psychological Corporation; 1967. | ||
Wechsler D. The Wechsler Intelligence Scale for Children. London: Pearson; 2004. | ||
Roid GH, Miller LJ. Leiter International Performance Scale – Revised: Examiner’s Manual. Wood Dale, IL: Stoelting Co; 1997. | ||
Luiz D, Barnard A, Knoessen N, et al. The Griffiths Mental Development Scales – Extended Revised: 2 to 8 Years Administration Manual. Oxford, UK: Hogrefe; 2006. | ||
Yildiz A, Gökmen N, Kücükgüclü S, et al. In vivo proton magnetic resonance spectroscopic examination of benzodiazepine action in humans. Psychiatry Res. 2010;184(3):162–170. | ||
Hardan AY, Fung LK, Frazier T, et al. A proton spectroscopy study of white matter in children with autism. Prog Neuropsychopharmacol Biol Psychiatry. 2016;66:48–53. | ||
Chugani DC, Sundram BS, Behen M, Lee ML, Moore GJ. Evidence of altered energy metabolism in autistic children. Prog Neuropsychopharmacol Biol Psychiatry. 1999;23:635–641. | ||
Lam KS, Aman MG, Arnold LE. Neurochemical correlates of autistic disorder: a review of the literature. Res Dev Disabil. 2006;27(3):254–289. | ||
Just MA, Keller TA, Malave VL, Kana RK, Varma S. Autism as a neural systems disorder: a theory of frontal-posterior underconnectivity. Neurosci Biobehav Rev. 2012;36:1292–1313. | ||
Just MA, Cherkassky VL, Keller TA, Kana RK, Minshew NJ. Functional and anatomical cortical underconnectivity in autism: evidence from an FMRI study of an executive function task and corpus callosum morphometry. Cereb Cortex. 2007;17(4):951–961. | ||
Just MA, Cherkassky VL, Keller TA, Minshew NJ. Cortical activation and synchronization during sentence comprehension in high-functioning autism: evidence of underconnectivity. Brain. 2004;127(Pt 8):1811–1821. | ||
Amaral DG, Schumann CM, Nordahl CW. Neuroanatomy of autism. Trends Neurosci. 2008;31:137–145. | ||
Hazlett HC, Poe M, Gerig G, et al. Magnetic resonance imaging and head circumference study of brain size in autism: birth through age 2 years. Arch Gen Psychiatry. 2005;62(12):1366–1376. | ||
Carper RA, Moses P, Tigue ZD, Courchesne E. Cerebral lobes in autism: early hyperplasia and abnormal age effects. Neuroimage. 2002;16:1038–1051. | ||
Herbert MR, Ziegler DA, Makris N, et al. Localization of white matter volume increase in autism and developmental language disorder. Ann Neurol. 2004;55(4):530–540. | ||
Hashimoto T, Sasaki M, Fukumizu M, Hanaoka S, Sugai K, Matsuda H. Single-photon emission computed tomography of the brain in autism: effect of the developmental level. Pediatr Neurol. 2000;23:416–420. | ||
Ohnishi T, Matsuda H, Hashimoto T, et al. Abnormal regional cerebral blood flow in childhood autism. Brain. 2000;123(Pt 9):1838–1844. | ||
Berman KF, Ostrem JL, Randolph C, et al. Physiological activation of a cortical network during performance of the Wisconsin Card Sorting Test: a positron emission tomography study. Neuropsychologia. 1995;33(8):1027–1046. | ||
Owen AM, Evans AC, Petrides M. Evidence for a two-stage model of spatial working memory processing within the lateral frontal cortex: a positron emission tomography study. Cereb Cortex. 1996;6(1):31–38. | ||
Ozonoff S, Pennington BF, Rogers SJ. Executive function deficits in high-functioning autistic individuals: relationship to theory of mind. J Child Psychol Psychiatry. 1991;32(7):1081–1105. | ||
Stuss DT, Craik FI, Sayer L, Franchi D, Alexander MP. Comparison of older people and patients with frontal lesions: evidence from world list learning. Psychol Aging. 1996;11:387–395. | ||
Patel T, Blyth JC, Griffiths G, Kelly D, Talcott JB. Moderate relationships between NAA and cognitive ability in healthy adults: implications for cognitive spectroscopy. Front Hum Neurosci. 2014;8:39. | ||
Ferguson KJ, Maclullich AM, Marshall I, et al. Magnetic resonance spectroscopy and cognitive function in healthy elderly men. Brain. 2002;125(Pt 12):2743–2749. | ||
Jung RE, Brooks WM, Yeo RA, Chiulli SJ, Weers DC, Sibbitt WL. Biochemical markers of intelligence: a proton MR spectroscopy study of normal human brain. Proc Biol Sci. 1999;266:1375–1379. | ||
Jung RE, Yeo RA, Chiulli SJ, et al. Biochemical markers of cognition: a proton MR spectroscopy study of normal human brain. Neuroreport. 1999;10(16):3327–3331. | ||
Valenzuela MJ, Sachdev PS, Wen W, Shnier R, Brodaty H, Gillies D. Dual voxel proton magnetic resonance spectroscopy in the healthy elderly: subcortical-frontal axonal N-acetylaspartate levels are correlated with fluid cognitive abilities independent of structural brain changes. Neuroimage. 2000;12(6):747–756. | ||
Yeo RA, Hill D, Campbell R, Vigil J, Brooks WM. Developmental instability and working memory ability in children: a magnetic resonance spectroscopy investigation. Dev Neuropsychol. 2000;17(2):143–159. | ||
Mori K, Toda Y, Ito H, et al. A proton magnetic resonance spectroscopic study in autism spectrum disorders: amygdala and orbito-frontal cortex. Brain Dev. 2013;35(2):139–145. | ||
Mori K, Toda Y, Ito H, et al. Neuroimaging in autism spectrum disorders: 1H-MRS and NIRS study. J Med Invest. 2015;62(1–2):29–36. |
 © 2018 The Author(s). This work is published and licensed by Dove Medical Press Limited. The full terms of this license are available at https://www.dovepress.com/terms.php and incorporate the Creative Commons Attribution - Non Commercial (unported, v3.0) License.
By accessing the work you hereby accept the Terms. Non-commercial uses of the work are permitted without any further permission from Dove Medical Press Limited, provided the work is properly attributed. For permission for commercial use of this work, please see paragraphs 4.2 and 5 of our Terms.
© 2018 The Author(s). This work is published and licensed by Dove Medical Press Limited. The full terms of this license are available at https://www.dovepress.com/terms.php and incorporate the Creative Commons Attribution - Non Commercial (unported, v3.0) License.
By accessing the work you hereby accept the Terms. Non-commercial uses of the work are permitted without any further permission from Dove Medical Press Limited, provided the work is properly attributed. For permission for commercial use of this work, please see paragraphs 4.2 and 5 of our Terms.