")
Back to Archived Journals » Neuroscience and Neuroeconomics » Volume 5
Voxel-based morphometry: current perspectives
Authors Scarpazza C, De Simone M
Received 19 October 2015
Accepted for publication 19 May 2016
Published 14 July 2016 Volume 2016:5 Pages 19—35
DOI https://doi.org/10.2147/NAN.S66439
Checked for plagiarism Yes
Review by Single anonymous peer review
Peer reviewer comments 2
Editor who approved publication: Professor SH Annabel Chen
Cristina Scarpazza,1,2 Maria Stefania De Simone,3
1Department of Psychosis Studies, Institute of Psychiatry, Psychology & Neuroscience, King’s College London, London, UK; 2Department of General Psychology, University of Padua, Padua, 3Laboratory of Clinical and Behavioural Neurology, IRCCS Santa Lucia Foundation, Rome, Italy
Abstract: Voxel-based morphometry (VBM) is a widely used automated technique for the analysis of neuroanatomical images. This work, which reviews important VBM clinical findings of the last few years, is divided into two main sections. After briefly introducing VBM methodology, in the first part, VBM findings on neurological and psychiatric diseases have been discussed separately. The reported studies were divided into studies that examine the diagnostic value of VBM results and their usefulness for the differential diagnosis between two disorders; studies investigating the potential of VBM for the diagnosis in an early stage of the illness, and studies that examine the utility of VBM for predicting the transition from prodromal phase to full-blown disease. In the second part, this review focuses on the most recent findings on the single-case approach. This analysis is useful for promoting the translational impact of VBM results in clinical practice, where clinicians need to make inferences at the level of the individual patient. Finally, within the single-case approach, a paragraph is dedicated to the potential forensic applications of VBM. Indeed, if used to support and integrate results obtained with classical forensic evaluations, VBM may provide objective data that could be used to reduce controversy in forensic psychiatric evaluations of mental insanity. In this second part, particular emphasis is given to the problem of results interpretation, which should be based mainly on the presence of anatomoclinical correlation. The review finishes with a provocative note reporting an interesting result of a single-case VBM analysis that highlights the risk to fall into the “reverse inference” reasoning. This example has been chosen because it effectively highlights the risks that are encountered when this technique is inappropriately used.
Keywords: neurological disorders, psychiatric disorders, clinical translation, forensic application, false positives, single case analysis
Introduction
Over the past two decades, hundreds of studies have shed light on the neuroanatomical structural correlates of neurological1–3 and psychiatric4–7 disorders. Many of these studies were performed using voxel-based morphometry (VBM), a whole-brain technique for characterizing between groups’ regional volume and tissue concentration differences from structural magnetic resonance imaging (MRI) scans.8–11 Before the advent of VBM, the manual delineation of region of interest was the gold standard for measuring the volume of brain structures. However, compared to the region of interest approach, VBM presents a large number of advantages that explain its wide popularity within the neuroimaging community. Indeed, it is an automated and relatively easy-to–use, time-efficient, whole-brain tool that could detect the focal microstructural differences in brain anatomy in vivo between groups of individuals without requiring any a priori decision concerning which structure to evaluate. Moreover, VBM exhibits comparable accuracy to manual volumetry12; indeed, several studies have shown good correspondence between the two techniques,1,13–15 providing confidence in the biological validity of the VBM approach.
The classical VBM analysis works on T1-weighted volumetric MRI and relies on parametric statistics (two-sample t-test), which requires the data to be sampled from normally distributed populations. Before performing the statistical analysis allowing group-level inferences, the row MRI images need to be preprocessed in four main steps.11 First, the images need to be segmented into their main tissue components (gray matter [GM], white matter, and cerebrospinal fluid) based on voxel intensities. Second, the images need to be spatially normalized to the same stereotactic space in order to correct for individual differences in brain shape and dimension to allow different brains to be compared directly. Third, the images may be modulated (optional) in order to compensate for volume changes during the spatial normalization such that modulated data measure the absolute volume of GM, while unmodulated data measure the relative concentration of GM. Fourth, the images should be smoothed (ie, after smoothing, the value of each voxel represents the average between its own original value and the value of surrounding voxels), in order to ascertain normal distribution of the data (an important assumption of VBM) and to reduce intersubject variability. Each of these preprocessing steps could potentially introduce bias (ie, misalignment of brain structures, misclassification of tissue type), which might lead to errors in the statistical analysis and to false-positive results. In order to prevent these potential errors affecting the results, the results should be corrected for multiple comparisons (the family-wise error – correction is implemented in VBM). The outcome of these steps is a statistical parametric map, highlighting all voxels of the brain where intensities (volume or GM concentration depending on whether the modulation step has been applied or not) in a group images are significantly lower/higher than those in the other group under investigation. More specific technical and methodological information about the VBM steps has been described in other reviews11,16.This approach (ie, comparing groups with parametric statistics with family-wise error correction) was proven to be reliable and to have a low susceptibility to false-positive results when comparing groups of subjects.17
In this review, we first summarize findings from the more recent and important studies in which VBM has been applied to investigate neurological and psychiatric pathologies. Although the distinction between these two types of disorders has been called into question on the basis of different scientific data,18 a recent meta-analysis showed that in a neuroimaging perspective, neurological and psychiatric disorders represent two distinct classes of disorders characterized by different neural correlates.19 Consequently, in what follows, we treated the two categories of diseases separately. The reported studies were divided into 1) studies that examine the diagnostic value of VBM and studies that examine the potential of VBM for the differential diagnosis between syndromes that present similar symptoms; 2) studies that examine the potential of VBM for the early detection of illness; and 3) studies that examine the potential of VBM for predicting the transition from prodromal phase to full-blown disease.
We then discuss the potential impact of these findings on clinical practice, concluding with a brief description of the forensic perspective. In this last part regarding the analysis on single subjects, particular emphasis is given to the problem of the results interpretation.
VBM in neurological disorders
What are we, after all, without our memories … without our dreams? Nicholas Sparks, The Wedding
Diagnosis and differential diagnosis
Diagnosis
Since its introduction, VBM has proven to be a very useful tool for investigating possible neuroanatomical biomarkers of neurological disorders. Within this class of pathologies, VBM has been mostly used for studying patterns of brain atrophy in the context of several neurodegenerative pathologies, including Alzheimer’s disease (AD). Clinically characterized by a progressive impairment of cognitive functions and behavior, AD is the most common cause of dementia in the general population and commonly occurs in patients older than 60 years of age. Because the diagnosis of AD has lower sensitivity (∼70%) and specificity (<70%) than the gold standard neuropathological diagnosis,20 the characterization of the prototypical neural substrates of AD may be helpful for its diagnosis. As a result, a number of VBM studies have been conducted to investigate brain volume abnormalities associated with the diagnosis of AD in comparison to healthy controls (HCs), reporting remarkable results and suggesting that VBM can be useful to improve diagnostic accuracy and for monitoring disease progression in AD.
Although published results vary significantly in terms of the site of GM volume differences, a GM reduction in the medial temporal lobe (MTL), including hippocampus, entorhinal cortex, and parahippocampal gyrus, appears to be a consistent and robust finding that is reliably demonstrated until the early stage of AD.21–25 Indeed, core pathological changes observed in AD take place in these regions and are initiated years before the first clinical manifestations of dementia.26 This result is consistent with histopathological studies showing that MTLs, and particularly hippocampus and parahippocampus, are the first regions to be affected by neurofibrillary tangles and amyloid plaques and exhibit also the greatest loss of neurons in AD.27,28 Furthermore, as confirmed by longitudinal studies,29 the hippocampus and entorhinal cortex have been identified to suffer from the most severe atrophy (up to 40%), consistent with the memory deficits experienced by all AD patients.
Significant differences in GM volume in AD patients have also been identified in other brain areas, supporting the hypothesis that the initial pathological changes in AD occur in the MTL and then spread to other regions. Specifically, regions such as the temporal neocortex,21,23,30–35 parietal neocortex,23,30,33,35–37 insula,21,23,31,33–35,38 precuneus,23,30–32,35,36 anterior cingulated cortex,23,31,34,35 posterior cingulated cortex,23,30–33,35 frontal cortex,23,30,31,34–37 thalamus,21,23,30,34,37 and caudate nucleus21,30,31,34,38 have been frequently reported to be reduced in volume in AD compared to normal controls. Conversely, other brain regions have been identified only occasionally, such as the putamen,23,30 basal forebrain,34 and hypothalamus.30
Recently, two meta-analyses,12,39 in the attempt to draw conclusions from a synthesis of previous studies, have confirmed the presence of atrophic patterns predominantly and early involving the MTL structures that spread throughout parietal and temporal regions and posterior parietal cortex as the hallmark of AD pathology compared to normal aging since the early stage of dementia.
Differential diagnosis
After AD, frontotemporal lobar degeneration (FTLD) is the most frequent cause of dementia among individuals under the age of 65 years. FTLD is a heterogeneous neurodegenerative syndrome caused by progressive degeneration of the frontal lobes, anterior temporal lobes, or both and consisting of three clinical subtypes: behavioral variant frontotemporal dementia, semantic dementia, and progressive nonfluent aphasia. Although AD and FTLD are recognized as distinct disorders and clinical criteria have been defined for both, the frequent overlap of the clinical symptoms may pose serious problems in the differential diagnosis between the dementias, particularly in the early stage of the disease. As a result, there has been increased interest in using MRI to better understand the distinctive impact of these pathologies on the gross and fine morphology of the brain and hence to aid in differential diagnosis.
Compared to other structural MRI techniques, such as hippocampal volumetry and tensor-based morphometry, VBM has been demonstrated to show higher accuracy in its ability to differentiate between FTLD and AD.40 Several VBM studies have been conducted in order to compare patterns of brain atrophy in FTLD and AD41–43 and have identified various discriminatory regions between these disorders that vary depending on the specific FTLD subtype. For instance, compared to AD, semantic dementia patients manifested a greater volume loss throughout the temporal lobe (anterior, medial, and lateral areas),41 mirroring the speech and language deficits that are the most salient features of this pathology. On the other hand, AD is associated with significantly more cinguloparietal volume loss,41 mainly reflecting the problems in orientation and memory experienced by AD patients. Differently, behavioral variant frontotemporal dementia subtype (in which behavioral and personality abnormalities are the most salient features) is characterized by a more extensive GM atrophy in orbitofrontal and inferior frontal areas, anterior cingulate and insula, than AD patients,43 once again mirroring the specific clinical manifestation of the disorder.
Prodromal stage
Characterized by impairment in cognition extending beyond what one would expect based on age and education alone that does not interfere notably with activities of daily life, mild cognitive impairment (MCI) is thought to be an intermediary stage between normal aging and dementia.44 According to the profile of cognitive impairment, MCI can be further classified into two major subtypes: amnesic MCI (aMCI), characterized by episodic memory complaints without significant impairment in global cognition, and nonamnesic MCI (naMCI), dominated by symptoms other than memory impairment. Because the two different MCI subtypes have been clinically proved to be at higher risk to develop to AD or other type of dementia, respectively, the development of objective neuroimaging markers to differentiate MCI from healthy elderly subjects constitutes a major research goal. Indeed, emerging interventions are most likely to be successful prior to generalized cognitive decline.45
A number of VBM studies have been conducted to investigate brain volume abnormalities associated with the diagnosis of MCI. Overall, they have documented smaller GM volumes in patients relative to controls mainly affecting the MTL and cingulated gyri and extending into the temporal neocortex.46–48 Consistent with these data, a recent meta-analysis39 of 34 neuroimaging studies using VBM highlighted GM volume reduction in the MTL, temporal, thalamus, and cingulate cortex in MCI compared to HCs. Furthermore, contrasting AD and MCI, they found similar neural networks of GM abnormalities between these pathologies but that was more severe in AD than in MCI.
Interestingly, VBM studies have also assessed the presence of differences in the distribution of GM loss between subclassifications of MCI patients, providing evidence of distinct brain structural abnormalities in different samples of MCI49–51 according to their main clinical symptoms. For example, compared to normal controls, MCI with a focal memory deficit had more involvement of the mesial temporal structures,49–51 naMCI subjects with language impairment had loss in the left anterior inferior temporal lobe,50 while naMCI with attention/executive deficits showed loss in the orbitofrontal cortex, hypothalamus, and basal ganglia.50,51 There is also some suggestion that the patterns of atrophy vary depending on the number of cognitive domains impaired, with MCI that shows deficits in multiple domains showing a more widespread pattern of atrophy.49 These studies also provided evidence for the presence of anatomoclinical correlations even in the early stage of the disease.
Transition from prodromal stage to full-blown disease
Although previous studies have shown an increased rate of conversion to dementia in MCI, some of the MCI subjects will remain stable or even improve during follow-up.52 Currently, no specific methods are available to predict who will develop dementia, and hence biomarkers that help in predicting MCI subjects likely to convert to dementia are under extensive investigation. Consequently, one important challenge for neuroimaging is discriminating MCI patients progressing later to AD (converter-MCI) from MCI patients who will not (nonconverter-MCI). In this regard, VBM allows to longitudinally assess brain changes associated with the progression from MCI to dementia, and therefore, it is considered a promising tool in the research of biomarkers for the early detection of disease.
As a result, several longitudinal VBM studies have explored the spread of GM loss over time in MCI.23,49,50,53–57 Overall, these findings show that subjects with MCI who go on to develop AD have significantly lower baseline GM volume in MTLs, posterior cingulated, lateral temporal, and parietal cortices compared with HCs or stable MCI, although they can have heterogeneous results in terms of laterality and atrophy extent. For example, Bozzali et al23 showed that, in comparison to normal controls, MCI-converters exhibited more widespread areas of reduced GM density than nonconverters, with a pattern of abnormalities similar to that seen in patients with AD. In addition, the converting-MCI sample displayed significant GM decreases in the inferior frontal gyrus bilaterally, the left supramarginal gyrus, and the right hippocampus relative to nonconverting-MCI group. A further study50 also reported a pattern of bilateral GM loss affecting the MTL, inferior temporal lobe, temporoparietal association cortex, and frontal lobe in aMCI-converters compared to elderly controls. When compared to MCI who remained clinically stable for 3 years, MCI-converter subjects presented greater GM loss in the MTL, inferior temporal lobe, temporoparietal neocortex, anterior and posterior cingulate gyri, precuneus, and frontal lobe.50
In order to highlight a consistent pattern of GM abnormalities across studies, meta-analyses of VBM studies have been conducted. Two recent meta-analyses2,39 demonstrated that the left MTL is the most affected region in MCI patients who will later develop AD, especially the hippocampus and the parahippocampal gyrus, and that this structure may be an anatomical marker to supervise disease progression from MCI to AD. Again, it is important to underline the strong anatomoclinical correlation: the majority of MCI patients complained about memory difficulties, which is mirrored by GM atrophy in structures known to be involved in memory.
VBM in psychiatric disorders
I didn’t have the luxury of taking reality for granted. And I wouldn’t say I hated people who did […]. They didn’t live in my world. But that never stopped me from wishing I lived in theirs. Francesca Zappia, Made You Up
Diagnosis and differential diagnosis
Diagnosis
Although the neuroanatomical basis of most neurological diseases is relatively well understood, this is not true for psychiatric illnesses, which for a long time were considered “functional” disorders without a reliable neuroanatomical basis.58 The development of structural neuroimaging techniques such as VBM have provided substantial evidence that psychiatric diseases are associated with abnormalities in brain structure. This has brought about significant breakthroughs in our understanding of the neurobiology of such illnesses.7 The peculiarity of psychiatric disorders being brain disorders without a clear brain correlate makes them highly interesting. The psychiatric diseases are very heterogeneous and the differential diagnosis is often made difficult by the heterogeneity and inconsistency of symptoms and by the possible effect driven by drug therapies.59 Within these diseases, VBM has been extensively used for studying patterns of GM abnormalities in the context of psychosis, in particular schizophrenia (SCZ), a psychiatric disorder which involves distortions in thought and perception, blunted affect, and behavioral disturbances. SCZ has always been considered the most fascinating of all the psychoses and has inspired books (eg, “Spider” by Patrick McGrath), movies (“A Beautiful Mind”, based on the life of the Nobel Laureate John Nash), and art (the painter Salvador Dalì has been quoted as saying that the creative mind should mimic SCZ).
A number of VBM studies have been conducted to investigate brain volume abnormalities associated with the diagnosis of SCZ. However, these studies often reported inconsistent results that reflect the clinical heterogeneity of the included patients.4 In order to highlight consistent pattern of GM abnormalities across the studies, meta-analyses of VBM studies have been conducted. An early meta-analysis4 found that the most consistent GM differences between patients and controls are expressed as a smaller GM volume in the superior and medial temporal gyri in SCZ. A subsequent meta-analysis further expanded these results as it revealed GM structural findings in SCZ, characterized by bilateral anterior cortical (anterior cingulate gyrus/medial frontal cortex) and limbic (thalamus and left amygdale) GM abnormalities.60 Male sex, chronic illness, and negative symptoms were associated with more severe GM abnormalities.60 Moreover, compared to HCs, the patient group showed not only decreased GM, in particular in the right cuneus, the right superior frontal gyrus, and the right insula, but also increased GM in the bilateral putamen, the right parahippocampal gyrus, the left precentral gyrus, and the left inferior temporal gyrus.61
The heterogeneity of clinical manifestation of SCZ may be responsible for the inconsistency of the results in the literature. One possible way to overcome this limitation could be the investigation of brain alterations associated with specific symptoms. For example, Modinos et al62 meta-analyzed VBM studies examining the neural basis of auditory verbal hallucinations in SCZ patients and revealed a close association between the severity of hallucinations and GM volume reductions bilaterally in the superior temporal gyrus. The neural basis of a symptom rather than of a disease is still under investigation in psychiatric research, with few studies emerging in the last few years, but it could help to disentangle the conundrum of the anatomoclinical correlation of psychiatric symptoms in the near future.
Differential diagnosis
Together with SCZ, bipolar disorder (BD) is the most frequent psychiatric disorder. BD is a devastating mental disorder, affecting ∼1% of the population,63 characterized by remitting and relapsing episodes of depression and (hypo)mania and can also include psychotic symptoms.64
Although SCZ and BD are recognized as distinct disorders and clinical criteria have been defined for both, there is a frequent overlap of the clinical symptoms, especially in the early stage of the disease where the initial presentation of BD overlaps with either the depressive features of major depressive disorder or the maniac psychotic features of SCZ.64 This can pose serious problems in the differential diagnosis between the two psychiatric illnesses. As a result, there has been increasing interest in using VBM to better understand the distinctive impact of these pathologies on the morphology of the brain and hence to aid in differential diagnosis.
However, SCZ and BD not only share some clinical and behavioral symptoms but also some GM alterations. Interestingly, a recent meta-analysis of VBM studies investigated the presence of common areas of GM volume increase or decrease across Axis I diagnosis.7 GM volume in the anterior cingulated cortex and in the bilateral insulae has been found as consistently depleted in all the considered diagnoses, included SCZ and BD. Therefore, these brain regions are suggested as a transdiagnostic neural signature of psychiatric illness.7
Given that brain structural changes are a putative feature of SCZ and possibly also BD, recent studies focused their attention on the different patterns of reduced GM. Some authors compared both SCZ and BD to controls and found that, despite similarities of the involved brain regions, SCZ manifest more extensive prefrontal, thalamic, and hippocampal deficits than BD.65,66 In addition to hippocampus atrophy, a study also found smaller GM volume in the putamen and amygdale in SCZ compared to BD.67 Other authors directly compared GM volume between the two psychiatric disorders and highlighted a pattern of brain alterations that is suggestive of a more widespread GM alteration in chronic SCZ compared to chronic BD.68,69 In particular, both cortical (dorsolateral and medial prefrontal and precentral) and subcortical regions (putamen and thalamus) were found to be mainly involved in SCZ.
Overall, these findings suggest greater brain alteration in SCZ compared with BD, with significant overlap between the two disorders. These impressions have been confirmed by a meta-analysis of VBM studies on SCZ and BD,70 which highlight that SCZ is characterized by extensive GM deficit in frontal, temporal, cingulated, and insular cortices and thalamus, coupled with an increased GM in the basal ganglia. Similarly, BD is characterized by GM reduction in the anterior cingulated and bilateral insula only.
Prodromal stage
The first episode of a psychotic disorder is usually preceded by a prodromal period characterized by a progressive decline in functioning and the emergence of attenuated psychotic symptoms.71 Individuals with these clinical features are said to be at “ultra-high risk” (UHR) for psychosis. Individuals with a genetic liability, for example, because they have psychotic relatives, are considered UHR as well. Studies using VBM have examined whether UHR subjects are affected by neuroanatomical abnormalities. These have revealed that, relative to HCs, UHR subjects have reduced GM volume in frontal,72,73 lateral, and medial temporal regions.72 When dividing UHR groups into individuals with a genetic risk and those with attenuated psychotic symptoms and comparing them to a HC group, the former showed left anterior frontal, right caudate, a smaller right hippocampus, and an amygdala reduction, while the latter subgroup showed right middle temporal cortical reductions.66 Despite the variability of results reported in different studies, consistent results may be highlighted using meta-analysis. For example, a meta-analysis on 896 UHR revealed that individuals at UHR for psychosis consistently showed reduced GM volume compared with controls in the right superior temporal gyrus, left precuneus, left medial frontal gyrus, right middle frontal gyrus, bilateral parahippocampal/hippocampal regions, and bilateral anterior cingulated cortex.5
Transition from prodromal stage to full-blown disease
Despite GM abnormalities being found in UHR, not all people with these features progress to develop a full-blown psychotic disorder. Indeed, within 24 months, 20%–50% develop SCZ, but the remainding do not.74,75 Currently, no methods are available to identify patients who will develop a full-blown SCZ before the transition occurs, and no biomarkers exist for psychiatric disorders. Indeed, one goal for neuroimaging is to provide evidence to support the existence of neuroanatomical differences between UHR patients who develop psychosis and those who do not. One pioneering study in this field, which has the advantage of being multicentric, revealed that reduced left parahippocampal volume was specifically associated with the later onset of psychosis in UHR individuals.73 Therefore, alterations in this region may be crucial to the expression of illness. This result is consistent with previous literature; reductions in parahippocampal volume have been described in high-risk individuals with transient or isolated psychotic symptoms,76 and longitudinal reductions have been described in high-risk individuals who developed psychosis.77 However, this has not been consistently replicated.5,78
While the earlier reported studies might be intrinsically biased by the presence of subclinical SCZ individuals who have not yet experienced the first psychotic symptoms in the nontransition group, the neuroimaging studies in early psychosis show promise in the ability to identify core neurobiological alterations at the onset of the disorder. The study of the neuroanatomical alteration of patients who manifested the first episode of psychosis is advantageous since it allows the identification of brain alterations that are unrelated to treatment with antipsychotic medication. To date, hundreds of studies have been conducted on the first episode of psychosis, and data provided consistent evidence supporting a close relationship between structural and functional brain alterations in the medial frontal/anterior cingulate cortices and in the bilateral insulae, where patients showed a decrease in GM volume as well as abnormal functional response.79–82
Within those regions, the right insula has recently attracted a great deal of interest since its alterations are associated with a higher risk for transition to both psychosis78,83 and the first episode of psychosis.82 Remarkably, a smaller GM volume in this region has been found to be a consistent datum not only across different psychiatric diagnoses, as reported in the previous paragraph,7 but also across different ethnic groups.84 This is in line with the notion of a neuroanatomical signature of early SCZ above and beyond ethnic differences in the manifestation of the disease.85 Moreover, the GM volume in the right anterior insula seems to be inversely related to both negative and positive symptomatology, such that the insula becomes smaller as symptoms become more severe.83 In conclusion, the right anterior insular alteration could reflect cognitive impairment and/or emotional dysfunction – two deficits have been associated with anterior insular alteration and that tend to co-occur across developmental and adult disorders.86,87
In conclusion, the research on neuroanatomical correlates of psychiatric disorders is made difficult by 1) the heterogeneity of clinical manifestation of the disease across subjects; 2) possible and still underinvestigated effect of drug therapy on brain structure; and 3) still weak knowledge of anatomoclinical correlation in psychiatry.
Future research should be focused on the investigation of the neural basis of symptoms, rather than of disorder, in order to reduce variability across studies.
Translation to clinical practice
I’d looked at hundreds of psychopaths’ brains in my career, but the consistency of their brain abnormalities never ceased to amaze me. Kent Kiehl, The Psychopath Whisperer
The majority of research cited in the previous paragraphs reported group-level results, that is, results obtained by comparing two groups of individuals. Indeed, a classical VBM study compares a group of patients with a group of HCs and tests for neuroanatomical differences between the two groups relying on parametric statistics, which required the data to be normally distributed. However, the results of these studies have had limited translational impact in everyday clinical practice,88–90 where a clinician needs to make inferences at the level of the individual patient. In recent years, an increasing number of research groups have attempted to overcome this by performing single-case studies in which an individual patient is compared against a group of HCs. Table 1, an update of the table presented in our previous work,91 summarizes the existing studies using single-case VBM.
 | Table 1 Single-case VBM studies Notes: Anatomoclinical correlation column refers to the existence of a correspondence between the brain regions emerged from the analysis and the clinical symptoms manifested by the patients. For each manuscript, “yes” or “no” is reported based on whether the anatomoclinical correlation has been highlighted and explained by the authors. When this correspondence has not been evaluated, “UK” (unknown) is reported in the table. ♂, male; ♀, female. Abbreviations: L, left; R, right; UK, unknown; REM, rapid eye movements; TBI, traumatic brain injury; PPA, primary progressive aphasia; PCA, posterior cortical atrophy; SD, semantic dementia; HD, Huntington disease; FTD, frontotemporal dementia; FTD, frontotemporal dementia; CBD, corticobasal degeneration; AD, Alzheimer’s disease; HME, hereditary multiple exostoses; JME, Jouvenile myoclonic epilepsy; FCD, focal cortical dysplasia; IPL, inferior parietal lobule; SMA, supplementary motor area; M1, primary motor area; MFG, medial frontal gyrus; STG, superior temporal gyrus; ITG, inferior temporal gyrus; IFG, inferior frontal gyrus; SFG, superior frontal gyrus; ACC, anterior cingulate cortex; OFC, orbitofrontal cortex; DLPFC, dorsolateral prefrontal cortex; FWE, family-wise error; FDR, false discovery rate; TIV, total intracranial volume. |
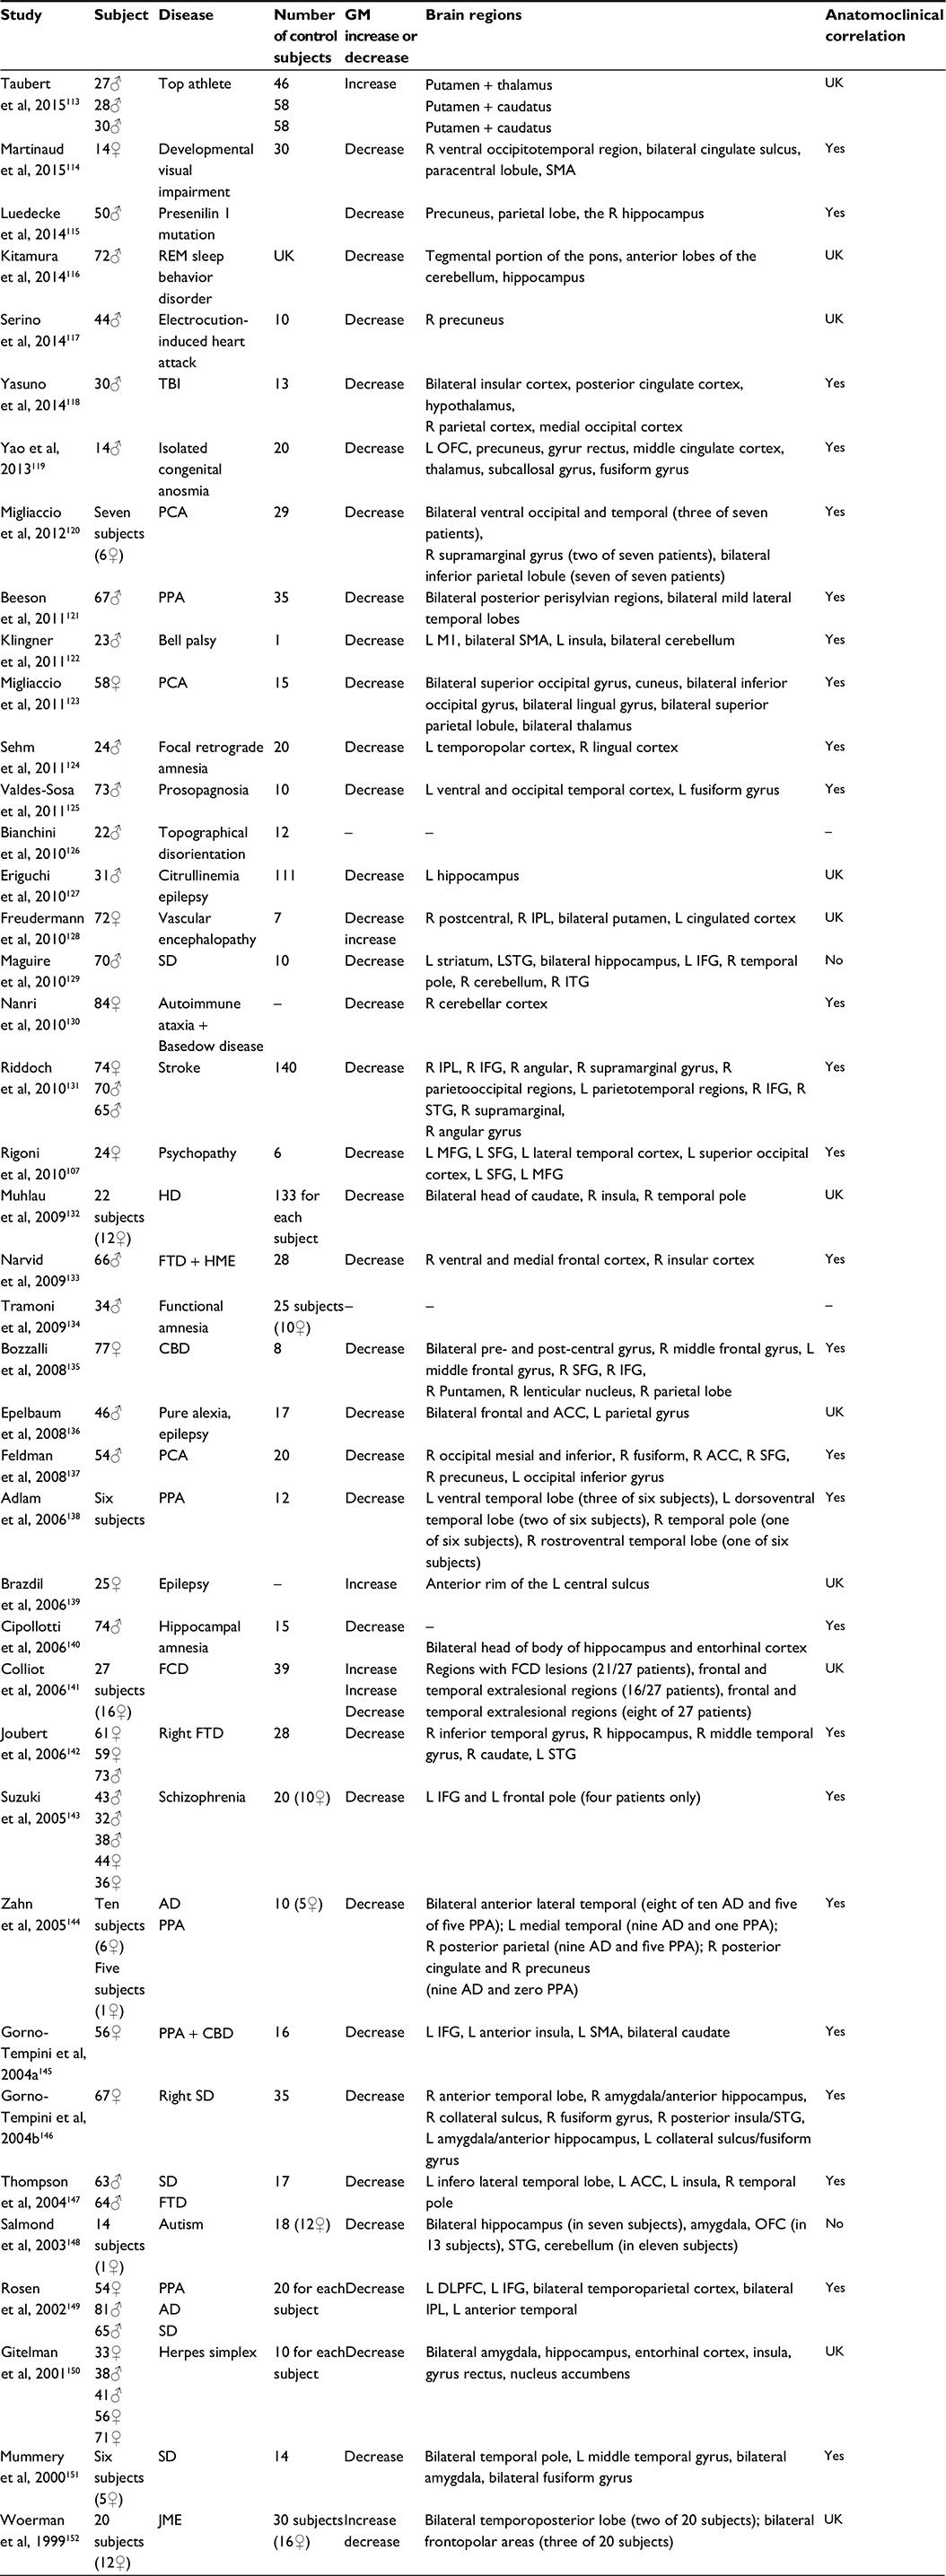
Although the standard VBM technique is suitable for comparing groups of individuals,17 the assumptions of group-level parametric statistics are no longer met when an individual subject is compared against a group of subjects, resulting in very high false-positive rates,91 despite the use of the appropriate statistical corrections (Figure 1, top panel). In other words, in single-case VBM studies, disease-free individuals’ brains are often identified as abnormal. However, as reported in the previous paragraph, single-case VBM is widely used to investigate neuroanatomical abnormalities in individual subjects. Because of this, there is an urgent need for alternative analytical approaches that could be used to examine neuroanatomical abnormalities in individual subjects without suffering from high false-positive rates. Since the high rates of false positives arise from the statistic on which the classical VBM relies (because the data cannot be normally distributed by definition in single-case analysis), one possible solution seems to be the use of nonparametric statistics in VBM. This allows the examination of neuroanatomical abnormalities in individual subjects without the very high false-positive rates that have been reported with standard single-case VBM92 (Figure 1, bottom panel). However, this alternative approach solves a problem but creates another: when using nonparametric statistics, a control group of at least 100 individuals is required in order to accurately compute the P-value.92 The requirement for such a large control group makes the use of nonparametric statistics impractical in a clinical setting, where it is usually difficult to have such a large control group.
 | Figure 1 Distribution of false positives in parametric and nonparametric single-case VBM. Notes: In the top panel, the figure represents the percentage of false positives found in each brain regions when using parametric statistics with P=0.05 FWE correction: colors reflected the percentage of false positives (adapted from Neuroimage, 70, Scarpazza C, Sartori G, De Simone M, Mechelli A, When the single matters more than the group: very high false positive rates in single case voxel based morphometry, 175–188,91 Copyright ©2013, with permission from Elsevier.). In the bottom panel, the figure represents the localization of false positives based on peak coordinates with P=0.05 FWE correction (adapted from Scarpazza C, Nichols T, Seramondi D, Maumet C, Sartori G, MechelliA. When the single matters more than the group (II): addressing the problem of high false positive rates in single case voxel based morphometry using non-parametric statistics. Front Neurosci. 2016;10:6.92): colors reflected the different brain regions in which the false positives were found to be located. In both panels, (A) GM increases in the single subject compared with the control group at P<0.05 corrected and (B) GM decreases in the single subject compared with the control group at P<0.05 corrected. Abbreviations: VBM, voxel-based morphometry; FWE, family-wise error; GM, gray matter. |
Besides the statistical issue, the interpretation of the results is also tricky. Indeed, it is worth noting that, when using the classical VBM approach that relies on parametric statistics, the false positives appeared to be mainly located in the frontal and temporal lobes.91 Ironically, these are also the areas of the brain that are typically affected in most psychiatric and neurological disorders, further complicating the interpretation of the results of single-case studies in these clinical populations. However, it is important not to fall into the base rate fallacy error – the tendency to ignore the existence of some a priori data. In this specific context, it is important not to ignore the fact that different brain regions are more likely to be affected in each specific disease. For example, a recent meta-analysis of VBM studies93 found that group-level anatomical differences between schizophrenic patients and controls are more likely to be expressed in the anterior cingulated, medial, inferior frontal, and temporal cortices. Thus, if a single-case VBM analysis highlights lower frontal GM values in a patient who show clinical symptoms suggestive of SCZ, this result is more likely to reflect a true positive than a false positive, even if this specific brain region suffers from high false-positive rate. This is because the a priori probability for SCZ to be expressed as decreased GM within the frontal lobe is high, based on previous literature. Contrarily, if a significant finding in the frontal lobe will be found in a comparison between a patient with cortical posterior atrophy (which involves the posterior part of the brain by definition) and a control group, this is more likely to reflect a false positive.
The single-subject analysis using VBM could in the future have transdiagnostic applications across psychiatry and neurology. However, the research on single-case VBM analysis is still in its infancy. To date, it is clear that VBM might be helpful in the diagnostic process but it should be used with caution, always remembering the error rate and understanding that a statistically significant result could be considered indicative of a brain disease only if a correspondence between the brain region emerged from the analysis and the clinical symptoms manifested by the patients (the so-called anatomoclinical correlation; Table 1) is highlighted. However, VBM usefulness to predict the patients’ decline or to predict the success of therapies (pharmacological or not) or to longitudinally monitor the clinical course of patients is still unknown.
Forensic perspective
DB life history was full of facts that might indicate brain abnormalities. […] The legal team wanted to make the argument that psychopathy constituted a developmental disorder of emotion, and the new neuroscience might help make their point. Kent Kiehl, The Psychopath Whisperer
VBM has been widely used in order to investigate whether structural brain abnormalities exist within those who are criminals compared to those who are not. For example, Puri et al94 detected significant smaller GM volume in schizophrenic patients who had a history of serious and violent offending, compared with schizophrenic patients without such a history. The differences between the groups were located in the cerebellum and in the supramarginal gyrus, brain regions involved in the verbal working memory.94 Moreover, significant GM reductions in the frontal and temporal brain regions of violent psychopaths compared with nonviolent psychopaths have been found.95 Interestingly, Schiffer et al96 found smaller GM volume in the ventral striatum and in the orbitofrontal cortex of the brains of those with pedophiliac tendencies when compared with those of homosexual and heterosexual subjects. Importantly, this latter study has been cited in order to point out that it does not investigate a criminal behavior, rather the sexual orientation of subjects. Indeed, individuals with pedophiliac tendencies do not necessarily engage in sexually deviant or criminal acts.
Although there are hundreds of studies investigating the neural basis of criminal and deviant behaviors by means of VBM, the majority are based on group analysis. As for the clinical setting, the translation from group to individual analysis is problematic. In the previous paragraph, we described the statistical issue causing high false-positive rates and the problem of the interpretation of the results. These problems are also present in forensic settings where the most critical issue is how results are interpreted.
In the following paragraphs, we are describing how single-case VBM and the error probability map should be used at individual level when applied to the forensic setting. As a general premise, we would like to emphasize that the aim of this work is not to enter into a forensic debate but only to describe a possible use of VBM in this field. It is important also to underline that we are perfectly aware that VBM results alone, that is, without a clear clinical correlate, do not have any forensic meaning since incompetency or diminished responsibility is considered to be proven if evidence is given of a causal link between a pathological mental state and the criminal behavior. Thus, the criteria to determine responsibility are, and should always be, behavioral. VBM is only helpful in providing objective support to the behavioral findings. Moreover, the use of VBM as a supporting evidence in the courtroom does not presuppose the belief in the existence of a one-to-one correspondence between brain states and behavior. It is a well-established fact in contemporary neuropsychology that brain alterations are mere risk factors for the occurrence of abnormal behaviors.97 For a critical discussion on the use of neuroscientific findings into forensic setting, refer Sartori et al.98
The results of our previous investigation91 could be particularly useful for the assessment of mental insanity in a forensic setting. Such assessment is made complicated by the fact that psychiatric symptoms can be easily faked or exaggerated and that most defendants assessed for mental insanity do not have a previous psychiatric history. Indeed, in psychiatry, the diagnosis is usually possible only by basing it on the symptoms complained of by the patients – and this is a critical difference between psychiatric and neurological disorders. For instance, if a patient complains of memory deficits, neuropsychological tests are available to test the genuineness of the symptom.99 On the other hand, if a patient complains of hallucinations, clinicians have no objective measures to explore whether the patient is actually experiencing hallucinations or if he is simply feigning them. While in the clinical setting usually there is no reason to suspect a malingering of the symptoms, obviously the forensic context is profoundly different. One strategy for dealing with malingering psychiatric disorders consists of validating the reported symptoms with an anatomoclinical correlation.98,100 Importantly, the possibility to quantify the error in single-case VBM makes this technique suitable to be used as an instrument in a forensic setting, although with extreme caution. Indeed, single-case VBM now reflects the Daubert criteria, accepted worldwide for scientific evidence to be admissible in court101 (ie, whether the method is verifiable, whether the method can be falsified, the awareness of the error rate, and acceptance by the scientific experts after a scientific peer review).
The use of VBM in the forensic setting might be traced back to 2009, when the brain of the serial killer DB has been compared with the brain of HCs. In this specific case, the legal team asked an expert to determine whether DB’s brain could be considered compatible with the established clinical diagnosis of psychopathy. Results revealed a pattern of atrophy in DB brain similar to those observed in psychopathic individuals,102–105 that is, the paralimbic system appeared to be smaller in BD compared with HCs. Note that DB scored in the 99th percentile on the Psychopathy Checklist. Thus, the VBM results supported the clinical findings.106
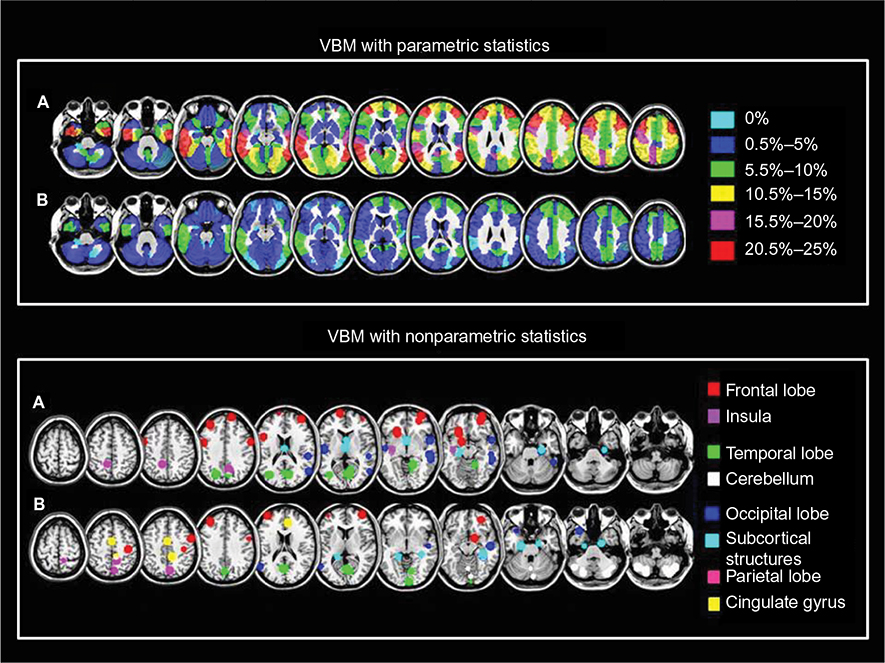
To date, only one criminal case in which VBM has been used in forensic setting has been published. The defendant was a young woman convicted for a second-degree murder.107 The defendant underwent a forensic psychiatric evaluation in order to explore her psychopathological profile. In addition, she also underwent a neuropsychological examination in order to determine if she was able to inhibit her impulses. Her psychopathological profile revealed impulsivity, lack of sensitivity, rejection of conventional standards, and inability to consider alternative solutions to the problems. Moreover, the neuropsychological tests unveiled her inability to inhibit the prominent response, to attribute emotional states to others, and to identify the violation of social norms. Interestingly, both the psychopathological and neuropsychological evaluations provided convergent results suggestive of frontal lobe dysfunction.108–110 Critically, the VBM results revealed two clusters of decreased GM volume in the defendant compared with the control groups, both of them located in the frontal lobe, specifically in the left middle and superior frontal lobe. Let us try to anachronistically interpret these results on the light of the findings of Scarpazza et al91 (the 2013 paper publishing the error probability and distribution map was not available in 2010): when investigating the likelihood of a decreased GM volume in the brain of a single subject with the brain of a control group, the probability to find a false positive in the left middle frontal gyrus ranges from 0.5% to 5%, while in the left superior frontal gyrus ranges from 5.5% to 10%. In Figure 2, to visually compare the results of the murderer107 with the probability distribution map of false positives has been shown.91 Although the detected brain abnormalities in the murderer are located in brain regions suffering from a relatively high degree of false positives, the reported results closely mirrored the psychopathological and neuropsychological results, thus decreasing the possibility to be false positives.
 | Figure 2 Example of single-case VBM. Notes: The figure represents (A) the localization of false positives when investigating the decrease of GM in a single subject compared with a control group (in which the light blue means the absence of false positives, the blue a false-positive rate from 0.5% to 5%, and the green a false-positive rate from 5.5% to 10%) and (B) the localization of significant findings in a murderer compared with a control group (Rigoni et al107). (A) Adapted from Neuroimage, 70, Scarpazza C, Sartori G, De Simone M, Mechelli A, When the single matters more than the group: very high false positive rates in single case voxel based morphometry, 175–188,91 Copyright ©2013, with permission from Elsevier. Abbreviations: VBM, voxel-based morphometry; GM, gray matter. |
This case has been reported here in order to highlight which should be the usefulness of VBM in forensic setting: although the use of VBM in court cannot change the rationale underlying the determination of criminal liability, which must be based on a causal association between a mental disorder and a crime,98 VBM may provide objective, biological data that can be used to reduce controversy in forensic psychiatric evaluations of mental insanity.
As a final note, it is important to underline that it is not possible to reason backward – inferring the presence of a neuropsychological or behavioral deficit from the presence of significant results at VBM: this is called “reverse inference”111 and is not deductively valid.
Conclusion
This review has highlighted the utility of VBM in the diagnosis (differential and early diagnosis) of both neurological and psychiatric disorders. Moreover, it has focused on the potential clinical translation of this technique and its forensic application. In the last two paragraphs, we have tried to convey the message that VBM results are meaningless if they are not supported by the clinical symptoms complained of by the patient. Thus, the message that should be remembered when applying VBM to the single individual is the following: when a statistically significant result is detected, it should be interpreted in the light of 1) its coherence with the patient’s symptoms and 2) its coherence with the results of previous literature.
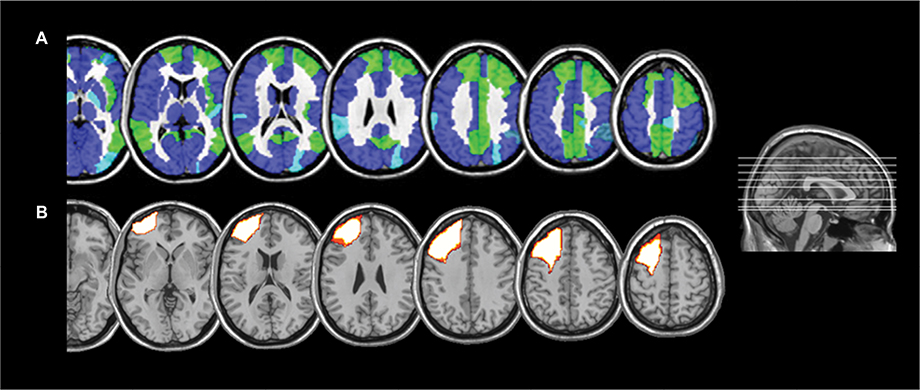
As a provocative and final note, we would like to present the VBM results of a single-case comparison: one of the authors’ brain has been compared with the brain of other healthy volunteers. Figure 3 shows GM increases in the author’s brain compared to the control group. In particular, the GM increases are located in the dorsolateral prefrontal cortex.
 | Figure 3 The risk of reverse inference. Notes: (A) Author’s brain compared with 16 controls (Reprinted from Neuroimage, 70, Scarpazza C, Sartori G, De Simone M, Mechelli A, When the single matters more than the group: very high false positive rates in single case voxel based morphometry, 175–188,91 Copyright ©2013, with permission from Elsevier). The significant cluster denotes increased GM in the single brain compared to controls located in the dorsolateral prefrontal cortex. According to Scarpazza et al,91 this cluster has up to 10% of likelihood to be a false positive. (B) Smaller GM volume in binge drinkers compared with healthy controls, adapted from Doallo S, Cadaveira F, Corral M, Mota N, López-Caneda E, Holguín S. Larger mid-dorsolateral prefrontal gray matter volume in young binge drinkers revealed by voxel-based morphometry. PLoS One. 2014;9(5):e96380.112 The significant cluster is located in the dorsolateral prefrontal cortex. Abbreviation: GM, gray matter. |
What does this mean? Using existing literature to interpret the results: I am a binge drinker then!112 This is a wonderful example showing the risk of “reverse inference” since VBM results alone (ie, not coupled with clinical symptoms) are meaningless. The truth is that I am teetotal. The other author is still laughing.
Disclosure
The authors report no conflicts of interest in this work.
References
Whitwell J, Josephs K, Rossor M, et al. Magnetic resonance imaging signatures of tissue pathology in frontotemporal dementia. Arch Neurol. 2005;62(9):1402–1408. | ||
Ferreira L, Diniz B, Forlenza O, Busatto G, Zanetti M. Neurostructural predictors of Alzheimer’s disease: a meta-analysis of VBM studies. Neurobiol Aging. 2011;32(10):1733–1741. | ||
Li J, Pan P, Huang R, Shang H. A meta-analysis of voxel-based morphometry studies of white matter volume alterations in Alzheimer’s disease. Neurosci Biobehav Rev. 2012;36(2):757–763. | ||
Honea R, Crow T, Passingham D, Mackay C. Regional deficits in brain volume in schizophrenia: a meta-analysis of voxel-based morphometry studies. Am J Psychiatry. 2005;162(12):2233–2245. | ||
Fusar-Poli P, Borgwardt S, Crescini A, et al. Neuroanatomy of vulnerability to psychosis: a voxel-based meta-analysis. Neurosci Biobehav Rev. 2011;35(5):1175–1185. | ||
Selvaraj S, Arnone D, Job D, et al. Grey matter differences in bipolar disorder: a meta-analysis of voxel-based morphometry studies. Bipolar Disord. 2012;14(2):135–145. | ||
Goodkind M, Eickhoff S, Oathes D, et al. Identification of a common neurobiological substrate for mental illness. JAMA Psychiatry. 2015;72(4):305–315. | ||
Ashburner J, Friston K. Voxel-based morphometry – the methods. Neuroimage. 2000;11(6):805–821. | ||
Ashburner J, Friston K. Why voxel-based morphometry should be used. Neuroimage. 2001;14(6):1238–1243. | ||
Good C, Johnsrude I, Ashburner J, Henson R, Friston K, Frackowiak R. A voxel-based morphometric study of ageing in 465 normal adult human brains. Neuroimage. 2001;14(1 pt 1):21–36. | ||
Mechelli A, Price C, Friston K, Ashburner J. Voxel-based morphometry of the human brain: methods and applications. Curr Med Imaging Rev. 2005;1(2):105–113. | ||
Wang W, Yu J, Liu Y, et al. Voxel-based meta-analysis of grey matter changes in Alzheimer’s disease. Transl Neurodegener. 2015;4(1):6. | ||
Giuliani N, Calhoun V, Pearlson G, Francis A, Buchanan R. Voxel-based morphometry versus region of interest: a comparison of two methods for analyzing gray matter differences in schizophrenia. Schizophr Res. 2005;74(2–3):135–147. | ||
Davies R, Scahill V, Graham A, Williams G, Graham K, Hodges J. Development of an MRI rating scale for multiple brain regions: comparison with volumetrics and with voxel-based morphometry. Neuroradiology. 2009;51(8):491–503. | ||
Focke N, Trost S, Paulus W, Falkai P, Gruber O. Do manual and voxel-based morphometry measure the same? A proof of concept study. Front Psychiatry. 2014;5:39. | ||
Kurth F, Gaser C, Luders E. A 12-step user guide for analyzing voxel-wise gray matter asymmetries in statistical parametric mapping (SPM). Nat Protoc. 2015;10(2):293–304. | ||
Scarpazza C, Tognin S, Frisciata S, Sartori G, Mechelli A. False positive rates in voxel-based morphometry studies of the human brain: should we be worried? Neurosci Biobehav Rev. 2015;52:49–55. | ||
White P, Rickards H, Zeman A. Time to end the distinction between mental and neurological illnesses. BMJ. 2012;344:e3454–e3454. | ||
Crossley N, Scott J, Ellison-Wright I, Mechelli A. Neuroimaging distinction between neurological and psychiatric disorders. Br J Psychiatry. 2015;207(5):429–434. | ||
Knopman D, DeKosky S, Cummings J, et al. Practice parameter: diagnosis of dementia (an evidence-based review): report of the Quality Standards Subcommittee of the American Academy of Neurology. Neurology. 2001;56(9):1143–1153. | ||
Karas G, Burton E, Rombouts S, et al. A comprehensive study of gray matter loss in patients with Alzheimer’s disease using optimized voxel-based morphometry. Neuroimage. 2003;18(4):895–907. | ||
Hirata Y, Matsuda H, Nemoto K, et al. Voxel-based morphometry to discriminate early Alzheimer’s disease from controls. Neurosci Lett. 2005;382(3):269–274. | ||
Bozzali M, Filippi M, Magnani G, et al. The contribution of voxel-based morphometry in staging patients with mild cognitive impairment. Neurology. 2006;67(3):453–460. | ||
Matsuda H, Mizumura S, Nemoto K, et al. Automatic voxel-based morphometry of structural MRI by SPM8 plus diffeomorphic anatomic registration through exponentiated lie algebra improves the diagnosis of probable Alzheimer disease. AJNR Am J Neuroradiol. 2012;33(6):1109–1114. | ||
Guo Y, Zhang Z, Zhou B, et al. Grey-matter volume as a potential feature for the classification of Alzheimer’s disease and mild cognitive impairment: an exploratory study. Neurosci Bull. 2014;30(3):477–489. | ||
Chetelat G, Baron J. Early diagnosis of alzheimer’s disease: contribution of structural neuroimaging. Neuroimage. 2003;18(2):525–541. | ||
Braak H, Braak E. Staging of alzheimer’s disease-related neurofibrillary changes. Neurobiol Aging. 1995;16(3):271–278. | ||
Jin K, Peel A, Mao X, et al. Increased hippocampal neurogenesis in Alzheimer’s disease. Proc Natl Acad Sci U S A. 2003;101(1):343–347. | ||
Lau J, Lerch J, Sled J, Henkelman R, Evans A, Bedell B. Longitudinal neuroanatomical changes determined by deformation-based morphometry in a mouse model of Alzheimer’s disease. Neuroimage. 2008;42(1):19–27. | ||
Baron J, Chételat G, Desgranges B, et al. In vivo mapping of gray matter loss with voxel-based morphometry in mild Alzheimer’s disease. Neuroimage. 2001;14(2):298–309. | ||
Frisoni G, Testa C, Zorzan A, et al. Detection of grey matter loss in mild Alzheimer’s disease with voxel based morphometry. J Neurol Neurosurg Psychiatry. 2002;73(6):657–664. | ||
Matsuda H, Kitayama N, Ohnishi T, et al. Longitudinal evaluation of both morphologic and functional changes in the same individuals with Alzheimer’s disease. J Nucl Med. 2002;43(3):304–311. | ||
Shiino A, Watanabe T, Maeda K, Kotani E, Akiguchi I, Matsuda M. Four subgroups of Alzheimer’s disease based on patterns of atrophy using VBM and a unique pattern for early onset disease. Neuroimage. 2006;33(1):17–26. | ||
Xie S, Xiao J, Gong G, et al. Voxel-based detection of white matter abnormalities in mild Alzheimer disease. Neurology. 2006;66(12):1845–1849. | ||
Kinkingnehun S, Sarazin M, Lehericy S, Guichart-Gomez E, Hergueta T, Dubois B. VBM anticipates the rate of progression of Alzheimer disease: a 3-year longitudinal study. Neurology. 2008;70(23):2201–2211. | ||
Ishii K, Kawachi T, Sasaki H, et al. Voxel-based morphometric comparison between early- and late-onset mild Alzheimer’s disease and assessment of diagnostic performance of Z score images. Am J Neuroradiol. 2005;26(2):333–340. | ||
Paola M, Macaluso E, Carlesimo G, et al. Episodic memory impairment in patients with Alzheimer’s disease is correlated with entorhinal cortex atrophy. J Neurol. 2007;254(6):774–781. | ||
Rombouts S, Barkhof F, Witter M, Scheltens P. Unbiased whole-brain analysis of gray matter loss in Alzheimer’s disease. Neurosci Lett. 2000;285(3):231–233. | ||
Yang J, Pan P, Song W, et al. Voxelwise meta-analysis of gray matter anomalies in Alzheimer’s disease and mild cognitive impairment using anatomic likelihood estimation. J Neurol Sci. 2012;316(1–2):21–29. | ||
Muñoz-Ruiz M, Hartikainen P, Koikkalainen J, et al. Structural MRI in frontotemporal dementia: comparisons between hippocampal volumetry, tensor-based morphometry and voxel-based morphometry. PLoS One. 2012;7(12):e52531. | ||
Boxer A, Rankin K, Miller B, et al. Cinguloparietal atrophy distinguishes Alzheimer disease from semantic dementia. Arch Neurol. 2003;60(7):949–956. | ||
Rabinovici G, Seeley W, Kim E, et al. Distinct MRI atrophy patterns in autopsy-proven Alzheimer’s disease and frontotemporal lobar degeneration. Am J Alzheimers Dis Other Demen. 2008;22(6):474–488. | ||
Möller C, Hafkemeijer A, Pijnenburg Y, et al. Different patterns of cortical gray matter loss over time in behavioral variant frontotemporal dementia and Alzheimer’s disease. Neurobiol Aging. 2016;38:21–31. | ||
Petersen R. Mild cognitive impairment as a diagnostic entity. J Intern Med. 2004;256(3):183–194. | ||
Chong M, Sahadevan S. Preclinical Alzheimer’s disease: diagnosis and prediction of progression. Lancet Neurol. 2005;4(9):576–579. | ||
Chetelat G, Desgranges B, de la Sayette V, Viader F, Eustache F, Baron J. Mapping gray matter loss with voxel-based morphometry in mild cognitive impairment. Neuroreport. 2002;13(15):1939–1943. | ||
Karas G, Scheltens P, Rombouts S, et al. Global and local gray matter loss in mild cognitive impairment and Alzheimer’s disease. Neuroimage. 2004;23(2):708–716. | ||
Pennanen C. A voxel based morphometry study on mild cognitive impairment. J Neurol Neurosurg Psychiatry. 2005;76(1):11–14. | ||
Bell-McGinty S, Lopez O, Meltzer C, et al. Differential cortical atrophy in subgroups of mild cognitive impairment. Arch Neurol. 2005;62(9):1393–1397. | ||
Whitwell J, Petersen R, Negash S, et al. Patterns of atrophy differ among specific subtypes of mild cognitive impairment. Arch Neurol. 2007;64(8):1130–1138. | ||
Serra L, Giulietti G, Cercignani M, et al. Mild cognitive impairment: same identity for different entities. J Alzheimers Dis. 2013;33(4):1157–1165. | ||
Gauthier S, Reisberg B, Zaudig M, et al. Mild cognitive impairment. Lancet. 2006;367(9518):1262–1270. | ||
Chételat G, Landeau B, Eustache F, et al. Using voxel-based morphometry to map the structural changes associated with rapid conversion in MCI: a longitudinal MRI study. Neuroimage. 2005;27(4):934–946. | ||
Hämäläinen A, Tervo S, Grau-Olivares M, et al. Voxel-based morphometry to detect brain atrophy in progressive mild cognitive impairment. Neuroimage. 2007;37(4):1122–1131. | ||
Karas G, Sluimer J, Goekoop R, et al. Amnestic mild cognitive impairment: structural MR imaging findings predictive of conversion to Alzheimer disease. Am J Neuroradiol. 2008;29(5):944–949. | ||
Chételat G, Fouquet M, Kalpouzos G, et al. Three-dimensional surface mapping of hippocampal atrophy progression from MCI to AD and over normal aging as assessed using voxel-based morphometry. Neuropsychologia. 2008;46(6):1721–1731. | ||
Risacher S, Saykin A, Wes J, Shen L, Firpi H, McDonald B. Baseline MRI predictors of conversion from MCI to probable AD in the ADNI cohort. Curr Alzheimer Res. 2009;6(4):347–361. | ||
Dolan R. Neuroimaging of cognition: past, present, and future. Neuron. 2008;60(3):496–502. | ||
Zipursky R, Reilly T, Murray R. The myth of schizophrenia as a progressive brain disease. Schizophr Bull. 2013;39(6):1363–1372. | ||
Bora E, Fornito A, Radua J, et al. Neuroanatomical abnormalities in schizophrenia: a multimodal voxelwise meta-analysis and meta-regression analysis. Schizophr Res. 2011;127(1–3):46–57. | ||
Xiao Y, Zhang W, Lui S, Yao L, Gong Q. Similar and different gray matter deficits in schizophrenia patients and their unaffected biological relatives. Front Psychiatry. 2013;4:150. | ||
Modinos G, Costafreda S, van Tol M, McGuire P, Aleman A, Allen P. Neuroanatomy of auditory verbal hallucinations in schizophrenia: a quantitative meta-analysis of voxel-based morphometry studies. Cortex. 2013;49(4):1046–1055. | ||
Merikangas K, Akiskal H, Angst J, et al. Lifetime and 12-month prevalence of bipolar spectrum disorder in the national comorbidity survey replication. Arch Gen Psychiatry. 2007;64(5):543–552. | ||
Haenisch F, Cooper J, Reif A, et al. Towards a blood-based diagnostic panel for bipolar disorder. Brain Behav Immun. 2016;52:49–57. | ||
Yüksel C, McCarthy J, Shinn A, et al. Gray matter volume in schizophrenia and bipolar disorder with psychotic features. Schizophr Res. 2012;138(2–3):177–182. | ||
Nenadic I, Maitra R, Dietzek M, et al. Prefrontal gyrification in psychotic bipolar I disorder vs. schizophrenia. J Affect Disord. 2015;185:104–107. | ||
Brown G, Lee J, Strigo I, Caligiuri M, Meloy M, Lohr J. Voxel-based morphometry of patients with schizophrenia or bipolar I disorder: a matched control study. Psychiatry Res. 2011;194(2):149–156. | ||
Molina V, Galindo G, Cortés B, et al. Different gray matter patterns in chronic schizophrenia and chronic bipolar disorder patients identified using voxel-based morphometry. Eur Arch Psychiatry Clin Neurosci. 2011;261(5):313–322. | ||
Bora E, Fornito A, Yücel M, Pantelis C. The effects of gender on grey matter abnormalities in major psychoses: a comparative voxelwise meta-analysis of schizophrenia and bipolar disorder. Psychol Med. 2012;42(2):295–307. | ||
Ellison-Wright I, Bullmore E. Anatomy of bipolar disorder and schizophrenia: a meta-analysis. Schizophr Res. 2010;117(1):1–12. | ||
McGorry P, Nelson B, Amminger G, et al. Intervention in individuals at ultra-high risk for psychosis. J Clin Psychiatry. 2009;70(9):1206–1212. | ||
Meisenzahl E, Koutsouleris N, Gaser C, et al. Structural brain alterations in subjects at high-risk of psychosis: a voxel-based morphometric study. Schizophr Res. 2008;102(1–3):150–162. | ||
Mechelli A, Riecher-Rössler A, Meisenzahl E, et al. Neuroanatomical abnormalities that predate the onset of psychosis. Arch Gen Psychiatry. 2011;68(5):489. | ||
Cannon T, Cornblatt B, McGorry P. Editor’s introduction: the empirical status of the ultra high-risk (prodromal) research paradigm. Schizophr Bull. 2007;33(3):661–664. | ||
Riecher-Rössler A, Pflueger M, Aston J, et al. Efficacy of using cognitive status in predicting psychosis: a 7-year follow-up. Biol Psychiatry. 2009;66(11):1023–1030. | ||
Job D, Whalley H, Johnstone E, Lawrie S. Grey matter changes over time in high risk subjects developing schizophrenia. Neuroimage. 2005;25(4):1023–1030. | ||
Buehlmann E, Berger G, Aston J, et al. Hippocampus abnormalities in at risk mental states for psychosis? A cross-sectional high resolution region of interest magnetic resonance imaging study. J Psychiatr Res. 2010;44(7):447–453. | ||
Fusar-Poli P, Radua J, McGuire P, Borgwardt S. Neuroanatomical maps of psychosis onset: voxel-wise meta-analysis of antipsychotic-naive VBM Studies. Schizophr Bull. 2012;38(6):1297–1307. | ||
Radua J, Borgwardt S, Crescini A, et al. Multimodal meta-analysis of structural and functional brain changes in first episode psychosis and the effects of antipsychotic medication. Neurosci Biobehav Rev. 2012;36(10):2325–2333. | ||
Chan R, Di X, McAlonan G, Gong Q. Brain anatomical abnormalities in high-risk individuals, first-episode, and chronic schizophrenia: an activation likelihood estimation meta-analysis of illness progression. Schizophr Bull. 2011;37(1):177–188. | ||
Glahn D, Laird A, Ellison-Wright I, et al. Meta-analysis of gray matter anomalies in schizophrenia: application of anatomic likelihood estimation and network analysis. Biol Psychiatry. 2008;64(9):774–781. | ||
Ellison-Wright I, Glahn D, Laird A, Thelen S, Bullmore E. The anatomy of first-episode and chronic schizophrenia: an anatomical likelihood estimation meta-analysis. Am J Psychiatry. 2008;165(8):1015–1023. | ||
Smieskova R, Fusar-Poli P, Aston J, et al. Insular volume abnormalities associated with different transition probabilities to psychosis. Psychol Med. 2012;42(8):1613–1625. | ||
Gong Q, Dazzan P, Scarpazza C, et al. A neuroanatomical signature for Schizophrenia across different ethnic groups. Schizophr Bull. 2015;41(6):1266–1275. | ||
Kalra G, Bhugra D, Shah N. Cultural aspects of schizophrenia. Int Rev Psychiatry. 2012;24(5):441–449. | ||
Takeuchi H, Taki Y, Sassa Y, et al. Regional gray matter density associated with emotional intelligence: evidence from voxel-based morphometry. Hum Brain Mapp. 2011;32(9):1497–1510. | ||
Giuliani N, Drabant E, Bhatnagar R, Gross J. Emotion regulation and brain plasticity: expressive suppression use predicts anterior insula volume. Neuroimage. 2011;58(1):10–15. | ||
Borgwardt S, Radua J, Mechelli A, Fusar-Poli P. Why are psychiatric imaging methods clinically unreliable? Conclusions and practical guidelines for authors, editors and reviewers. Behav Brain Funct. 2012;8(1):46. | ||
Ioannidis J. Excess significance bias in the literature on brain volume abnormalities. Arch Gen Psychiatry. 2011;68(8):773–780. | ||
Borgwardt S, Fusar-Poli P. Third-generation neuroimaging in early schizophrenia: translating research evidence into clinical utility. Br J Psychiatry. 2012;200(4):270–272. | ||
Scarpazza C, Sartori G, De Simone M, Mechelli A. When the single matters more than the group: very high false positive rates in single case voxel based morphometry. Neuroimage. 2013;70:175–188. | ||
Scarpazza C, Nichols T, Seramondi D, Maumet C, Sartori G, Mechelli A. When the single matters more than the group (II): addressing the problem of high false positive rates in single case voxel based morphometry using non-parametric statistics. Front Neurosci. 2016;10:6. | ||
Shepherd A, Laurens K, Matheson S, Carr V, Green M. Systematic meta-review and quality assessment of the structural brain alterations in schizophrenia. Neurosci Biobehav Rev. 2012;36(4):1342–1356. | ||
Puri B, Counsell S, Saeed N, Bustos M, Treasaden I, Bydder G. Regional grey matter volumetric changes in forensic schizophrenia patients: an MRI study comparing the brain structure of patients who have seriously and violently offended with that of patients who have not. BMC Psychiatry. 2008;8(suppl 1):S6. | ||
Müller J, Gänßbauer S, Sommer M, et al. Gray matter changes in right superior temporal gyrus in criminal psychopaths. Evidence from voxel-based morphometry. Psychiatry Res. 2008;163(3):213–222. | ||
Schiffer B, Peschel T, Paul T, et al. Structural brain abnormalities in the frontostriatal system and cerebellum in pedophilia. J Psychiatr Res. 2007;41(9):753–762. | ||
Anckarsäter H, Radovic S, Svennerlind C, Höglund P, Radovic F. Mental disorder is a cause of crime: the cornerstone of forensic psychiatry. Int J Law Psychiatry. 2009;32(6):342–347. | ||
Sartori G, Pellegrini S, Mechelli A. Forensic neurosciences. Curr Opin Neurol. 2011;24(4):371–377. | ||
Warner-Chacon K, Razani J, Salazar X, Lu P, Boone K. The Rey 15-item recognition trial: a technique to enhance sensitivity of the Rey 15-item memorization test. J Clin Exp Neuropsychol. 2002;24(5):561–573. | ||
Rogers R, editor. Clinical Assessment of Malingering and Deception. New York City, NY: Guilford Press; 2008. | ||
Davies J. Admissibility of scientific evidence in courts. Med Law. 2005;24(2):243. | ||
Anderson NE, Kiehl KA. Psychopathy: developmental perspectives and their implications for treatment. Restor Neurol Neurosci. 2014;32(1):103–117. | ||
Juárez M, Kiehl K, Calhoun V. Intrinsic limbic and paralimbic networks are associated with criminal psychopathy. Hum Brain Mapp. 2013;34(8):1921–1930. | ||
Kiehl K. A cognitive neuroscience perspective on psychopathy: evidence for paralimbic system dysfunction. Psychiatry Res. 2006;142(2–3):107–128. | ||
Ermer E, Cope L, Nyalakanti P, Calhoun V, Kiehl K. Aberrant paralimbic gray matter in incarcerated male adolescents with psychopathic traits. J Am Acad Child Adolesc Psychiatry. 2013;52(1):94.e3–103.e3. | ||
Kiehl KA. The Psychopath Whisperer: the Science of Those Without Conscience. Victoria, BC: Crown; 2014. | ||
Rigoni D, Pellegrini S, Mariotti V, et al. How neuroscience and behavioral genetics improve psychiatric assessment: report on a violent murder case. Front Behav Neurosci. 2010;4:160. | ||
Adolphs R. Investigating the cognitive neuroscience of social behavior. Neuropsychologia. 2003;41(2):119–126. | ||
Fumagalli MPriori A. Functional and clinical neuroanatomy of morality. Brain. 2012;135(7):2006–2021. | ||
Bari A, Robbins T. Inhibition and impulsivity: Behavioral and neural basis of response control. Progress in Neurobiology. 2013;108:44-79. | ||
Poldrack R. Can cognitive processes be inferred from neuroimaging data? Trends in Cognitive Sciences. 2006;10(2):59–63. | ||
Doallo S, Cadaveira F, Corral M, Mota N, López-Caneda E, Holguín S. Larger mid-dorsolateral prefrontal gray matter volume in young binge drinkers revealed by voxel-based morphometry. PLoS ONE. 2014;9(5):e96380. | ||
Taubert M, Wenzel U, Draganski B, et al. Investigating neuroanatomical features in top Athletes at the single subject level. PLOS ONE. 2015;10(6):e0129508. | ||
Martinaud O, Pouliquen D, Parain D, et al. Impaired functional differentiation for categories of objects in the ventral visual stream: A case of developmental visual impairment. Neuropsychologia. 2015;77:52–61. | ||
Luedecke D, Becktepe J, Lehmbeck J, et al. A novel presenilin 1 mutation (Ala275Val) as cause of early-onset familial Alzheimer disease. Neuroscience Letters. 2014;566:115–119. | ||
Kitamura H, Otake M, Inoue E, Someya T. Brain stem volume reduction revealed by voxel-based morphometry in a patient with REM sleep behavior disorder and synucleinopathy. J Sleep Med Disord. 2014;1(2):1010. | ||
Serino A, Cecere R, Dundon N, Bertini C, Sanchez-Castaneda C, Làdavas E. When apperceptive agnosia is explained by a deficit of primary visual processing. Cortex. 2014;52:12–27. | ||
Yasuno F, Matsuoka K, Kitamura S, et al. Decision-making deficit of a patient with axonal damage after traumatic brain injury. Brain and Cognition. 2014;84(1):63–68. | ||
Yao L, Yi X, Wei Y. Gray matter alteration in isolated congenital anosmia patient: a voxel-based morphometry study. Eur Arch Otorhinolaryngol. 2013;270(9):2569–2573. | ||
Migliaccio R, Agosta F, Scola E, et al. Ventral and dorsal visual streams in posterior cortical atrophy: A DT MRI study. Neurobiology of Aging. 2012;33(11):2572–2584. | ||
Beeson P, King R, Bonakdarpour B, Henry M, Cho H, Rapcsak S. Positive effects of language treatment for the logopenic variant of primary progressive aphasia. Journal of Molecular Neuroscience. 2011;45(3):724–736. | ||
Klingner C, Volk G, Brodoehl S, Burmeister H, Witte O, Guntinas-Lichius O. Time course of cortical plasticity after facial nerve palsy: a single-case study. Neurorehabilitation and Neural Repair. 2011;26(2):197–203. | ||
Migliaccio R, Agosta F, Toba M, et al. Brain networks in posterior cortical atrophy: A single case tractography study and literature review. Cortex. 2011;48(10):1298–1309. | ||
Sehm B, Frisch S, Thöne-Otto A, Horstmann A, Villringer A, Obrig H. Focal retrograde amnesia: voxel-based morphometry findings in a case without MRI lesions. PLoS ONE. 2011;6(10):e26538. | ||
Valdés-Sosa M, Bobes M, Quiñones I, et al. Covert face recognition without the fusiform-temporal pathways. NeuroImage. 2011;57(3):1162–1176. | ||
Bianchini F, Incoccia C, Palermo L et al. Developmental topographical disorientation in a healthy subject. Neuropsychologia. 2010;48(6):1563–1573. | ||
Eriguchi Y, Yamasue H, Doi N, et al. A case of adult-onset type II citrullinemia with comorbid epilepsy even after liver transplantation. Epilepsia. 2010;51(12):2484–2487. | ||
Freudenmann R, Kölle M, Huwe A, et al. Delusional infestation: Neural correlates and antipsychotic therapy investigated by multimodal neuroimaging. Progress in Neuro-Psychopharmacology and Biological Psychiatry. 2010;34(7):1215–1222. | ||
Maguire E, Kumaran D, Hassabis D, Kopelman M. Autobiographical memory in semantic dementia: A longitudinal fMRI study. Neuropsychologia. 2010;48(1):123–136. | ||
Nanri K, Shibuya M, Taguchi T, Hasegawa A, Tanaka N. Selective loss of Purkinje cells in a patient with anti-gliadin-antibody-positive autoimmune cerebellar ataxia. Diagnostic Pathology. 2011;6(1):14. | ||
Riddoch M, Bodley Scott S, Humphreys G. No direction home: Extinction is affected by implicit motion. Cortex. 2010;4fr6(5):678–684. | ||
Muhlau M, Wohlschlager A, Gaser C, et al. Voxel-based morphometry in individual patients: A pilot study in early Huntington Disease. American Journal of Neuroradiology. 2009;30(3):539–543. | ||
Narvid J, Gorno-Tempini M, Slavotinek A, et al. Of brain and bone: The unusual case of Dr. A. Neurocase. 2009;15(3):190–205. | ||
Tramoni E, Aubert-Khalfa S, Guye M, Ranjeva J, Felician O, Ceccaldi M. Hypo-retrieval and hyper-suppression mechanisms in functional amnesia. Neuropsychologia. 2009;47(3):611–624. | ||
Bozzali M, Cercignani M, Baglio F, et al. Voxel-wise analysis of diffusion tensor MRI improves the confidence of diagnosis of corticobasal degeneration non-invasively. Parkinsonism & Related Disorders. 2008;14(5):436–439. | ||
Epelbaum S, Pinel P, Gaillard R, et al. Pure alexia as a disconnection syndrome: New diffusion imaging evidence for an old concept. Cortex. 2008;44(8):962–974. | ||
Feldmann A, Trauninger A, Toth L, et al. Atrophy and decreased activation of fronto-parietal attention areas contribute to higher visual dysfunction in posterior cortical atrophy. Psychiatry Research: Neuroimaging.2008;164(2):178–184. | ||
Adlam A, Patterson K, Rogers T, et al. Semantic dementia and fluent primary progressive aphasia: two sides of the same coin? Brain. 2006;129(11):3066–3080. | ||
Brázdil M, Mikl M, Chlebus P, et al. Combining advanced neuroimaging techniques in presurgical workup of non-lesional intractable epilepsy. Epileptic Disord. 2006;8(3):190–194. | ||
Cipolotti L, Bird C, Good T, Macmanus D, Rudge P, Shallice T. Recollection and familiarity in dense hippocampal amnesia: A case study. Neuropsychologia. 2006;44(3):489–506. | ||
Colliot O, Bernasconi N, Khalili N, Antel S, Naessens V, Bernasconi A. Individual voxel-based analysis of gray matter in focal cortical dysplasia. NeuroImage. 2006;29(1):162–171. | ||
Joubert S, Felician O, Barbeau E, et al. The right temporal lobe variant of frontotemporal dementia. Cognitive and neuroanatomical profile of three patients. Journal of Neurology. 2006;253(11):1447–1458. | ||
Suzuki M, Nohara S, Hagino H, et al. Prefrontal abnormalities in patients with simple schizophrenia: Structural and functional brain-imaging studies in five cases. Psychiatry Research: Neuroimaging. 2005;140(2):157–171. | ||
Zahn R, Buechert M, Overmans J, et al. Mapping of temporal and parietal cortex in progressive nonfluent aphasia and Alzheimer’s disease using chemical shift imaging, voxel-based morphometry and positron emission tomography. Psychiatry Research: Neuroimaging. 2005;140(2):115–131. | ||
Gorno-Tempini M, Murray R, Rankin K, Weiner M, Miller B. Clinical, cognitive and anatomical evolution from nonfluent progressive Aphasia to Corticobasal Syndrome: a case report. Neurocase. 2004a;10(6):426–436. | ||
Gorno-Tempini M, Rankin K, Woolley J, Rosen H, Phengrasamy L, Miller B. Cognitive and behavioral profile in a case of right anterior temporal lobe neurodegeneration. Cortex. 2004b;40(4-5):631–644. | ||
Thompson S, Graham K, Williams G, Patterson K, Kapur N, Hodges J. Dissociating person-specific from general semantic knowledge: roles of the left and right temporal lobes. Neuropsychologia. 2004;42(3):359–370. | ||
Salmond C, de Haan M, Friston K, Gadian D, Vargha-Khadem F. Investigating individual differences in brain abnormalities in autism. Philosophical Transactions of the Royal Society B: Biological Sciences. 2003;358(1430):405–413. | ||
Rosen H, Kramer JH, Gorno-Tempini ML, et al. Patterns of Cerebral Atrophy in Primary Progressive Aphasia. American Journal of Geriatric Psychiatry. 2002;10(1):89–97. | ||
Gitelman D, Ashburner J, Friston K, Tyler L, Price C. Voxel-based morphometry of Herpes Simplex Encephalitis. NeuroImage. 2001;13(4):623–631. | ||
Mummery C, Patterson K, Price C, Ashburner J, Frackowiak R, Hodges J. A voxel-based morphometry study of semantic dementia: Relationship between temporal lobe atrophy and semantic memory. Annals of Neurology. 2000;47(1):36–45. | ||
Woermann FG, Free SL, Koepp MJ, Sisodiya SM, Duncan JS. Abnormal cerebral structure in juvenile myoclonic epilepsy demonstrated with voxel-based analysis of MRI. Brain. 1999;122 (11):2101–8. |
 © 2016 The Author(s). This work is published and licensed by Dove Medical Press Limited. The full terms of this license are available at https://www.dovepress.com/terms.php and incorporate the Creative Commons Attribution - Non Commercial (unported, v3.0) License.
By accessing the work you hereby accept the Terms. Non-commercial uses of the work are permitted without any further permission from Dove Medical Press Limited, provided the work is properly attributed. For permission for commercial use of this work, please see paragraphs 4.2 and 5 of our Terms.
© 2016 The Author(s). This work is published and licensed by Dove Medical Press Limited. The full terms of this license are available at https://www.dovepress.com/terms.php and incorporate the Creative Commons Attribution - Non Commercial (unported, v3.0) License.
By accessing the work you hereby accept the Terms. Non-commercial uses of the work are permitted without any further permission from Dove Medical Press Limited, provided the work is properly attributed. For permission for commercial use of this work, please see paragraphs 4.2 and 5 of our Terms.