")
Back to Journals » Clinical Interventions in Aging » Volume 11
Validation of three tools for identifying painful new osteoporotic vertebral fractures in older Chinese men: bone mineral density, Osteoporosis Self-Assessment Tool for Asians, and fracture risk assessment tool
Authors Lin J, YANG Y, Fei Q , Zhang X , Ma Z, Wang Q, Li J, Li D, Meng Q, WANG B
Received 23 November 2015
Accepted for publication 18 February 2016
Published 22 April 2016 Volume 2016:11 Pages 461—469
DOI https://doi.org/10.2147/CIA.S101078
Checked for plagiarism Yes
Review by Single anonymous peer review
Peer reviewer comments 2
Editor who approved publication: Dr Zhi-Ying Wu
JiSheng Lin,* Yong Yang,* Qi Fei, XiaoDong Zhang, Zhao Ma, Qi Wang, JinJun Li, Dong Li, Qian Meng, BingQiang Wang
Department of Orthopedics, Beijing Friendship Hospital, Capital Medical University, Beijing, People’s Republic of China
*These authors contributed equally to this work
Objective: This cross-sectional study compared three tools for predicting painful new osteoporotic vertebral fractures (PNOVFs) in older Chinese men: bone mineral density (BMD), the Osteoporosis Self-Assessment Tool for Asians (OSTA), and the World Health Organization fracture risk assessment tool (FRAX) (without BMD).
Methods: Men aged ≥50 years were apportioned to a group for men with fractures who had undergone percutaneous vertebroplasty (n=111), or a control group of healthy men (n=385). Fractures were verified on X-ray and magnetic resonance imaging. BMD T-scores were determined by dual energy X-ray absorptiometry. Diagnosis of osteoporosis was determined by a BMD T-score of ≤2.5 standard deviations below the average for a young adult at peak bone density at the femoral neck, total hip, or L1–L4. Demographic and clinical risk factor data were self-reported through a questionnaire. BMD, OSTA, and FRAX scores were assessed for identifying PNOVFs via receiver-operating characteristic (ROC) curves. Optimal cutoff points, sensitivity, specificity, and areas under the ROC curves (AUCs) were determined.
Results: Between the men with fractures and the control group, there were significant differences in BMD T-scores (at femoral neck, total hip, and L1–L4), and OSTA and FRAX scores. In those with fractures, only 53.15% satisfied the criteria for osteoporosis. Compared to BMD or OSTA, the FRAX score had the best predictive value for PNOVFs: the AUC of the FRAX score (cutoff =2.9%) was 0.738, and the sensitivity and specificity were 82% and 62%, respectively.
Conclusion: FRAX may be a valuable tool for identifying PNOVFs in older Chinese men.
Keywords: osteoporosis, male, vertebral fracture, FRAX, OSTA, bone mineral density
Introduction
Low-trauma fracture, often due to a fall but even occurring during sleep, is the ultimate consequence of osteoporosis. This is a major public health problem not only in postmenopausal women, but also in older men. In particular, the burden of osteoporotic vertebral fractures is substantial to individuals, families, and society.1
Patients with recently acquired painful vertebral compression fractures have a higher rate of morbidity and mortality compared with the general population.1 A person with osteoporosis or fracture is not likely to regain full bone strength, because the loss in bone microarchitecture is irreversible.2 It is therefore of paramount importance to identify individuals, men and women, who are at risk of developing osteoporosis, and to prevent the first fracture.
Male osteoporosis is largely neglected in the People’s Republic of China, although it has been shown in other countries that men suffer a higher mortality rate from hip fractures.3,4 Pharmacological interventions are available to treat postmenopausal osteoporosis,5 but relatively few men are suspected to have the disease – pain may not be recognized as a fracture, and medical imaging may provide too little information or be unavailable.
Many previous studies have shown that osteoporotic fracture is associated with low bone mineral density (BMD), and in current clinical practice BMD measurements are considered the gold standard for determining the degree of bone loss and a diagnosis of osteoporosis.6–8 Unfortunately, not all fractures can be explained by the patient’s BMD, and furthermore a correlation between BMD and future fractures has not been definitively established. In fact, some researchers have found that some fractures occur with BMD values above the osteoporotic range, in both men and women,9–11 and that BMD accounted for only 65% of the observed variation in bone strength.10 Many cases of osteoporosis have been misdiagnosed, escaped diagnosis, or were difficult to diagnose based on the BMD T-score alone (−2.5 or lower).12,13 In particular, although the link between low BMD and risk of fracture holds true for both men and women,14 it remains controversial whether the diagnostic T-score cutoff of −2.5 or lower for osteoporosis is applicable to men. There is also evidence that BMD accounts for only 70% of bone strength, and bone strength is a better criterion for evaluating the risk of osteoporotic fracture.15
It is generally accepted that a history of prior fracture at any site is an important risk factor for subsequent fractures.16 While it is inaccurate to identify the risk of fracture based simply on BMD, the high cost of central dual-energy X-ray absorptiometry (DXA) and magnetic resonance imaging (MRI) prohibit their widespread use for preliminary screening in primary hospitals. An appropriate screening tool is thus urgently needed for identifying osteoporosis in patients, especially to aid physicians with limited professional experience and equipment. The Osteoporosis Self-Assessment Tool for Asians (OSTA) developed by Koh et al17 is based on age and body weight. OSTA is a good and simple tool, with high sensitivity and acceptable specificity, for assessing the risk of osteoporosis in postmenopausal Asian women. In addition, OSTA may be helpful to identify postmenopausal women with vertebral deformity and painful new osteoporotic vertebral fractures (PNOVFs).18,19 However, sufficient confirmed validation of OSTA for identifying PNOVFs in men is lacking.
In 2008, the World Health Organization (WHO) introduced the fracture risk assessment tool (FRAX) (http://www.sheffield.ac.uk/FRAX) to evaluate patients’ absolute risk of osteoporotic fracture. To predict an individual’s 10-year probability of major osteoporotic fractures, or for hip fracture only, FRAX considers the interaction of multiple risk factors such as age, sex, and personal and family history. The risk factors may be analyzed with or without including BMD data.20 Furthermore, fracture rates differ greatly among countries, and FRAX can be calibrated to weigh risk factors according to country.21 Yet, in the few years that FRAX has been available, studies are lacking regarding its ability to predict the 10-year incidence of fractures in men,22,23 including men in the People’s Republic of China.
The present study assessed and compared BMD, OSTA, and FRAX (10-year probability, without BMD) for predicting PNOVFs in an older Chinese male population.
Materials and methods
The Ethics Committee of Beijing Friendship Hospital, Capital Medical University approved this cross-sectional study, and all subjects provided signed informed consent. The flow diagram of the study was showed in Figure 1.
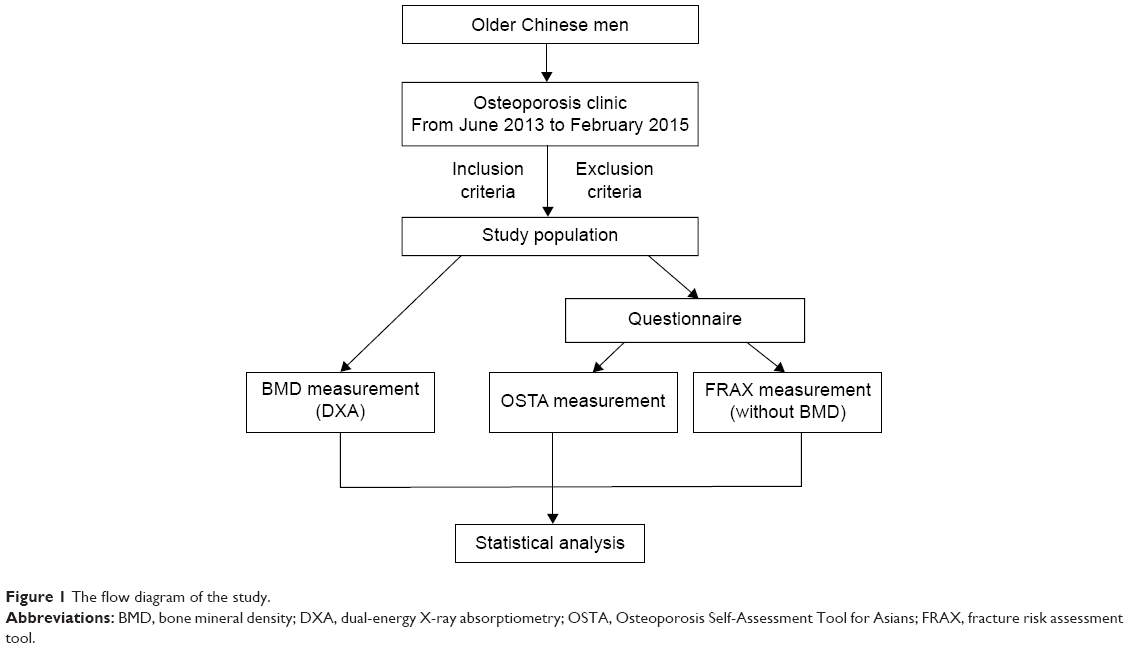 | Figure 1 The flow diagram of the study. |
Study population
The study population included Chinese men aged ≥50 years consecutively recruited from the Osteoporosis Clinic at Beijing Friendship Hospital from June 2013 to February 2015. The men comprised clinically symptomatic patients with painful vertebral fractures verified by X-ray and MRI within the past 6 months who came for further examination and treatment (the fracture group); and healthy men who came to the hospital for routine health examinations (the control group). Many clinicians consider the presence of a fragility fracture as sufficient for diagnosis of osteoporosis, regardless of the patient’s BMD. Although bone densitometry is useful for assessing disease severity and monitoring therapy in patients with fractures, densitometry is not essential for the diagnosis of osteoporosis in this setting.24 Thus, the men in the fracture group of this study were considered to have osteoporosis and PNOVF regardless of whether the BMD T-score was −2.5 standard deviations or less.
Men in both the fracture and control groups conformed to the following inclusion criteria: aged ≥50 years; Han Chinese nationality; residing in Beijing ≥20 years; willing to participate in the study, and able to read the informed consent form.
Excluded was anyone with a history or evidence of metabolic bone disease (eg, type I diabetes, hyper- or hypoparathyroidism, Paget’s disease, osteomalacia, renal osteodystrophy, or osteogenesis imperfecta); history of organ transplant; cancer with metastasis to the bone; significant renal impairment; a condition of prolonged immobility (spinal cord injury, Parkinson’s disease, stroke, muscular dystrophy, or ankylosing spondylitis); or prior use of antiresorptives (eg, bisphosphonate, estrogen, selective estrogen receptor modulators, and calcitonin) or anabolic agents (eg, fluoride or parathyroid hormone).
BMD measurements and identification of PNOVFs
All the enrolled men were invited to the Osteoporosis Clinic at Beijing Friendship Hospital for BMD measurements of the hip and spine, taken by DXA. The subjects were asked by a trained interviewer to fill in a questionnaire providing information pertaining to demographics and clinical risk factors for osteoporosis. Height was measured with a stadiometer (Mahr GmbH, Gottingen, Germany). Weight was measured using an electronic balance (Tanita, Tokyo, Japan), with the subjects in light-weight indoor clothing and without shoes.
DXA (Discovery Wi, QDR series, Hologic, Waltham, MA, USA) was used to measure the BMD of the lumbar spine (L1–L4) and left femur (ie, the femoral neck, trochanter, Ward’s triangle, and total hip) on the left side. If the left side was previously replaced or fractured, the right side was measured. To standardize measurements, a quality assurance scan was performed daily before each measurement. The in vivo short-term reproducibility values for the machine at the lumbar spine, femoral neck, and total hip for these men were all lower than 1%. All DXA scans were conducted by the same well-trained and qualified technologist throughout this study. The BMD T-scores were automatically calculated by the system. The T-scores were calculated using the mean BMD values of young Chinese men as reference:25 L1–L4, 1.017±0.117 g/cm2; femoral neck 0.909±0.116 g/cm2; and total hip 0.993±0.121 g/cm2.
We defined four requisite clinical criteria to confidently identify PNOVFs. These criteria were as follows:19 1) men aged ≥50 years, without trauma history or with a low-trauma fracture history. Low-energy trauma fracture was defined as a fracture resulting from a fall from a standing position or lower. 2) Experiencing back or low back pain within 6 months before the BMD measurement. 3) Relevant clinical signs of acute or sub-acute vertebral fractures, assessed by X-ray and MRI. On X-ray, signs included height loss in the anterior, middle, or posterior dimension of a vertebral body >20% of the vertebral body’s area in a lateral-view image of the thoracic/lumbar spine; or the presence of endplate deformities, a lack of parallelism of the endplates, and a generally altered appearance relative to neighboring vertebrae. On MR images, signs of acute or sub-acute vertebral fractures included new bone marrow edema on sagittal T1-weighted and fat-suppressed T2-weighted images. 4) No history or evidence of metabolic osteopathy or cancer.
OSTA score
The OSTA was calculated based on age and body weight using the following formula:17
[Body weight, kg – Age, y] ×0.2. | (1) |
The decimal digits of the calculation results were then disregarded. For example, a 73-year-old man whose body weight was 55 kg would have an OSTA index of −3.
FRAX score
FRAX is a computer-based algorithm (http://www.shef.ac.uk/FRAX) for determining models of fracture probability in men and women. The parameters are the appropriate clinical risk factors.26 The 10-year fracture probability can be derived either from the clinical risk factors alone or, to enhance fracture risk prediction, the clinical risk factors combined with the femoral neck BMD. In addition to the clinical risk factors, the fracture probability varies markedly in different regions of the world. Thus, the FRAX models need to be calibrated to those regions where the epidemiology of fracture and death is known. FRAX models are available for the mainland China. Because we mainly focused on the ability of the FRAX tool to identify painful new vertebral compression fractures for this study, the 10-year probability of major osteoporotic fracture was obtained without the BMD measurement.
Statistical analysis
Osteoporosis is defined as a T-score (lumbar spine, femoral neck, or total hip) that is −2.5 standard deviations or lower than that of the average young adult, according to the WHO criteria. In the present study, descriptive statistics for demographic and baseline characteristics are presented as mean ± standard deviation for continuous variables, or percentage for categorical variables. The measured data are described as mean ± standard deviation when the data were normally distributed, and otherwise as the median and interquartile range. The chi-squared test was used to compare count data.
The differences in the BMD, OSTA, and FRAX scores between the fracture and control groups were tested using the 2-independent-samples t-test if normally distributed and with homogeneity of variance; and otherwise with the Mann–Whitney U-test. The validation of the three tools to identify PNOVFs was evaluated through receiver-operating characteristic (ROC) curve analysis, which plots sensitivity against (1 – specificity). The predictive value of the tools was determined according to the area under the ROC curve (AUC) as follows: non-predictive, AUC <0.5; less predictive, 0.5< AUC <0.7; moderately predictive, 0.7< AUC <0.9; highly predictive, 0.9< AUC <1; and perfectly predictive, AUC =1.27,28 The ROC curve was constructed, and the AUC and its 95% confidence interval (CI) were estimated using SPSS version 17.0 (SPSS Inc., Chicago, IL, USA) and MedCalc version 11.5.0.0 (MedCalc Software, Ostend, Belgium). A P-value <0.05 was considered statistically significant.
Results
A sample of 509 men aged ≥50 years initially participated in this study. Thirteen subjects were excluded from the study in accordance with the exclusion criteria, so that 496 subjects were analyzed (Table 1). These included 111 men who had suffered a painful vertebral fracture within 6 months before the BMD measurement (the fracture group) and 385 healthy men without specific osteoporosis-associated symptoms.
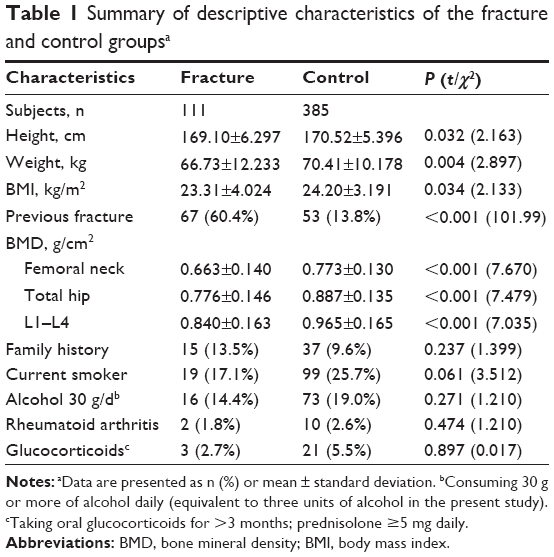 | Table 1 Summary of descriptive characteristics of the fracture and control groupsa |
Between the fracture and control groups, there were significant differences in weight, previous fracture, and BMDs of the femoral neck, total hip, and L1–L4 (Table 1). Specifically, the mean age was lower and the body mass index higher in the fracture group relative to the control group. Men in the fracture group had experienced significantly more previous fractures than did those in the control group, and the mean BMDs were lower.
Across the entire study population, body mass indices ranged from 14.17 kg/m2 to 35.06 kg/m2, with 5% (n=27) underweight, 42% (n=209) normal weight, and 53% (n=260) overweight or obese.29 Previous fracture was recorded in 24% of the total sample (n=120), and 10% of subjects had a family history of osteoporosis (n=52). Current smokers made up 24% of the study population (n=118), and 18% reported an alcohol intake of ≥30 g/day (n=89). The prevalence of rheumatoid arthritis was 2% (n=12), with 5% of subjects (n=24) using oral glucocorticoids for >3 months at a prednisolone dose of ≥5 mg daily.
BMD T-scores and OSTA and FRAX indices
There were significant differences in BMD T-scores and FRAX and OSTA scores between the fracture and control groups (Table 2). The BMD scores of the total hip, femoral neck, and L1–L4, and the OSTA index of the fracture group, were significantly lower than that of the control group, and the FRAX index was much higher.
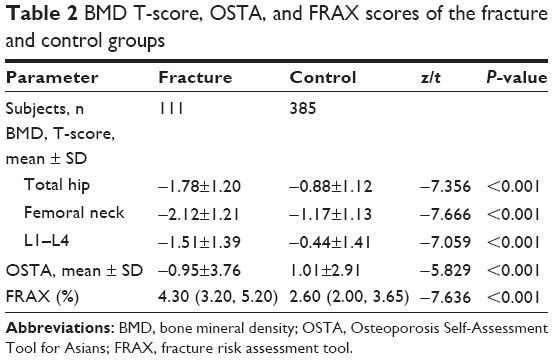 | Table 2 BMD T-score, OSTA, and FRAX scores of the fracture and control groups |
BMD T-scores
For the men in the fracture group, 42.3%, 26.1%, and 26.1%, respectively, were found to have osteoporosis at the femoral neck, total hip, and lumbar spine (based on BMD T-scores <−2.5; Figure 2). For the control group, these percentages were 10.1%, 5.7%, and 4.9%. The AUC of the BMD for estimating the risk of PNOVFs at the femoral neck, hip, and lumbar spine were 0.706, 0.711, and 0.706, with optimal cutoffs of −2.5, −1.4, and −1.6.
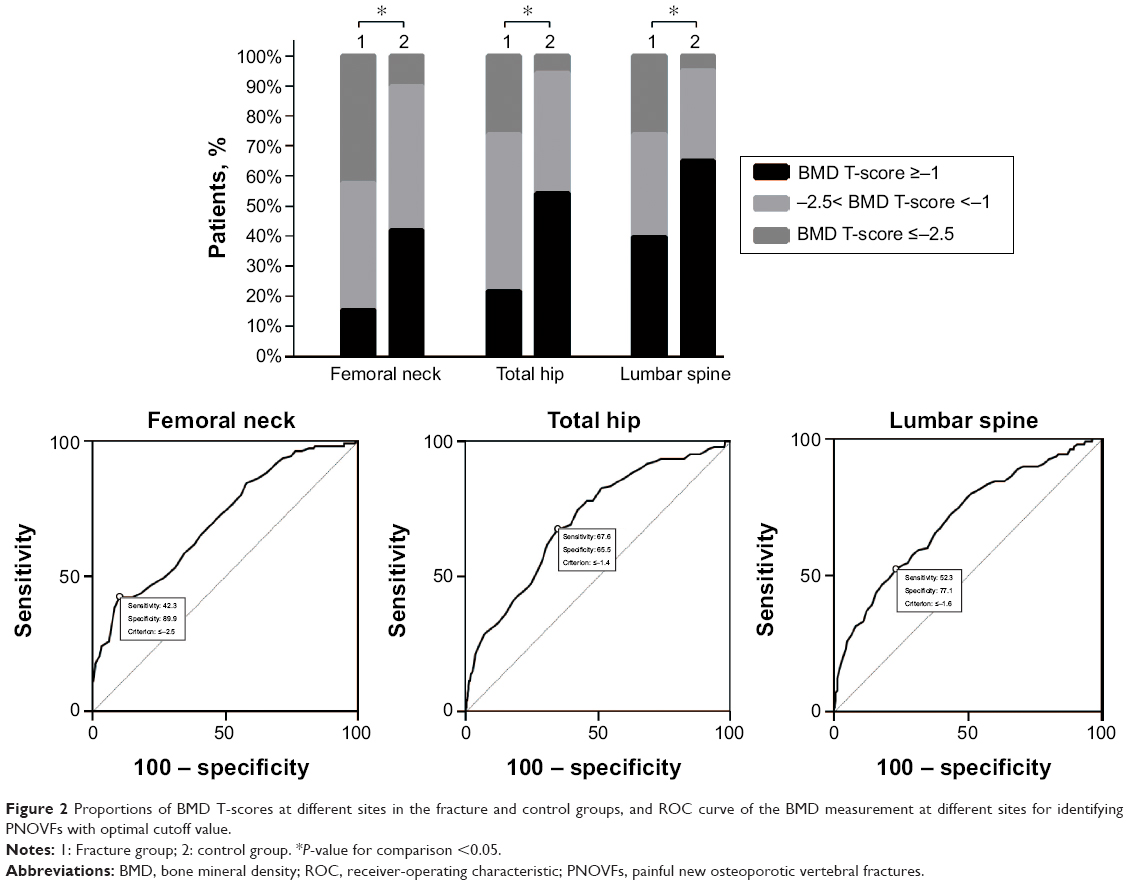 | Figure 2 Proportions of BMD T-scores at different sites in the fracture and control groups, and ROC curve of the BMD measurement at different sites for identifying PNOVFs with optimal cutoff value. |
Evaluation and comparison of BMD T-score, OSTA, and FRAX
The AUCs of the BMD T-score to identify PNOVFs at the femoral neck, hip, and lumbar spine were, respectively, 0.706 (95% CI: 0.664–0.746, Z=7.339, P<0.001), 0.711 (95% CI: 0.669–0.751, Z=7.687, P<0.001), and 0.706 (95% CI: 0.664–0.746, Z=7.215, P<0.001). The cutoffs were −2.5, −1.4, and −1.6, respectively. For the OSTA tool, the AUC was 0.661 (95% CI: 0.618–0.703, Z=4.977; P<0.001) with a cutoff of −1.2 and sensitivity of 53.15%, specificity of 76.88%. The AUC of the FRAX tool (without BMD) was 0.738 with a cutoff of 2.9% (Figure 3, Table 3).
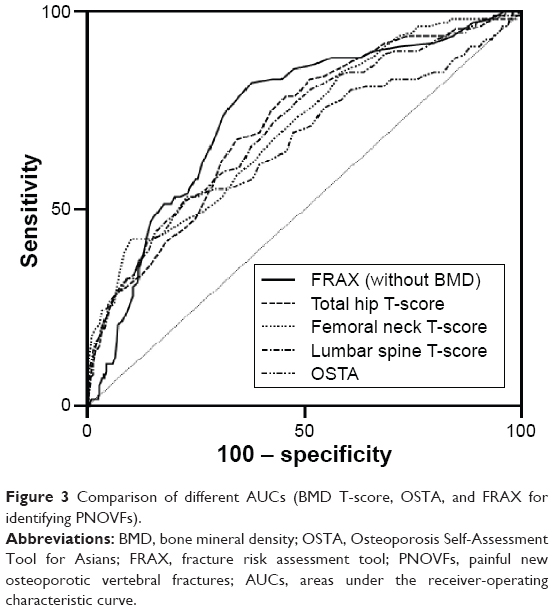 | Figure 3 Comparison of different AUCs (BMD T-score, OSTA, and FRAX for identifying PNOVFs). |
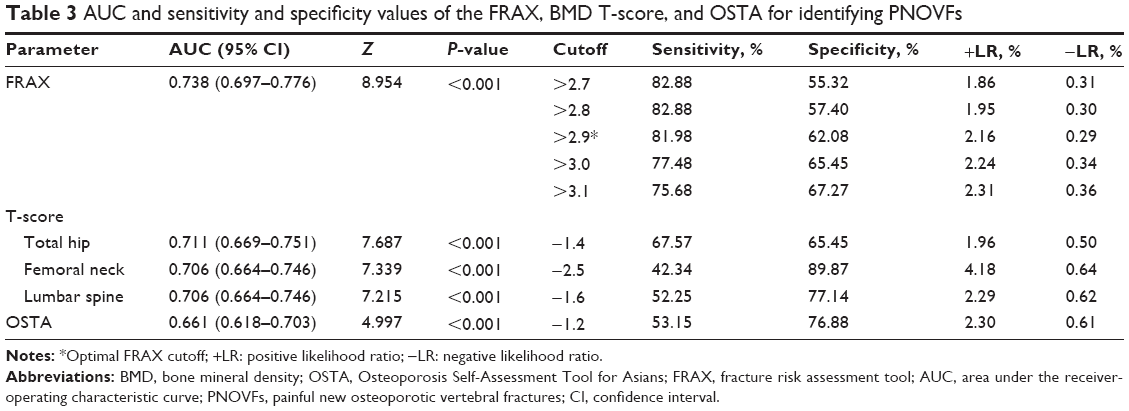 | Table 3 AUC and sensitivity and specificity values of the FRAX, BMD T-score, and OSTA for identifying PNOVFs |
Discussion
This study assessed and compared BMD, OSTA, and FRAX (10-year probability, without BMD) for predicting PNOVFs in Chinese men aged 50 years or above. Basing a diagnosis of osteoporosis on the criteria of the WHO (ie, a BMD T-score −2.5 or less), these tools were applied to men treated for PNOVFs and to a control group of healthy men.
Our study showed that for BMD, the AUC for estimating risk of fracture at the femoral neck, hip, and lumbar spine were 0.706, 0.711, and 0.706, respectively, with optimal cutoffs of −2.5, −1.4, and −1.6. This indicated that the BMD measurements were moderately predictive. For screening tools, high sensitivity (a high ratio of true positives to false positives) is more important than high specificity, as fewer patients will be subjected to unnecessary treatment or invasive diagnostic testing. Specificity also should be contained at reasonable levels to reduce unessential testing and the associated costs to the patient and community. However, our results showed that BMD had relatively low sensitivity for estimating risk of fracture, while specificity was acceptable. Therefore, a screening tool with higher sensitivity than BMD for identifying PNOVFs is desirable.
The OSTA, based on age and body weight, is a simpler tool than BMD measurements for assessing risk of osteoporosis in postmenopausal Asian women. A recent study reported that the OSTA index may also be a simple and effective marker for primary osteoporosis (defined at the femoral neck site by DXA) in older Chinese men,30 but there has been no validation for predicting new osteoporotic vertebral fractures in this population. Our present study showed that the distribution of OSTA scores between the men with osteoporotic fractures and the healthy control group was significantly different. However, the discriminating ability of OSTA for identifying PNOVFs yielded a less predictive value than did the BMD (AUC, 0.5–0.7), with acceptable specificity (77%), and poor sensitivity (53%). Therefore, the performance of the OSTA index for identifying PNOVFs in older Chinese men appears to be less satisfactory than for postmenopausal women,19 and might not be an effective tool for identifying PNOVFs.
The FRAX algorithms were developed for estimating the risk of osteoporotic fractures at the hip, spine, distal forearm, and shoulder over a 10-year period. It is applicable to men and women, is country-specific, does not require BMD measurements, and has been recommended by the WHO. Our present results indicate that FRAX (without BMD values) had the best discriminative ability for PNOVFs among the three tools we analyzed, with the best AUC value and good sensitivity and specificity. The AUC of FRAX for identifying the risk of PNOVFs was 0.738.
It should be noted that the optimal FRAX diagnostic cutoff value of 2.9% yielded a sensitivity of 81.98% and specificity of 62.08%. Compared with the present study, the results obtained from a cohort of Polish men designed by Pluskiewicz et al22 indicated a better AUC of FRAX (0.808) for identifying the risk of major osteoporotic fractures. The optimal cutoff value was 7.6% with a lower sensitivity (70.64%) and higher specificity (77.36%). Cheung et al31 previously reported that the AUC of FRAX with T-score was 0.728 for all major osteoporotic fractures in a cohort of Chinese postmenopausal women, and the optimal cutoff value was 8.1% that provided acceptable sensitivity (62.9%) and good specificity (72%).
Currently, FRAX has been included in two representative guidelines, one issued from the National Osteoporosis Foundation in the USA, and the other from the European Society for Clinical and Economic Aspects of Osteoporosis and Osteoarthritis. However, these guidelines differ in determining the intervention threshold of FRAX. The National Osteoporosis Foundation in the USA guideline proposed a fixed value of 20% for major osteoporotic fractures, or 3% for hip fractures at the ages 50 years and above. On the other hand, the European Society for Clinical and Economic Aspects of Osteoporosis and Osteoarthritis guideline for 10-year fracture probability for major osteoporotic fractures were age-dependent values for postmenopausal women of approximately 15%, 20%, and 30% at ages of 60, 70, and 80 years, respectively.32
Of course, the optimal intervention threshold of FRAX is different in every country. The thresholds used are varied since they depend on local factors such as health economic assessment, absolute costs, willingness to pay for treatment of osteoporosis, and access to DXA.33 For this reason, it will be important to define intervention thresholds on a country-by-country basis.
Among the tools tested in the present study, FRAX had the highest discriminating ability for predicting osteoporotic fractures, followed by BMD and OSTA. The AUC of the FRAX score (without BMD, cutoff =2.9%) to identify PNOVFs was 0.738, and the sensitivity and specificity were 82% and 62%, respectively. OSTA was not effective enough to evaluate the risk of PNOVFs. The deficiency of OSTA may be due to its simplicity, and because it was designed for identifying primary osteoporosis only. Although both primary and secondary osteoporosis can lead to osteoporotic fractures, it would inevitably underestimate the risk of osteoporotic fractures. As only a portion of the subjects in the fracture group of the present study suffered from osteoporosis according to the WHO criteria (Figure 2), this implies that only the BMD measurement was limited in identifying PNOVFs. Therefore, bone strength may be better for evaluating the risk of osteoporotic fractures. Compared to OSTA and the BMD T-scores, the FRAX score (analyzed herein without BMD) had the best predictive value for PNOVFs in the present study.
Our study has several noteworthy strengths. First, our study was not retrospective, and all of the subjects’ ages and weights were recorded at the same time as the BMD measurements. Second, we imposed strict inclusion and exclusion criteria to exclude the effects of other factors. Third, our study was of great clinical importance, it could help physicians who lack experience in primary hospitals or community health service centers to detect vertebral fractures early. And what is more, the ability of FRAX to estimate fracture risk, with or without BMD, is a major advantage to clinicians with less training when choosing treatment options.
The present study had a few limitations. First, our data were collected only from subjects recruited at a single hospital and thus cannot fully represent the entire demographics in the People’s Republic of China. The population structure of our study may be different from the actual demographic profile of Beijing, which could affect the generalizability of these data. Second, it is inaccurate to define intervention thresholds without taking into account the setting for service provision and willingness to pay, as well as considerations of absolute costs. The results should be confirmed in other cohorts.
Conclusion
Our study found that neither BMD nor OSTA was effective enough to predict the risk of PNOVFs in clinical practice. FRAX may be an effective tool for determining a high risk of PNOVFs in older Chinese men, with a cutoff value of 2.9%.
Acknowledgments
The study was funded by the Capital Health Project (Z131100006813040), Beijing, People’s Republic of China. We thank Medjaden Bioscience Limited for assisting in the preparation of this manuscript.
Disclosure
The authors report no conflicts of interest to this work.
References
Johnell O, Kanis JA. An estimate of the worldwide prevalence and disability associated with osteoporotic fractures. Osteoporos Int. 2006;17(12):1726–1733. | ||
Hochberg M. Preventing fractures in postmenopausal women with osteoporosis. A review of recent controlled trials of antiresorptive agents. Drugs Aging. 2000;17(4):317–330. | ||
Center JR, Nguyen TV, Schneider D, Sambrook PN, Eisman JA. Mortality after all major types of osteoporotic fracture in men and women: an observational study. Lancet. 1999;353(9156):878–882. | ||
Carpintero P, Lopez P, Leon F, Lluch M, Montero M, Aguilera C. Men with hip fractures have poorer nutritional status and survival than women: a prospective study of 165 patients. Acta Orthop. 2005;76(3):331–335. | ||
Compston JE. Pharmacological interventions for post-menopausal osteoporosis: an evidence-based approach. Rheumatology (Oxford). 2000;39(12):1309–1312. | ||
Ross PD, Davis JW, Vogel JM, Wasnich RD. A critical review of bone mass and the risk of fractures in osteoporosis. Calcif Tissue Int. 1990;46(3):149–161. | ||
Nguyen T, Sambrook P, Kelly P, et al. Prediction of osteoporotic fractures by postural instability and bone density. BMJ. 1993;307(6912):1111–1115. | ||
Cummings SR, Black DM, Nevitt MC, et al. Bone density at various sites for prediction of hip fractures. The Study of Osteoporotic Fractures Research Group. Lancet.1993;341(8837):72–75. | ||
Langsetmo L, Goltzman D, Kovacs CS, et al. Repeat low-trauma fractures occur frequently among men and women who have osteopenic BMD. J Bone Miner Res. 2009;24(9):1515–1522. | ||
Schuit SC, van der Klift M, Weel AE, et al. Fracture incidence and association with bone mineral density in elderly men and women: the Rotterdam Study. Bone. 2004;34(1):195–202. | ||
Siris ES, Chen YT, Abbott TA, et al. Bone mineral density thresholds for pharmacological intervention to prevent fractures. Arch Intern Med. 2004;164(10):1108–1112. | ||
Siffert RS, Luo GM, Cowin SC, Kaufman JJ. Dynamic relationships of trabecular bone density, architecture, and strength in a computational model of osteopenia. Bone. 1996;18(2):197–206. | ||
Frost HM. On our age-related bone loss: insights from a new paradigm. J Bone Miner Res. 1997;12(10):1539–1546. | ||
Kanis JA. Diagnosis of osteoporosis and assessment of fracture risk. Lancet. 2002;359(9321):1929–1936. | ||
Ekman EF. The role of the orthopaedic surgeon in minimizing mortality and morbidity associated with fragility fractures. J Am Acad Orthop Surg. 2010;18(5):278–285. | ||
Klotzbuecher CM, Ross PD, Landsman PB, Abbott TA 3rd, Berger M. Patients with prior fractures have an increased risk of future fractures: a summary of the literature and statistical synthesis. J Bone Miner Res. 2000;15(4):721–739. | ||
Koh LK, Sedrine WB, Torralba TP, et al. A simple tool to identify Asian women at increased risk of osteoporosis. Osteoporos Int. 2001;12(8):699–705. | ||
Saetung S, Ongphiphadhanakul B, Rajatanavin R. The relationship of an Asian-specific screening tool for osteoporosis to vertebral deformity and osteoporosis. J Bone Miner Metab. 2008;26(1):47–52. | ||
Yang Y, Wang B, Fei Q, et al. Validation of an osteoporosis self-assessment tool to identify primary osteoporosis and new osteoporotic vertebral fractures in postmenopausal Chinese women in Beijing. BMC Musculoskelet Disord. 2013;14:271. | ||
Kanis JA, Johnell O, Oden A, Johansson H, McCloskey E. FRAX and the assessment of fracture probability in men and women from the UK. Osteoporos Int. 2008;19(4):385–397. | ||
Kanis JA, Oden A, Johansson H, Borgstrom F, Strom O, McCloskey E. FRAX and its applications to clinical practice. Bone. 2009;44(5):734–743. | ||
Pluskiewicz W, Adamczyk P, Franek E, et al. FRAX calculator and Garvan nomogram in male osteoporotic population. Aging Male. 2014;17(3):174–182. | ||
Ackman JM, Lata PF, Schuna AA, Elliott ME. Bone health evaluation in a veteran population: a need for the Fracture Risk Assessment Tool (FRAX). Ann Pharmacother. 2014;48(10):1288–1293. | ||
Lenchik L, Rogers LF, Delmas PD, Genant HK. Diagnosis of osteoporotic vertebral fractures: importance of recognition and description by radiologists. AJR Am J Roentgenol. 2004;183(4):949–958. | ||
Yeh LR, Chen CK, Lai PH. Normal bone mineral density in anteroposterior, lateral spine and hip of Chinese men in Taiwan: effect of age change, body weight and height. J Chin Med Assoc. 2004;67(6):287–295. | ||
Kanis JA, Oden A, Johnell O, et al. The use of clinical risk factors enhances the performance of BMD in the prediction of hip and osteoporotic fractures in men and women. Osteoporos Int. 2007;18(8):1033–1046. | ||
Greiner M, Pfeiffer D, Smith RD. Principles and practical application of the receiver-operating characteristic analysis for diagnostic tests. Prev Vet Med. 2000;45(1–2):23–41. | ||
Swets JA. Measuring the accuracy of diagnostic systems. Science. 1988;240(4857):1285–1293. | ||
Zhou B; Cooperative Meta-analysis Group of China Obesity Task Force. [Predictive values of body mass index and waist circumference to risk factors of related disease in Chinese adult population]. Zhonghua Liu Xing Bing Xue Za Zhi. 2002;23(1):5–10. Chinese. | ||
Yang Y, Dong Li, Fei Q, et al. Self-assessment Tool to Identify Primary Osteoporosis in Chinese Elderly Males. International Journal of Gerontology. 2015;9(2):71–76. | ||
Cheung EY, Bow CH, Cheung CL, et al. Discriminative value of FRAX for fracture prediction in a cohort of Chinese postmenopausal women. Osteoporos Int. 2012;23(3):871–878. | ||
Nakamura T. [Recommendations of FRAX in clinical assessment of osteoporosis indicated in European and US guidelines]. Clin Calcium. 2009;19(12):1723–1728. Japanese. | ||
Kanis JA, Johnell O, Oden A, et al. Intervention thresholds for osteoporosis in men and women: a study based on data from Sweden. Osteoporos Int. 2005;16(1):6–14. |
 © 2016 The Author(s). This work is published and licensed by Dove Medical Press Limited. The full terms of this license are available at https://www.dovepress.com/terms.php and incorporate the Creative Commons Attribution - Non Commercial (unported, v3.0) License.
By accessing the work you hereby accept the Terms. Non-commercial uses of the work are permitted without any further permission from Dove Medical Press Limited, provided the work is properly attributed. For permission for commercial use of this work, please see paragraphs 4.2 and 5 of our Terms.
© 2016 The Author(s). This work is published and licensed by Dove Medical Press Limited. The full terms of this license are available at https://www.dovepress.com/terms.php and incorporate the Creative Commons Attribution - Non Commercial (unported, v3.0) License.
By accessing the work you hereby accept the Terms. Non-commercial uses of the work are permitted without any further permission from Dove Medical Press Limited, provided the work is properly attributed. For permission for commercial use of this work, please see paragraphs 4.2 and 5 of our Terms.