")
Back to Journals » Drug Design, Development and Therapy » Volume 13
Validated UPLC-MS/MS method for quantification of fruquintinib in rat plasma and its application to pharmacokinetic study
Authors Mei YB, Luo SB, Ye LY, Zhang Q, Guo J, Qiu XJ , Xie SL
Received 24 December 2018
Accepted for publication 25 July 2019
Published 15 August 2019 Volume 2019:13 Pages 2865—2871
DOI https://doi.org/10.2147/DDDT.S199362
Checked for plagiarism Yes
Review by Single anonymous peer review
Peer reviewer comments 6
Editor who approved publication: Dr Sukesh Voruganti
Yi-Bin Mei,1,* Shun-Bin Luo,2,* Ling-Yan Ye,1 Qiang Zhang,3 Jing Guo,4 Xiang-Jun Qiu,5 Sai-Li Xie6
1Department of Cardiology, The People’s Hospital of Lishui, Lishui, Zhejiang 323000, People’s Republic of China; 2Department of Clinical Pharmacy, The People’s Hospital of Lishui, Lishui, Zhejiang 323000, People’s Republic of China; 3Department of Clinical Laboratory, The People’s Hospital of Lishui, Lishui, Zhejiang 323000, People’s Republic of China; 4Department of Regional Medical Union, The People’s Hospital of Lishui, Lishui, Zhejiang 323000, People’s Republic of China; 5Department of pharmacology, Medical College of Henan University of Science and Technology, Luoyang 471003, People’s Republic of China; 6Department of Ultrasonic imaging, The First Affiliated Hospital of Wenzhou Medical University, Wenzhou, Zhejiang 325035, People’s Republic of China
*These authors contributed equally to this work
Abstract: A new, simple, and sensitive ultraperformance liquid chromatography-tandem mass spectrometry (UPLC-MS/MS) method for quantification of fruquintinib was established to assess the pharmacokinetics of fruquintinib in the rat. The internal standard working solution was added to the plasma sample for extraction before analysis. The Acquity UPLC BEH C18 chromatography column (2.1 mm ×50 mm, 1.7 μm) was used to separated analytes under gradient elution using acetonitrile and 0.1% formic acid as the mobile phase. Positive multiple reaction monitoring modes were chosen to detect fruquintinib and diazepam (IS). The precursor-to-product ion transitions were 394.2 → 363.2 for fruquintinib and m/z 285 → 154 for IS. The current method was linear over the concentration range of 1.0–1000 ng/mL for fruquintinib with a correlation coefficient of 0.9992 or better. The matrix effect of fruquintinib and IS was acceptable under the current method. The intra- and interday precision (RSD%) and accuracy (RE%) were within 11.9% and ±13.7%, respectively. The recovery, stability, and sensitivity were validated according to the United States Food and Drug Administration (FDA) regulations for bioanalytical method validation. The analytical method had been validated and applied to a pharmacokinetic study of fruquintinib in rat.
Keywords: fruquintinib, UPLC-MS/MS, rat plasma, pharmacokinetics
Introduction
As an important hallmark of cancer development and progression, angiogenesis plays a major role in vascular remodeling, cell proliferation, cancer cell dissemination, and metastasis.1–4 Vascular endothelial growth factor (VEGF) secreted by tumors promotes the formation of the angiogenesis. The angiogeneses around the tumor supplied the blood flow, oxygen, and nutrients to the tumor at an advanced stage. The anti-cancer therapies targeting VEGF/vascular endothelial growth factor receptors (VEGFR) axis included neutralization of VEGF or VEGFR by monoclonal antibodies and blockage of VEGFR kinase activity with small molecule inhibitors.5 Due to its long half-life and high specificity, bevacizumab can sustain target inhibition and also combine with other chemotherapies. It limits bevacizumab clinical use or patients’ access because of intravenous dosing, autoimmune diseases after long-term treatment, immunogenicity, and especially high cost.6 Therefore, an active small molecule VEGFR inhibitor by oral administration combined with chemotherapies to achieve sustained target inhibition and avoid the limitation of antibodies is highly desirable.
Small-molecule VEGFR inhibitors include first-generation sunitinib,7 regorafenib,8,9 sorafenib10 and pazopanib;11 second-generation tivozanib12 and axitinib.13 The less selective of these inhibitors limited their clinical use. New-generation tyrosine kinase inhibitors (TKIs) include icotinib,14 apatinib,15 famitinib,16 flumatinb,17 allitinib,18 fruquintinib,19 and selatinib,20 among which icotinib and apatinib have been approved in China, while others are in clinical trials. Fruquintinib (6-(6, 7-dimethoxyquinazolin-4-yloxy) - N,2-dimethylbenzofuran-3-carboxamide, Figure 1A) developed by Hutchison MediPharma Ltd. (Shanghai, China) had been studied in Phase II and Phase III clinical trial for non-small-cell lung cancer (“NSCLC”) and colorectal cancer (CRC) and demonstrated highly potent efficacy and safety profile in vitro and in vivo.19,21–24 In 2018, fruquintinib was approved in China for treatment of CRC. It is an oral TKI with a highly selective small-molecule inhibitor of VEGFR-1, -2, and -3, thus inhibiting endothelial cell proliferation and migration.2,19,21
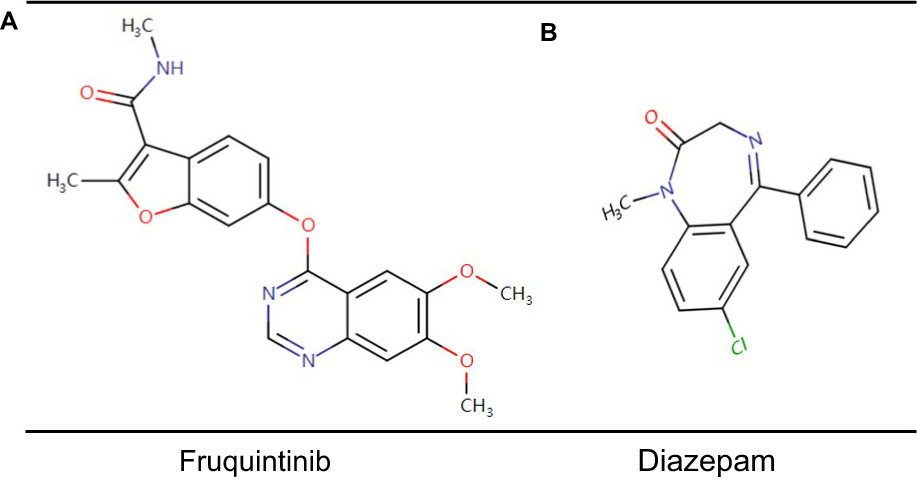 |
Figure 1 The chemical structures of the analytes in the present study. (A) fruquintinib; (B) diazepam. |
When more than two prior systemic antineoplastic therapies have failed to treatment metastatic CRC patients, fruquintinib will be used in these patients. To the best of our knowledge, there are several LC-MS/MS methods reported for the quantitative bioanalysis of fruquintinib in plasma.21,25 However, these methods were not described in enough detail (eg, plasma extraction procedure, chromatography conditions, parameters of the method, etc.) for duplication in other laboratories. Furthermore, the time of sample collection was too short, and the plasma concentration of the parent compound was still above the minimum effective concentration or lower limit of quantitation (LLOQ). Therefore, the current study is aimed to develop a new and sensitive ultra performance liquid chromatography-tandem mass spectrometry (UPLC-MS/MS) method for the quantification of fruquintinib and assess the pharmacokinetics of fruquintinib with sufficient time to metabolize in the rat.
Materials and methods
Chemicals and reagents
Fruquintinib (CAS NO: 1194506-26-7) was purchased from Shanghai Boylechem Co., Ltd (Songjiang District, Shanghai, China); diazepam (CAS NO: 65854-76-4) as internal standard (IS) (Figure 1B) and formic acid (CAS:64-18-6) were provided by Sigma-Aldrich Company (St. Louis, MO, USA); all materials were suitable for use in LC/MS or UPLC/MS laboratory testing by spiking into the matrix of choices such as urine or plasma. Acetonitrile with LC grade was supplied from Merck Company (Darmstadt, Germany), and the other reagents were all analytical grade. The water used in the laboratory was prepared by Wahaha pure water which filtered through a 0.45 μm filter. 0.1% formic acid was prepared by 1 mL formic acid diluted with the water to 1 L.
Analytical system
The Acquity UPLC BEH C18 chromatography column (2.1 mm ×50 mm, 1.7 μm) was used to separated analytes under gradient elution using acetonitrile (mobile phase A) and 0.1% formic acid (mobile phase B) as the mobile phase. The gradient elution program was as follows: 0–0.5 mins (90% A), 0.5–1 mins (90–10% A), 1.0–2.0 mins (10% A), 2.0–2.1 mins (10–90% A), and 2.1–3.0 mins (90% A). The overall chromatographic run time was 3.0 min and the flow rate of the method was set at 0.30 mL/min. Mass spectrometric detection was performed on a XEVO TQD triple quadrupole mass spectrometer equipped with an electrospray ionization (ESI) source (Waters Corp., Milford, MA, USA). The analytical method used positive multiple reaction monitoring mode to detect fruquintinib and diazepam (IS). The precursor-to-product ion transitions were 394.2 → 363.2 for fruquintinib and m/z 285 → 154 for IS (desolvation temperature 500°C, desolvation gas flow rate 600 L/h, the argon flow rate 150 L/h, collision 7.0 Bar). All data acquisition and instrument control were processed under the Masslynx 4.1 software (Waters Corp.).
Preparation of standard solutions and quality control sample (QC)
Fruquintinib or IS was dissolved in acetonitrile and prepared to a stock solution (1 mg/mL) which waws stored at 4°C. The standard solutions were diluted to the stock solution with acetonitrile. Calibration curves standard solutions were prepared by adding blank plasma samples to the corresponding working solutions. The final concentrations of the calibration curves were as follows: 1.0, 5.0, 10, 50, 100, 500, and 1000 ng/mL for fruquintinib. The quality control sample (QC) solutions were prepared in the same manner to the following concentrations: 2.0, 80, and 800 ng/mL for fruquintinib. The above-prepared solutions were all stored at −20°C until analysis.
Plasma sample preparation
100 µL thawed plasma sample was spiked with 200 µL acetonitrile (IS 100 ng/mL) and vortex mixed for 1.0 min, and then centrifugation was done at 13,000 g for 10 mins. A clear supernatant (6 µL) after centrifugation was injected into the analytical system for analysis.
Method validation
The UPLC-MS/MS method for quantification of fruquintinib in rat plasma and its application to pharmacokinetic study was validated according to the FDA guidelines.26
Blank rat plasma samples spiked with fruquintinib and IS were used to carry out selectivity. Specificity was evaluated by the interference at the retention time of fruquintinib and IS.
A weighted (1/x2) least-squares linear regression was used to assess the linearity. The current method was linear over a range of 1.0–1000 ng/mL for fruquintinib with a correlation coefficient of 0.99 or better. A deviation of ±15% for each back-calculated standard concentration was accepted, while it was ±20% for LLOQ.
The precision and accuracy of our method were evaluated by analyzing 6 replicates at 2, 80, 800 ng/mL within 1 day or on 3 consecutive days. Precision was measured as a relative standard deviation (RSD%), while the accuracy was a relative error (RE%). A deviation of ±15% for the accuracy and precision was accepted.
The recovery was calculated as the ratio of the peak area of the analyte in QCs to the post-protein precipitation at equivalent analyte concentrations (6 replicates at 2, 80, and 800 ng/mL). The matrix effects of rat plasma were assessed by comparing the ratio of the analyte concentration in the post-extracted sample to the pure standard solution at equivalent concentrations.
The stability of fruquintinib at different conditions (room temperature for 12 hrs, 4°C for 12 hrs, −80°C for 28 days, and three freeze–thaw cycles from −20°C to room temperature) was evaluated by analyzing 5 replicates at three concentration levels (2, 80, 800 ng/mL). It could be permitted when the analyte stability was between 85% and 115%.
The pharmacokinetic study in the rat
Fruquintinib dissolved in 0.5% sodium carboxymethyl cellulose (1.0 mg/mL) was orally given to eight young adult Sprague–Dawley rats (2 months, 180–220 g), and the volume of the suspension given to the animal was 1.0 mL/kg. The rat blood samples (0.3 mL) were taken via caudal vein at the following time points after drug administration: 0.33, 0.67, 1, 1.5, 2, 3, 4, 6, 9, 12, 24, and 48 hrs. 100 µL plasma was separated from whole blood after centrifuged at 10,000 g for 5 min, and then stored at −20°C before analysis. Approved by the Wenzhou Medical University Ethics Committee (SYXK 2015-0009), the study was performed under the National Institutes of Health Guide for the Care and Use of Laboratory Animals. Noncompartmental pharmacokinetic parameters were calculated for fruquintinib.27–29 The pharmacokinetic parameters of fruquintinib were noted directly by DAS (Drug and statistics) software (Version 2.0, Shanghai University of Traditional Chinese Medicine, China).30
Results and discussion
The development and optimization of the method
Although liquid extraction, protein precipitation, and solid-phase extraction have been commonly used to extract analytes from plasma or serum in many studies, there are not many pieces of research to study the method for determination fruquintinib so far. It reports that liquid chromatography-tandem mass spectrometry (LC-MS/MS) had been used to determine fruquintinib in rat plasma.16,21,25 Due to time saving, simplicity, low matrix effects and the comparative results that we did, we adopted UPLC-MS/MS and the protein precipitation. Meanwhile, UPLC-MS/MS was available in most laboratories at present. The proper combination of mobile phases helped to achieve peak symmetry, shorten analysis time and optimize ionization. When compared to methanol-0.1% formic acid, acetonitrile-0.1% formic acid with gradient elution could provide better effects and less matrix effects. The other parameters of MS/MS conditions and chromatography had also been made optimal at the same time.
Selectivity and matrix effect
Representative chromatograms are shown in Figure 2. No evident interference was found at the elution times: fruquintinib and IS were eluted at 1.40 and 1.59 min, respectively.
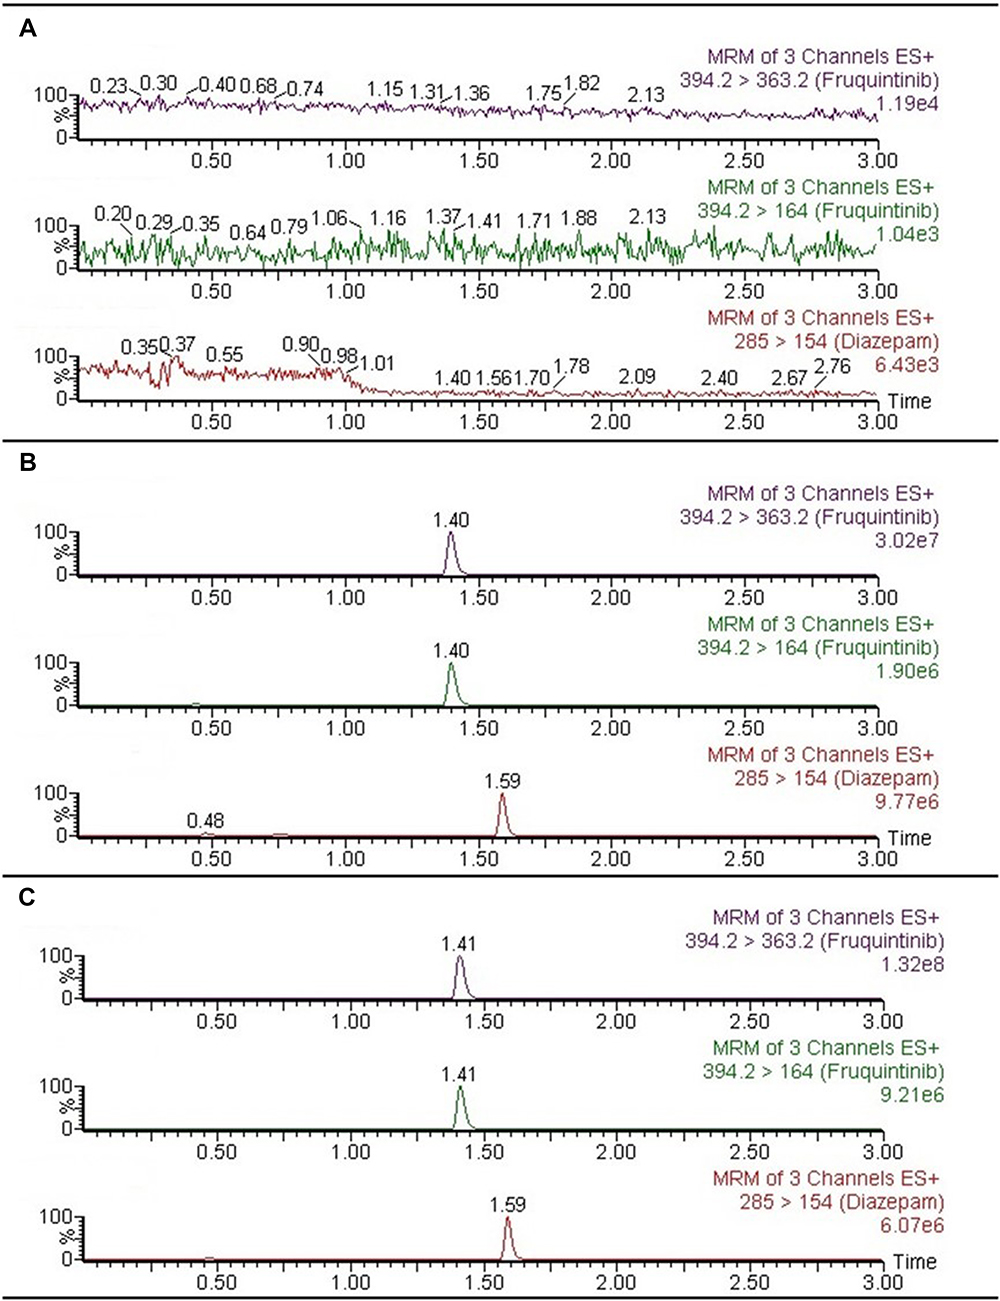 |
Figure 2 Representative chromatograms of blank plasma (A), blank plasma spiked with standard solution (B), and plasma sample obtained from oral administration of fruquintinib in rats (C). |
The matrix effect of fruquintinib ranged from 87.4% to 95.6%, while the IS was 102.4%. Therefore, it was negligible for ion suppression or enhancement from rat plasma in the study.
Calibration curve and sensitivity
The current method was linear over a range of 1.0–1000 ng/mL for fruquintinib with a correlation coefficient of 0.9992, and the LLOQ was 1.0 ng/mL for fruquintinib. The calibration curve was y=2.8493x +7.1062 (n=3), where y= the peak area ratio of fruquintinib to IS, x=the plasma concentration of fruquintinib. The LLOQ with RSD <11.9% and RE ≤13.7% was acceptable in the present study.
Precision, accuracy, and recovery
The results in Table 1 represented the accuracies and precisions. The accuracies (RE%) of the method was within ±13.7%, while the precisions (RSD%) within 11.9%. The results demonstrated that the UPLC-MS/MS method was suited for determination fruquintinib. The recovery by protein precipitation with acetonitrile was between 82.0% and 94.4%.
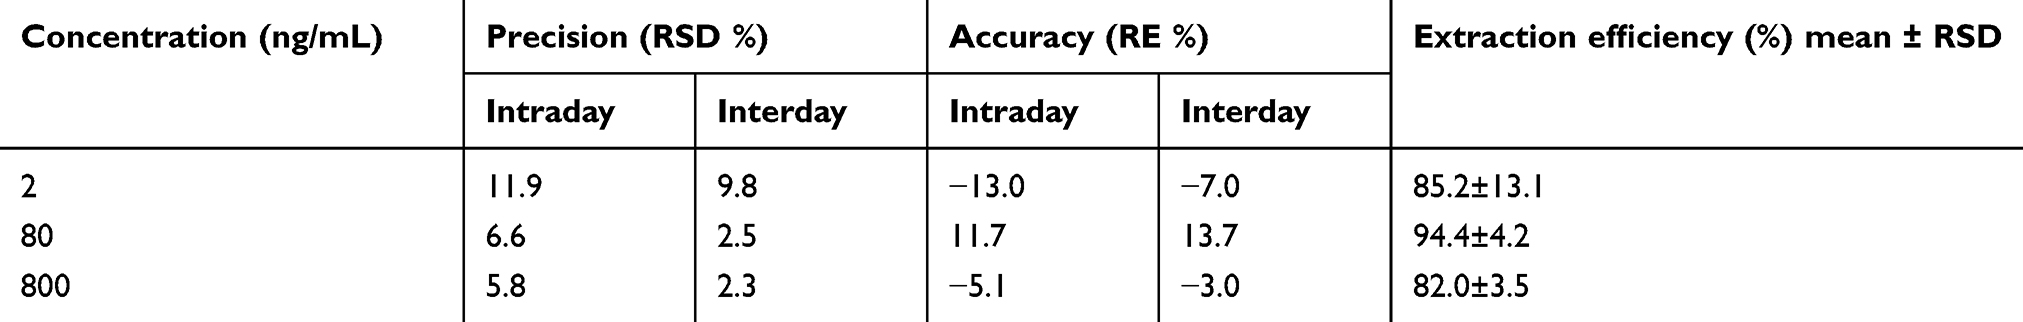 |
Table 1 The precision, accuracy, and extraction efficiency of fruquintinib (n=6) |
Stability
The stability under different storage and process conditions (room temperature for 12 hrs, 4°C for 12 hrs, −80°C for 28 days, and three freeze–-thaw cycles from −20°C to room temperature) was demonstrated and the results are summarized in Table 2 and found to be acceptable (within ±15%).
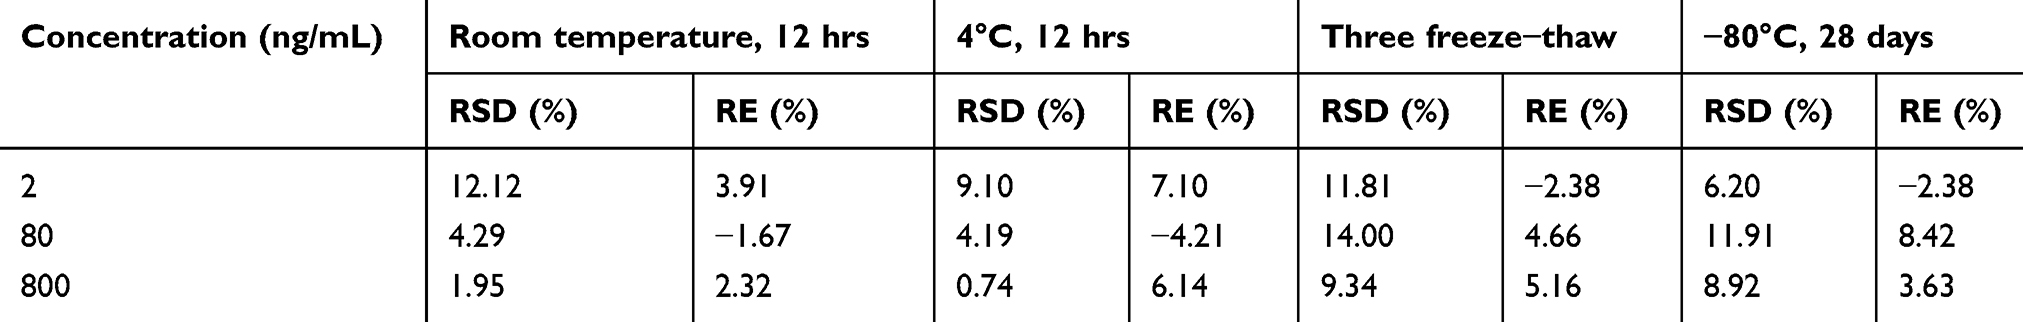 |
Table 2 Stability results of fruquintinib in rat plasma in different conditions (n=5) |
Pharmacokinetic study of fruquintinib
The current UPLC-MS/MS method was applied to the pharmacokinetic study after a single oral dose (1.0 mg/kg) of fruquintinib. The noncompartment model was used in the calculations of pharmacokinetic parameters. The pharmacokinetic parameters included t1/2, Tmax, CL/F, Cmax, AUC and are shown in Table 3. The mean plasma concentration–time profile of fruquintinib after single-dose administration is presented in Figure 3.
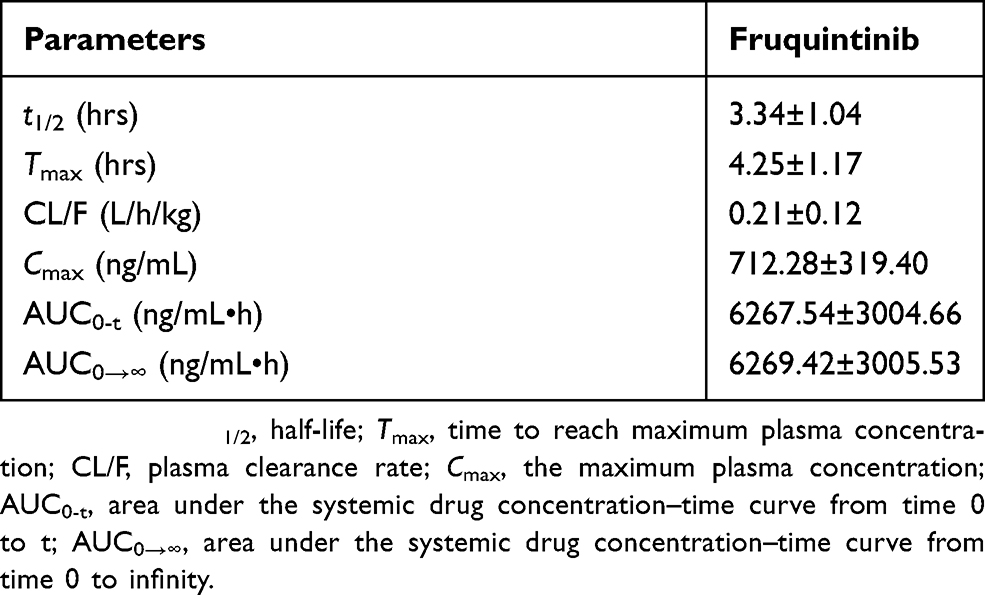 |
Table 3 The pharmacokinetic parameters of fruquintinib in rat plasma after oral administration of 1.0 mg/kg fruquintinib (n=8, mean ± SD) |
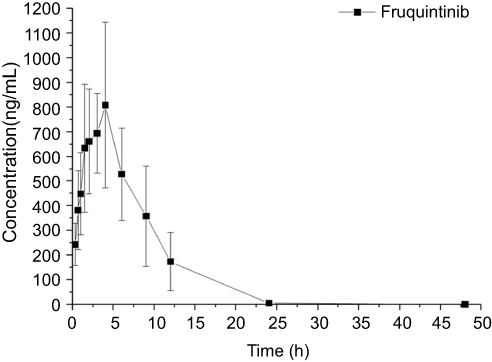 |
Figure 3 Mean plasma concentration−time profiles of fruquintinib in 8 rats (mean ± SD) after oral administration of 1.0 mg/kg fruquintinib. |
Fruquintinib was absorbed rapidly after oral administration of 1.0 mg/kg. Cmax was reached at 4.25 hrs after dosing, consistent with the previous study.25 Because of slow elimination and low tissue distribution, the mean t1/2 of fruquintinib was about 3.34 hrs in rat plasma. There were few studies to quantitate bioanalysis of fruquintinib in rat plasma. A study indicated that the terminal t1/2 ranged from 1 to 2 hrs in rat.25 But the time of sample collection was too short in that study, and the plasma concentration of parent compound was still above the minimum effective concentration or LLOQ. Meanwhile, the oral bioavailability of fruquintinib in the rat was 42–53% and its plasma protein binding fraction is 88–95%. The extents of CL and Vz in each species were different, which might lead to the different t1/2 profiles. The above facts could explain the data discrepancy in Cmax (712.28 vs 326.00 ng/mL) and t1/2 (3.34 vs 1.40 hrs).
Conclusion
In summary, a fast, simple, sensitive, and accurate UPLC-MS/MS method was established for quantitation of fruquintinib in rat plasma and then applied to the pharmacokinetic study. This method covers a wide range of the concentration curve from 1.0 to 1000 ng/mL for fruquintinib. With small sample volume, simple extraction procedure, and fast analysis, this analytical method is applicable for large studies. It would help to elucidate the potential pharmacological actions of fruquintinib through the pharmacokinetic results.
Abbreviations
UPLC-MS/MS, ultraperformance liquid chromatography-tandem mass spectrometry; LLOQ, lower limit of quantification; VEGF, vascular endothelial growth factor; VEGFR, vascular endothelial growth factor receptor; CFDA, China Food and Drug Administration; NSCLC, non-small-cell lung cancer; CRC, colorectal cancer; QCs, quality control sample; LC-MS/MS, liquid chromatography-tandem mass spectrometry; m/z, precursor-to-product ion transitions of fruquintinib.
Acknowledgment
This work was supported by the First Affiliated Hospital of Wenzhou Medical University (FHY2015019).
Disclosure
The authors report no conflicts of interest in this work.
References
1. Xu RH, Li J, Bai Y, et al. Safety and efficacy of fruquintinib in patients with previously treated metastatic colorectal cancer: a phase Ib study and a randomized double-blind phase II study. J Hematol Oncol. 2017;10(1):22–30. doi:10.1186/s13045-016-0384-9
2. Cao J, Zhang J, Peng W, et al. A Phase I study of safety and pharmacokinetics of fruquintinib, a novel selective inhibitor of vascular endothelial growth factor receptor-1, −2, and −3 tyrosine kinases in Chinese patients with advanced solid tumors. Cancer Chemother Pharmacol. 2016;78(2):259–269. doi:10.1007/s00280-016-3069-8
3. Boere IA, Hamberg P, Sleijfer S. It takes two to tango: combinations of conventional cytotoxics with compounds targeting the vascular endothelial growth factor-vascular endothelial growth factor receptor pathway in patients with solid malignancies. Cancer Sci. 2010;101(1):7–15. doi:10.1111/j.1349-7006.2009.01369.x
4. Veeravagu A, Hsu AR, Cai W, Hou LC, Tse VC, Chen X. Vascular endothelial growth factor and vascular endothelial growth factor receptor inhibitors as anti-angiogenic agents in cancer therapy. Recent Pat Anticancer Drug Discov. 2007;2(1):59–71.
5. Sun Q, Zhou J, Zhang Z, et al. Discovery of fruquintinib, a potent and highly selective small molecule inhibitor of VEGFR 1, 2, 3 tyrosine kinases for cancer therapy. Cancer Biol Ther. 2014;15(12):1635–1645. doi:10.4161/15384047.2014.964087
6. Zhou CC, Bai CX, Guan ZZ, et al. Safety and efficacy of first-line bevacizumab combination therapy in Chinese population with advanced non-squamous NSCLC: data of subgroup analyses from MO19390 (SAiL) study. Clin Transl Oncol. 2014;16(5):463–468. doi:10.1007/s12094-013-1102-5
7. Grandinetti CA, Goldspiel BR. Sorafenib and sunitinib: novel targeted therapies for renal cell cancer. Pharmacotherapy. 2007;27(8):1125–1144. doi:10.1592/phco.27.8.1125
8. Mross K, Frost A, Steinbild S, et al. A phase I dose-escalation study of regorafenib (BAY 73-4506), an inhibitor of oncogenic, angiogenic, and stromal kinases, in patients with advanced solid tumors. Clin Cancer Res. 2012;18(9):2658–2667. doi:10.1158/1078-0432.CCR-11-1900
9. Sartore-Bianchi A, Zeppellini A, Amatu A, Ricotta R, Bencardino K, Siena S. Regorafenib in metastatic colorectal cancer. Expert Rev Anticancer Ther. 2014;14(3):255–265. doi:10.1586/14737140.2014.894887
10. Keating GM, Santoro A. Sorafenib: a review of its use in advanced hepatocellular carcinoma. Drugs. 2009;69(2):223–240. doi:10.2165/00003495-200969020-00006
11. van Geel RM, Beijnen JH, Schellens JH. Concise drug review: pazopanib and axitinib. Oncologist. 2012;17(8):1081–1089. doi:10.1634/theoncologist.2012-0055
12. Nosov DA, Esteves B, Lipatov ON, et al. Antitumor activity and safety of tivozanib (AV-951) in a phase II randomized discontinuation trial in patients with renal cell carcinoma. J Clin Oncol. 2012;30(14):1678–1685. doi:10.1200/JCO.2011.35.3524
13. Rugo HS, Herbst RS, Liu G, et al. Phase I trial of the oral antiangiogenesis agent AG-013736 in patients with advanced solid tumors: pharmacokinetic and clinical results. J Clin Oncol. 2005;23(24):5474–5483. doi:10.1200/JCO.2005.04.192
14. Liang S, Xu Y, Tan F, Ding L, Ma Y, Wang M. Efficacy of icotinib in advanced lung squamous cell carcinoma. Cancer Med. 2018. doi:10.1002/cam4.1736
15. Bao SS, Wen J, Zheng X, et al. Evaluation of the inhibition effects of apatinib on human and rat cytochrome P450. Toxicol Lett. 2018. doi:10.1016/j.toxlet.2018.08.010
16. Liu S, Wei H, Gong X, et al. LC-MS/MS method for simultaneous determination of famitinib and its major metabolites in human plasma. Bioanalysis. 2018;10(11):791–801. doi:10.4155/bio-2017-0258
17. Jiang JF, Chen XY, Zhong DF. Metabolic research of domestically developed small molecule tyrosine kinase inhibitors. Yao Xue Xue Bao. 2016;51(2):248–256.
18. Silva-Oliveira RJ, Silva VA, Martinho O, et al. Cytotoxicity of allitinib, an irreversible anti-EGFR agent, in a large panel of human cancer-derived cell lines: KRAS mutation status as a predictive biomarker. Cell Oncol (Dordr). 2016;39(3):253–263. doi:10.1007/s13402-016-0270-z
19. Li J, Qin S, Xu RH, et al. Effect of fruquintinib vs placebo on overall survival in patients with previously treated metastatic colorectal cancer: the FRESCO randomized clinical trial. Jama. 2018;319(24):2486–2496. doi:10.1001/jama.2018.7855
20. Zhang L, Fan C, Guo Z, et al. Discovery of a potent dual EGFR/HER-2 inhibitor L-2 (selatinib) for the treatment of cancer. Eur J Med Chem. 2013;69:833–841. doi:10.1016/j.ejmech.2013.09.032
21. Zhou S, Shao F, Xu Z, et al. A phase I study to investigate the metabolism, excretion, and pharmacokinetics of [(14)C]fruquintinib, a novel oral selective VEGFR inhibitor, in healthy Chinese male volunteers. Cancer Chemother Pharmacol. 2017;80(3):563–573. doi:10.1007/s00280-017-3394-6
22. Cassidy S, Syed BA. Colorectal cancer drugs market. Nat Rev Drug Discov. 2017;16(8):525–526. doi:10.1038/nrd.2017.59
23. Ren Y, Sun Q, Long J, et al. Evaluation of fruquintinib, a potent and selective oral VEGFR inhibitor, in combination with targeted therapies or immune checkpoint inhibitors in preclinical tumor models. Cancer Research. 2017;77(13):19106–14404.
24. Burki TK. Fruquintinib for previously treated metastatic colorectal cancer. Lancet Oncol. 2018;19(8):e388.
25. Gu Y, Wang J, Li K, et al. Preclinical pharmacokinetics and disposition of a novel selective VEGFR inhibitor fruquintinib (HMPL-013) and the prediction of its human pharmacokinetics. Cancer Chemother Pharmacol. 2014;74(1):95–115. doi:10.1007/s00280-014-2471-3
26. Health UDo, Human services F, Drug Administration CfDE, Research CfVm. Guidance for industry, bioanalytical method validation. Fed Regist. 2001;66(4):206–207.
27. Yun C, Ding L, Leng Y, Zhu H, Wen A, Yang L. Determination of ipriflavone in human plasma by LC-MS and its application in a pharmacokinetic study. Biomed Chromatogr. 2012;26(1):123–128. doi:10.1002/bmc.1641
28. Yun C, Dashwood WM, Kwong LN, et al. Accurate quantification of PGE2 in the polyposis in rat colon (Pirc) model by surrogate analyte-based UPLC-MS/MS. J Pharm Biomed Anal. 2018;148:42–50. doi:10.1016/j.jpba.2017.07.025
29. Yun C, Yin T, Shatzer K, et al. Determination of 7alpha-OH cholesterol by LC-MS/MS: application in assessing the activity of CYP7A1 in cholestatic minipigs. J Chromatogr B Analyt Technol Biomed Life Sci. 2016;1025:76–82. doi:10.1016/j.jchromb.2016.05.005
30. Xu RA, Lin Q, Qiu X, et al. UPLC-MS/MS method for the simultaneous determination of imatinib, voriconazole and their metabolites concentrations in rat plasma. J Pharm Biomed Anal. 2019;166:6–12. doi:10.1016/j.jpba.2018.12.036
 © 2019 The Author(s). This work is published and licensed by Dove Medical Press Limited. The full terms of this license are available at https://www.dovepress.com/terms.php and incorporate the Creative Commons Attribution - Non Commercial (unported, v3.0) License.
By accessing the work you hereby accept the Terms. Non-commercial uses of the work are permitted without any further permission from Dove Medical Press Limited, provided the work is properly attributed. For permission for commercial use of this work, please see paragraphs 4.2 and 5 of our Terms.
© 2019 The Author(s). This work is published and licensed by Dove Medical Press Limited. The full terms of this license are available at https://www.dovepress.com/terms.php and incorporate the Creative Commons Attribution - Non Commercial (unported, v3.0) License.
By accessing the work you hereby accept the Terms. Non-commercial uses of the work are permitted without any further permission from Dove Medical Press Limited, provided the work is properly attributed. For permission for commercial use of this work, please see paragraphs 4.2 and 5 of our Terms.