")
Back to Archived Journals » Advances in Genomics and Genetics » Volume 7
Use of profile hidden Markov models in viral discovery: current insights
Authors Reyes A , Alves JMP, Durham AM, Gruber A
Received 9 March 2017
Accepted for publication 7 June 2017
Published 14 July 2017 Volume 2017:7 Pages 29—45
DOI https://doi.org/10.2147/AGG.S136574
Checked for plagiarism Yes
Review by Single anonymous peer review
Peer reviewer comments 2
Editor who approved publication: Dr John Martignetti
Alejandro Reyes,1–3 João Marcelo P Alves,4 Alan Mitchell Durham,5 Arthur Gruber4
1Department of Biological Sciences, Universidad de los Andes, Bogotá, Colombia; 2Department of Pathology and Immunology, Center for Genome Sciences and Systems Biology, Washington University in Saint Louis, St Louis, MO, USA; 3Max Planck Tandem Group in Computational Biology, Universidad de los Andes, Bogotá, Colombia; 4Department of Parasitology, Institute of Biomedical Sciences, 5Department of Computer Science, Institute of Mathematics and Statistics, Universidade de São Paulo, São Paulo, Brazil
Abstract: Sequence similarity searches are the bioinformatic cornerstone of molecular sequence analysis for all domains of life. However, large amounts of divergence between organisms, such as those seen among viruses, can significantly hamper analyses. Profile hidden Markov models (profile HMMs) are among the most successful approaches for dealing with this problem, which represent an invaluable tool for viral identification efforts. Profile HMMs are statistical models that convert information from a multiple sequence alignment into a set of probability values that reflect position-specific variation levels in all members of evolutionarily related sequences. Since profile HMMs represent a wide spectrum of variation, these models show higher sensitivity than conventional similarity methods such as BLAST for the detection of remote homologs. In recent years, there has been an effort to compile viral sequences from different viral taxonomic groups into integrated databases, such as Prokaryotic Virus Orthlogous Groups (pVOGs) and database of profile HMMs (vFam) database, which provide functional annotation, multiple sequence alignments, and profile HMMs. Since these databases rely on viral sequences collected from GenBank and RefSeq, they suffer in variable extent from uneven taxonomic sampling, with low sequence representation of many viral groups, which affects the efficacy of the models. One of the interesting applications of viral profile HMMs is the detection and sequence reconstruction of specific viral genomes from metagenomic data. In fact, several DNA assembly programs that use profile HMMs as seeds have been developed to identify and build gene-sized assemblies or viral genome sequences of unrestrained length, using conventional and progressive assembly approaches, respectively. In this review, we address these aspects and cover some up-to-date information on viral genomics that should be considered in the choice of molecular markers for viral discovery. Finally, we propose a roadmap for rational development of viral profile HMMs and discuss the main challenges associated with this task.
Keywords: profile hidden Markov models, viral discovery, DNA assembly, metagenomic analysis, molecular markers, de novo diagnosis
Profile hidden Markov models: introductory concepts
The goal of this section is to introduce the concepts necessary to understand the applicability of profile hidden Markov models (profile HMMs) for the process of viral discovery. For a more in-depth description on profile HMMs, the reader is referred to Durbin’s excellent book.1
Similarity searches and alignments
A very important part of the current study of living organisms relies on sequencing their genome and transcriptome to unravel functional aspects of their biology. The initial annotation of the genes of an organism generally consists in performing similarity searches against databases of sequences derived from proteins whose functions have already been determined. Good hits, arbitrarily defined as those with E-values lower than a given value, for instance 10–6, may correspond to orthologs, genes that evolved from a common ancestral gene through speciation events. Because orthologs usually retain the same function, their identification can be used to infer the functionality of novel sequences.2 The most widely used tool for this type of search is Basic Local Alignment Search Tool (BLAST),3 a software capable of searching databases of millions of sequences, which is currently the scientific community’s standard for the preliminary annotation in large-scale projects. However, in spite of its versatility and speed, there are important limitations of this method for viral discovery, which we will discuss in the forthcoming sections. A multiple sequence alignment (MSA) is an alignment of three or more biological sequences where rows represent different sequences and columns correspond to position-specific aligned residues (Figure 1). Such a representation is very useful to investigate sequence diversity across a set of orthologous sequences and it is one of the most valuable tools for inferring sequence homology (common ancestry), being widely used in phylogenetic analyses that may reveal evolutionary relationships.
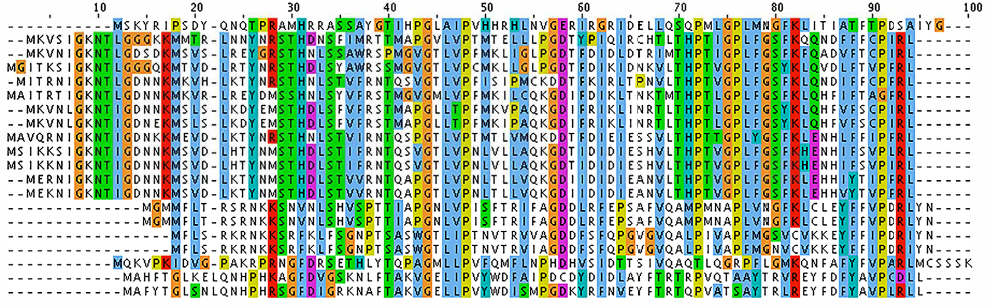 | Figure 1 Multiple sequence alignment of VP1 (major capsid protein) sequences from Alpavirinae phages. Notes: Multiple sequence alignment was performed with ClustalX using default parameters.57 Colors indicate conservation of residues according to the ClustalX color scheme.58 |
An MSA reveals two important features: 1) various positions of the alignment have different degrees of conservation, and 2) some members of the family present insertions and deletions (also known as indels) in different positions of the alignment. As examples of different conservation patterns, we can see in the MSA of Figure 1 that positions 44 and 48 are invariant throughout the family, positions 46 and 58 are highly conserved, and positions 66 and 67 are highly variable. In the case of indels, we use an operational (not evolutionary) definition to distinguish insertions (columns with more gaps than residues) from deletions (columns with more residues than gaps). Here, insertions occur in positions 22 and 95–100, whereas deletions occur at positions 3–17. These two features of the MSA demonstrate important limitations of database search by sequence alignment: variation tends to be position-specific, but the simple pairwise alignment does not contain enough information to reflect that. Since the BLAST search algorithm is position invariant for both similarity and gap evaluation, it is clear that a more refined search mechanism must be used to enhance the ability to detect orthologs.
Gap-free characterization of alignments: position probability matrix (PPM) and position-specific scoring matrix (PSSM)
The first step in developing a more precise characterization of protein families is to devise a scheme that can properly score amino acid variations based on their position in the protein. A natural way of performing this characterization is to compute amino acid frequencies in each position of the alignment. Next, we normalize these frequency counts and obtain probability measures. In our example, we would have probability 1 (100%) of amino acid P occurring at position 48 and the probability distribution {G = 0.7 (14/20), A = 0.2 (4/20), T = 0.1 (2/20)} for position 75. This computation provides a matrix with amino acid probabilities for each position; a PPM. Assuming, for simplicity, that the various positions in the alignment are independent, the probability of the whole sequence given this model equals the multiplication of the values corresponding to each amino acid in it; this enables us to evaluate whether this new sequence belongs to the group of interest. The PPM for positions 46–49 of the MSA in Figure 1 is depicted in Table 1 (for brevity, absent amino acids are not listed). In this case, if we evaluate two hypothetical new sequences where the corresponding values at positions 46–49 are, respectively, “LVPV” and “LPPV”, the probability associated with “LVPV” would be 0.114 (0.95*0.6*1*0.2) and with “LPPV” would be 0 (0.95*0*1*0.2), since amino acid P is absent from our alignment in position 47.
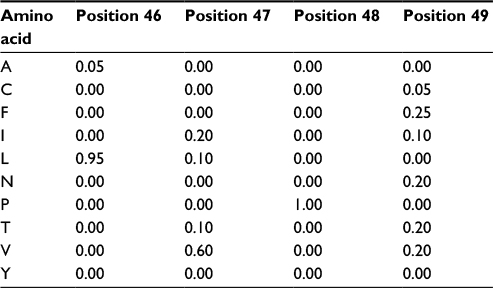 | Table 1 Probability values for positions 46–49 from the multiple sequence alignment depicted in Figure 1 |
The PPM model demands that any new members of the group do not present, in any position of the alignment, amino acids not observed previously or the resulting probability will be zero. However, we do not know if the original set of proteins used to compute the probabilities (our “training set”) presents all naturally occurring amino acid variations for every column of the alignment. The solution is to increment the model with the possibility of accepting, in every position of the MSA, amino acids that have never been observed there. Thus, unless there is a strong biological reason against it, we should accept, with at least a low probability, the possibility of all amino acids occurring in all positions. The easy way to do that is to use “pseudocounts”: assign an initial count to the frequencies of every one of the twenty amino acids in all positions of the MSA, thus changing the values in the PPM. Hence, any sequence will have a total probability different from zero, albeit sequences very different from the original ones will present very low probability counts. Pseudocounts do not have to be integer numbers. A good rule of thumb is to ensure pseudocounts are lower than the frequency of any other residue present in the alignment (for a large number of sequences, the square root of this number could be used). Table 2 shows the effect of using pseudocounts of 0.5 in the previous PPM (Table 1). All amino acids not observed in the MSA would have probability 0.0167 (0.5/(20+20*0.5)). With this incremented model, the sequence “LPPV” would now have a total probability of 0.00111, instead of zero. On the other hand, the “LVPV” sequence would have a probability of 0.0277, lower than the previous value (0.114).
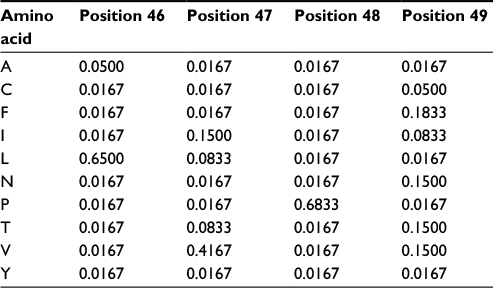 | Table 2 Probability values with pseudocounts for positions 46–49 from the multiple sequence alignment depicted in Figure 1 Note: The matrix was constructed using pseudocounts of 0.5. |
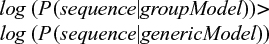
The model is now robust enough to deal with real-life incomplete training sets. However, we still need to address another question: what is the cutoff probability to accept a new sequence as part of a group? The solution to this problem requires more sophisticated concepts such as the Bayes theorem and is out of the scope of this article. The interested reader should refer to more detailed bibliography for further details.1 There are many ways to compute probability thresholds. In our case, the standard solution involves using an alternative model. This alternative model represents a “generic” protein sequence, where all amino acid frequencies are equal (1/20=0.05). If the total probability in the MSA model is higher than that in the alternative one, we infer that it is more likely that the protein belongs to this group than being a generic protein in nature. Formally:
|
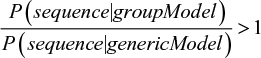
In our case, the probability of the generic model would be 0.00000625 for both “LPPV” and “LVPV” sequences (0.05*0.05*0.05*0.05), which is lower than the probabilities computed using our model: 0.0011 and 0.0277, respectively. Therefore, both would be classified as being part of the group. In practice, due to computer architecture limitations that are beyond the scope of this review, probability values must be converted to logarithms, originating a more sophisticated model called PSSM. The original formula now changes as follows:
|
This is rearranged as follows:
|
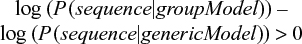
Since we are calculating in log space, the multiplication of positional probabilities is the same as the addition of the corresponding logarithms, i.e., log(x1 * x2 * ... * xn) = log x1 + log x2 + ... + log xn. When scoring a new sequence, we use the matrix to assign a value to each position and then simply add up all the scores. If the score is positive, the probability of the sequence in our model is higher than the probability of the sequence in the generic model.
Dealing with gaps and insertions: profile HMMs
With PPMs, we can build a classifier based on a gap-free alignment, but most MSAs of protein sequences present indels. As discussed earlier, insertions and deletions generally occur in specific positions of the proteins and have similar lengths. To improve our characterization, we need another probabilistic model. This new model, the profile hidden Markov model (profile HMM),4 can be seen as a generalization of PPMs. Initially, we can represent the previous PPM as a series of “match” states, each one representing one column of the gap-free alignment, with a “Begin” state and an “End” state, and arrows indicating state order (Figure 2).
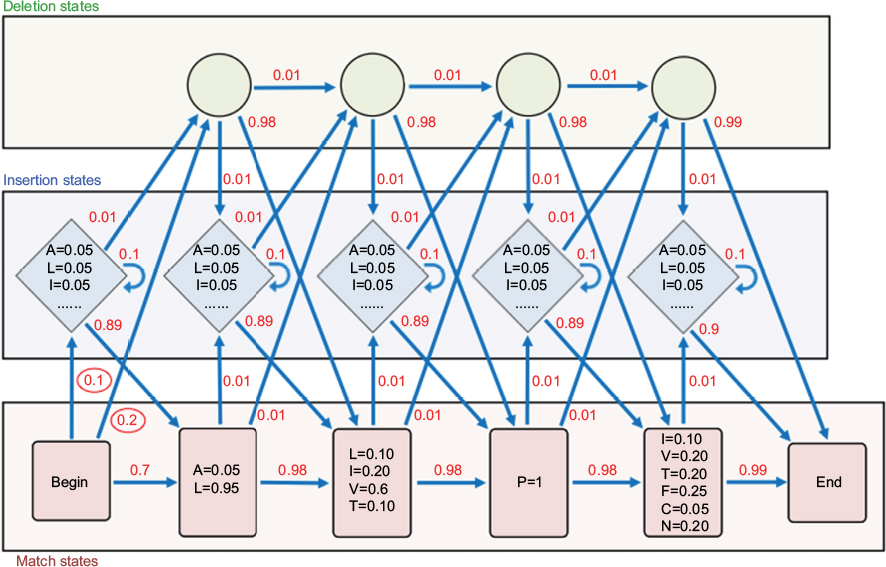 | Figure 2 Diagram representing a profile hidden Markov model (profile HMM). Notes: Match states are represented as red rectangles, deletion (silent) states as green circles, and insertion states as blue diamonds. The red numerical values next to the arrows indicate transition probabilities. The equalities inside the states indicate amino acid probabilities, generally called emission probabilities. These emission probabilities do not include the use of pseudocounts. Match states use emission probabilities computed from the original alignment; insertion states use background amino acid probability values of 1/20. The transition probabilities highlighted with red circles indicate the probabilities described in the text. The other transition probabilities were arbitrarily set to make the figure more homogeneous and to increase clarity. |
Insertions and deletions are modeled with extra states. Each deletion is modeled as a “deletion” (silent) state that can be used to bypass the original “match” state. Each insertion is modeled as a new regular state, preceding each of the original “match” states. “Deletion” (silent) states, as the name implies, do not have probabilities associated with amino acid residues. Insertion states present amino acid probabilities based on the background amino acid frequencies. In this new model, there are extra arrows (transitions) indicating that we can go through the silent states, skipping one or more of the original states, or go through the insertion states, inserting new residues. To model the frequency in which we have gaps and insertions, we assign probability values to the transitions. In the example of Figure 2, the transition from the “Begin” state to the first insertion state, with value 0.1, means that we have an insertion at this position in 10% of the sequences of the original alignment. Also, the transition from the “Begin” state to the first silent state, with value 0.2, means that 20% of the sequences in the original alignment have a deletion in the first position. Note that insertion states are different from others because they have “self-transitions”. Self-transitions model the length of the insertions: the higher the probability of the self-transitions, the higher the average length of the inserted sequences. It is worth mentioning that only a few types of transitions are allowed. For instance, starting from a “match” state, it is possible to have a transition probability to the next “insertion” state, a transition to the next “deletion” state (in this case representing the probability of skipping the next match state), or a transition to the next “match” state (assuming no insertions between two consecutive “match” states). From a “deletion” state, we can transition to the next “deletion” state (skipping the next “match” state), to an “insertion” state (if there is an insertion before the next “match” state, when the current position is missing), and to the next “match” state (if the “match” state follows a deletion on the current position). Finally, from an insertion state, we can have self-transitions (related, as we mentioned earlier, to the size of the insert), a transition to the next “deletion” state (skipping the next “match” state), and a transition to the next “match” state. This architecture ensures that we can evaluate each possible sequence and, at the same time, reduce the number of parameters in the final model.
Profile HMMs are a powerful identification tool, as they are able to characterize more precisely each position of a protein, as well as insertions and deletions. Profile HMMs increase generalization capability when compared to simple alignments and help finding more divergent members of the protein families. Considering that viral genomes present high evolutionary rates and, as such, are much more divergent than prokaryotic and eukaryotic genomes, profile HMMs are very effective in representing viral protein diversity.
Viral diversity
Viruses are estimated to be the most abundant and diverse biological entity on the planet.5 Their abundance comes from a very high reproductive rate, also known as viral burst size, a consequence of the number of viral particles generated in each cell during the infection cycle. Furthermore, a high mutation rate allows them to be highly divergent and promotes the observed variability. In contrast to studies in cellular organisms, where a consistent taxonomy with a clear phylogeny from a common ancestor is observed, the phylogenetic origin of viruses is unknown. Different hypotheses have been presented and is not clear even whether all viruses have derived from a single common ancestor, nor the position of their origin relative to the Last Universal Common Ancestor.6 Notwithstanding genetic variation, there are certain processes that all viruses undergo during their life cycle, such as adhesion, insertion of nucleic acid into the host cell, replication, and assembly of the viral particle. This would suggest that frequently shared genes might be identified, allowing a proper global phylogenetic analysis. However, no gene common to all viruses exists, which implies that different viral markers must be used for phylogenetic studies of distinct taxonomic groups. Viruses are usually classified based on their genetic material: dsDNA or ssDNA; dsRNA or ssRNA (positive or negative sense). Each of these types of genomes requires different strategies for replication, with no single polymerase type fulfilling this task for all viruses.6 Another conserved feature commonly used for viral taxonomy is particle morphology, with capsid structure being highly conserved for different viral families. However, different evolutionary forces can often lead to similar structures for different capsid proteins by convergent evolution rather than a common origin for the different capsid proteins.7 The rate of diversity and mutation is dependent on different factors; the nucleic acid type, in particular, has great influence. RNA viruses are among those with the highest mutation rates due to error-prone polymerases, and this feature is believed to help with adaptation. Nevertheless, high mutation rates are balanced by selective pressure.8 Selection and its constraints on diversity depend on the viral environment and host. For example, the hepatitis C virus (HCV), a small (+)ssRNA virus and one of the causal agents of hepatitis, presents up to 30% variation at the nucleotide level within distinct genotypes. However, the genome does maintain a very cohesive structure and synteny, which would mostly be enforced by the restricted host range limited to infecting the human liver.9 Similar constraints are observed in all viral families and they make possible any type of molecular characterization within specific viral clades. Viral diversity does not rely solely on mutation for variability, as other factors such as genetic recombination also play important roles. However, differently from what is observed in cellular organisms, viral capsids impose a very tight carrying capacity constraint, significantly limiting the space for acquisition of novel genes. Hence, gene remodeling has been observed as an alternative for gaining novel functions without increasing genome length. Gene remodeling consists of recombination between two different protein-coding genes to generate novel composite genes that can provide the viruses with new properties and functions. A recent survey studied 3,008 viral genomes and detected an abundance of 8%–15% of composite genes,10 suggesting gene remodeling as an important mechanism for viral evolution and a major source of potential misinterpretations when analyzing viral evolution through protein or domain similarity. This aspect partially explains why viral molecular evolution has been studied mainly in the context of particular viral families and specifically within a certain environment or host range.
Molecular markers in virology
The recent advent of next-generation sequencing (NGS) technologies has greatly impacted the study of microbial and viral communities, where full shotgun sequencing and amplicon sequencing have been the main methods employed. The use of these technologies for the characterization of viral communities presents various challenges. Methods such as full shotgun metagenomics usually require purification and concentration of viral particles prior to sequencing, since their genome content usually constitutes less than 5% of the total nucleic acid of a given microbial community. The capacity of viruses to exist in proviral forms, integrated within host genomes, makes it harder to identify proteins of viral origin, even when one does not consider horizontal gene transfer events. Once the viral nucleic acids are isolated and sequenced, the next challenge is to computationally characterize those sequences. The vast majority of the currently available viral sequences is derived from cultivated viruses that have already been classified. This small, highly biased subset of viruses explains the poor representation of viral diversity observed in public databases (see next section). Furthermore, due to a combination of high mutation rates and high selective pressure, viral genes evolve very rapidly. Considering the fact that pairwise alignment methods seem to be limited by a threshold value of 30% for identifying true homologs,11 identifying homology is an extremely challenging task, hampering our capacity to ascribe potential functions to genes. This feature is even more evident in RNA viruses, which present high evolutionary rates.12 These challenges, combined with potential sequencing errors and relative short length of reads generated by high-throughput sequencers, restrict conventional BLAST-based approaches to a successful classification rate ranging from 10% to 90% of the sequences from viral genomes.13 It has been demonstrated that alternative methods, based on the use of protein profiles such as PSSMs and HMMs, detect three times as many remote homologs than conventional pairwise methods.14 Several public databases with search algorithms based on probabilistic methods are available, such as Pfam, SMART and TIGRFAMs, using profile HMMs, and CDD, using PSSMs. However, these invaluable resources rely on available sequences that limit their usability for viruses.
Despite the challenges of viral discovery, the power of metagenomic methods should not be underestimated. For instance, a recent computational study extracted all potential viral sequences from more than 3,000 metagenomes and assembled the sequences into viral contigs. This effort allowed the identification of over 125,000 contigs, coding for ~2.79 million proteins, 75% of which revealed no sequence similarity to known isolated viruses.15 Amplicon sequencing is a cheaper and more cost-efficient way of characterizing a microbial community. This method is limited, however, by the requirement of a conserved molecular marker. A universal marker, such as 16S rRNA in bacteria, capable of detecting and discriminating all viruses will never exist; conserved markers can generally be used only for some viral groups. Sakowski et al have proposed that a proper viral phylogenetic marker should, 1) be widely distributed, 2) be abundant in the studied environment, 3) play an important role in viral biology, 4) have a single evolutionary origin, 5) be phylogenetically informative, and 6) be well represented in reference databases.16 One such marker that has been traditionally used for different subsets of viruses is DNA polymerase. However, due to limitations of the available databases, primer design on existing sequences tends to be biased or fall short of amplifying all the diversity within a family. Schmidt et al have recently suggested that the currently available metagenomes can be used to survey gene diversity of potential gene markers in order to provide a better source for the design of more comprehensive primers, an approach that has been applied to DNA polymerase in marine environments.17 Regardless of the aforementioned limitations, different genes have been employed as potential molecular markers for particular viral groups; here we present four such genes.
Most of the viral discovery methods using viral markers are derived from studies in phages where markers previously identified in known phages were used to describe novel organisms. The major capsid protein (MCP), a common member of the core genes for different viral families, is essential for viral structure and has been frequently used to detect and classify viruses. A recent study shows that the use of MCP for characterizing members of the Phycodnaviridae provides better results than using DNA polymerase.18 Another successful example comes from the use of MCP to demonstrate that the Gokushovirinae, a subfamily of the Microviridae, once believed to be of narrow, eukaryote-associated distribution, presents, in fact, a broader cosmopolitan distribution, being identified in many different marine environments.19 Among the viral phylogenetic markers, one that has not been widely used but is increasingly gaining importance, is the ribonucleotide reductase (RNR). RNR comprises a family of enzymes that reduce ribonucleotides to deoxyribonucleotides and is, therefore, essential to DNA synthesis. The corresponding genes are widely abundant in cellular life and commonly found in viral genomes, being estimated, for example, to be present in over 90% of dsDNA viroplankton. Their distribution and diversity correlate well with the different subfamilies among the Caudovirales in marine environments.16 Further studies of RNR distribution among viruses have shown different abundances among Myoviridae (65%), Siphoviridae (30%), and Podoviridae (3%), with the class or RNR varying also according to the isolation environment and to the host’s ability to utilize oxygen.20 Another set of markers that have been recently used in viral studies consists of the photosystem I and II genes carried by cyanophages. Although it was suggested that these genes may have originated from horizontal gene transfer events, thus lacking strong taxonomic information, they were successfully used together with degenerate polymerase chain reaction (PCR) to identify clusters of cyanoviruses.21 Finally, phoH, a host-derived auxiliary metabolic gene, has been used as a molecular marker for marine viruses, due to its presence in multiple families of dsDNA tailed phages. Using phoH in samples of multiple depths and in different seasons, it was possible to characterize both diversity and stability of the phoH harboring community, which is very diverse but uneven, with few (operational taxonomic units) dominating at different depths and times.22
In eukaryotic viruses, recent efforts using NGS focus more on full shotgun metagenomics for the discovery of novel viral entities.23–25 However, molecular markers are still used in eukaryotic viruses to characterize micro-variation within particular viral species, with most of that variation being commonly observed in RNA viruses. Some genes are known to harbor important genetic diversity such as the neuraminidase in the case of influenza A or the use of the env, gag, and pol genes to characterize sequence diversity in HIV-1 isolates.26,27 Another interesting example is HCV which is also well known for the high mutation rates and where genotyping efforts have focused on different proteins, including NS5A,28 NS5B,29 the E1 and/or E2,29,30 or even a composite fragment from short segments derived from the NS3, NS5A, and NS5B genes.31
Profile HMM databases derived from viral sequences
Public sequence databases are fundamental research tools that have revolutionized molecular biology research for all domains of life. Accordingly, given the medical and ecological importance of viruses, there are many viral sequence databases available, with scope ranging from those including all viruses to those that focus on more specific viral groups (e.g., an order, a family, or a virus related to a disease). Virus sequence databases are plentiful and very popular resources in virology, and a comprehensive survey of web resources on the field of virus research has been recently reported.32 As discussed in the former section, most of the publicly available viral sequences are derived from known viruses that can be cultivated, and several technical challenges severely limit the rate at which novel viruses are being discovered and characterized. In spite of the huge amount of sequencing data deposited in public databases, complete viral genomes are relatively scarce. In fact, a survey of the complete RefSeq release of viral and viroid sequences, at the NCBI Viral Genomes Resource,33 revealed 8,227 genome entries (as of March 18, 2017). A search for complete genomes of bacteria at the NCBI Microbial Genomes Resources showed many more entries, 13,351, despite the fact that prokaryotic genomes are usually two to three orders of magnitude larger than viral genomes. A list of all viral genomes from the NCBI Viral Genomes Resource, comprising 111,340 entries, also revealed a highly biased representation of different viral families, with Flaviviridae showing 11,623 entries, whereas Togaviridae presented 1,298 and Adenoviridae only 665. These numbers exemplify how far we are from a reasonable representation of viral diversity in public databases.
As we have seen earlier, profile HMMs are a powerful way of modeling sequence diversity within a statistical framework. While some generic profile HMM-based databases such as Pfam include viral protein sequence families,34 it is estimated that less than 20% of the currently available viral protein sequences are represented in Pfam.35 In recent years, there has been an effort to compile viral sequences from different viral taxonomic groups into integrated databases that also include profile HMMs (Table 3). With the exception of HIValign, a tool whose underlying HMM database does not seem to be available for direct third-party use (only the corresponding FASTA sequences are available), all other databases listed in Table 3 are either searchable online or can be downloaded for searches in the user’s own servers. From this list, Prokaryotic Virus Orthologous Groups (pVOGs), viral profile HMM database (vFam), and viral orthologous groups (OGs) are the most comprehensive databases, providing functional annotation and profile HMMs, among other data.35–37 However, since these profile HMM databases rely on viral sequences collected from GenBank and RefSeq, they suffer in variable extent from uneven taxonomic sampling, with low sequence representation of many viral groups, which may affect the efficacy of the models.
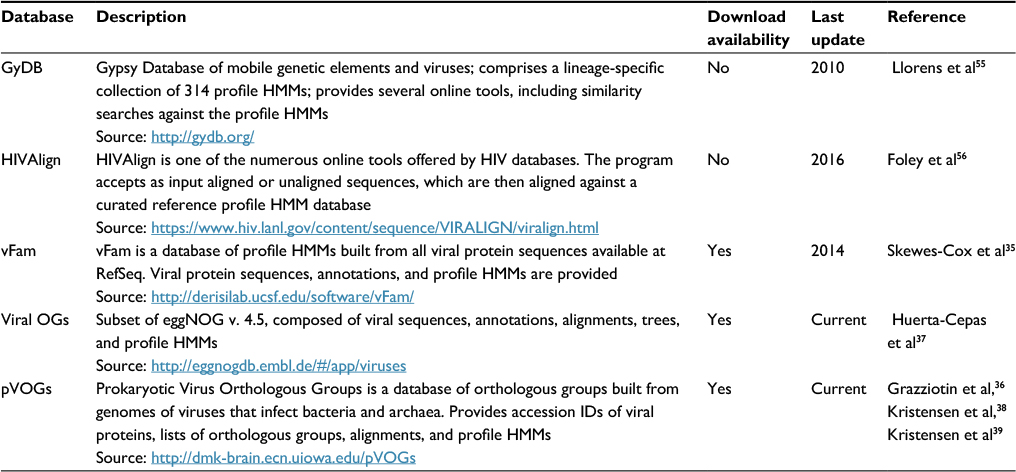 | Table 3 Web resources of viral profile HMM databases and tools Abbreviation: profile HMMs, profile hidden Markov models. |
The pVOGs,36 a recent update of the formerly called Phage Orthologous Groups (POGs),38,39 is constructed within the microbial Cluster of Orthologous Groups framework and comprises a set of orthologous gene families built from complete genomes of viruses that infect bacteria and archaea.40 The current version (as of March 2017), updated in 2016, presents 9,518 OGs (and profile HMMs) and comprises 296,595 protein sequences. In addition to profile HMMs, the database offers a plethora of data, including protein sequences, MSAs, and functional annotations. Another comprehensive and relevant viral resource is vFam, a database of viral profile HMMs built from all virus-derived (non-phage) annotated protein sequences available at RefSeq. The last update of the database was in 2014 and presents 5,585 OGs comprising 29,655 proteins. Viral protein sequences, functional annotations, and profile HMMs are provided.
Both databases, pVOGs and vFam, provide mappings across functional annotation, orthology groups, and taxonomic classification. The available profile HMMs are, therefore, very useful for functional and taxonomic identification of viral proteins from genomic and metagenomic uncharacterized data. Despite their invaluable importance as integrated viral data resources, both pVOGs and vFam are severely limited by the relatively low number of publicly available viral sequences, the primary data source from which they are derived. Corroborating this perception, a graph depicting statistics over time, displayed in the pVOGs website (http://dmk-brain.ecn.uiowa.edu/pVOGs/), illustrates how viral diversity is still barely explored. The graph shows that the numbers of genomes and VOGs in the 2016 release are about three times larger than those seen in 2013. This indicates that the curve is still far from reaching saturation: if one keeps looking for microbial viruses, the amount of novel ones will be substantial. The situation is likely to be the same for other kinds of virus. Both pVOGs and vFam also suffer from limited and very skewed taxonomic coverage: only a few OGs are comprised by a large number of sequences; the vast majority of OGs are derived from alignments of very few sequences, thus limiting the amount of variation modeled in the profile HMMs. vFam has on average 5.31± 9.73 sequences per OG (median: 3), while pVOGs fares a little better with an average of 20.49±103.40 and a median of six sequences per OG. Additionally, pVOGs data also include the number of genomes involved in each group, which is on average 19.38±62.99 genomes per OG (median: 6). The fact that the numbers of genes and genomes per OG are very similar indicates that most viral genomes contain single copies of most genes, as expected. Figure 3 depicts the full distribution of sequences in OGs in these two databases. Taxonomic distribution is also far from even among the OGs, with few families dominating the databases. In pVOGs, only 18 viral families are present and, of these, three include 86% of the nearly 3,000 genomes (i.e., Siphoviridae: 1,421 genomes; Myoviridae: 671 genomes; and Podoviridae: 466 genomes). vFam, on the other hand, shows a slightly less skewed, and more diversified, taxonomic distribution at the family level, probably due to its broader taxonomic sampling (62 non-phage families). The full distribution of number of proteins per orthologous group in vFam and pVOGs can be seen in Figure S1, which demonstrates the aforementioned points: the vast majority of profile HMM models are based on few sequences per OG, and a few viral families are greatly overrepresented in the OG models. Thus, to make such databases more useful and informative, the characterization of a greater amount of viral sequences, from a broader taxonomic range, is of paramount importance.
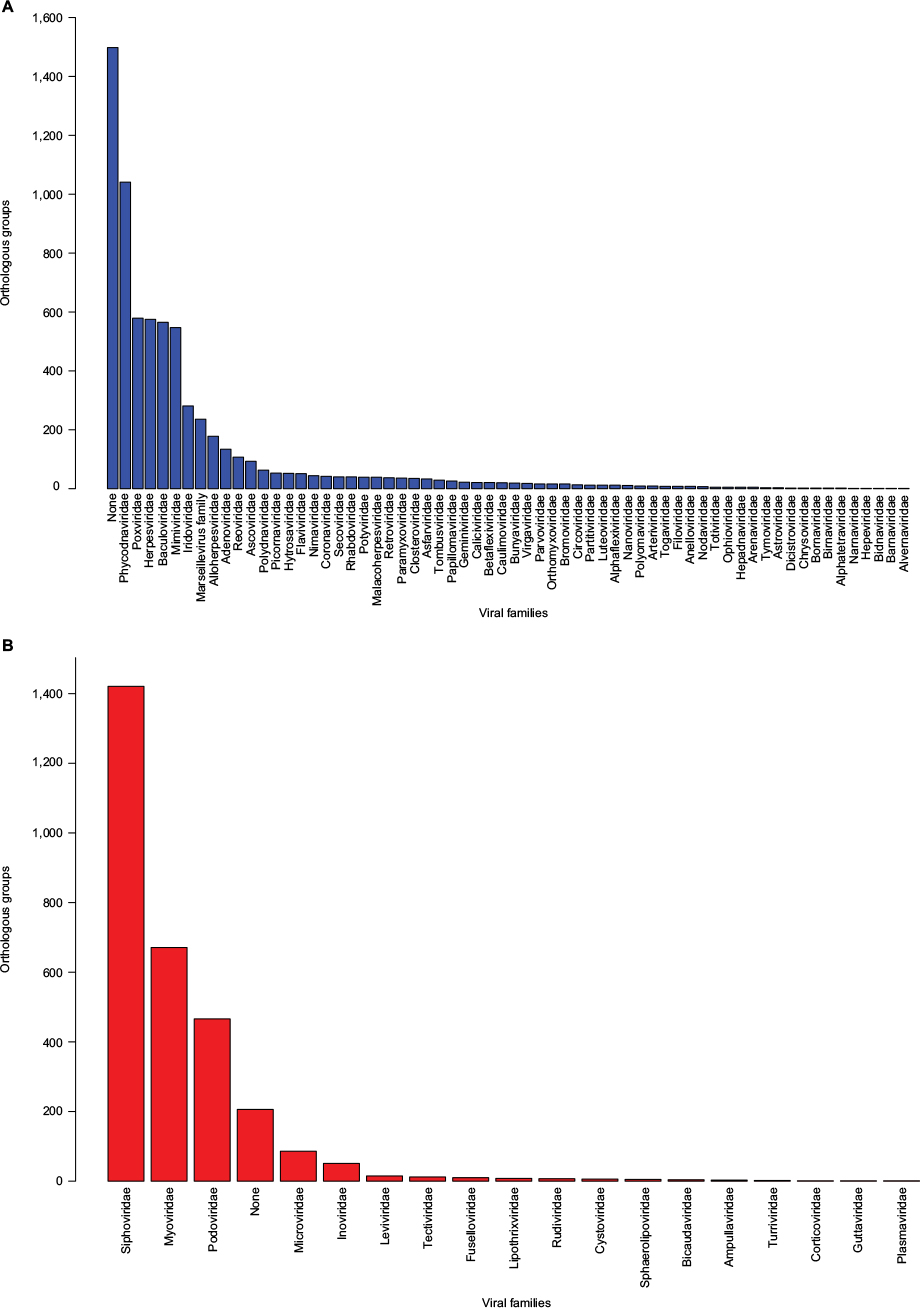 | Figure 3 Distribution of orthologous groups from vFam35 (A) and pVOGs36 (B) according to the viral families. Notes: To obtain quantitative data, the number of corresponding profile HMM/orthologous groups was determined for each viral family based on the annotation provided in the database files. Profile HMMs from the original databases are derived from viruses of either single or multiple families. Abbreviations: pVOGs, Prokaryotic Virus Orthologous Groups; vFAM, viral profile HMM database; profile HMMs, profile hidden Markov models. |
Another recent effort to include a viral information division (viral OGs) to a general orthology database is the eggNOG version 4.5 database.37 This resource contains 2,605 OGs, comprised by 5,228 proteins derived from 352 viral genomes. However, this database presents several problems, including the fact that the classification mixes taxonomic names such as orders and biological features like the virus presenting single- or double-stranded RNA or DNA genome. Finally, similarly to what was observed in vFAM and pVOGs, the distribution of OGs according to viral groups is also highly biased, with 2,194 profile HMMs (84.2%) comprising only four viral groups: viruses (a mix of different viruses), dsDNA, Caudovirales, and Herpesvirales.
Sequence assembly approaches using profile HMMs
Using profile HMMs as seeds
As discussed earlier, profile HMMs model the diversity of a set of orthologs using an MSA of these sequences as a training set. Such a model, based on a profile, is more sensitive in the detection of remote orthology than pairwise alignment methods.14 One of the most promising applications of profile HMMs is their use as seeds to detect and “fish” reads, which can subsequently be assembled, from metagenomic datasets. By nucleating such reads, often of unknown origin, and assembling them into longer sequences, one can more effectively validate their viral origin.35 There is a huge number of sequence assembly tools available (see http://www.mybiosoftware.com/assembly-tools for a non-exhaustive list), but we found only six such programs in the literature that report the use of profile HMM seeds in their operations (Table 4). Profile HMMs can be used in seeded assemblies in two main approaches: 1) gene-sized, and 2) progressive assemblies. In the former method, the profile HMM is used in similarity searches against metagenomic data to identify similar reads, which are in turn assembled. Because the assembled sequence does not significantly extend the length of the sequences originally used to derive the profile HMM, one refers to it as a “gene-sized” assembly. In the latter approach, sequence ends of the assembled sequence are used as extension seeds to recruit a new bunch of reads, which are then assembled with this sequence. Such assembly cycle is iteratively performed, resulting in a step-by-step extension of the assembled sequence, an approach named “progressive assembly”.41,42
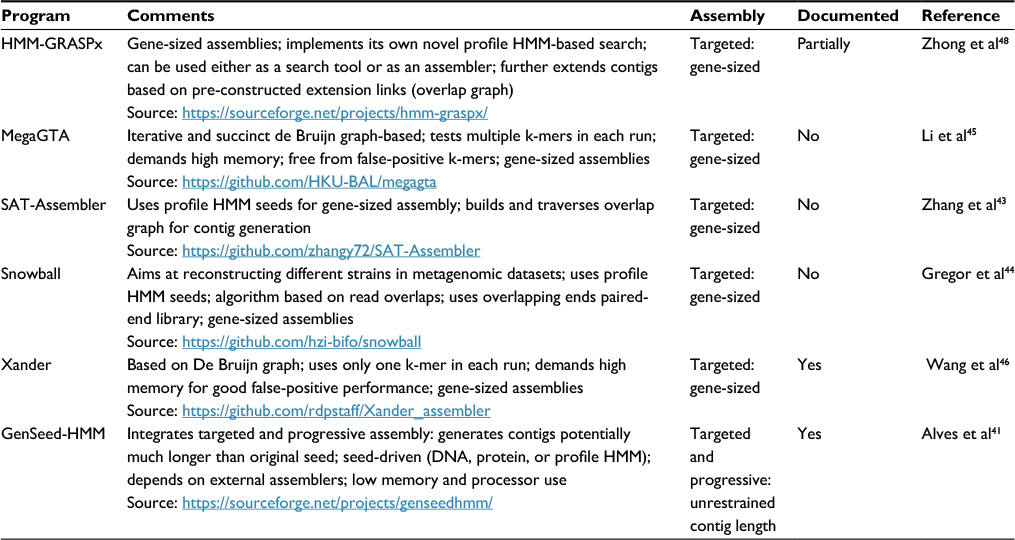 | Table 4 Publicly available targeted assembly tools that use profile HMM seeds Notes: We have considered as properly documented those programs that present an external file (and not just help on the command-line or a short README file) with detailed description of program installation, operation, and options. Partially documented programs include a README file (either in the downloadable package or directly online) with reasonably detailed installation, option, and usage information (that is not simply a repetition of the command-line help). GenSeed-HMM also includes a detailed step-by-step tutorial with included example files. Abbreviation: profile HMMs, profile hidden Markov models. |
Seed-driven gene-sized assembly
In this section, we will discuss those tools that are geared toward the assembly of gene-sized sequences from raw metagenomics data, although they are not necessarily limited to that kind of data. SAT-Assembler,43 one of the first profile HMM–assisted assemblers, aims at recovering gene-sized sequences from high-throughput, second-generation datasets. It assembles only those reads that match one or more user-selected profile HMMs using an overlap graph. The authors compared this tool to global assemblers (i.e., those that assemble all reads, without any kind of similarity-based filtering) such as Velvet, IDBA-UD, and MetaVelvet, and observed that the seeded approach was more efficient and yielded as good as or better results than global (de novo) assembly. Snowball is a metagenomics assembler designed to differentiate between closely related strains.44 It uses an overlap-based approach, with error correction being performed using the overlap between the ends of a paired-end sequence. Compared to SAT-Assembler, Snowball has shown much greater power of discrimination between closely related strains. MegaGTA and Xander are programs that perform targeted assembly using de Bruijn graphs.45,46 According to the authors, MegaGTA performs much faster (two to ten times) than Xander and can employ multiple k-mers of different sizes in the same run, while Xander is limited to using one k-mer at a time during a run. The use of de Bruin graphs by these two applications implies, as a consequence, a demand for potentially very large amounts of computer working memory (RAM), in the order of tens or hundreds of gigabytes. HMM-GRASPx (guided reference-based assembly of short peptides) is a program that, instead of using third-party programs such as HMMER3 for the identification of reads to assemble, implements its own search algorithm by combining the simultaneous alignment and assembly approach using a banded Viterbi dynamic programming algorithm.47,48 HMM-GRASPx can be used either as a search tool (searching reads against profile HMMs, for example) or as an assembly program, reconstructing complete or almost complete gene-sized sequences. Given its nature as a search tool, the authors have compared this tool to other search programs such as HMMER3 and RPS-BLAST, outperforming them in sensitivity but underperforming them slightly in precision.
Seed-driven progressive assembly
The targeted assembly tools presented earlier use one or more profile HMMs as seeds to recruit reads, which are subsequently assembled by conventional de novo assembly generating gene-size contigs. GenSeed was the first sequence reconstruction program to integrate targeted assembly and an iterative assembly algorithm, the so-called progressive assembly, into a single tool.42 The program uses short nucleotide or protein sequences in BLAST similarity searches to select reads, which are then assembled together with the seed sequence, incrementing its original length. Short sequences (extension seeds) are then extracted from the contig ends and used as new seeds to recruit more reads, which are subsequently assembled with the formerly built contig. The iterative assembly continues until one of the following conditions is satisfied: 1) the contig reaches the maximum length defined by the user; 2) the algorithm reaches the maximum number of iterations, also defined by the user; 3) no new read has been added compared to the preceding assembly step, or 4) no contig size increment has been observed since the previous iteration. A similar seed-driven progressive assembly method was later implemented in PRICE and IVA.49,50 These programs have been successfully used for viral genome assembly from metagenomics data (see review by Smits et al51 for more details). However, unlike GenSeed, which uses either nucleotide or protein sequences as seeds, PRICE and IVA are restricted to the use of nucleic acid sequence seeds. A remarkable advantage of progressive assembly tools over gene-sized assembly programs is the fact that the final assembled sequence can be much longer than the gene covered by the original seed and even cover a full-length viral genome. Recently, Alves et al reported the development of GenSeed-HMM,41 a completely revised version of GenSeed, which incorporates the use of profile HMMs as seeds and is compatible with NGS data. As a proof-of-principle, the authors used GenSeed-HMM on human fecal samples (454 platform) and raw sewage (Illumina platform) datasets to reconstruct viral sequences from phages of the subfamily Alpavirinae (Microviridae family). Using profile HMM seeds derived from short sequences of VP1 (major capsid protein) and VP4 (genome replication initiation protein), the authors obtained a large number of partial and complete genome sequences. The program’s seed-driven progressive assembly approach consistently outperformed global assemblers (e.g., Newbler) in the several metrics employed.
A roadmap for rational design of profile HMMs
Knowing the limitations of profile HMMs
In the first part of this article, we discussed the theoretical aspects of the different models that can be used in MSA data to assess sequence diversity. We concluded that profile HMMs are powerful tools that may efficiently represent a wide spectrum of variation. However, this kind of model has some limitations and drawbacks. First, profile HMM construction relies on an initial MSA, which works as a training set. The quality of the MSA will directly impact the profile HMM: if the alignment presents misaligned stretches of one of more sequences, the impacted positions (columns) will lead to mistaken residue frequencies and, hence, wrong models. Such models will show lower accuracy when used for the detection of potential new members of the group.
Many different alignment tools are available for producing MSAs, but they may often produce different results – sometimes to a large extent – for any non-trivial alignment. Because the real evolutionary history of the genes involved is not known, there is no way to define which program, if any, is closer to the truth. We advocate that careful manual editing of the MSA before building the profile HMM is, therefore, essential for good accuracy. Although such an approach may potentially introduce biases, models derived from these MSAs can be validated through straightforward analyses. The second important aspect is that a good training set alignment should represent all possible amino acid variations at each position, as well as present all the indels that could occur without disturbing protein function. It is obviously impossible to know beforehand when a training set is large enough to be representative, but a rule of thumb is that we need as many proteins in the alignment as possible, in order to represent repertoire diversity. As discussed in the introductory section of this article, pseudocounts guarantee that, no matter the size of the training set, we are still able to analyze any protein. However, with small training sets, pseudocounts dominate the final frequencies, generating poor classifiers. Another aspect that must be taken into account is that a high number of sequences per se is not enough to constitute a good training set. If proteins from a specific taxonomic subgroup dominate the training set, classification will be skewed to the frequencies of this subgroup. Hence, the model will be biased and less likely to detect proteins that are more distantly related. An ideal alignment should be composed of sequences that represent the diversity of group of interest, avoiding sampling biases that could overrepresent specific subgroups, thus leading to profile dilution. It is essential, therefore, to examine the initial MSA and check if there is good balance among the sequences, with no overrepresentation of very similar sequences or low sampling of more diverse ones. For this reason, we recommend careful selection of sets of sequences that are representative of the viral group’s diversity, instead of uncritically using thousands of sequences for the training set. A possible solution for this problem might involve the construction of a phylogenetic tree, followed by partition into clusters using patristic distance analysis,52 and selection of representatives from each cluster. Finally, another limitation of profile HMMs is related to one of the assumptions of the probabilistic model itself – all positions of the alignment are independent from each other. This is clearly not true, since protein folding is governed by interactions between amino acid residues that are often distant from each other in the polypeptide chain. These interactions mean that sites can present coevolutionary dependencies, which are not considered in the model. Coevolution-inspired computational methods are required to identify such long-range dependencies in sequences,53 but they come with a much higher computational cost and the need of much larger training sets.
The choice of molecular markers and seed regions
In a previous section (“Molecular markers in virology”), we discussed the fact that, because of the extremely high viral diversity, no universal marker is available for viruses. In addition, we presented some of the molecular markers that have been proposed for specific groups of viruses. Finally, to illustrate the complexity of viral evolution and resulting diversity, we mentioned that some viruses may undergo a process of gene remodeling, which generates novel composite genes (see “Viral diversity” section). The latter feature implies that evolutionarily unrelated viruses may show genome mosaicism and share common genes, hampering phylogenetic and diagnostic analyses. To deal with this high and complex diversity, profile HMMs are more sensitive than pairwise alignment methods to detect remote homologs, but at the cost of being more prone to false positives. This aspect is particularly relevant if one considers that viruses often share orthologs with prokaryotic and eukaryotic genomes, mainly due to horizontal gene transfer events. Examples of such common orthologs include polymerases, uracil-DNA glycosylases, helicases, serine/threonine protein kinases, guanylyltransferases, methyltransferases, proteases, NTPases, among others. To avoid cross-detection of non-viral sequences, a proper choice of molecular markers is imperative. Viral ORFan genes are open reading frames (ORFs) that do not show similarity to other ORFs in sequence databases.54 The appropriate selection of ORFans in viral genomes could be helpful for the establishment of sequences specific to viruses and even to narrow groups of viruses. For instance, the genus Flavivirus is composed of a wide variety of viruses displaying different host specificities and clinical manifestations on the hosts, such as yellow fever (YFV), dengue (DENV), Zika (ZIKV), West Nile fever, and tick-borne encephalitis. These viruses express a polyprotein that is posttranslationally cleaved into multiple mature polypeptide products. By analyzing an MSA of all available Flavivirus polyprotein sequences, it is possible to identify regions that are conserved across all members of the genus. Some of these regions are contained within ORFan regions and could potentially be converted to profile HMMs and used as Flavivirus-specific probes for both diagnosis and sequence reconstruction from metagenomics data. An additional strategy is the identification of regions whose specificity is restricted to some viruses only, such as ZIKV, DENV, or YFV. In fact, using this approach, our group has recently identified such regions and constructed profile HMMs that were able to specifically detect each one of these viruses in metagenomics data from human patient samples, and reconstruct the corresponding genomes using the program GenSeed-HMM, with almost no false positives (unpublished data).
It is worth mentioning that the approach proposed here, of using short and specific sequences to build profile HMMs, represents a radical change compared to methods employed in databases such as vFam and pVOGs. In these databases, the models were built from MSAs derived from full-length protein sequences. Because the original MSAs included regions that are rich in indels, noise may have been introduced into the models, potentially decreasing their efficacy. By using models derived from short-sequence stretches, as we suggest here, alignment regions containing indels could be avoided or even discarded. Also, the use of full-length protein sequences, as performed in vFam and pVOGs, may have resulted in maximum detection sensitivity, but at the cost of lower taxonomic specificity, as some protein domains may often be conserved across multiple viral taxa. The best compromise between sensitivity and specificity could be obtained by the simultaneous use of multiple, highly specific, short-profile HMMs, which could increase final sensitivity without sacrificing specificity.
Making profile HMMs public
Despite the limitations of the currently available public repositories of virus-derived profile HMMs, such as pVOGs, vFam, and viralOGs, discussed previously, they certainly represent seminal contributions to the virus research community.35,37–39 In addition to these resources, it is fundamental to stress the importance of making new collections of profile HMMs promptly available to the public. Of similar importance, the development of novel strategies for rational design of profile HMMs, as discussed previously, must be accompanied by their open disclosure to all those concerned with viral discovery and detection.
De novo diagnosis and viral discovery
A paradigm of the diagnosis of infectious agents is the fact that conventional serological- and nucleic acid–based assays rely on previously known information on the target of detection. For instance, to establish an enzyme-linked immunosorbent assay (ELISA) test for the detection of host antibodies, we have first to discover and then be able to produce the antigen that will be the target of such detection. The same occurs with PCR-based assays, in which we design primers based on the sequence that will be amplified. Given the broad diversity and high divergence rate of viruses, currently available assays can hardly be useful for the detection of emergent viruses. Although novel viruses may be quite different from already known viruses, some proteins may still contain conserved motifs. Since good profile HMMs are built from MSAs that sample sequence diversity from a variety of viruses, they might potentially detect sequences that have not been sampled, within a reasonable range of divergence. This means that these models could detect a novel virus for the very first time, even if it had never been isolated and characterized. A full molecular characterization of such viruses, using metagenomics data, could be attained by using profile HMMs as seeds for progressive assembly, resulting in the reconstruction of complete or near-complete viral genomes. While such approach does not represent a complete disruption of the aforementioned diagnosis paradigm, it may significantly improve our ability to detect emergent viruses, on the one hand, and accelerate the pace of development of new diagnostic tests, on the other. Since this process implies the diagnosis of novel infectious agents, we propose to define it as “de novo diagnosis”. De novo diagnosis has the potential to become a major strategy for epidemiological surveillance, especially in some sensitive locations such as hospitals, sewage treatment stations, animal production facilities, and migratory bird colonies. A routine collection of environmental samples, followed by metagenomics sequencing and screening with a well-established set of viral profile HMMs, could constitute a framework for such strategy.
Conclusion
In this review, we discussed some of the major aspects involved in the use of profile HMMs for viral discovery, including basic concepts of the statistical model itself, public databases that provide viral sequence-derived profile HMMs, and some DNA assembly programs that use profile HMMs as seeds to build either viral genome sequences of unrestrained (often complete) length, when using the progressive assembly approach, or gene-sized assemblies, when employing other algorithms. We also presented some up-to-date information on aspects of viral genomics that should be considered in the choice of molecular markers for viral discovery and their further use for the construction of profile HMMs for viral discovery. Based on all these aspects, it is clear that some fundamental steps must be considered to better exploit profile HMMs for viral discovery: 1) we need better and more comprehensive viral sequence databases; 2) increasing diversity of taxa sampling, on one hand, and enriching sequence representation of each taxon, on the other, will provide deeper information for the construction of robust models; 3) profile HMM construction should follow rational rules, in order to reliably detect and distinguish taxonomical groups; and 4) novel bioinformatic approaches should be developed to exploit the viral dark matter from metagenomic datasets. Regarding step 3, we recommend the following guidelines: 1) choose molecular markers that are specific to viral groups of interest (and absent in both prokaryotes and eukaryotes); 2) establish standardized protocols to define sets of evolutionarily related sequences to compose the MSAs; 3) avoid under- or overrepresentation of taxa; 4) manually edit the MSA to ensure that each individual position represents the product of evolutionary forces, rather than alignment errors; 5) use objective criteria to define either regions conserved across all sampled taxa or regions specific to subsets of taxa; and 6) validate profile HMM specificity across different viral taxa. We foresee that, with ever increasing amounts of viral sequence data, comprehensive and robust profile HMM data will become available. Together with the development of more powerful bioinformatic tools and databases, we would be able in the near future to submit multiple metagenomic datasets to automated pipelines for viral detection and classification, and genome reconstruction and haplotyping.
Acknowledgments
AG and AMD received Productivity-in-Research fellowships from the National Council for Scientific and Technological Development (CNPq). JMPA was supported by grant #2013/14622-3, São Paulo Research Foundation (FAPESP). AR was supported by FAPA internal funding at Universidad de los Andes. We would like to thank an anonymous reviewer for carefully reading our manuscript and for giving valuable suggestions that guided us to substantially improve the manuscript.
Author contributions
All authors contributed toward data analysis, drafting and revising the paper and agree to be accountable for all aspects of the work.
Disclosure
The authors report no conflicts of interest in this work.
References
Durbin R, Eddy SR, Krogh A, Mitchison G. Biological Sequence Analysis: Probabilistic Models of Proteins and Nucleic Acids. Cambridge: Cambridge University Press; 1998. | ||
Eisen JA. Phylogenomics: improving functional predictions for uncharacterized genes by evolutionary analysis. Genome Res. 1998;8(3):163–167. | ||
Altschul SF, Madden TL, Schaffer AA, Zhang J, Zhang Z, Miller W, Lipman DJ. Gapped BLAST and PSI-BLAST: a new generation of protein database search programs. Nucleic Acids Res. 1997;25(17):3389–3402. | ||
Krogh A, Brown M, Mian IS, Sjolander K, Haussler D. Hidden Markov models in computational biology. Applications to protein modeling. J Mol Biol. 1994;235(5):1501–1531. | ||
Grose JH, Casjens SR. Understanding the enormous diversity of bacteriophages: the tailed phages that infect the bacterial family Enterobacteriaceae. Virology. 2014;468–470:421–443. | ||
Koonin EV. Temporal order of evolution of DNA replication systems inferred by comparison of cellular and viral DNA polymerases. Biol Direct. 2006;1:39. | ||
Caston JR, Carrascosa JL. The basic architecture of viruses. Subcell Biochem. 2013;68:53–75. | ||
Borderia AV, Stapleford KA, Vignuzzi M. RNA virus population diversity: implications for inter-species transmission. Curr Opin Virol. 2011;1(6):643–648. | ||
Simmonds P. Genetic diversity and evolution of hepatitis C virus – 15 years on. J Gen Virol. 2004;85(Pt 11):3173–3188. | ||
Jachiet PA, Colson P, Lopez P, Bapteste E. Extensive gene remodeling in the viral world: new evidence for nongradual evolution in the mobilome network. Genome Biol Evol. 2014;6(9):2195–2205. | ||
Brenner SE, Chothia C, Hubbard TJ. Assessing sequence comparison methods with reliable structurally identified distant evolutionary relationships. Proc Natl Acad Sci U S A. 1998;95(11):6073–6078. | ||
Marz M, Beerenwinkel N, Drosten C, et al. Challenges in RNA virus bioinformatics. Bioinformatics. 2014;30(13):1793–1799. | ||
Fancello L, Raoult D, Desnues C. Computational tools for viral metagenomics and their application in clinical research. Virology. 2012;434(2):162–174. | ||
Park J, Karplus K, Barrett C, Hughey R, Haussler D, Hubbard T, Chothia C. Sequence comparisons using multiple sequences detect three times as many remote homologues as pairwise methods. J Mol Biol. 1998;284(4):1201–1210. | ||
Paez-Espino D, Eloe-Fadrosh EA, Pavlopoulos GA, et al. Uncovering Earth’s virome. Nature. 2016;536(7617):425–430. | ||
Sakowski EG, Munsell EV, Hyatt M, et al. Ribonucleotide reductases reveal novel viral diversity and predict biological and ecological features of unknown marine viruses. Proc Natl Acad Sci U S A. 2014;111(44):15786–15791. | ||
Schmidt HF, Sakowski EG, Williamson SJ, Polson SW, Wommack KE. Shotgun metagenomics indicates novel family A DNA polymerases predominate within marine virioplankton. ISME J. 2014;8(1):103–114. | ||
Rowe JM, Fabre MF, Gobena D, Wilson WH, Wilhelm SW. Application of the major capsid protein as a marker of the phylogenetic diversity of Emiliania huxleyi viruses. FEMS Microbiol Ecol. 2011;76(2):373–380. | ||
Hopkins M, Kailasan S, Cohen A, et al. Diversity of environmental single-stranded DNA phages revealed by PCR amplification of the partial major capsid protein. ISME J. 2014;8(10):2093–2103. | ||
Dwivedi B, Xue B, Lundin D, Edwards RA, Breitbart M. A bioinformatic analysis of ribonucleotide reductase genes in phage genomes and metagenomes. BMC Evol Biol. 2013;13:33. | ||
Hevroni G, Enav H, Rohwer F, Beja O. Diversity of viral photosystem-I psaA genes. ISME J. 2015;9(8):1892–1898. | ||
Goldsmith DB, Parsons RJ, Beyene D, Salamon P, Breitbart M. Deep sequencing of the viral phoH gene reveals temporal variation, depth-specific composition, and persistent dominance of the same viral phoH genes in the Sargasso Sea. PeerJ. 2015;3:e997. | ||
Greninger AL, Naccache SN, Federman S, et al. Rapid metagenomic identification of viral pathogens in clinical samples by real-time nanopore sequencing analysis. Genome Med. 2015;7:99. | ||
Boltz VF, Rausch J, Shao W, et al. Ultrasensitive single-genome sequencing: accurate, targeted, next generation sequencing of HIV-1 RNA. Retrovirology. 2016;13(1):87. | ||
Zou X, Tang G, Zhao X, et al. Simultaneous virus identification and characterization of severe unexplained pneumonia cases using a metagenomics sequencing technique. Sci China Life Sci. 2017;60(3):279–286. | ||
Rodgers MA, Wilkerson E, Vallari A, et al. Sensitive next generation sequencing method reveals deep genetic diversity of HIV-1 in the Democratic Republic of the Congo. J Virol. 2017;91(6):pii:e01841-16. | ||
Trebbien R, Pedersen SS, Vorborg K, Franck KT, Fischer TK. Development of oseltamivir and zanamivir resistance in influenza A(H1N1)pdm09 virus, Denmark, 2014. Euro Surveill. 2017;22(3):30445. | ||
Hernandez D, Yu F, Huang X, Kirov S, Pant S, McPhee F. Impact of pre-existing NS5A-L31 or -Y93H minor variants on response rates in patients infected with HCV genotype-1b treated with daclatasvir/asunaprevir. Adv Ther. 2016;33(7):1169–1179. | ||
Zhao Q, Wen Y, Jiang Y, et al. Next generation sequencing-based investigation of potential patient-to-patient hepatitis C virus transmission during hemodialytic treatment. PLoS One. 2016;11(1):e0147566. | ||
Campo DS, Dimitrova Z, Yamasaki L, et al. Next-generation sequencing reveals large connected networks of intra-host HCV variants. BMC Genomics. 2014;15:(Suppl 5):S4. | ||
Qiu P, Stevens R, Wei B, et al. HCV genotyping from NGS short reads and its application in genotype detection from HCV mixed infected plasma. PLoS One. 2015;10(4):e0122082. | ||
Sharma D, Priyadarshini P, Vrati S. Unraveling the web of viroinformatics: computational tools and databases in virus research. J Virol. 2015;89(3):1489–1501. | ||
Brister JR, Ako-Adjei D, Bao Y, Blinkova O. NCBI viral genomes resource. Nucleic Acids Res. 2015;43(Database issue):D571–D577. | ||
Finn RD, Coggill P, Eberhardt RY, et al. The Pfam protein families database: towards a more sustainable future. Nucleic Acids Res. 2016;44(D1):D279–D285. | ||
Skewes-Cox P, Sharpton TJ, Pollard KS, DeRisi JL. Profile hidden Markov models for the detection of viruses within metagenomic sequence data. PLoS One. 2014;9(8):e105067. | ||
Grazziotin AL, Koonin EV, Kristensen DM. Prokaryotic Virus Orthologous Groups (pVOGs): a resource for comparative genomics and protein family annotation. Nucleic Acids Res. 2017;45(Database issue):D491–D498. | ||
Huerta-Cepas J, Szklarczyk D, Forslund K, et al. eggNOG 4.5: a hierarchical orthology framework with improved functional annotations for eukaryotic, prokaryotic and viral sequences. Nucleic Acids Res. 2016;44(D1):D286–D293. | ||
Kristensen DM, Cai X, Mushegian A. Evolutionarily conserved orthologous families in phages are relatively rare in their prokaryotic hosts. J Bacteriol. 2011;193(8):1806–1814. | ||
Kristensen DM, Waller AS, Yamada T, Bork P, Mushegian AR, Koonin EV. Orthologous gene clusters and taxon signature genes for viruses of prokaryotes. J Bacteriol. 2013;195(5):941–950. | ||
Galperin MY, Makarova KS, Wolf YI, Koonin EV. Expanded microbial genome coverage and improved protein family annotation in the COG database. Nucleic Acids Res. 2015;43(Database issue):D261–269. | ||
Alves JM, de Oliveira AL, Sandberg TO, et al. GenSeed-HMM: a tool for progressive assembly using profile HMMs as seeds and its application in Alpavirinae viral discovery from metagenomic data. Front Microbiol. 2016;7:269. | ||
Sobreira TJ, Gruber A. Sequence-specific reconstruction from fragmentary databases using seed sequences: implementation and validation on SAGE, proteome and generic sequencing data. Bioinformatics. 2008;24(15):1676–1680. | ||
Zhang Y, Sun Y, Cole JR. A scalable and accurate targeted gene assembly tool (SAT-Assembler) for next-generation sequencing data. PLoS Comput Biol. 2014;10(8):e1003737. | ||
Gregor I, Schonhuth A, McHardy AC. Snowball: strain aware gene assembly of metagenomes. Bioinformatics. 2016;32(17):i649–i657. | ||
Li D, Huang Y, Leung HCM, Luo R, Ting HF, Lam TW. MegaGTA: a sensitive and accurate metagenomic gene-targeted assembler using iterative de Bruijn graphs. Lect Notes Comput Sci. 2016;9683:309. | ||
Wang Q, Fish JA, Gilman M, Sun Y, Brown CT, Tiedje JM, Cole JR. Xander: employing a novel method for efficient gene-targeted metagenomic assembly. Microbiome. 2015;3:32. | ||
Eddy SR. Accelerated profile HMM searches. PLoS Comput Biol. 2011;7(10):e1002195. | ||
Zhong C, Edlund A, Yang Y, McLean JS, Yooseph S. Metagenome and metatranscriptome analyses using protein family profiles. PLoS Comput Biol. 2016;12(7):e1004991. | ||
Hunt M, Gall A, Ong SH, et al. IVA: accurate de novo assembly of RNA virus genomes. Bioinformatics. 2015;31(14):2374–2376. | ||
Ruby JG, Bellare P, Derisi JL. PRICE: software for the targeted assembly of components of (Meta) genomic sequence data. G3 (Bethesda). 2013;3(5):865–880. | ||
Smits SL, Bodewes R, Ruiz-Gonzalez A, Baumgärtne W, Koopmans MP, Osterhaus ADME, Schürch AC. Recovering full-length viral genomes from metagenomes. Front Microbiol. 2015;6:1069. | ||
Prosperi MC, Ciccozzi M, Fanti I, et al. A novel methodology for large-scale phylogeny partition. Nat Commun. 2011;2:321. | ||
de Juan D, Pazos F, Valencia A. Emerging methods in protein co-evolution. Nat Rev Genet. 2013;14(4):249–261. | ||
Yin Y, Fischer D. Identification and investigation of ORFans in the viral world. BMC Genomics. 2008;9:24. | ||
Llorens C, Futami R, Covelli L, et al. The Gypsy Database (GyDB) of mobile genetic elements: release 2.0. Nucleic Acids Res. 2011;39(Database issue):D70–D74. | ||
Foley B, Leitner T, Apetrei C, et al, editors. HIV Sequence Compendium 2013. New Mexico: Theoretical Biology and Biophysics Group, Los Alamos National Laboratory; 2013. | ||
Larkin MA, Blackshields G, Brown NP, et al. Clustal W and Clustal X version 2.0. Bioinformatics. 2007;23(21):2947–2948. | ||
Gibson T, Higgins D, Thompson J [homepage on the Internet]. General help for CLUSTAL X (2.0). Available from: http://www.clustal.org/download/clustalx_help.html. Accessed May 22, 2017. |
Supplementary material
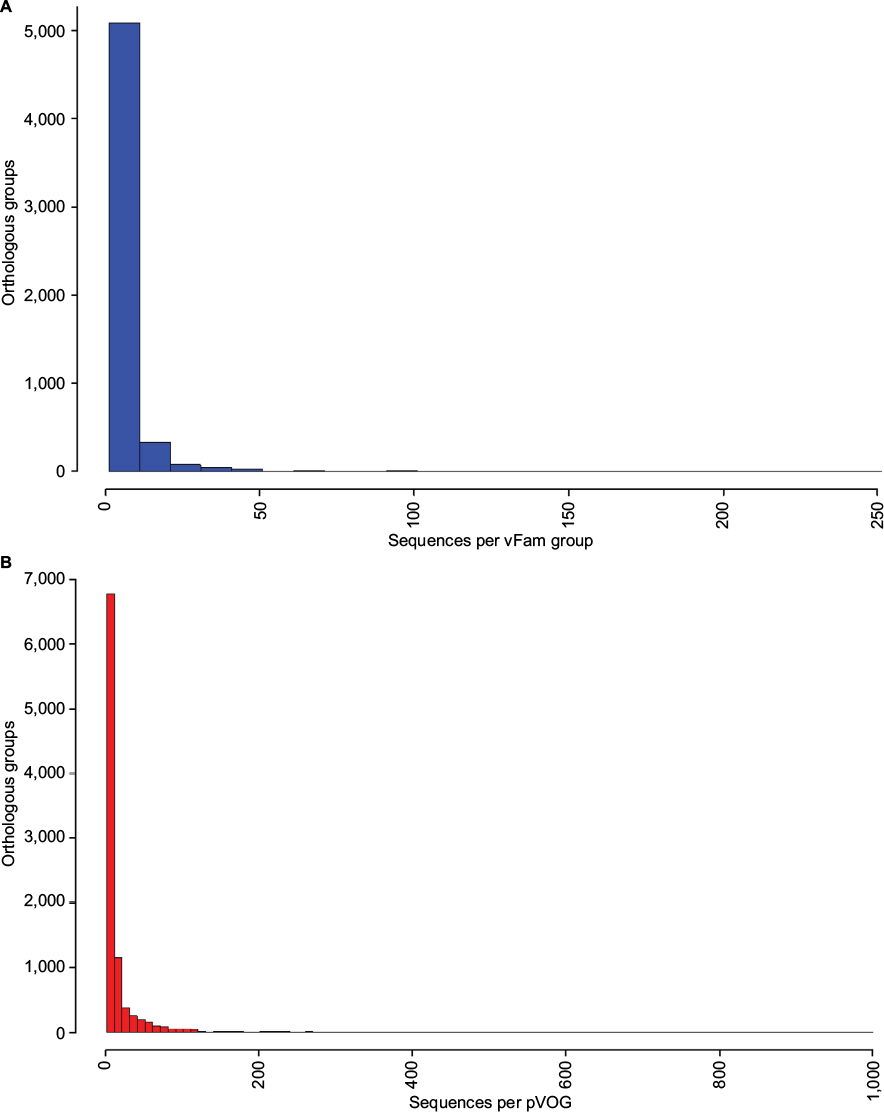 | Figure S1 Distribution of number of proteins per orthologous group for vFam1 (A) and pVOGs2 (B). Notes: Data were obtained from the annotation files provided by the database authors and bins of size 10 were used for building the histograms. For increased readability, pVOGs data are shown only up to 1,000 proteins per orthologous group (just six groups presented numbers larger than that, up to a maximum of 8,131 proteins in the largest group). Abbreviations: pVOGs, Prokaryotic Virus Orthologous Groups; vFAM, viral profile HMM database. |
References
Skewes-Cox P, Sharpton TJ, Pollard KS, DeRisi JL. Profile hidden Markov models for the detection of viruses within metagenomic sequence data. PLoS One. 2014;9(8):e105067. | ||
Grazziotin AL, Koonin EV, Kristensen DM. Prokaryotic Virus Orthologous Groups (pVOGs): a resource for comparative genomics and protein family annotation. Nucleic Acids Res. 2017;45(Database issue):D491–D498. |
 © 2017 The Author(s). This work is published and licensed by Dove Medical Press Limited. The full terms of this license are available at https://www.dovepress.com/terms.php and incorporate the Creative Commons Attribution - Non Commercial (unported, v3.0) License.
By accessing the work you hereby accept the Terms. Non-commercial uses of the work are permitted without any further permission from Dove Medical Press Limited, provided the work is properly attributed. For permission for commercial use of this work, please see paragraphs 4.2 and 5 of our Terms.
© 2017 The Author(s). This work is published and licensed by Dove Medical Press Limited. The full terms of this license are available at https://www.dovepress.com/terms.php and incorporate the Creative Commons Attribution - Non Commercial (unported, v3.0) License.
By accessing the work you hereby accept the Terms. Non-commercial uses of the work are permitted without any further permission from Dove Medical Press Limited, provided the work is properly attributed. For permission for commercial use of this work, please see paragraphs 4.2 and 5 of our Terms.