")
Back to Archived Journals » Current Biomarker Findings » Volume 8
Urine volatile organic compounds composition in mice bearing breast and melanoma tumors: effect of low-protein diet
Authors Gopas J , Abd EL Qader A, Isaacson C, Eichler D, Zeiri Y
Received 20 December 2017
Accepted for publication 2 May 2018
Published 19 July 2018 Volume 2018:8 Pages 1—13
DOI https://doi.org/10.2147/CBF.S160340
Checked for plagiarism Yes
Review by Single anonymous peer review
Peer reviewer comments 2
Editor who approved publication: Dr Hung Khong
Jacob Gopas,1,2 Amir Abd EL Qader,3 Carol Isaacson,4 David Eichler,5 Yehuda Zeiri3,6
1The Shraga Segal Department of Microbiology, Immunology and Genetics, Ben-Gurion University of the Negev, 2The Department of Oncology, Soroka University Medical Center, Beer-Sheva, Israel; 3Biomedical Engineering, Ben-Gurion University, Beer-Sheva, Israel; 4Jerry J. Cohen Radiobiology Research Laboratory, Ben Gurion University, Beer Sheva, Israel; 5Physics Department, Ben-Gurion University, Beer-Sheva, Israel; 6Chemistry Division, Nuclear Research Center Negev, Beer-Sheva, Israel
Background: Volatile organic compounds (VOCs) in urine may provide information about biomarkers of tumors in their early stages and about tumor growth.
Methods: This study demonstrates that the effect of low protein diet on the pattern of VOCs in the urine of healthy and cancer bearing mice is significant.
Results: Pentanal, found in nine out of the ten breast cancer-bearing mice on a high protein (HP) diet, was not found in any of the cancer bearing mice under a low protein (LP) diet, even after tumor development. In addition, the concentration of 3-heptanone, also elevated in the HP group, was not found in the LP group. Benzoic acid, 4-ethoxy-, ethyl ester, 2-pentanone, and propane, 1-isothiocyanato-3-(methylthio), all associated with anti-cancer properties or activity, were observed in the LP group, but not in the HP group. 6-methyl-3-heptanone exhibited a marked increase in concentration as a function of tumor growth when mice were maintained on an HP diet; however, its concentration exhibited no change in mice on the LP diet. The LP group showed much better survival, and even spontaneous recovery from cancer.
Conclusion: Our results give an insight into the effects of an LP diet on the management of breast cancer and melanoma. While other research groups focus on improving the relative rates of efficacy and accuracy of cancer biopsy results, this study attempted to monitor the initial appearance of cancer by VOCs excreted in urine that may be associated with metabolic and other physiological changes associated with tumor development, and with a diet that inhibits such development.
Keywords: mouse urine composition, breast cancer, melanoma, cancer biomarkers, low protein diet
Introduction
Cancer is a major public health problem in the US and many other parts of the world. It is currently the second leading cause of death in the US, and is expected to surpass heart diseases as the leading cause of death in the next few years.1 Two major common malignances are breast cancer and melanoma. Breast cancer is by far the most common malignancy amongst females worldwide, and is also the leading cause of cancer-related mortality.2 In the US alone, around 41,400 patients were estimated to have died from breast cancer during 2017.1 On the other hand, melanoma accounts for less than 2% of all skin cancers, but for the vast majority of deaths from skin cancer. In the US alone, it is estimated that 80,000 individuals were diagnosed with skin melanoma during 2017, and that 9,320 patients died from it.1
Early detection of malignant cancers is the key factor in reducing mortality. Nowadays, malignancy diagnostic techniques include laboratory investigations and radiologic studies, in addition to invasive histopathological examinations.3 Hence, these techniques, some of which are invasive and associated with harmful side effects, are not suitable for routine use in clinics. There is a need for more reliable diagnostic techniques that are less invasive and more efficient.
In a recent study we demonstrated the possibility of diagnosing and investigating the development of melanoma in mice by analyzing the volatile organic compounds (VOCs) in their urine.4 We demonstrated that the VOCs present in the urine of the mice could provide information about possible biomarkers of the tumor in its early stages as well, allowing for some level of monitoring the development of the tumor. In this study, we use VOCs not just as markers of cancer but, in addition, as markers of physiological changes induced by an anti-cancer diet.
Furthermore, many etiologies can explain the possible trigger behind cancer development. Risk factors that have received a great deal of publicity are age, geographical variation, lifestyle and environmental factors, family history, and diet.5–7 Several studies reported that a high protein (HP) diet leads to an increased risk of malignancy.8,9 Human studies have shown that vegetarians are approximately 40% less likely to develop cancer compared to meat-eaters.10–12
Exploring the possibility of exploiting VOCs to develop such an approach, one has to examine hundreds of VOCs that are emitted by the human body, possibly reflecting the metabolic condition of the individual. Pathological processes, such as cancer, are expected to influence the VOC fingerprint of patients by either changing the ratio between different VOCs or by producing new VOCs.13 Monitoring VOCs might, therefore, be useful in diagnosing cancer and tracking its development.
It has been reported that dogs can use olfaction to identify melanoma cell lines14 and melanoma on the skin of patients,15 or melanoma samples hidden on healthy subjects.16 These findings suggest that VOCs from melanoma differ from those of normal skin. D’Amico et al17 used a gas sensor array (also known as an “electronic nose”) to differentiate between melanomas and nevus lesions. These authors compared the lesion with the adjacent skin region as a control. The array discriminated between the different lesions with an accuracy of about 80%. Abaffy et al18 used biopsy tissue samples to compare the VOCs released from melanoma bearing tissue to those released from nevus and normal tissue, using matching skin as a control.
These authors found 32 potential biomarker candidates; the concentration of nine VOCs increased with the presence of melanoma, and 23 VOCs were detected only when melanoma cells existed and were not detected in normal cells. In a recent study, Kwak et al19 compared human melanoma cultured cells to normal cultured melanocytes in vitro using gas chromatography–mass spectrometry (GC-MS). These authors found increased levels of both isoamyl alcohol and isovaleric acid in the headspace over melanoma cell cultures. The authors also found that the melanoma cells produced some unique compounds, such as dimethyldisulfide and dimethyltrisulfide. These findings constitute a novel proof-of-concept for the detection and monitoring of melanoma using mouse urine samples.
In this study we analyze the VOCs emitted from the urine of mice before and after the subcutaneous implantation of breast cancer cells. The mice were divided into three groups, a group with a normal HP diet (18%), a group with a low protein (LP) diet (5%), and a group of survivors, i.e., cancer-recovered mice from previous similar experiments. The influence of high and LP diet was also examined for melanoma-bearing mice. In this part, only the LP diet was examined, and the results are compared to an identical study4 carried out in our laboratory, but performed using the HP diet.
GC-MS was used for detection of VOCs, excreted from urine, in order to be able to distinguish between control and cancer-bearing mice and give insight into the possible mechanisms involved in the pathophysiology of the diseases.
The objectives of this study were to 1) explore the effect of diet on the VOCs emitted from mouse urine before and after subcutaneous implantation of breast cancer cells, and to 2) examine the influence of high and LP diets in the mice with melanoma implants.
Materials and methods
Mice and cell lines
For the breast cancer experiments, female BALB/c 12 week old mice were used. For melanoma cell experiments, female C57BL/6J, 12 week old mice weighing 18–20 g, were used. All animals were obtained from Harlan Laboratories (Jerusalem, Israel), and maintained at the animal resource center of Ben-Gurion University of the Negev in a controlled environment, free of specific pathogens. All animal experiments and use of cell lines described in this work followed the law of animal welfare, 1994 (The National Agency of Ethics in Animal Experimentation, Israel Ministry of Health, Israel). The experimental protocol, including the use of mice and cell lines, was approved by the ethical, institutional review board Ben-Gurion University Committee for the Ethical Care and Use of Animals in Experiments; Number IL-37-06-2015 (entitled: “Biomarkers for detection and monitoring melanoma in C57BL/6J and breast cancer cells in BALB/c mice urine and feces-effect of LP diet”). The melanoma cells used were: B16-F10 (ATCC® CRL-6475™) and the breast cancer cells: the KHJJ cells also known as EMT6 EMT6 (ATCC® CRL-2755™).
Nutrition and grouping
To carry out the experiment with breast cancer-bearing mice, three groups were used. The first group contained ten mice with an HP diet, the second group consisted of eight mice with an LP diet, and the third group consisted of four survivor group (SG) mice that had consumed an LP diet in the previous experiment, which they survived, but, in the present study, consumed an HP diet instead. The HP diet mice were fed with Harlan Teklad Global laboratory blocks, 2018SC formula (containing 18% protein). The LP mice were fed with grains, (brown rice 60%, yellow millet 40%), sesame seed, and vegetables. Altogether the diet was 5% protein.
In the melanoma-bearing mice experiment, a group of 11 mice were used, all receiving an LP diet as described above. This experiment is identical to that reported previously,4 in which the mice were supplied with the HP diet.
All groups were fed with their predetermined adjusted nutrition for 2 weeks prior to the cancer cells injection (melanoma) or implant (breast cancer). All animals drank Beer Sheva municipal water from a polycarbonate bottle with a metal sipper tip. Bottles and sipper tips were cleaned and then autoclaved.
Breast cancer tumor implantation
For anesthesia we used 10% Ketamine (1 mg/10 mL), 5% xylazine (23.32 mg/mL), made up to 100% with normal saline for injection, with a total dose of 0.01 mLper gram body weight. The KHJJ tumor was grown on the right calf as it was in the experimental mice. Tumors were removed from a euthanized donor mouse and sectioned into approximately 1 mm3 pieces in sterile PBS. Recipient mice were anesthetized, the right calf shaved and sterilized alternately with 70% ethanol solution and Septal Scrub (chlorhexidine gluconate 4%W/V). A small cut was made in the skin and a piece of tumor inserted subcutaneously using a 16G trocar. Neosporin ointment containing per gram, bacitracin zinc 500 units, neomycin sulfate 3.5 mg, and polymyxin sulfate 10,000 units of antibiotic, was applied to the incision.
Tumor volume assessment
Tumor volume was obtained by external caliper; the greatest longitudinal diameter (length) and the greatest transverse diameter (width) were determined. Tumor volume based on caliper measurements was calculated by the formula: Tumor volume=1/2 (length×width2).
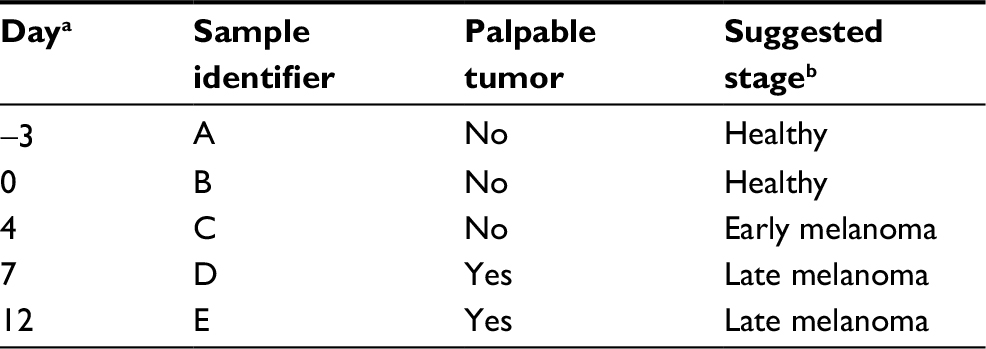
The sample classification used in the present study is summarized in Table 1. One week after cancer cell implantation we started to measure tumor volume. It was measured every 3–5 days afterwards. Figure 1 shows the change in mean tumor volume in each one of the three groups. The stage of cancer was determined based on the tumor volume measured. Tumor volume below 100 mm3 was considered here as early stage cancer, and above 100 mm3 was considered as late stage cancer.
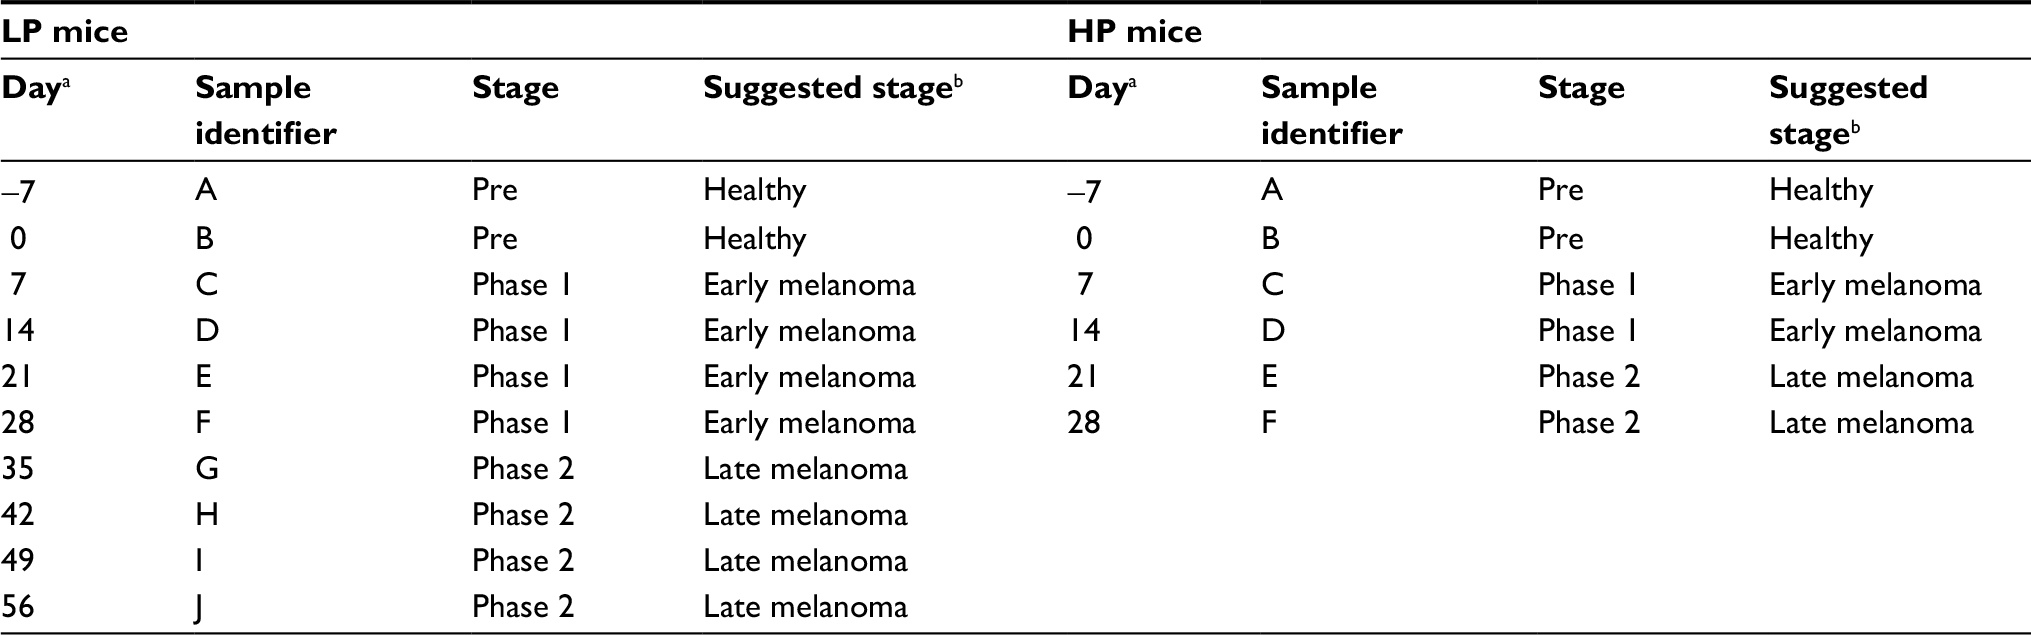 | Table 1 Sample classification Notes: aRelative to the implantation of breast cancer cells, which was performed immediately after obtaining Sample B. bBased on the signature of the VOCs and on tumor volume presented in Figure 1. Abbreviations: LP, low protein; HP, high protein; VOC, volatile organic compound. |
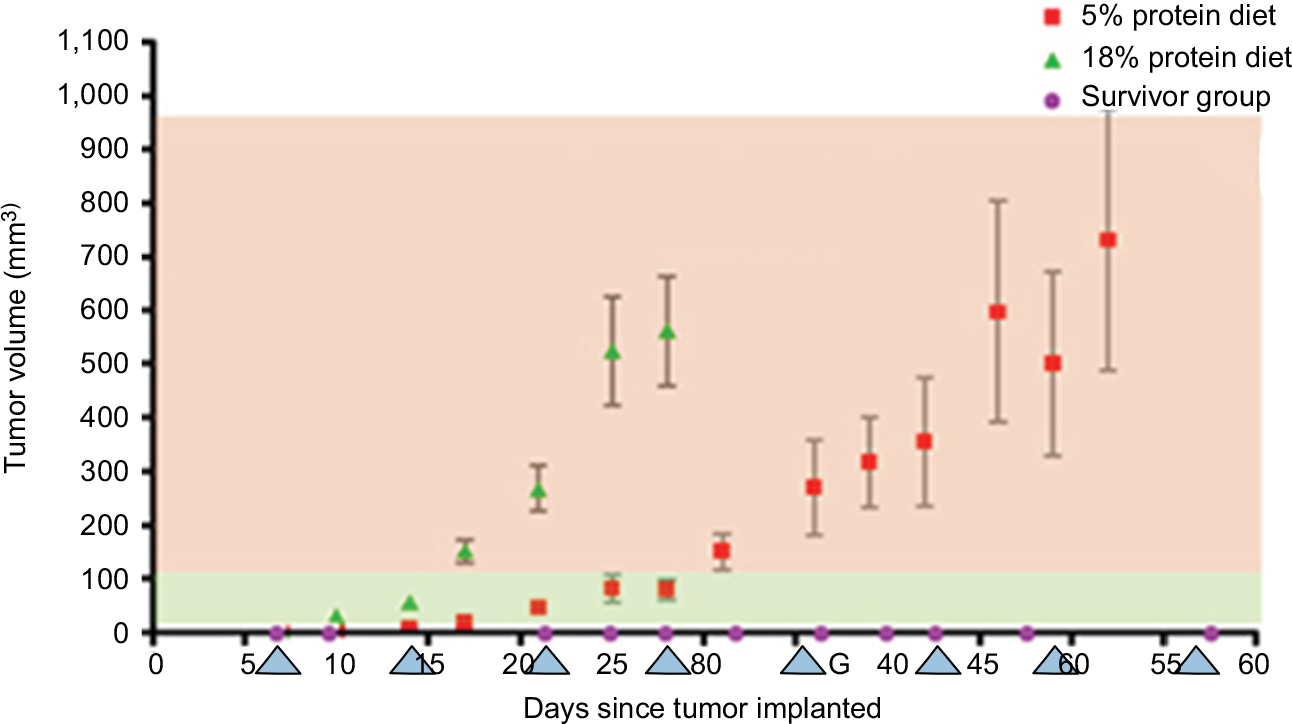 | Figure 1 Tumor volume post-implantation of breast cancer cells. Red squares represent the LP mice mean volume of tumor; green triangles and purple circles represent the HP and SG mice, mean tumor volume change, respectively. Blue triangles show the days of urine collection. Phase 1, green background, presents early melanoma, tumor volume <100 mm; phase 2, red background, late melanoma, tumor volume >100 mm. Abbreviations: LP, low protein; HP, high protein; SG, survivor group. |
Melanoma cells injection
Mouse B16-F10 melanoma cells were grown in Dulbecco’s Modified Eagle’s Medium (DMEM)+10% fetal calf serum and were harvested by 0.23% trypsin, washed once in medium and twice in PBS. One hundred microliters, containing a total of 2×10⁵ B16F10 cells in PBS, were injected subcutaneously to the left flank of each of 11 C57BL/6J mice.
Urine collection
Urine samples from the mice were collected once weekly from breast cancer-bearing mice and twice weekly from melanoma-bearing mice. Urine samples were collected twice before (healthy) subcutaneous implantation/injection of cancer cells and a maximum of eight times after the implantation of the breast cancer tumor and four times after the injection of melanoma cells. Of the group of ten on LP diet, two mice died, and in the group of five survivors one mouse was euthanized.
Urine sample collection was performed as follows; a fresh disposable plastic table cover was used for each sampling day. The mice were placed in individual cages on the covered table. Urine samples were collected into vials with a pipette directly from the plastic table cover. At the end of the sample collection, the cages were cleaned with isopropanol.
The urine samples were frozen at -20°C until analyzed for VOCs. These samples were used for headspace VOC measurements. To concentrate the VOCs, solid phase microextraction (headspace-SPME) was used. The VOCs composition was analyzed by GC-MS (see below). In each sample collection session were background samples that included: laboratory air sample, samples from mouse food, water, table cover, and bedding. These background samples were also analyzed by GC-MS, and the compounds found (assumed to be contaminants) were eliminated from those found in the urine analysis.
Chemical analysis
Chemical analysis was performed using an Agilent 6890 GC with Agilent 5973 selective mass detector, GC-MS. To enhance sample concentration, the solid-phase microextraction (SPME) method20 was used to collect headspace samples from the vials.
GC-MS procedure
The samples, in vials with a septum in their cover, were allowed to melt at room temperature. Once melted, the vial was heated to 50°C to increase the partial pressure of volatile gases, then the SPME fiber was exposed to the headspace for 10 min to adsorb the gases. It was verified that 10 min was enough to reach steady state. Sample analysis was carried out by introducing the SPME fiber into the GC-MS injector (25°C). This solvent-free extraction procedure involves immersing a polymer-coated fused silica fiber into the sample vial for 10 min during which the fiber adsorbs the VOCs and, hence, concentrates the analytes in the headspace sample. The injector was fitted with an SPME 0.75 mm ID quartz liner. A 65-μm polydimethylsiloxane/divinylbenzene (PDMS/DVB) SPME fiber (SUPELCO, Bellefonte, PA, USA) was used. The column used was a Zebron ZB-5MSi fused-silica capillary column, 30 m×0.25 mm ID×0.25 μm film thickness (Phenomenex, Torrance, CA, USA). The carrier gas was 99.9995% pure helium (Maxima, Ashdod, Israel), flowing with a constant head pressure of 7.65 psi, and an average velocity of 36 cm/s, and passing through an R&D Separations moisture trap MT-200-2S and an Agilent Hydrocarbon/Moisture trap, model HMT200-2 (Agilent, China). Column temperature was programmed to begin at 50°C (3 min hold), rising gradually at a rate of 12°C/min to 240°C (5 min hold), then increased finally to 260°C with a heating rate of 50°C/min (1 min hold).
For GC-MS, following electron ionization, ions were scanned as the total ion current (range=10–500 m/z at 2.97 scans×s−1). At both the beginning and end of each GC-MS analysis run the headspace over a calibration mixture (containing equal amounts of chloroform, toluene, and dodecantiol) was sampled to ensure that the system operation had not changed. This procedure was based on thorough optimization of the analytical process to yield the largest possible amount of information related to VOCs. This optimization was carried out in our laboratory for a wide range of possible VOCs that are contained in samples collected in different biomedical related projects.
Data analysis
The GC-MS chromatograms were analyzed using ChemStation Enhanced Data Analysis software. Before the statistical analysis, the data were pre-processed using a home-written Matlab code for matching baselines and aligning identical peaks in different chromatograms. Chromatogram integration parameters were determined according to Clinical and Laboratory Standards Institute (CLSI) guideline EP17. Limit of blank (LoB) was defined as the highest apparent analyte concentration (i.e., largest area under peak) expected to be found when replicates of a sample containing no analyte are examined. This quantity was estimated by measurement of 20 replicates of blank samples (SPME-GC-MS) and calculation of the mean result and the standard deviation; LoB=mean blank+1.645 SD of the blank.21 Limit of Detection (LoD) was defined as the lowest analyte concentration (area under peak) likely to be reliably distinguished from the LoB and at which detection is feasible. It was estimated as the mean of the blank+3 SD, while the Limit of Quantification (LoQ) was determined as the mean of the blank+10 SD.20,22
Compounds were assigned a chemical identification by means of spectral library matching, using the NIST’08 and Wiley libraries (Version 7). The assignment of chemical identity by the ChemStation software is accompanied by a quality factor (QF). The QF is also sometimes termed matching factor. A library-search procedure that identifies structural features of an unknown compound was carried out. This procedure first retrieves library compounds whose mass spectra are most similar to the spectrum of the unknown compound. The significance and reliability of each retrieved mass spectrum is weighted according to its similarity to the spectrum of the unknown compound. There are different procedures to estimate the reliability of the chemical identification of a GC peak.23,24 The exact algorithm used to obtain the QF in the ChemStation Software is not described in the documentation; however, the manual states that QF larger than 80% is considered reliable. We accepted assignments as reliable only if their QF was greater than 80%. Below this value of QF the peaks were designated by their retention time only.
Statistical analysis
To identify VOC markers associated with diet effect and cancer, a home-written Matlab code was used to eliminate peaks that were identified in the chromatograms of the room air samples, mouse food and water, table cover, and bedding. After running the urine samples in the GC-MS, the chromatogram with the largest number of peaks was used as a reference to align the rest of the chromatograms accordingly. The code was designed to grid time axis of the urine samples chromatograms into 1.3 s windows, and align the peak in the window with a corresponding peak in the reference chromatogram within the same time window. The data obtained after this alignment was then used as input to a partial least square discriminate analysis (PLS-DA) using the Simca P++ software. The PLS-DA code was used to obtain a lower-dimensional representation of the multi-dimensional data, and to enhance clusters separation. This approach allowed reduction of the number of variables that form the basis of the data, while maximizing the variance between the data points. The model included three latent variables that were calculated by the software and are, in fact, weighted linear combinations of the potential biomarkers that most contributed to the separation between groups. Significance tests were performed using the Student’s t-test and one-way analysis of variance (ANOVA) using Prism GraphPad software (version 5). Compounds suggested by the models as potential biomarkers to identify breast cancer (in mice), and for explaining the different boosts in breast cancer growth observed in the different mice diet groups, were evaluated statistically using the Prism software to perform t-test (significance test) of the identified potential biomarkers. To carry out the analysis the VOCs mean % area under peak in urine samples before cancer implantation (H-healthy stage) was compared to VOC mean % area under peak in the urine samples after cancer implantation (E-early and L-late stages). The P<0.05 value was considered statistically significant. It should be noted that only peaks that showed an at least two-fold increase in peak area between pre- and post-cancer implantation were considered as potential biomarkers. A decrease in peak area was not considered since in all cases the amount of decrease observed was of the order of the variation of peak area among the mice in the group.
Results
Breast cancer-bearing mice
Tumor volume assessment
The HP group showed a much faster increase in tumor volume compared to the LP group; see Figure 1. Six mice of the LP group and all the SG group mice survived for 8 weeks following cancer cell implantation, while mice in the HP group lived at most 4 weeks post-cancer cell implantation. In the HP group, tumor volume grew to an average volume of 580±100 mm3 after 4 weeks, while, in the LP group, in the same amount of time, the estimated mean tumor volume was only 110±8 mm3, about five-fold smaller. Interestingly, in the SG, no measureable tumor had evolved post-implantation. In this group, all four mice had a palpable tumor within a few days post-implantation. In two mice the tumor did not grow to measureable size. In the other two mice the tumor grew, and then shrank and disappeared.
VOCs detected in the urine samples before cancer cells implantation
The two samples collected from each mouse before cancer cells implantation serve, in the present study, as normal physiology indicators, and control measurements. These control measurements for each mouse can be compared to the analysis of its post-implantation samples, in order to identify the physiological changes seen in urine composition due to the tumor appearance and growth.
To investigate the effect of diet on VOC composition in the urine samples of mice having LP and HP diets, we first explored the VOCs detected in mice urine before cancer implantation, but after being fed their respective diets for 2 weeks. We analyzed the two urine samples (A and B) collected, before cancer cells were implanted, from the different groups. A PLS-DA model of the different mice diet groups—urine samples prior to the implantation of cancer, was built (Figure 2). The model suggested five VOCs (Table 2) in urine samples that could serve as potential compounds which can be attributed to distinguishing characteristics between the 5% (LP) and 18% (HP and SG) protein diet mice.
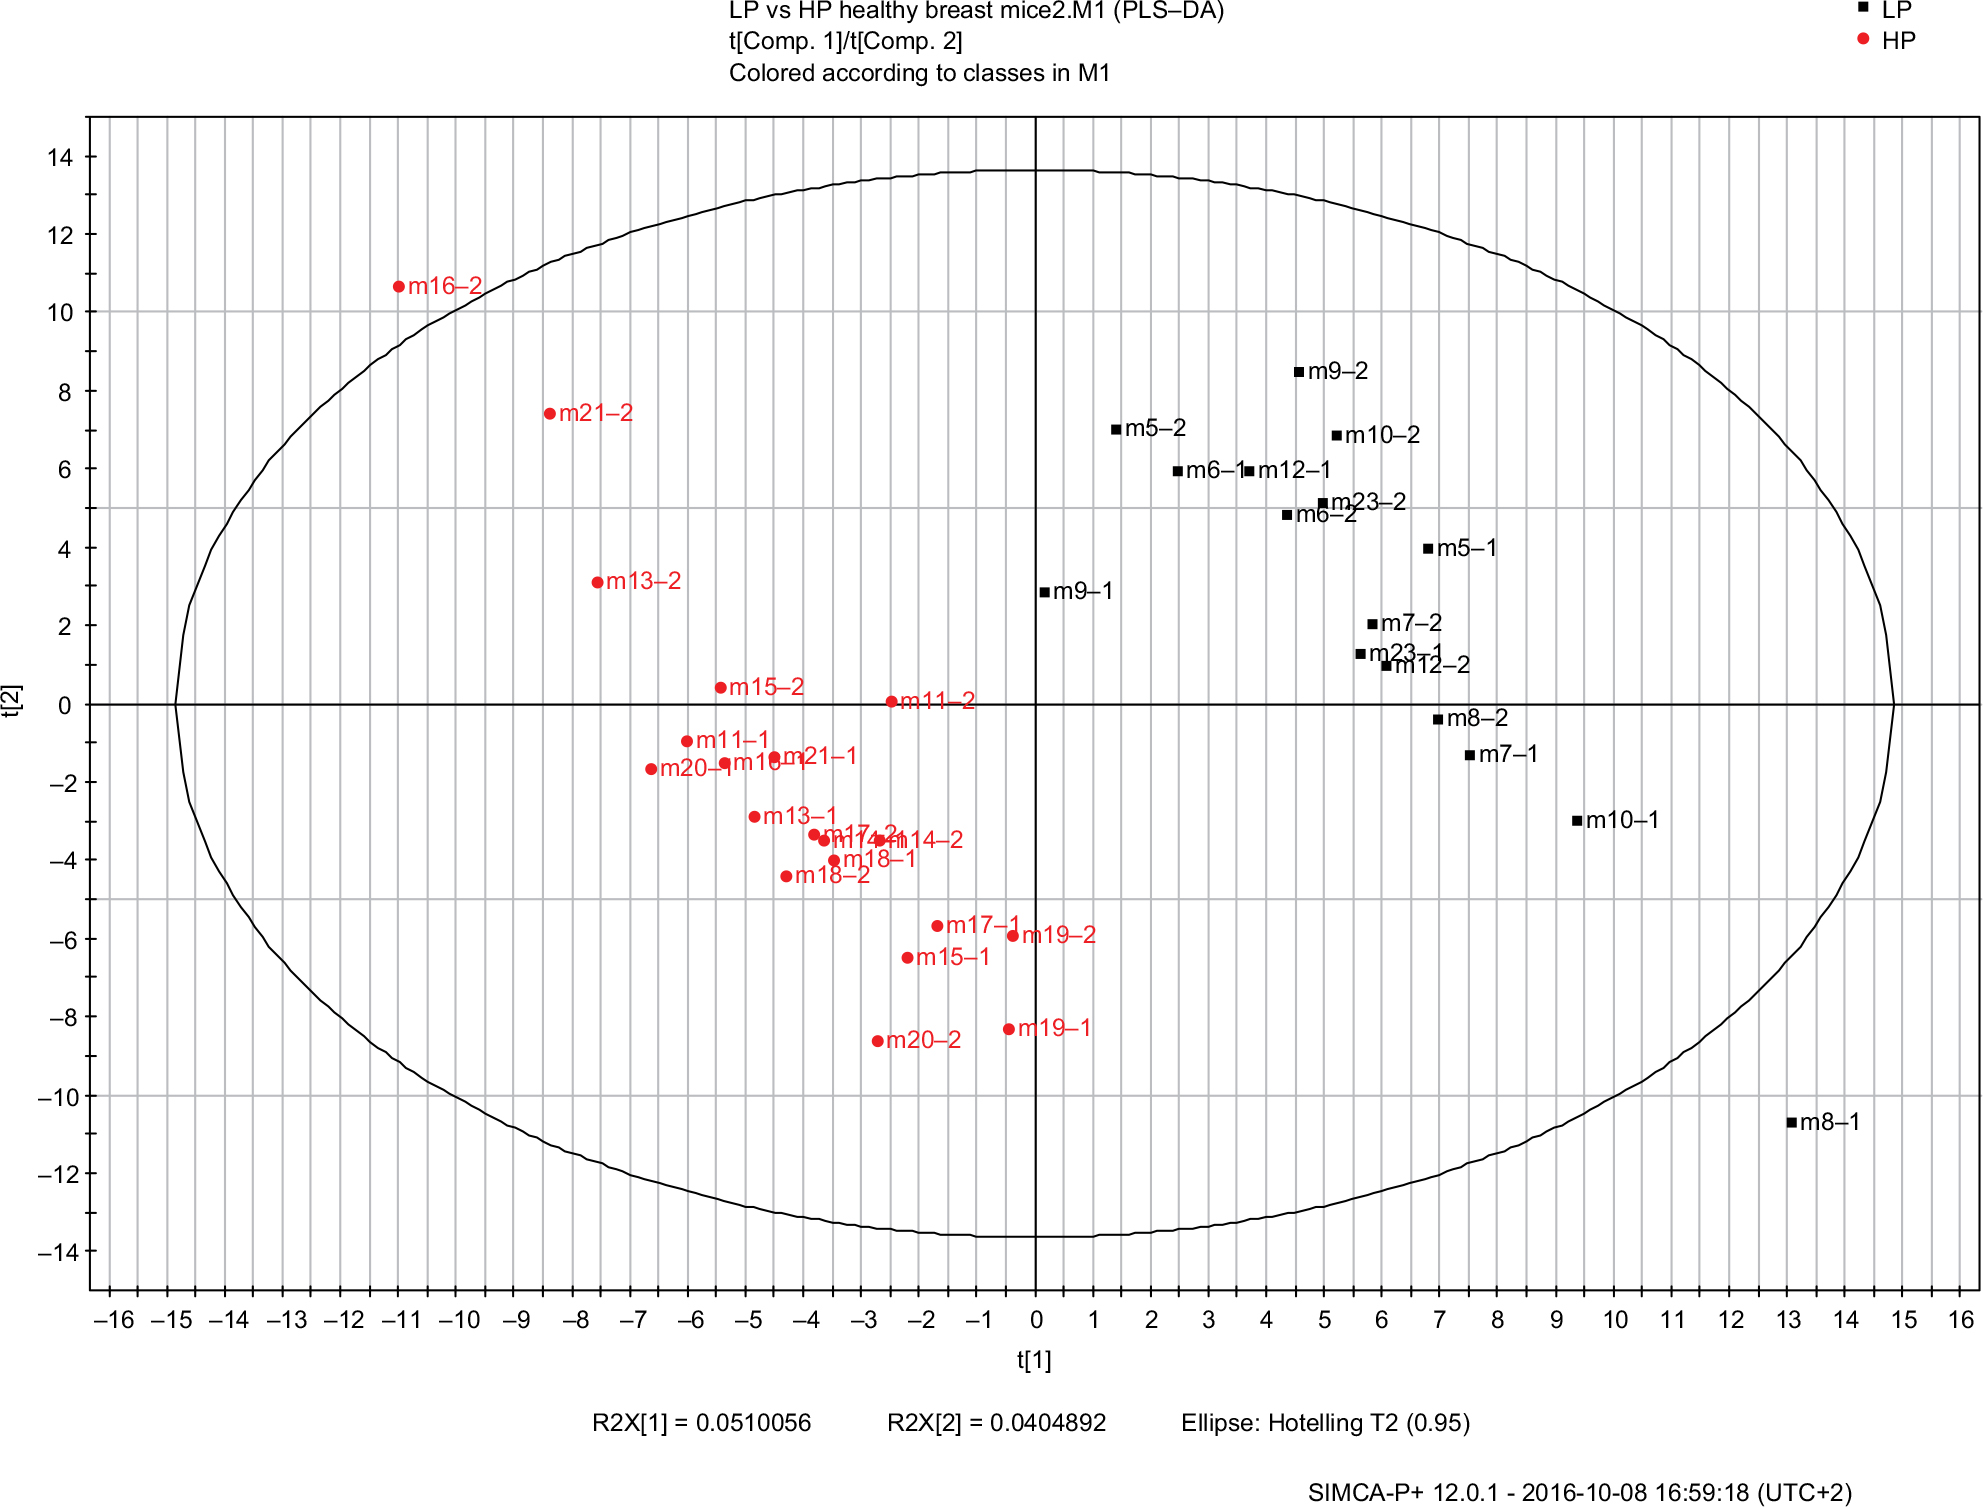 | Figure 2 Score plot for the urine PLS-DA classification model with three latent variables. Each mouse with two samples pre-implantation. Black squares represent the SG mice samples and HP mice samples, red circles, LP mice. A good discrimination can be observed between the HP diet and SG mice and the LP diet mice. Symbols represent mouse numbers in the group and the numbers after (–) represent the mouse’s first or second sample. Abbreviations: PLS-DA, partial least square discriminate analysis; SG, survivor group; HP, high protein; LP, low protein. |
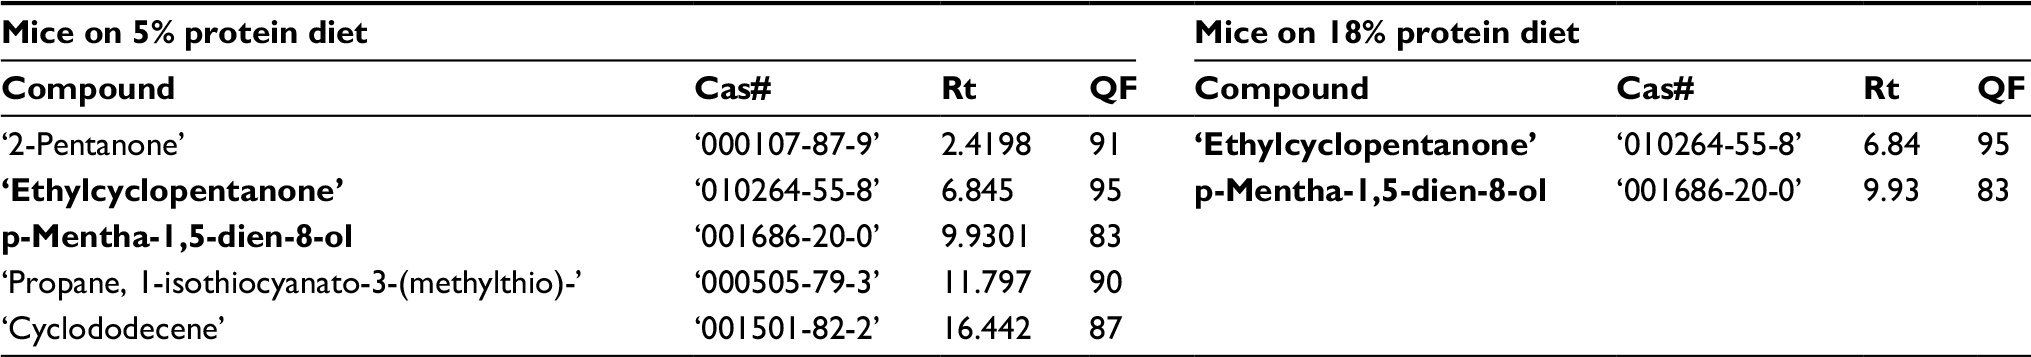 | Table 2 VOCs found in the urine samples of all mice belonging to the LP and HP diet groups collected pre-implantation of breast cancer cells Note: Compounds in bold are VOCs observed in both groups. Abbreviations: VOC, volatile organic compound; LP, low protein; HP, high protein; QF, quality factor; Rt, retention time; Cas#, chemical abstracts service number. |
VOCs detected in urine associated with tumor growth
To investigate the effect of diet on development of cancer, i.e., on tumor growth in early and late stages, we measured the size of the tumor two-to-five times per week. To investigate the combined physiological effects of cancer and diet, we performed a comparative analysis of the VOCs emitted from healthy vs breast cancer-bearing mice in each diet group. PLS-DA models of urine VOCs composition were built with the SIMCA P+ software for both the LP and HP groups (Figures 3 and 4), respectively. Each model included three latent variables (suitable for 3D plotting). They were calculated by the software and are, in fact, weighted linear combinations of candidate VOCs that might be used as biomarkers of malignancy, the exact weights being calculated to maximize the distinction (i.e., the difference in the respective values of the latent variables) between healthy and cancerous mice.
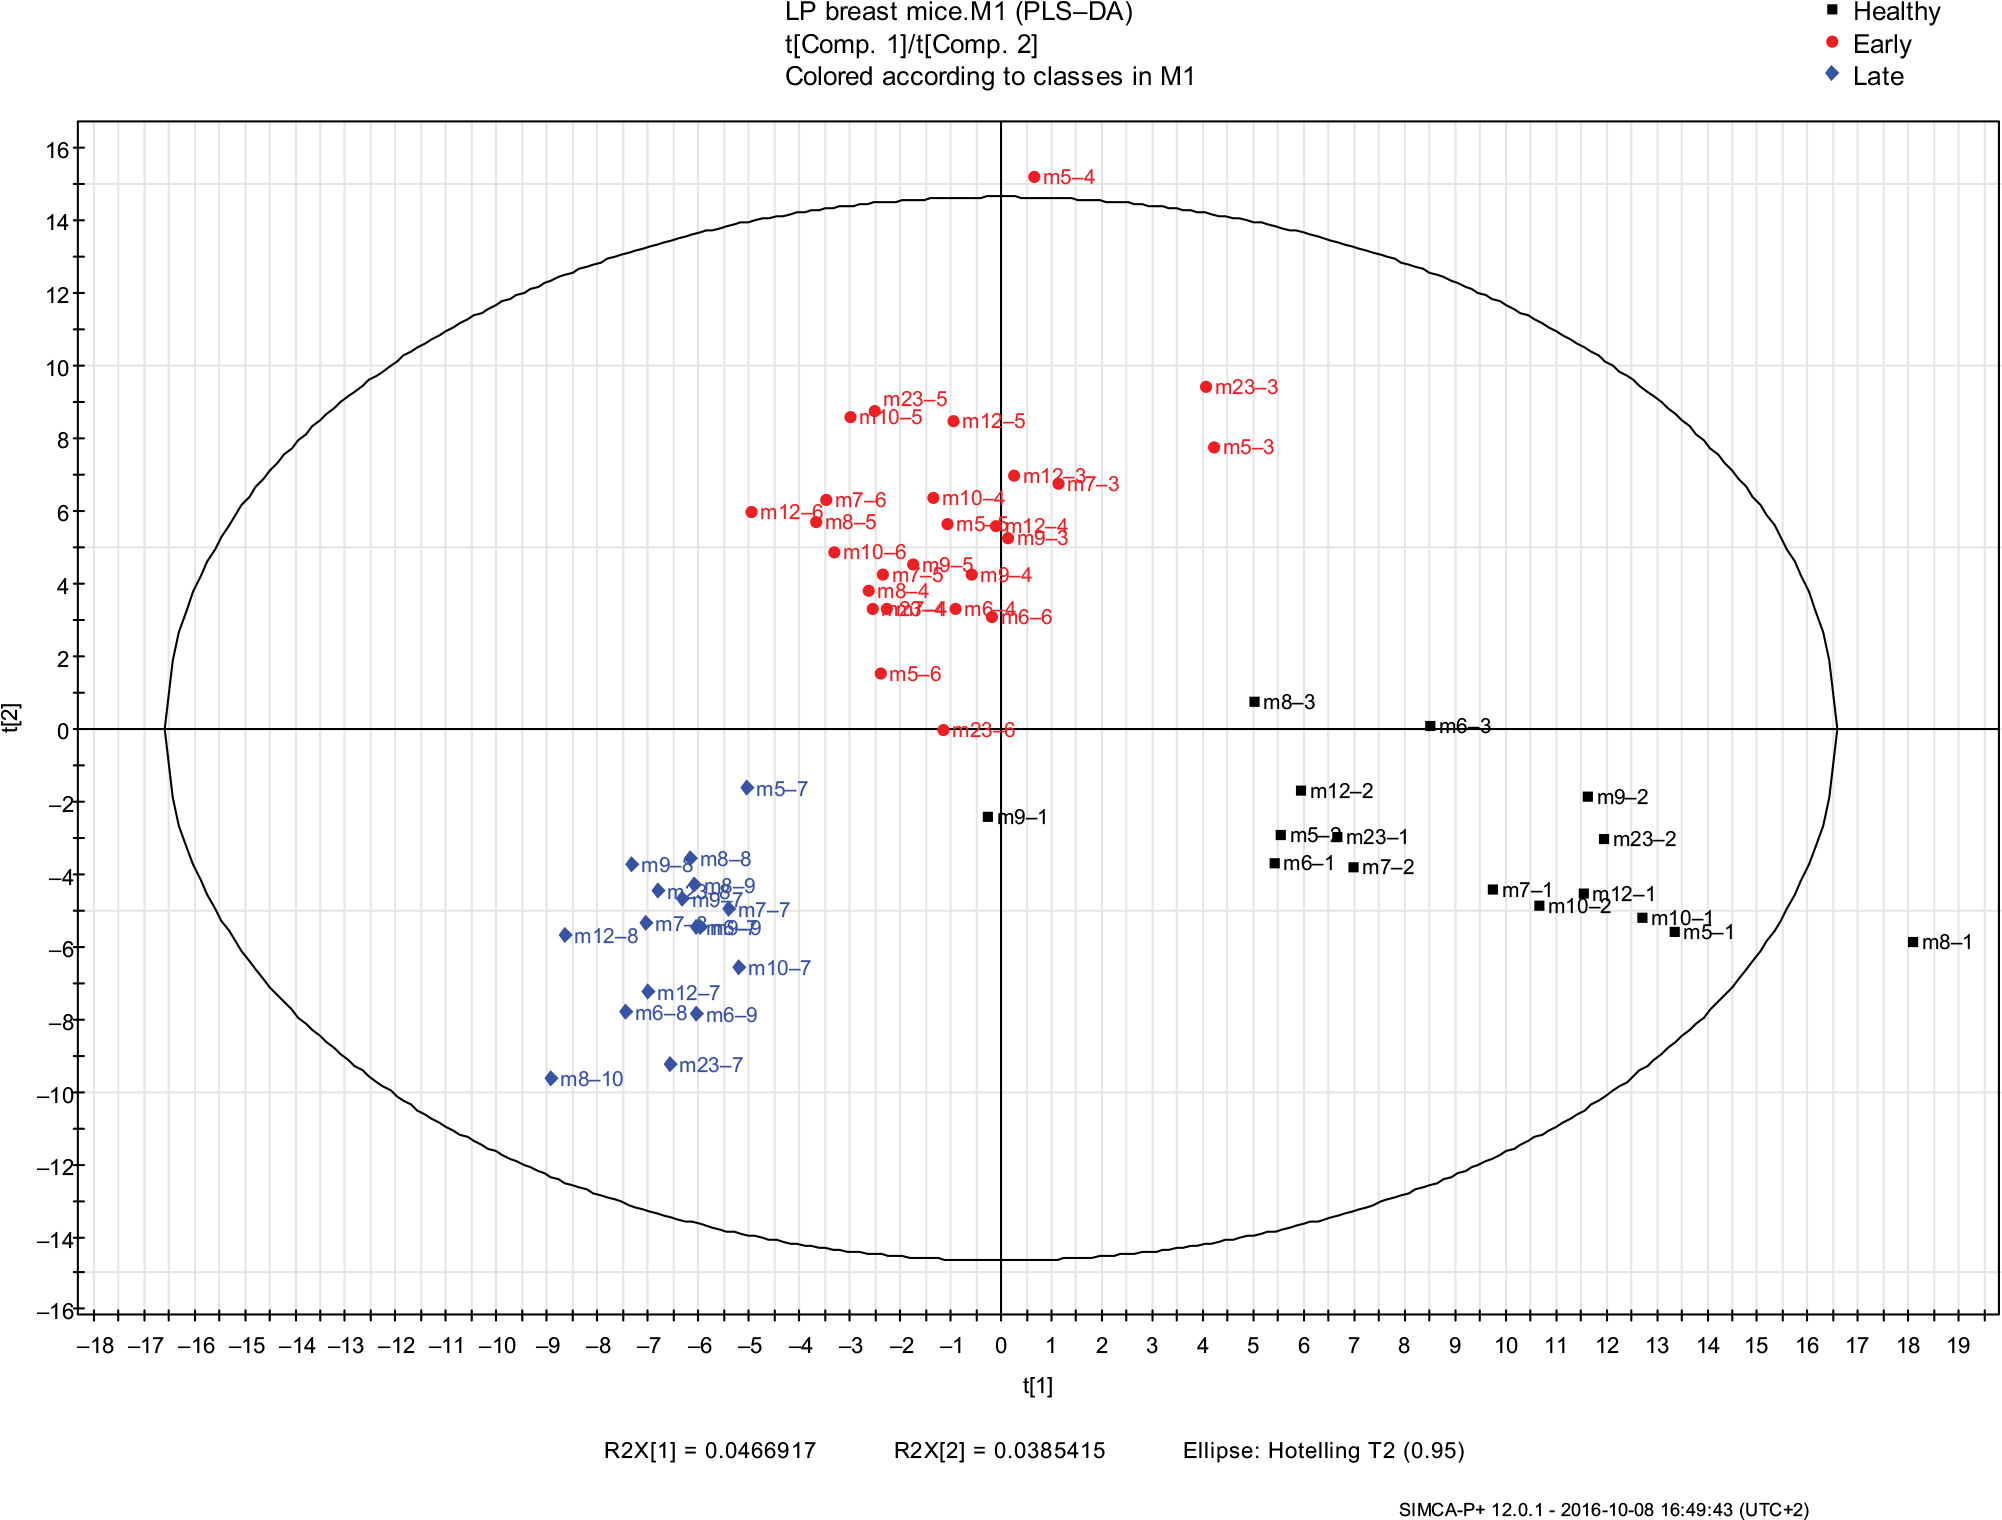 | Figure 3 PLS-DA models of urine VOCs composition were built with the SIMCA P+ software for the LP mice group samples in the different cancer phases (healthy, early, and late malignancy). The model includes three latent variables that were calculated by the software. Black squares represent the healthy samples (samples collected before cancer implantation), red circles represent samples collected in the early phase of malignancy, blue diamonds represent the samples collected in the late phase of malignancy. Symbols represent mouse numbers in the group and the numbers after (–) represent the mouse’s sample number. Abbreviations: PLS-DA, partial least square discriminate analysis; VOC, volatile organic compound; LP, low protein. |
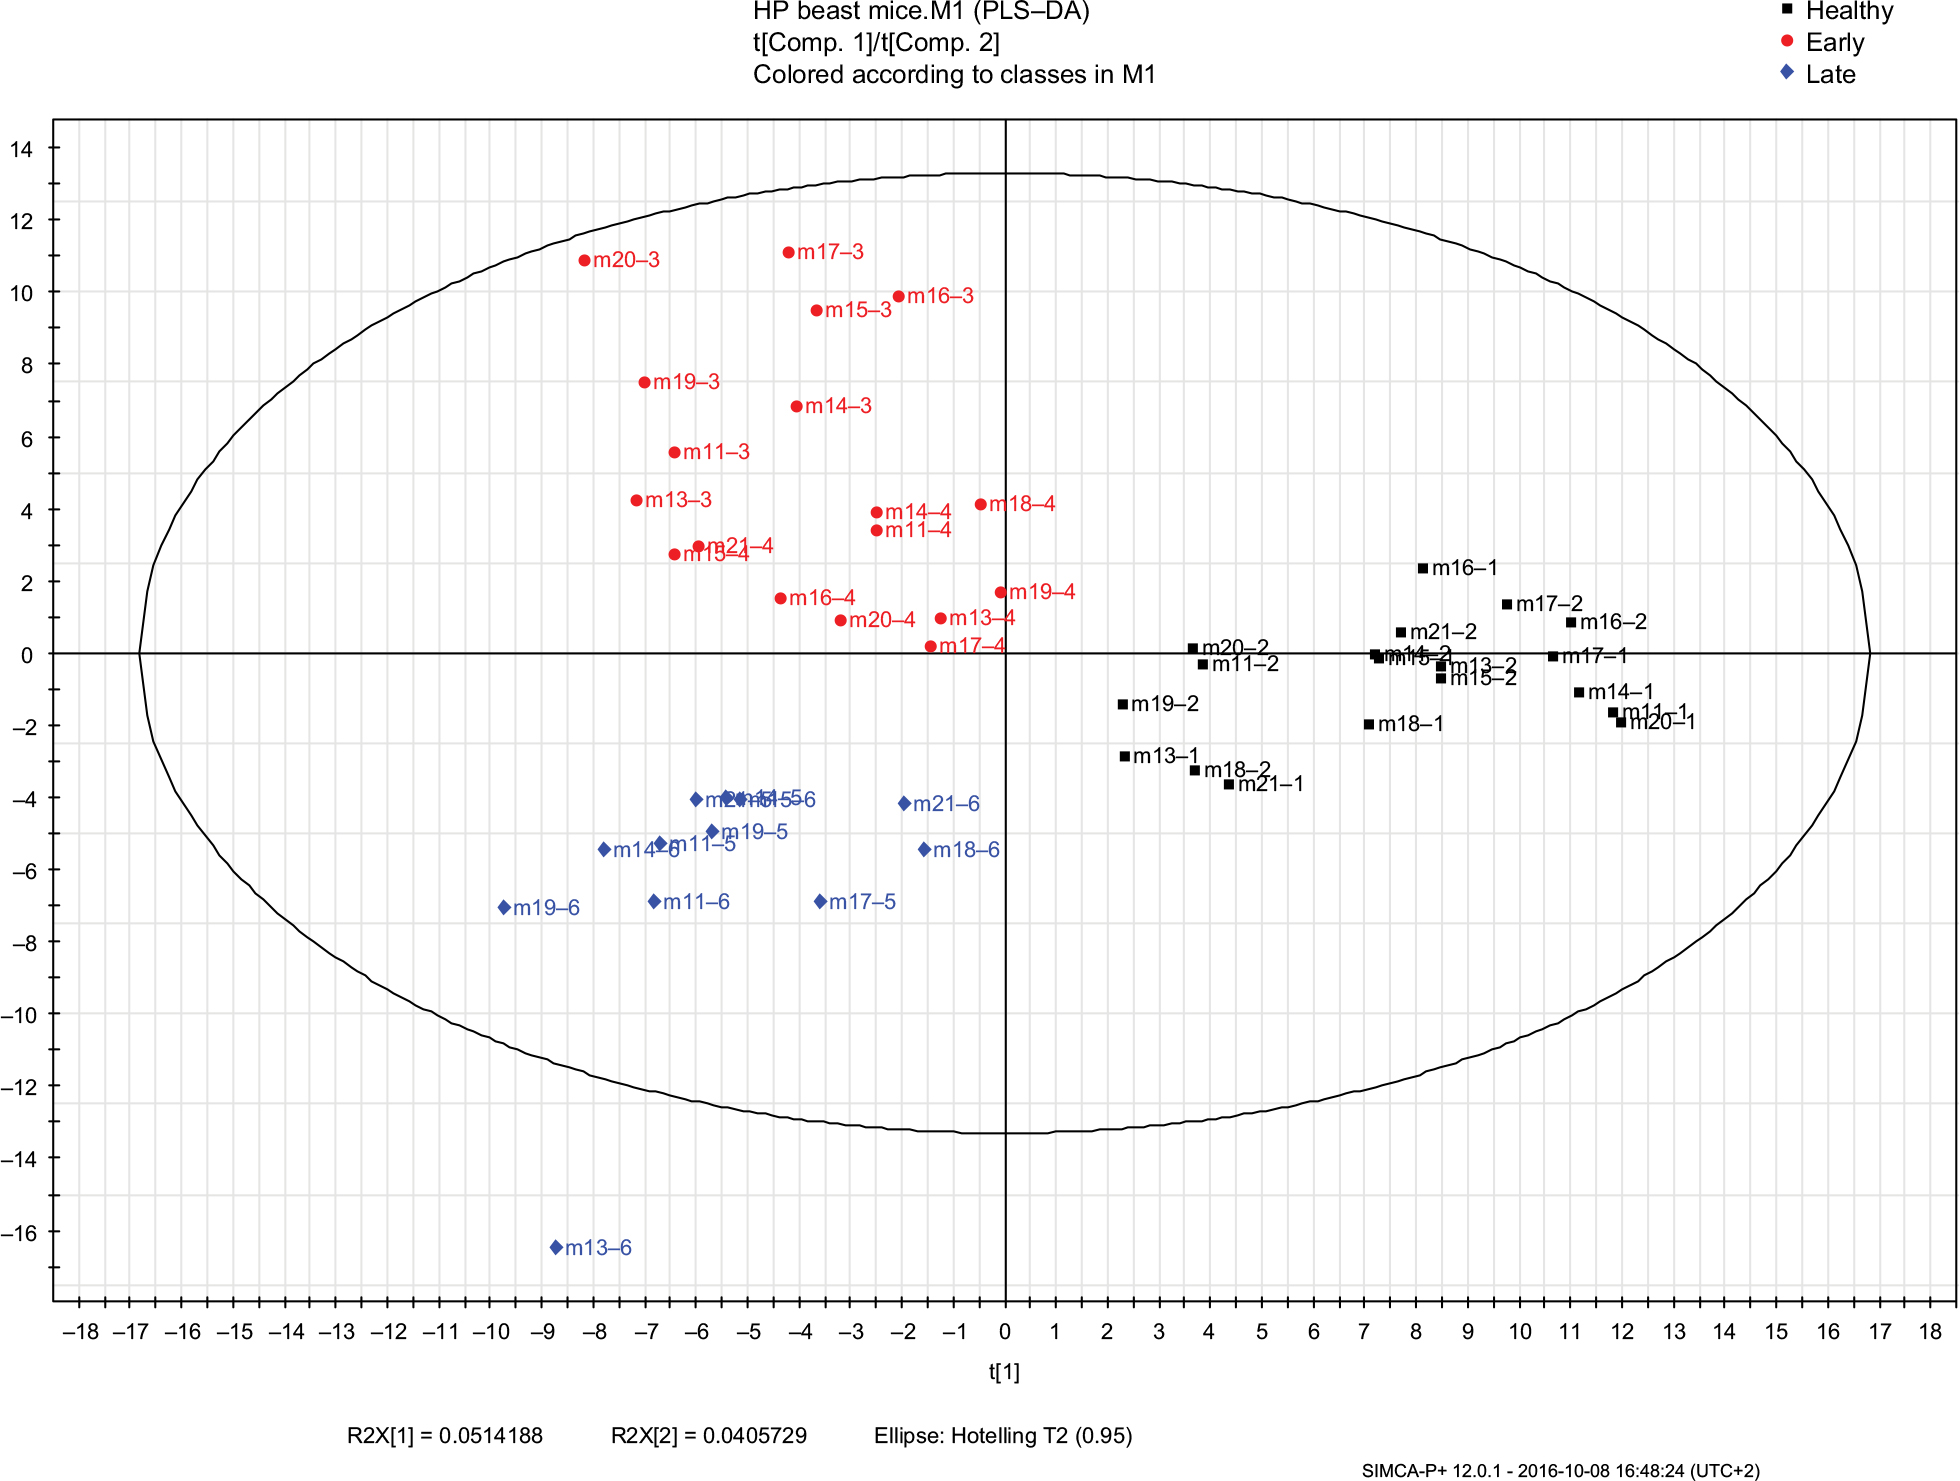 | Figure 4 PLS-DA models of urine VOCs composition were built with the SIMCA P+ software for the HP mice group samples in the different cancer phases (healthy, early, and late malignancy). The model includes three latent variables that were calculated by the software. Black squares represent the healthy samples (samples collected before cancer implantation), red circles represent samples collected in the early phase of malignancy, blue diamonds represent the samples collected in the late phase of malignancy. Symbols represent mouse numbers in the group and the numbers after (–) represent the mouse’s sample number. Abbreviations: PLS-DA, partial least square discriminate analysis; VOC, volatile organic compound; HP, high protein. |
Potential biomarkers, namely compounds that were not present before cancer cell implantations and were found only once the tumor started to grow, are listed in Table 3 for LP mice and in Table 4 for HP mice. These are given the highest weights for determining the values of the latent variables.
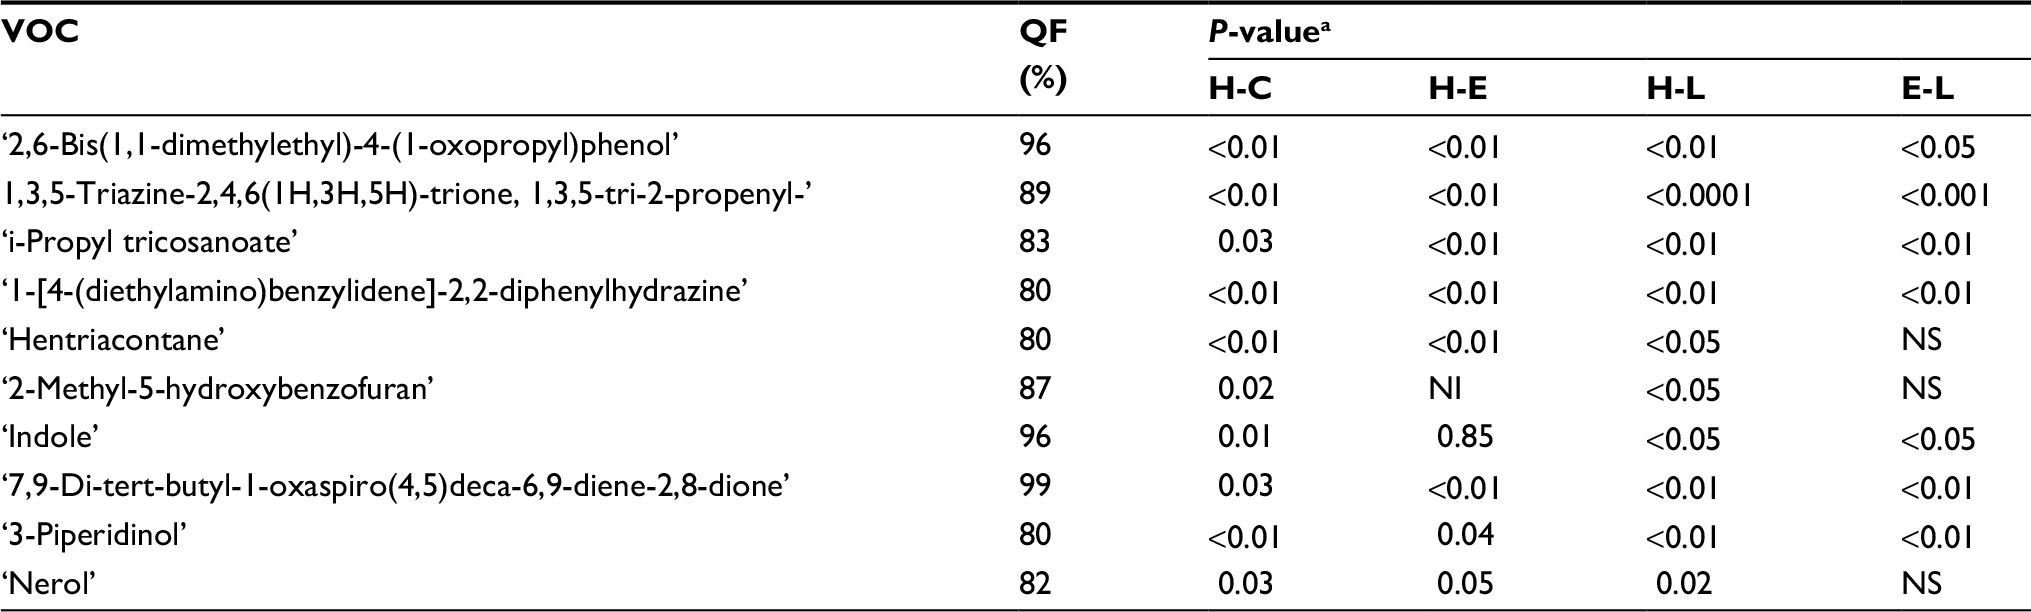 | Table 3 VOCs increased in post-breast cancer implantation in the LP mice group Notes: aCalculated with a two-tailed paired t-test. Abbreviations: VOC, volatile organic compound; LP, low protein; H, healthy; E, early; L, late; C, cancer, both E and L; QF, Quality Factor; NI, not identified; NS, not significant. |
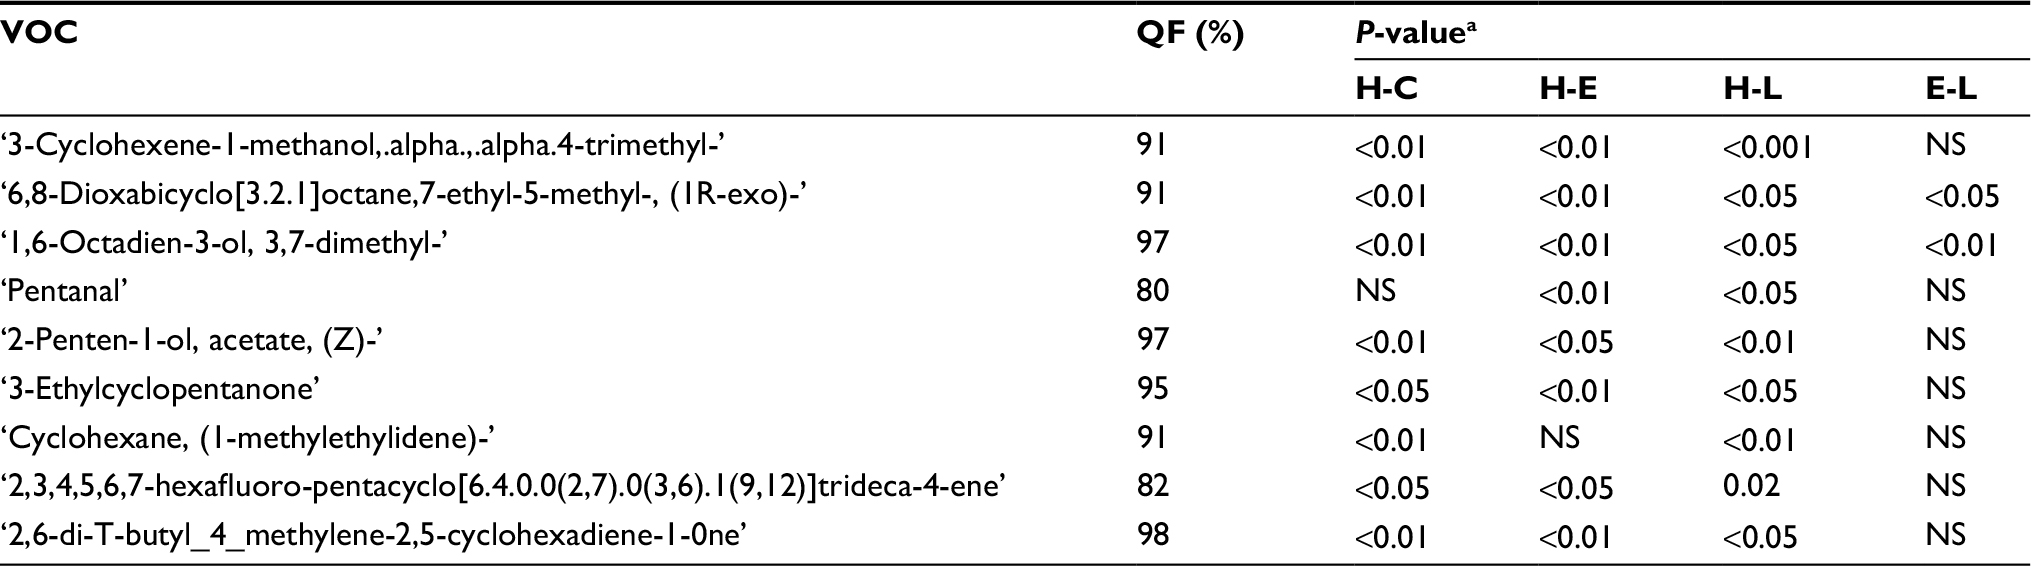 | Table 4 VOCs increased post-breast cancer implantation in the HP mice group Notes: aCalculated with a two-tailed paired t-test. Abbreviations: VOC, volatile organic compound; HP, high protein; H, healthy; E, early; L, late; C, cancer; both E and L; QF, Quality Factor; NS, not significant. |
In total, 19 potential compounds were suggested by the models as potentially reliable biomarkers for identifying breast cancer, and for explaining the different boosts in breast cancer growth observed in the different mice diet groups. In addition, we present, in Tables 3 and 4, an evaluation of the increase in VOC levels of the different peaks before and after cancer implantation. The analysis presented in Tables 3 and 4 corresponds to changes in urine composition, due to both diet and tumor growth.
Melanoma-bearing mice – effect of LP diet
The sample classification used in this experiment is summarized in Table 5. Classification to healthy, early, and late melanoma stages was determined according to a visual inspection and palpation of the cancer. Analysis of urine samples from healthy and tumor-bearing mice revealed some differences in the composition of the VOCs.
 | Table 5 Sample classification Notes: aRelative to the injection of B16 melanoma cells, which was performed immediately after obtaining Sample B. bBased on the signature of the VOCs and on tumor palpation. Abbreviation: VOC, volatile organic compound. |
A total of 86 VOCs were identified in all the samples examined, with QF above 80%. After eliminating VOCs that were detected in the background samples (described earlier), only a total of 42 VOCs remained in the urine samples analysis. Using PLS-DA analysis of the three different melanoma stages (Figure 5), we discerned a reduced number of peaks from 42 to nine VOCs (Table 6). These compounds could serve as potential biomarkers for distinguishing between healthy, early, and late melanoma. Also presented in Table 6 is the significance testing of the increase of VOC levels in which P<0.05 was considered statistically significant. Furthermore, we compared VOCs found in the present study with those identified in our previous study, that examined VOCs emitted from the urine of mice fed by HP diet before (healthy group) and after (cancer group) the subcutaneous injection of B16 melanoma cells.
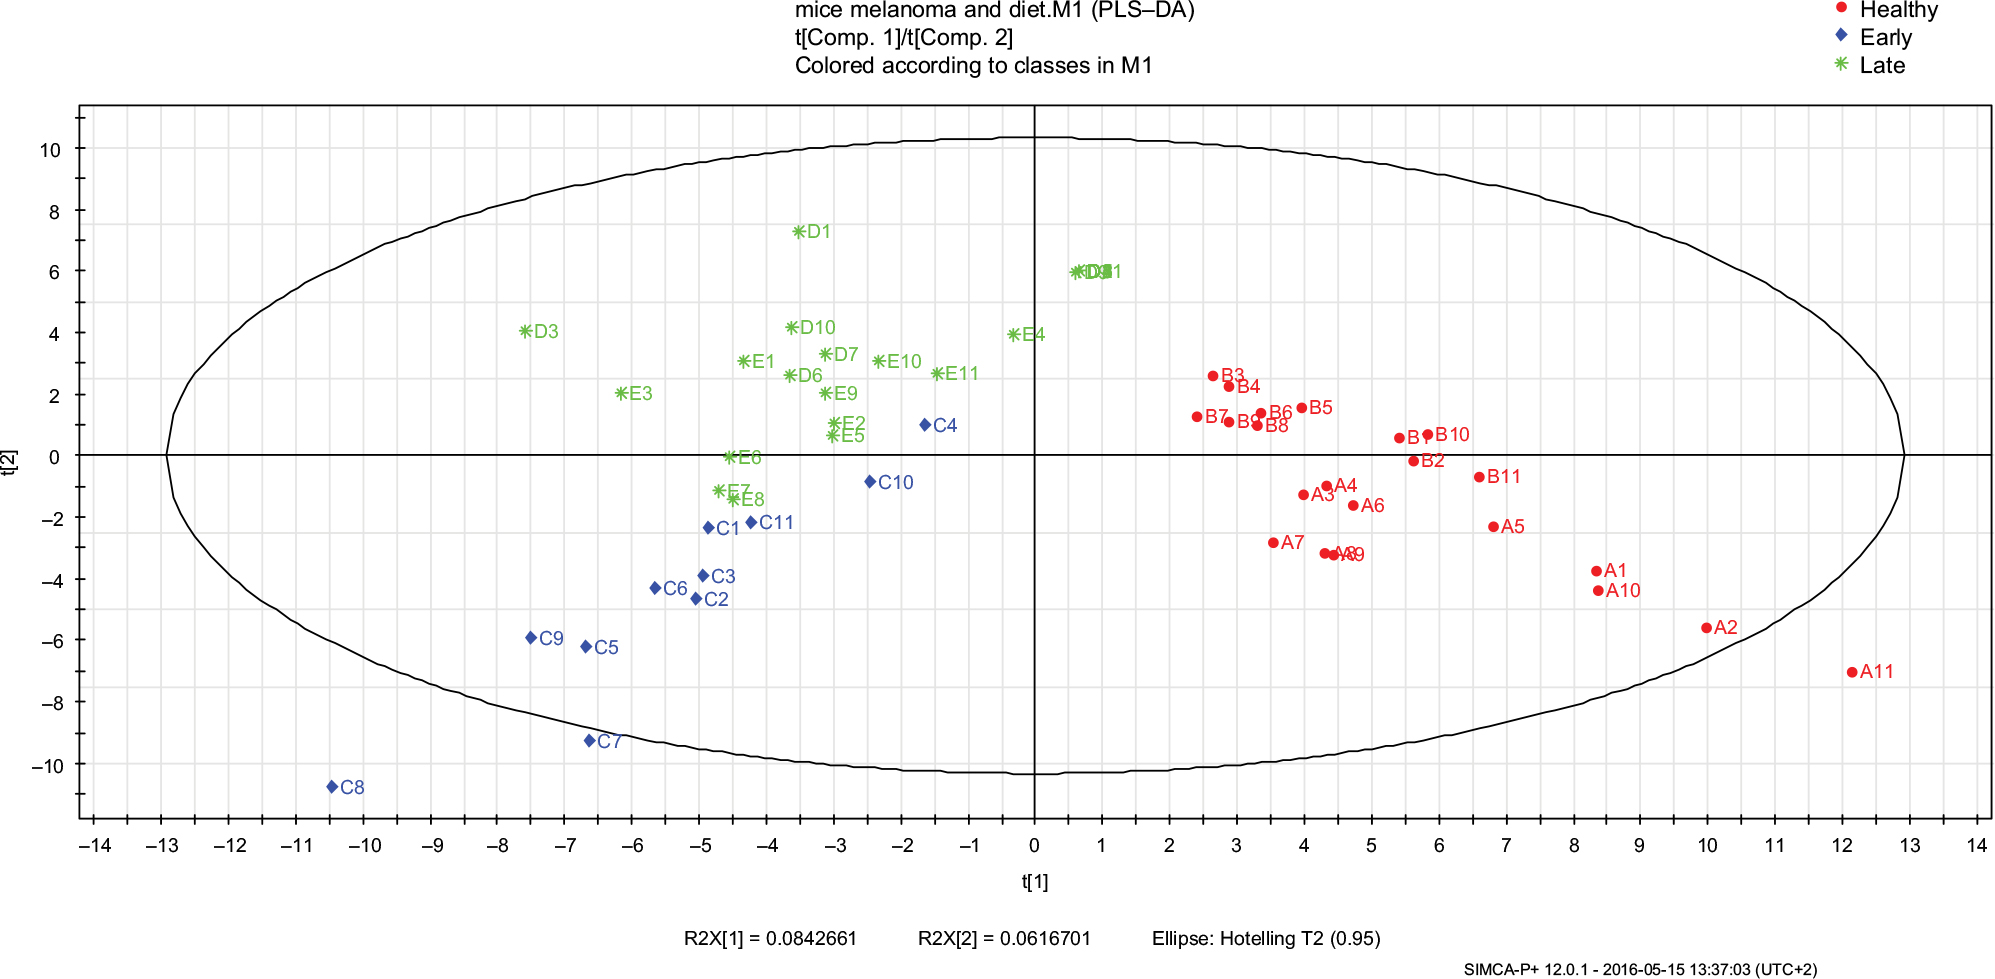 | Figure 5 PLS-DA models of urine VOCs composition were built with the SIMCA P+ software for the melanoma bearing mice urine samples in the different cancer phases (healthy, early, and late malignancy). The model includes three latent variables that were calculated by the software. Red circles represent the healthy samples (A and B; samples collected before cancer injection), blue diamonds represent the samples collected in the early phase of malignancy (C), and green stars represent the samples collected in the late phase of malignancy (D and E). The numbers represent the mouse ID number. Abbreviations: PLS-DA, partial least square discriminate analysis; VOC, volatile organic compound. |
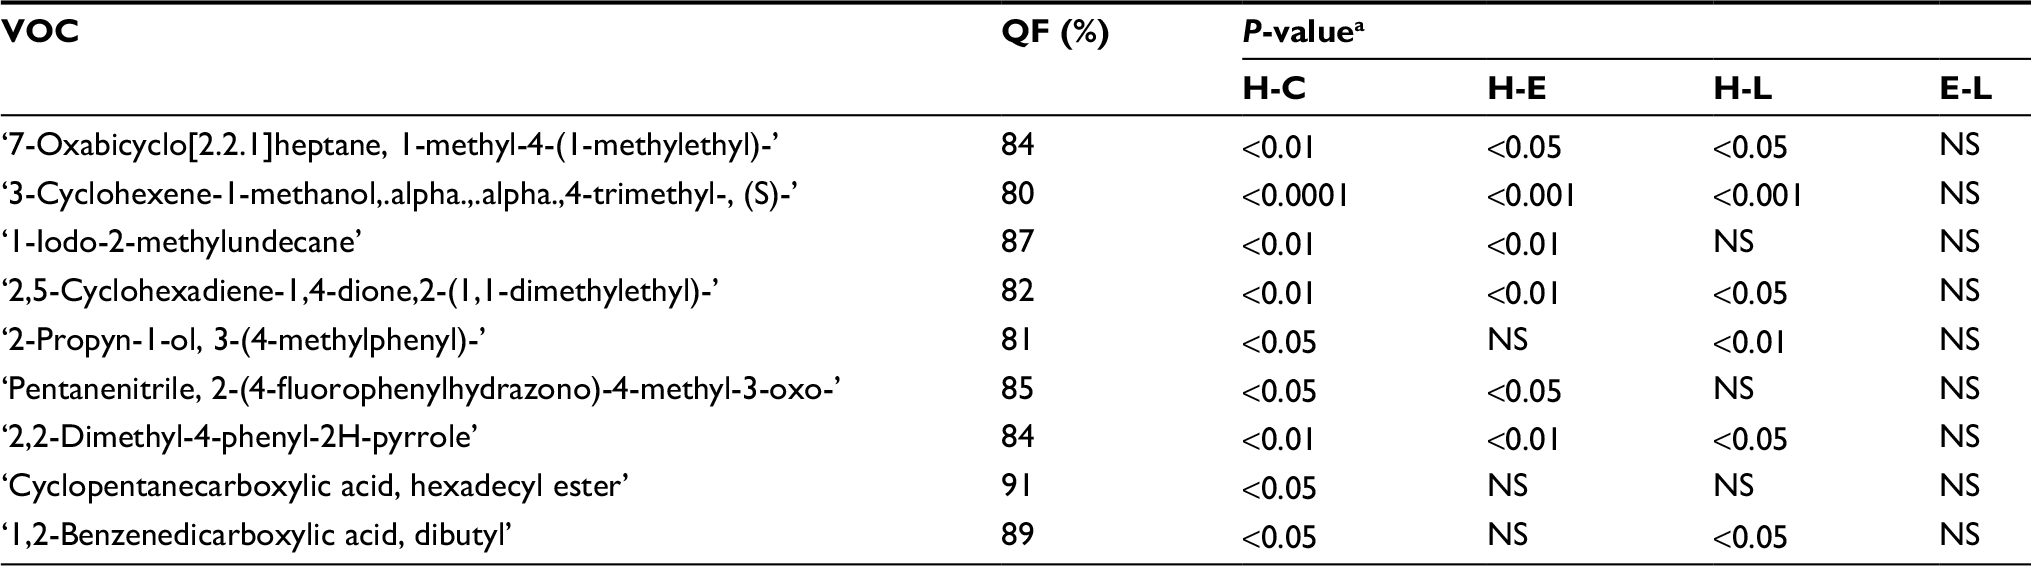 | Table 6 VOCs increased post-cancer cell injection in melanoma bearing mice on an LP diet Notes: aCalculated with a two-tailed paired t-test. Abbreviations: VOC, volatile organic compound; LP, low protein; H, healthy; E, early melanoma; L, late melanoma; C, cancer, both E and L; QF, Quality Factor; NS, not significant. |
Discussion
Breast cancer—effect of diet
Tumor volume assessment of the mice presented significantly slower tumor growth in mice fed with LP diet compared with HP diet mice (Figure 1). Similar results have been reported in human studies, showing that a long-term intake of an LP diet is associated with inhibiting the IGF/AKT/mTOR pathway and with epigenetic modifications that are linked to an increase risk of cancer.25 To learn more about the possible factors that might influence these findings, we identified VOCs in the urine of mice maintained on HP and LP diets in their healthy, early, and late stages of the malignancy. Both type of diet and the stage of malignancy noticeably influenced the composition of the VOCs in the urine.
To assess the effect of diet on urine VOCs composition prior to cancer injection, we examined the VOCs excreted in urine, before cancer was implanted, in the different diet groups (Table 2). Two VOCs were observed in all LP mice, but not in any of the HP mice: 2-Pentanone and propane,1-isothiocyanato-3-(methylthio).
Both compounds had been reported in the literature for their cancer modulation effects and prophylactic characteristics against cancer. The 2-pentanone has been linked, in previous studies, to the inhibition of both prostaglandin production and COX-2 (inflammatory/cancerous enzyme) expression in human cancer cells, including breast cancer cells.26 Moreover, the latter VOC, propane,1-isothiocyanato-3-(methylthio), was shown in a recent study to have cancer chemo-preventive potential, as it is one of the most potent inducers of phase II detoxification enzymes.27
A promising VOC candidate biomarker of breast cancer that explains the increased boost in its growth in HP mice, is Pentanal. It was found in nine out of the ten HP breast cancer-bearing mice. Pentanal is a carbonyl compound product of lipid per-oxidation. It is responsible for a significant increase in UDS (unscheduled DNA synthesis) in both humans and rats.28 This mechanism is considered one of the main factors in breast cancer.29–31 Furthermore, exhaled Pentanal concentrations were found to be significantly higher in lung cancer patients as compared to those in control patients.32 Another likely potential biomarker found in urine samples of HP mice is 3-heptanone. This compound was recently also reported to be found in a significantly increased amount in urine samples from breast cancer patients.33 Both compounds may be candidate biomarkers that result from lipid peroxidation of fatty acids presented in the tumor cell membranes. These findings suggest that pentanal and 3-heptanone are valid direct products of breast cancer cell metabolism, meriting further study. In contrast, no significant elevations of pentanal were found in the LP group, even after tumor development.
A potential biomarker found in the LP group (six out of eight LP mice vs none in the HP group) is “Benzoic acid, 4-ethoxy-, ethyl ester.” The main source of Benzoic acid is in food of plant origin. However, benzoic acid derivatives have been associated with antioxidant properties.34 Since oxidative stress has an important role in the initiation and preservation of breast cancer progression, compounds such as “Benzoic acid, 4-ethoxy-, ethyl ester,” with anti-oxidant properties, may account for the higher resistance of tumor growth observed in the LP mice.
Another potential protective VOC obtained in samples of the LP group is “Disulfide, dimethyl;” this compound is observed also in samples obtained from the HP (25%) group, yet it was in a higher percentage (75%) in the LP group. “Disulfide, dimethyl” is generated in humans by an incomplete metabolism of methionine in the transamination pathway. In proteins it plays an important role in the maintenance of biological activity and conformational stability.35 However, it was found that cancer cells in a medium with little-to-no methionine often stop growing/dividing and instead undergo apoptosis.36 In other words, obtaining “Disulfide, dimethyl” more frequently in the LP mice may indicate less complete metabolism of methionine, resulting in the suppressed growth of cancer cells. It is also possible that dimethyl disulfide is a downstream product of propane,1-isothiocyanato-3-(methylthio) that was observed in LP mice; see discussion above. Interestingly, Disulfide, dimethyl has been observed recently as a biomarker in cases of melanoma.37
Examining VOCs that may be associated with the progression of tumor growth, we found “N-Methyl-N-nitroso-aniline.” The level of this nitrosamine in the urine samples of the HP mice increased significantly from healthy, to early, then to late stages, although it did not change significantly in the LP and SG groups. Nitrosamines have become a matter of great concern in relation to carcinogenesis: under certain experimental conditions, a single dose can be carcinogenic.38 This appears to be an important consideration for nitrosamine toxicity; furthermore, the administration of “N-Methyl-N-nitroso-aniline” induces esophagus tumor modeling in rats and mice.39,40
Melanoma cancer—LP diet effect
In a previous study, performed in our laboratory, we analyzed the VOCs found in the urine of mice before (healthy group) and after (cancer group) the subcutaneous injection of B16 melanoma cells. The mice were then maintained on an HP diet. In the present study, we performed the same analysis, however the mice were maintained on an LP diet.
Tumor cell growth was monitored in the mice by visual inspection and palpation to assess tumor stage. A similar assessment was used in our previous study.
It should be noted that, in the mice maintained on an LP diet, cancer growth was higher than what was observed in our previous study where an HP diet was used. The mice mortality rate was also higher, as only six out of the 11 mice survived 12 days after cancer cell injection. These findings contrast with the observations presented and discussed above on the experiments that used the breast cancer model, where mice on the LP diet lived longer than the mice on the HP diet. Further study of this phenomenon should be designed to substantiate these findings. B16 melanoma cells are highly aggressive, and this may be connected to the observed inefficacy of dietary alteration.
We identified the VOCs found in mice urine samples obtained from melanoma-bearing mice in their healthy, early and late stages of the malignancy. These results were compared with the data obtained in our previous study where an HP diet was used. To explore the effect of an LP diet on the development of cancer, i.e., on tumor growth from early to late stages, we performed comparative analysis using PLS-DA modeling. We identified in the present work a total of nine VOCs in urine that could serve as potential biomarkers of cancer. These potential biomarkers were identified by analysis of urine sample VOC composition before and after cancer cell injection.
There was not much overlap between the potential VOCs identified in this study and those observed in our previous study. Quantitative analysis of the variations in VOC concentration as a function of tumor growth revealed that 6-methyl-3-heptanone exhibited a marked increase in concentration when the tumor grew for samples obtained from mice maintained on an HP diet. However, the levels of 6-methyl-3-heptanone were nearly constant for mice that were maintained on an LP diet. Additional studies of this compound are required, as it might be responsible for the differences in the tumor growth observed in HP and LP melanoma-bearing mice. Considering that 6-methyl-3-heptanone has been previously linked to human liver and lung cancer,39 we suggest its linkage to melanoma here as well.
Identification of cancer related VOCs in many malignancies41–43 is being actively searched. The ability to detect early disease, as well as recurrence and follow-up with a simple, non-invasive procedure makes this search worthwhile.
Conclusion
Although past studies have suggested that an LP diet is associated with the inhibition of cancer, in this study we present evidence that the efficacy of diet management in regard to malignancy depends on the type of cancer involved.
Analysis of the VOCs excreted from the urine of cancer bearing-mice confirmed some of the potential biomarker candidates that were previously reported to indicate breast cancer, melanoma, and/or other malignancies. Those reports strengthen the validity of our findings and imply the existence of “cancer type”-specific biomarkers, and of common cancer biomarkers.
The observed increase in the concentration of ketones with increasing tumor burden suggests that ketogenesic pathways, incorporating various ketone formations, may be involved in the progression of cancer, and that they may promote positive feedback to tumor growth or inhibition of tumor growth promoters. Therefore, monitoring these ketones could help with tumor follow-up in cancer patients.
The LP group also showed elevated levels of 2-pentanone, Benzoic acid, 4-ethoxy-, ethyl ester, and Disulfide, dimethyl, which have previously been linked to anticancer biochemical activity. The full significance of this has yet to be determined, but we conjecture that the LP diet contributed to a general physiological state of lower susceptibility to cancer. To substantiate the findings in this study, further investigations of the urine VOCs for cancerous mice should be done, involving mice injected with different numbers and types of tumor cells, including human cells in immunosuppressed mice. This may lead to the development of a noninvasive and reliable diagnostic procedure to detect cancer and to estimate its stage of development. It may also increase our understanding of the relation between diet and cancer. Our results are in line with the work of Maddocks et al,44 which show that serine and glycine deprivation inhibits growth of some tumors. Whether this dietary intervention is effective depends on both the oncogenic context and tumor tissue of origin.
Acknowledgments
This project was supported in part by The Richard H. Holzer Foundation, USA. We thank M. Eichler for useful discussions. DE was supported by the Israel Science Foundation (ISF), The Binational Science Foundation (BSF), and The Joan and Robert Arnow Chair of Theoretical Astrophysics.
Author contributions
Jacob Gopas; substantial contributions to conception and design, and analysis and interpretation of data. Amir Abd EL Qader; acquisition of data and its analysis. Carol Isaacson; acquisition of data. David Eichler; substantial contributions to conception and design, and analysis and interpretation of data. Yehuda Zeiri; substantial contributions to conception and design, and analysis and interpretation of data. All authors contributed toward data analysis, drafting and revising the paper and agree to be accountable for all aspects of the work.
Disclosure
The authors report no conflicts of interest in this work.
References
Siegel RL, Miller KD, Jemal A. Cancer statistics. 2018. CA: Cancer J Clin. 2018;68:7–30. | ||
Torre LA, Bray F, Siegel RL, Ferlay J, Lortet-Tieulent J, Jemal A. Global cancer statistics, 2012. CA: Cancer J Clin. 2015;65:87–108. | ||
Rigel DS, Russak J, Friedman R. The evolution of melanoma diagnosis: 25 years beyond the ABCDs. CA Cancer J Clin. 2010;60:301–316. | ||
Sever A, Abd Elkadir A, Matana Y, Gopas J, Zeiri Y. Biomarkers for detection and monitoring of B16 melanoma in mouse urine and feces. J Biomark. 2015;2015:841245. | ||
Singletary SE. Rating the risk factors for breast cancer. Ann Surg. 2003;237:474–482. | ||
McPherson K, Steel C, Dixon JM. ABC of breast diseases. Breast cancer—epidemiology, risk factors, and genetics. BMJ. 2000;321:624–628. | ||
Balch CM, Soong SJ, Gershenwald JE, et al. Prognostic factors analysis of 17,600 melanoma patients: validation of the American Joint Committee on Cancer melanoma staging system. J Clin Oncol 2001;19:3622–3634. | ||
Chow WH, Gridley G, McLaughlin JK, et al. Protein intake and risk of renal cell cancer. J Natl Cancer Inst. 1994;86:1131–1139. | ||
Levine ME, Suarez JA, Brandhorst S, et al. Low protein intake is associated with a major reduction in IGF-1, cancer, and overall mortality in the 65 and younger but not older population. Cell Metab. 2014;19(3):407–417. | ||
Thorogood M, Mann J, Appleby P, McPherson K. Risk of death from cancer and ischaemic heart disease in meat and non-meat eaters. BMJ. 1994;308:1667–1670. | ||
Chang-Claude J, Frentzel-Beyme R, Eilber U. Mortality patterns of German vegetarians after 11 years of follow-up. Epidemiology. 1992;3; 395–401. | ||
Chang-Claude J, Frentzel-Beyme R. Dietary and lifestyle determinants of mortality among German vegetarians. Int J Epidemiol. 1993;22; 228–236. | ||
Shirasu M, Touhara K. The scent of disease: volatile organic compounds of the human body related to disease and disorder. J Biochem. 2011;150:257–266. | ||
Yoel U, Gopas J, Ozer J, Peleq R, Shvartzman P. Canine scent detection of volatile elements characteristic of malignant cells in cell culture. Isr Med Assoc J. 2015;17:567–570. | ||
Williams H, Pembroke A. Sniffer dogs in the melanoma clinic? Lancet. 1989;333(8640):734. | ||
Pickel D, Manucy GP, Walker DB, Hall SB, Walker JC. Evidence for canine olfactory detection of melanoma. Appl Animal Behav Sci. 2004;89(1):107–116. | ||
D’Amico A, Bono R, Pennazza G, et al. Identification of melanoma with a gas sensor array. Skin Res Technol. 2008;14:226–236. | ||
Abaffy T, Moller M, Riemer DD, Milikowski C, Defazio RA. A case report - volatile metabolomic signature of malignant melanoma using matching skin as a control. J Cancer Sci Ther. 2011;3:140–144. | ||
Kwak J, Gallagher M, Ozdener MH, et al. Volatile biomarkers from human melanoma cells. J Chromatogr B Analyt Technol Biomed Life Sci. 2013;931:90–96. | ||
Armbruster DA, Pry T. Limit of blank, limit of detection and limit of quantitation. Clin Biochem Rev. 2008;29(Suppl 1):S49–S52. | ||
Mitra S, editor. Sample preparation techniques in analytical chemistry. Vol. 237. Hoboken, NJ: John Wiley & Sons; 2003. | ||
Long GL, Winefordner JD. Limit of detection. A closer look at the IUPAC definition. Anal Chem.1983;55:712A–724A. | ||
Shrivastava A, Gupta VB. Methods for the determination of limit of detection and limit of quantitation of the analytical methods. Chronicles Young Sci 2011;2;21–25. | ||
Stein SE. Chemical substructure identification by mass spectral library searching. J Am Soc Mass Spectrom. 1995;6:644–655. | ||
Fontana L, Adelaiye RM, Rastelli AL, et al. Dietary protein restriction inhibits tumor growth in human xenograft models of prostate and breast cancer. Oncotarget. 2013;4:2451–2461. | ||
Pettersson J, Karlsson PC, Goransson U, Rafter JJ, Bohlin L. The flavouring phytochemical 2-pentanone reduces prostaglandin production and COX-2 expression in colon cancer cells. Biol Pharm Bull. 2008;31:534–537. | ||
Shabana MM, Fathy FI, Salama MM, Hashem MM. Cytotoxic and antioxidant activities of the volatile constituents of Brassica tournefortii gouan: growing in Egypt. Cancer Sci Res. 2013;1:1–4. | ||
Martelli A, Canonero R, Cavanna M, Ceradelli M, Marinari UM. Cytotoxic and genotoxic effects of five n-alkanals in primary cultures of rat and human hepatocytes. Mutat Res. 1994;323:121–126. | ||
Ray G, Batra S, Shukla NK, et al. Lipid peroxidation, free radical production and antioxidant status in breast cancer. Breast Cancer Res Treat. 2000;59:163–170. | ||
Boyd NF, McGuire V The possible role of lipid peroxidation in breast cancer risk. Free Radic Biol Med. 1991;10:185–190. | ||
Kovacs E, Stucki D, Weber W, Müller H. Impaired DNA-repair synthesis in lymphocytes of breast cancer patients. Eur J Cancer Clin Oncol. 1986;22:863–869. | ||
Fuchs P, Loeseken C, Schubert JK, Miekisch W. Breath gas aldehydes as biomarkers of lung cancer. Int J Cancer. 2010;126:2663–2670. | ||
Silva CL, Passos M, Câmara JS. Solid phase microextraction, mass spectrometry and metabolomic approaches for detection of potential urinary cancer biomarkers—a powerful strategy for breast cancer diagnosis. Talanta. 2012;89:360–368. | ||
Natella F, Nardini M, Di Felice M, Scaccini C. Benzoic and cinnamic acid derivatives as antioxidants: structure-activity relation. J Agric Food Chem. 1999;47:1453–1459. | ||
Tam JP, Wu CR, Liu W, Zhang JW. Disulfide bond formation in peptides by dimethyl sulfoxide. Scope and applications. J Am Chem Soc. 1991;113:6657–6662. | ||
Cavuoto P, Fenech MF. A review of methionine dependency and the role of methionine restriction in cancer growth control and life-span extension. Cancer Treat Rev. 2012;38:726–736. | ||
Wang Z, Sun M, Wang C. Detection of melanoma cancer biomarker dimethyl disulfide using cavity ringdown spectroscopy at 266 nm. Appl Spectrosc. 2016;70:1080–1085. | ||
Montesano R. Alkylation of DNA and tissue specificity in nitrosamine carcinogenesis. J Supramol Struct Cell Biochem. 1981;17:259–273. | ||
Napalkov NP, Pozharisski KM. Morphogenesis of experimental tumors of the esophagus. J Natl Cancer Inst. 1969;42.6;927–940. | ||
Hanai Y, Shimono K, Oka H, Baba Y, Yamazaki K, Beauchamp GK. Analysis of volatile organic compounds released from human lung cancer cells and from the urine of tumor-bearing mice. Cancer Cell Int. 2012;12:7. | ||
Dutta D, Chong NS, Lim SH. ndogenous volatile organic compounds in acute myeloid leukemia: origins and potential clinical applications. J Breath Res. 2018;12:034002. | ||
Heers H, Gut JM, Hegele A, et al. Non-invasive detection of bladder tumors through volatile organic compounds: a pilot study with an electronic nose. Anticancer Res. 2018;38(2):833–837. | ||
Tong H, Wang Y, Li Y, et al. Volatile organic metabolites identify patients with gastric carcinoma, gastric ulcer, or gastritis and control patients. Cancer Cell Int. 2017;17:108. | ||
Maddocks ODK, Athineos D, Cheung EC, et al. Modulating the therapeutic response of tumors to dietary serine and glycine starvation. Nature. 2017;544:372–376. |
 © 2018 The Author(s). This work is published and licensed by Dove Medical Press Limited. The full terms of this license are available at https://www.dovepress.com/terms.php and incorporate the Creative Commons Attribution - Non Commercial (unported, v3.0) License.
By accessing the work you hereby accept the Terms. Non-commercial uses of the work are permitted without any further permission from Dove Medical Press Limited, provided the work is properly attributed. For permission for commercial use of this work, please see paragraphs 4.2 and 5 of our Terms.
© 2018 The Author(s). This work is published and licensed by Dove Medical Press Limited. The full terms of this license are available at https://www.dovepress.com/terms.php and incorporate the Creative Commons Attribution - Non Commercial (unported, v3.0) License.
By accessing the work you hereby accept the Terms. Non-commercial uses of the work are permitted without any further permission from Dove Medical Press Limited, provided the work is properly attributed. For permission for commercial use of this work, please see paragraphs 4.2 and 5 of our Terms.