")
Back to Journals » International Journal of Nanomedicine » Volume 15
Tumor Targeting Chemo- and Photodynamic Therapy Packaged in Albumin for Enhanced Anti-Tumor Efficacy
Authors Zheng K , Liu H, Liu X, Wang Y, Li L, Li S, Xue J, Huang M
Received 15 August 2019
Accepted for publication 16 December 2019
Published 13 January 2020 Volume 2020:15 Pages 151—167
DOI https://doi.org/10.2147/IJN.S227144
Checked for plagiarism Yes
Review by Single anonymous peer review
Peer reviewer comments 2
Editor who approved publication: Dr Linlin Sun
Supplementary video Tumor Targeting Chemo- and Photodynamic Therapy Packaged in Albumin for Enhanced Anti-tumor efficacy
Views: 286
Ke Zheng, 1–3 Hongyan Liu, 1 Xinxin Liu, 1 Ying Wang, 1 Linlin Li, 2 Shijie Li, 2 Jinping Xue, 2 Mingdong Huang 2
1College of Chemical Engineering, Qingdao University of Science and Technology, Qingdao, Shandong 266042, People’s Republic of China; 2College of Chemistry, Fuzhou University, Fuzhou, Fujian 350118, People’s Republic of China; 3Key Laboratory of Pharmaceutical Research for Metabolic Disease, Qingdao University of Science and Technology, Qingdao, Shandong 266042, People’s Republic of China
Correspondence: Ke Zheng
College of Chemical Engineering, Qingdao University of Science and Technology, 53 Zhengzhou Road, Qingdao, Shandong 266042, People’s Republic of China
Tel +86 132 1018 5127
Email [email protected]
Purpose: Combination therapy for tumors is an important and promising strategy to improve therapeutic efficiency. This study aims at combining tumor targeting, chemo-, and photodynamic therapies to improve the anti-tumor performance.
Patients and Methods: Human serum albumin (HSA), as a nontoxic and biodegradable drug carrier, was used to load hydrophobic photosensitizers (mono-substituted β-4-pyridyloxy phthalocyanine zinc, mPPZ) by a dilution-incubation-purification (DIP) strategy to form molecular complex HSA:mPPZ. This complex was cross-linked as nanoparticles, and then chemotherapy drug doxorubicin (DOX) was adsorbed into the nanoparticles to achieve combined photodynamic therapy and chemotherapy. Next, the surface of the obtained composite was modified by a tumor surface receptor (urokinase receptor) targeting agent (ATF-HSA) using a noncovalent method to obtain the final product (ATF-HSA@HSA:mPPZ:DOX nanoparticles, AHmDN).
Results: AHmDN exhibited strong stability, remarkable cytotoxicity and higher uptake to tumor cells. Cell imaging analysis indicated that DOX was separated from AHmDN and uniformly distributed in cell nucleus while mPPZ localized in cytoplasm. The PDT activity of all the samples had been confirmed by the detection of intracellular ROS. In animal experiments, AHmDN was demonstrated to have a prominent tumor-targeting effect using a 3D imaging system. In addition, the enhanced antitumor effect of AHmDN in tumor-bearing mice was also been observed. Importantly, the tumor-targeting effect of such nanoparticles lasted for about 14 days after one injection.
Conclusion: These albumin nanoparticles with combined functions of tumor targeting, chemotherapy and photodynamic therapy can highly enhance the anti-tumor effect. This drug delivery system can be applied to package other hydrophobic photosensitizers and chemotherapy drugs for improving therapeutic efficacy to tumors.
Keywords: drug delivery system, combination therapy, phthalocyanine, doxorubicin, urokinase receptor mediated targeting
Introduction
Cancer remains as a leading cause of death in humans and a major barrier limiting life expectancy in the 21st century.1 Chemotherapy is a widely used treatment modality for cancer around the globe. Unfortunately, they also inhibit the rapid growth of bone marrow and gastrointestinal tract cells, which leads to serious side effects.2 In addition, varied therapeutic responses among different patients and the tendency to induce drug resistance limit the application of chemotherapeutic drugs.3 The improvement of the anti-cancer therapeutic effect has attracted persistent attention in basic research.
An important strategy to improve therapeutic efficiency is to combine multiple anti-cancer agent together or with other treatment modality.4–7 Simply mixing different therapeutic agents may not be suitable due to the difference in pharmacokinetic profiles and inconsistent tumor uptake.8 Many functional nanoparticles are developed to deliver various anti-cancer agents to tumor sites for a synergistic therapeutic effect. Such nanoparticles include gold nanoparticles,9 polymeric micelles,10,11 silica nanoparticles12,13 and magnetic nanoparticles.14,15 Nanoparticles can accommodate multiple drugs for combined chemotherapy, gene therapy, photothermal and photodynamic therapies to achieve a synergistic antitumor therapeutic effect. However, these materials are exogenous substances and may bring latent harm to the human body.
Human serum albumin (HSA) is an endogenous globular protein and is the most abundant protein in plasma16 with the characteristics of nontoxic, non-immunogenic and biodegradable.17 HSA is composed of three structurally similar domains (I, II, and III), each containing two subdomains (A and B).18 Some hydrophobic drugs generally bind to drug-binding pockets in subdomains IIA and IIIA, namely, Sudlow site I and site II.19 These sites have a strong propensity for hydrophobic drugs, which makes HSA molecules an ideal drug carrier.20
HSA nanoparticles can target tumor by EPR (enhanced permeability retention) effect.21 It is reported that receptor-mediated targeting is an important factor to further improve tumor targeting.22 Urokinase-type plasminogen activator receptor (uPAR) is overexpressed in many types of cancer, but not in most normal tissues. Amino-terminal fragment (ATF) is the primary receptor binding region of uPA which has a high affinity with uPAR.23 ATF is often used to modify the surface of nanoparticles by covalent cross-linking.24 However, the covalent coupling method most likely interferes with the binding ability of ATF, which leads to the loss of targeting.
In our work, hydrophobic phthalocyanine zinc (mono-substituted β-4-pyridyloxy phthalocyanine zinc, abbreviated as mPPZ) molecules, as photosensitizers for photodynamic therapy (PDT), were loaded into HSA using dilution-incubation-purification (DIP) method. This non-covalent package can inhibit the aggregation of ZnPc molecules and make them have a stronger fluorescence signal. HSA molecules loading disaggregated mPPZ were then formed as nanoparticles (HSA:mPPZ nanoparticles, abbreviated HmN), which was further incorporated with a chemotherapeutic drug doxorubicin, leading to HSA:mPPZ:DOX nanoparticles (abbreviated HmDN). Next, the surface of HmDN was modified with tumor-targeting fusion protein ATF-HSA using strong hydrophobic drug paclitaxel (PTX) as a coupling agent for its affinity with HSA to form final product ATF-HSA@HSA:mPPZ:DOX nanoparticles (abbreviated as AHmDN, HSA:mPPZ:DOX nanoparticles modified with HSA was abbreviated as HHmDN). The schematic synthesis process was shown in Scheme 1. These nanoparticles were characterized by ultraviolet-visible, fluorescence spectrum, dynamic light scattering, scanning electron microscope, and were proved to have strong stability. AHmDN was found to have the highest cytotoxicity among all. Flow cytometry analysis demonstrated the tumor cell targeting property of AHmDN and more cells in late apoptotic or necrosis induced by AHmDN. Cell imaging showed mPPZ distributed in cytoplasm and DOX in cell nucleus after the incubation with these nanoparticles. Albumin packaging by DIP method made mPPZ have higher ROS production efficiency. AHmDN showed prominent tumor targeting and antitumor effect through in vivo experiments. Remarkably, these nanoparticles with non-aggregated mPPZ had a long targeting effect up to 14 days after an initial injection. This loading method and drug delivery system may be used for other hydrophobic photosensitizers and chemotherapy drugs for improved tumor targeting and antitumor effect.
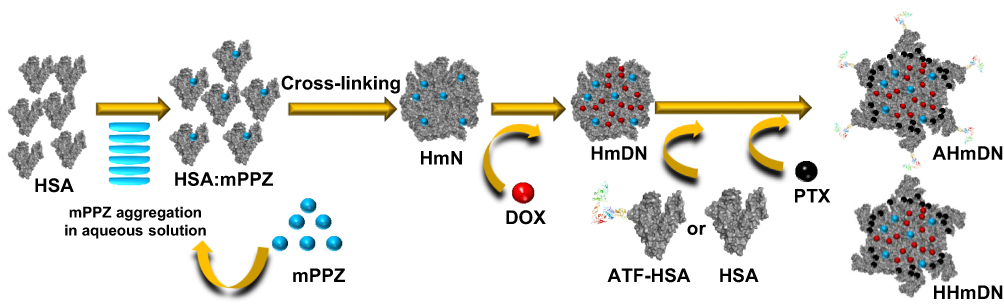 |
Scheme 1 Schematic illustration of the preparation of nanoparticles, HmN, HmDN, HHmDN and AHmDN. Abbreviations: PDT, photodynamic therapy; ZnPc, zinc phthalocyanine; DIP, dilution-incubation-purification; mPPZ, mono-substituted β-4-pyridyloxy phthalocyanine zinc; HSA, Human serum albumin; DOX, doxorubicin; PTX, paclitaxel; HmN, HSA:mPPZ nanoparticles; HmDN, HSA:mPPZ:DOX nanoparticles; HHmDN, HSA@HSA:mPPZ:DOX nanoparticles; AHmDN, ATF-HSA@HSA:mPPZ:DOX nanoparticles. |
Materials and Methods
Materials
Photosensitizer mPPZ was synthesized and purified as per a previous method (synthesis procedure was shown in Scheme S1).25 DOX and PTX were purchased from Wuhan DKY Technology Co. Ltd. (Wuhan, People’s Republic of China). HSA was purchased from Shanghai RAAS blood products co. Ltd. Diethylaminoethyl (DEAE) anion exchange resin was purchased from GE Healthcare (Uppsala, Sweden). Other chemicals were purchased either from Sigma-Aldrich (St Louis, MO, USA) or from Sinopharm Chemical Reagent Co. Ltd. (Shanghai, People’s Republic of China). Non-small-cell lung carcinoma cells (H1299) and human embryo lung fibroblasts cells (HELF) were purchased from American Type Culture Collection (ATCC, Manassas, VA, USA). Mouse H22 hepatoma cells were from Cell Bank of Chinese Academy of Sciences (Shanghai, People’s Republic of China). Clean level Kunming mice were purchased from Shanghai SLAC Laboratory Animal Co. Ltd., Chinese Academy of Sciences.
Loading Disaggregated mPPZ Molecules into HSA
HSA solution (1mL, containing 200mg HSA) was added into a mixed solution of 898mL 20mM Tris-HCl (pH 8.5, containing 50mM NaCl) and 80.9mL DMSO. Then, 10mL DMSO solution of mPPZ (6.1mg, with HSA and mPPZ at a molar ratio of 1:3) was dropwise added into the mixed solution (the final concentration of mPPZ was 10μM) with stirring during the whole process. After stirring for 12hrs in the dark room, the resulting mixing solution was then applied to a DEAE anion exchange column pre-equilibrated with 20mM Tris-HCl, 50mM NaCl, pH 8.5. The column was then washed with 20mM Tris-HCl, 50mM NaCl, pH 8.5. HSA loading mPPZ was eluted with 20mM Tris-HCl, 300mM NaCl, pH 8.5 and the complex HSA:mPPZ was collected. Finally, the solution of HSA:mPPZ was dialysed to PBS. The stoichiometric ratio of HSA and mPPZ in the complex HSA:mPPZ was obtained by measuring the ratio of the concentrations of HSA and mPPZ. HSA:mPPZ was disintegrated by 2% SDS. Then, the concentration of HSA was determined by a BCA Protein Assay Kit (BioTek Corporation, Beijing, People’s Republic of China). The lysate was diluted into 90% DMSO solution and the concentration of mPPZ was determined using its fluorescent quantitation standard curve with its characteristic maximal emission wavelength 686nm (excitation wavelength at 610nm).
Preparation of HSA:MPPZ Nanoparticles Adsorbing DOX Molecules
Ethanol was added into HSA:mPPZ solution (3mL) with the concentration of HSA 10mg/mL and the final concentration of ethanol was 55%. This mixed solution was stirred for 10mins and then 20µL 8% glutaraldehyde was added into them followed by stirring for 12hrs to get HSA nanoparticles loading mPPZ, HmN. After the dialysis to PBS, HmN was collected by centrifugation at 13000rpm for 10mins. The precipitate was resuspended using 500µL PBS and then 25µL DMSO solution of DOX (150mM) was added into the resuspended solution. After mixing for 2h, DOX was attached to HmN and final product HmDN was collected and purified by centrifugation at 13000rpm for 10mins.
The Surface Modifying of HmDN by ATF-HSA
The fusion protein ATF-HSA was constructed, expressed and purified as previously described.26 ATF-HSA (12.7mg, 200µL) was added into the PBS solution of HmDN (1mL, containing 10mg HSA). After stirring for 30mins, DMSO solution of PTX (10mM, 20µL) was added into the mixed solution and then there was another stirring for 12hrs. In the end, the final solution was centrifuged at 13000rpm for 10mins to purify and collect the product AHmDN. HHmDN was prepared as the same method except substituting ATF-HSA with HSA.
Characterization of the Prepared Nanoparticles
The ultraviolet-visible spectrum and fluorescence emission spectrum of mPPZ, HSA:mPPZ, HmN, HmDN, AHmDN and HHmDN in PBS was detected by a microplate reader (BioTek Instruments, Inc., Winooski, VT, USA). The particle size, polydispersity (PDI) and potential was continuously monitored for 3 weeks by Malvern Nanosizer ZS (Malvern Instrument, UK). The morphology of these nanoparticles was characterized by a field emission scanning electron microscopy (FESEM) (JSM-6700F, JEOL, Tokyo, Japan). Fluorescence quantum yields (ΦF) of the prepared nanoparticles and free mPPZ were calculated by the formula ΦF=ΦF(std)×(F×Astd×n2)/(Fstd×A×n2std), where F and Fstd were the areas under the fluorescence curves (excited at 610nm) of the sample and the standard, respectively. A and Astd stood for the fluorescence intensity of the sample and the standard at the excitation wavelength, and n2 and n2std were the refractive indices of solvents used for the sample and the standard, respectively. Unsubstituted ZnPc in DMF was used as the standard, and the ΦF of ZnPc was 0.28.
Encapsulation efficiency (EE) of the prepared nanoparticles was determined by the formula EE%=We/W0×100%. We represented the content of DOX or mPPZ loaded in nanoparticles and W0 represented the total content of DOX or mPPZ containing free and encapsulated components. The encapsulated drugs in nanoparticles were separated from free drugs by the centrifugation at 13000rpm for 10mins. Loading efficiency (LE) was calculated by the formula LE%=Me/Mm×100%. Me represented the weight of DOX or mPPZ in the nanoparticles and Wm represented the total weight of prepared nanoparticles. The concentration of HSA and mPPZ was detected by above methods while the concentration of DOX was determined using its quantitation standard curve with maximum absorption wavelength at 490nm. The drug release property of HmN, HmDN, AHmDN and HHmDN was monitored. All the nanoparticles were stored in PBS solution at 4°C. After 2 days, 4 days, 8 days, 14 days, 21 days, these solutions were centrifuged at 13000rpm for 10mins and the precipitate was resuspended. Then, the concentration of HSA, mPPZ and DOX in resuspension solution was detected as described above. The release percent (RE%) was calculated by the formula RE%=1−Wr/Wt×100%. Wr represented the content of DOX or mPPZ in precipitate after the storage and Wt represented their initial content in nanoparticles before the storage.
In vitro Cytotoxicity
H1299 or HELF cells were cultured in Roswell Park Memorial Institute (RPMI) 1640 medium supplemented with 10% fetal calf serum at 37°C in a humidified incubator with 5% CO2 atmosphere. The viability of cells was determined by trypan blue dye exclusion. Cells were maintained in logarithmic phase. H1299 or HELF cells were seeded into 96-well Costar® plates with 8000 cells in each well. After the attachment, cells were incubated with HmN, HmDN, AHmDN, HHmDN and mPPZ at various concentrations of mPPZ (0.01µM, 0.02µM, 0.05µM, 0.1µM, 0.2µM, 0.5µM). After 24 hrs, medium was replaced by fresh medium without samples followed by an illumination for 1min with an LED light source (680nm, 100mW, Sundynamic Inc., Qingdao, China) at a light fluence of 1.5 J/cm2. After 24 hrs, viable cells were checked by MTT method. Each experiment was repeated three times with four replicates at each time point. Dark toxicity of cells was detected by the same way just without illumination. The cytotoxicity of free DOX and free mPPZ at the same concentrations with DOX and mPPZ in nanoparticles was detected by the same method as above.
Flow Cytometry Analysis
H1299 cells were seeded in the 24-well plates at a density of 5×10⁴ per well and they were, respectively, incubated with HmN, HmDN, AHmDN and HHmDN for 12hrs at the equivalent concentration of 0.5μM mPPZ before they were harvested by centrifugation at 100g for 5 mins and washed by PBS for three times. Then, the cells were resuspended by PBS and the cellular uptake was analysed by the fluorescence measurement of mPPZ through flow cytometry (Accuri C6; BD, Franklin Lakes, NJ, USA). The cellular uptake analysis of HELF cells was done with the same steps.
Cell apoptosis was measured using Annexin V–FITC (fluorescein isothiocyanate)/PI (propidium iodide) Apoptosis Assay Kit (MultiSciences Biotech Co. Ltd., Hangzhou, People’s Republic of China). H1299 cells (5×10⁴) were, respectively, incubated with HmN, HmDN, AHmDN and HHmDN (at a final concentration of mPPZ 0.5μM) for 12hrs. Then, medium was replaced by fresh medium and cells were illuminated at a light fluence of 1.5 J/cm2. After another 12hrs, H1299 cells were harvested by centrifugation at 100g for 5 mins and washed by Hanks balanced saline solution for three times. The cells were then resuspended in 200μL of staining buffer and stained by Annexin V–FITC (2μL) and PI (4μL) for 5 mins in the dark, followed by an analysis on the flow cytometer. The percentage of early apoptotic, and late apoptotic or necrotic cells was determined. Each experiment was repeated three times with four replicates at each time point.
Cellular Localization
The suspended cells (H1299) were seeded into confocal chamber slides (Nest Biotechnology Co. Ltd., Wuxi, China) and incubated at 37°C for 24 hrs. Then, HmN, HmDN, AHmDN or HHmDN were added into the medium with final concentration of mPPZ 0.5µM. After incubation for 12hrs, adherent cells were washed by PBS to remove unbound nanoparticles and then incubated in medium containing DNA fluorescent dye, DAPI (4ʹ6-diamidino-2-phenylindole, 5µg/mL) for 30 mins. After another wash by PBS, fresh medium was added into the confocal chamber slides and the cells were imaged by Olympus FluoViewTM FV1000 laser scanning confocal microscope (Olympus Corp., Tokyo, Japan). The fluorescence of DOX or mPPZ in the cells was excited by an argon–ion laser light (λ=488nm or 633nm, respectively), while the emitted fluorescence was filtered with barrier filters (590/30 nm or 640–700 nm band pass, respectively). The fluorescence of DAPI was excited by diode laser (λ=405nm) and the emitted fluorescence filtered with barrier filters 450/30 nm band pass. All parameters, including the laser line intensity, photometric gain, settings of photo-multiplier tube and filter attenuation, were kept constant throughout the entire imaging experiment. All images were analysed by Olympus Fluoview v2.1 software.
Assessment of Intracellular ROS Levels
After the H1299 cells adhered in confocal chamber slides, HmN, HmDN, AHmDN or HHmDN was added into the medium with the final concentration of mPPZ 0.5µM. After the incubation for 12hrs, cells were washed by PBS and then incubated with 10μmol/l 2ʹ,7ʹ-dichlorofluorescein diacetate (DCFH-DA) solution (S0033, Beyotime, China) for 30mins in serum-free medium in the dark. The illumination (680nm) at a light fluence of 1.5 J/cm2 was followed by ROS Assessment. The fluorescence, based on the oxidative conversion of DCFH-DA to dichlorofluorescein (DCF) by ROS, was detected using Olympus FluoViewTM FV1000 laser scanning confocal microscope (Olympus Corp., Tokyo, Japan) with the excitation at 488 nm. All images were analysed by Olympus Fluoview v2.1 software.
Establishment of Hepatoma-22 (H22) Tumor-Bearing Mice Model
Female Kunming mice (4 weeks old and weighing 18–22g) were fed in accordance with the recommendations of the institutional animal care and use committee. Mouse H22 cells (5.0×10⁶) were injected into mice abdominal cavity. After 6 days, mice were executed by breaking the neck and ascetic fluid was collected. Then, the H22 cells (2.0×10⁶) from the ascetic fluid in normal saline (200µL) were subcutaneously injected on the back of each mouse. Typically, the mice were used for animal experiment in 5–7 days as the volume of tumor reached around 50mm3. All animal experiments were approved by Institutional Animal Care Committee of Qingdao University of Science and Technology, and all animal studies were performed in compliance with the guidelines of the committee.
Fluorescence Imaging in vivo
The H22 tumor-bearing Kunming mice were randomly divided into four groups (five mice per group) with the equivalent average starting tumor size (50mm3) and body weight (23g). Normal saline solution of HmN, HmDN, AHmDN and HHmDN (the concentration of mPPZ 25µM) was, respectively, injected into the mice of four groups from caudal vein as the dose of mPPZ at 0.2μmol/kg. Then, these mice were fed in dark room and were imaged at 4 hrs, 8 hrs, 16 hrs, 1 day, 1.5 days, 2 days, 3 days, 4 days, 5 days, 6 days, 8 days, 10 days, 12 days and 14 days with mPPZ as a probe. Isoflurane gas anesthesia system and fluorescent molecular tomography (FMT) 2500TM LX instrument (PerkinElmer, Waltham, MA, USA) were used for fluorescence imaging. For the determination of mPPZ concentration in mice, 0.2μM mPPZ solution in PBS containing 5% Cremolphore EL was used as a standard to calibrate the instrument. The collected data were reconstructed by the software TrueQuant v3.0 (PerkinElmer, Waltham, MA, USA) to three dimensions, and the quantitative information was analysed by creating ROIs around the tumor site after the subtraction of fluorescence background.
Antitumor Effect in vivo
The H22 tumor-bearing mice with equivalent tumor volume (50mm3) and weight (23g) were randomly divided into five groups (10 mice per group) as described above. The normal saline solution of HmN, HmDN, AHmDN and HHmDN was, respectively, injected into the mice of four groups at the dose of mPPZ 0.2μmol/kg using blank normal saline in the fifth group as a control. Then, all the mice were fed in dark room and the tumor site was illuminated by a 680nm light source (1 W, Luma Care Medical Group, newport Beach, CA, USA) for 3 mins with a light dose of 50 J/cm2. The PDT was implemented every day and lasted for 7 days. The tumor volume of every mouse was measured every day by a caliper through an ellipsoid volume formula, Π/6 × s (length × width × height). Every day, the weight of mice was measured using an electronic scale. After 7 days, all the mice of every experimental group were executed. Their tumor was stripped out and the tumor weight was recorded. In addition, H22 tumor-bearing mice were randomly divided into another five groups (12 mice per group) and were treated with HmN, HmDN, AHmDN or HHmDN, respectively, as above same method. After the therapy for 7 days, the number of live mice was recorded until 40 days.
Statistical Analysis
All data represented group means and standard errors of the mean (SEM). The experimental data in vitro and in vivo were analysed using the unpaired, two-tailed Student t-test. Differences at the 95% confidence level (p < 0.05) were considered to be statistically significant.
Results
Characterization of Prepared Nanoparticles
The aggregation behavior of mPPZ was monitored by its electronic spectrum. Figure S1A showed the typical absorption spectrum of zinc phthalocyanine mPPZ which has the maximum absorption peak at 670nm, demonstrating a monomer state of mPPZ in DMF. However, the monomer absorption peak was relatively reduced and the absorption peak at 630nm was raised when the solution medium was substituted by water (Figure 1A) showing that mPPZ was in a state of aggregation. Through the package of HSA molecules, the monomer absorption peak of mPPZ was significantly enhanced in the complex HSA:mPPZ (Figure 1A), which demonstrated the disaggregation function of HSA by DIP method. In addition, the fluorescence emission intensity of HSA:mPPZ increased by about 10 times than mPPZ at the same concentration in PBS (Figure 1B). Though the fluorescence quantum yield ΦF of HmN, HmDN, HHmDN and AHmDN was a little lower than mPPZ in DMF, that was much higher than single mPPZ in PBS (Table S1). Therefore, the package of mPPZ inside HSA greatly improved its imaging capability.
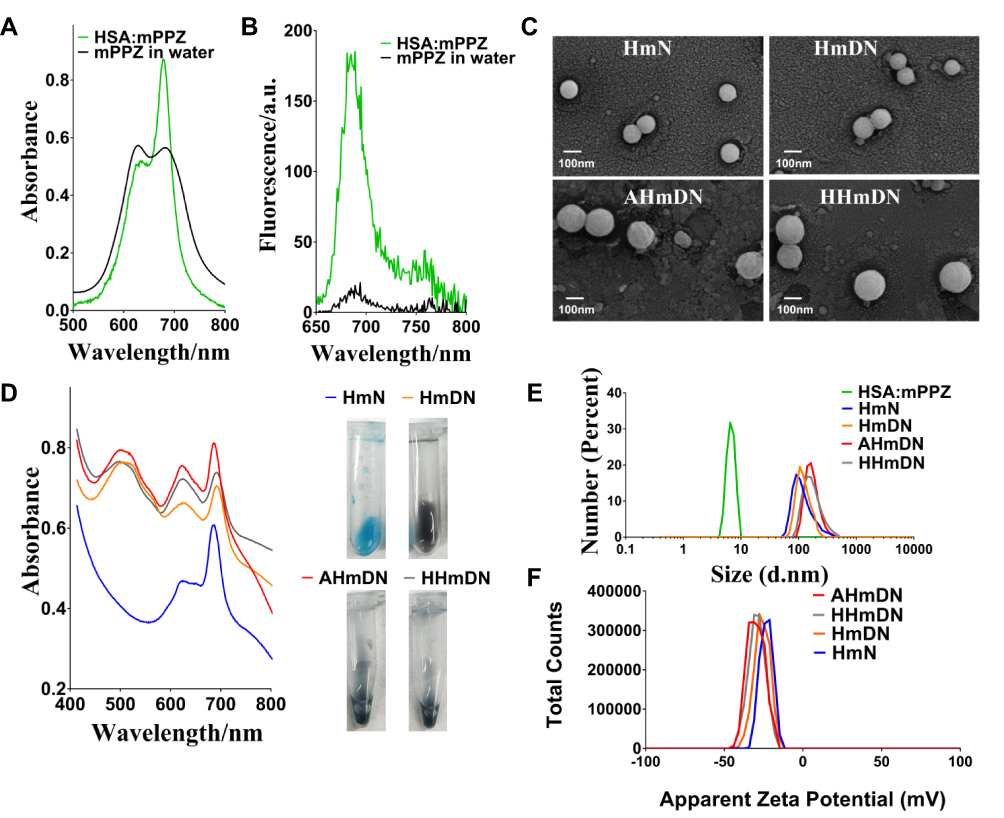 |
Figure 1 The characterization of the prepared nanoparticles. Notes: (A) mPPZ in HSA:mPPZ prepared by DIP method was mainly in monomer form in PBS. (B) HSA:mPPZ had a stronger fluorescence peak than mPPZ in water solution. (C) Spherical structure of HmN, HmDN, HHmDN, AHmDN was shown in the FESEM images. (D) The ultraviolet-visible spectrums of HmN, HmDN, HHmDN, AHmDN. All mPPZ in nanoparticles was still in the monomer state after their preparation and the characteristic absorption peak at 490nm indicated DOX was loaded into HmDN, HHmDN, AHmDN nanoparticles. Illustrations were photographs of HmN, HmDN, HHmDN, AHmDN in PBS solution. (E) Hydrodynamic diameters of HSA:mPPZ, HmN, HmDN, HHmDN, AHmDN measured by DLS. (F) The zeta potential of HmN, HmDN, HHmDN, AHmDN. |
The morphology of HmN and HmDN was measured by FESEM, which showed a spherical structure with size in accordance with the results of DLS data (Figure 1C). Compared to HmN and HmDN, the morphology of AHmDN and HHmDN was slightly different and showed a shell structure with a rough surface, suggesting the surface coating of HSA or ATF-HSA (Figure S2). The absorption spectra of HmN, HmDN, AHmDN and HHmDN were shown in Figure 1D. HmDN, HHmDN and AHmDN had the similar absorption peaks including both characteristic absorption peak of DOX (Figure S1A) and mPPZ, which illustrated DOX molecules were loaded into the nanoparticles. It was worth noting that mPPZ still had an obvious monomer peak in the four nanoparticles, which indicated mPPZ was maintained being packaged inside HSA during their preparation process. The particle size of HSA:mPPZ was about 7nm approximating the particle size of a single HSA molecule (Figure 1E), which signified no aggregation between HSA molecules induced by mPPZ. The particle size of HmN was increased to 98nm through covalent cross-linking by glutaraldehyde. The particle size of HmDN was 105nm nearly identical to HmN. The surface modification by ATF-HSA or HSA mediated by PTX made the particle size of HHmDN and AHmDN further increase to 166nm and 179nm, respectively (Figure 1E, Table S2). The small PDI value demonstrated that all prepared nanoparticles had high homogeneity (Table S2). The zeta potential of HmN, HmDN, AHmDN and HHmDN was identified at −22mV, −25mV, −33mV and −30mV, respectively (Figure 1F, Table S2), indicating their high colloidal stability in PBS solution. The EE% value of four nanoparticles was about 13% for mPPZ and 60% for DOX, and the LE% value was relatively small for the large HSA weight (Table S2).
During the storage at 4°C for 3 weeks, the particle sizes and PDI of HmN, HmDN, AHmDN and HHmDN in PBS remained almost unchanged (Figures S3A and S3B), especially AHmDN and HHmDN, where their surface was modified by a new method, maintained high stability during the storage process. The drugs should not leak from nanoparticles in the storage and before reaching the target organs. There was little RE% of mPPZ for the four nanoparticles (less than 2%) after the storage for 72 hrs, and the average RE% of DOX for both HHmDN and AHmDN was 1.6% which was less than that for HmDN (Table S2). If mPPZ or DOX was released from the nanoparticles, the stoichiometric ratio with HSA could make a difference. Thus, the stoichiometric ratio of mPPZ:HSA and DOX:HSA was used to monitor drugs release from the HmN, HmDN, HHmDN and AHmDN. The stoichiometric ratio of mPPZ:HSA had hardly changed in all four nanoparticles during the storage for 3 weeks (Figure S3C). These results demonstrated that the package of HSA for mPPZ was very tight and the formation of these nanoparticles did not affect the package effect. Figure S3D showed that HmDN had a slight release of DOX during the monitoring for 21 days. Using HmDN as a control, surface modification was shown to limit the release of DOX from HHmDN and AHmDN and render them excellent stability (Figure S3D).
Cytotoxicity
Since it is significant to clarify whether the package of HSA affected the activity of mPPZ and DOX. H1299 and HELF cells were used to evaluate the cytotoxicity. Figure 2 shows that HmN had barely cytotoxicity without illumination in both H1299 and HELF cells until the concentration of mPPZ went to 0.5μM, which suggested the drug carrier was harmless for cells. HmN showed enhanced cytotoxicity with illumination, demonstrating the photodynamic activity of mPPZ. As DOX molecules were loaded into HmN, both phototoxicity and dark toxicity of HmDN to the two cell lines were further increased, indicating combined antitumor effect of PDT and chemotherapy. Through the surface modification by HSA or ATF-HSA mediated by PTX, AHmDN and HHmDN still remained powerful cytotoxicity to both H1299 and HELF cells. PTX, as a chemotherapeutic drug, could stabilize microtubule and induced cytotoxicity by cutting off cell cycle in the G2/M phase,27 which may result in the increased toxicity for HHmDN and AHmDN. It was worth noting that AHmDN had higher phototoxicity than HHmDN for H1299 cells with about triple difference at the mPPZ concentration of 0.1μM, 0.2μM and 0.5μM, while a similar phototoxicity for HELF cells (Figure 2). This may be attributed to a large amount of the uPAR receptor expressed on the H1299 cell surface whereas little uPAR expression on HELF cell surface.28 The difference in cytotoxicity demonstrated the targeting ability of AHmDN and there was no influence on the activity of ATF-HSA during the whole preparation process. Using the free mPPZ and free DOX at the same concentration with that in nanoparticles as the control, the results further demonstrated that combined treatment caused higher cytotoxicity than the treatment with single drug (Figure S4).
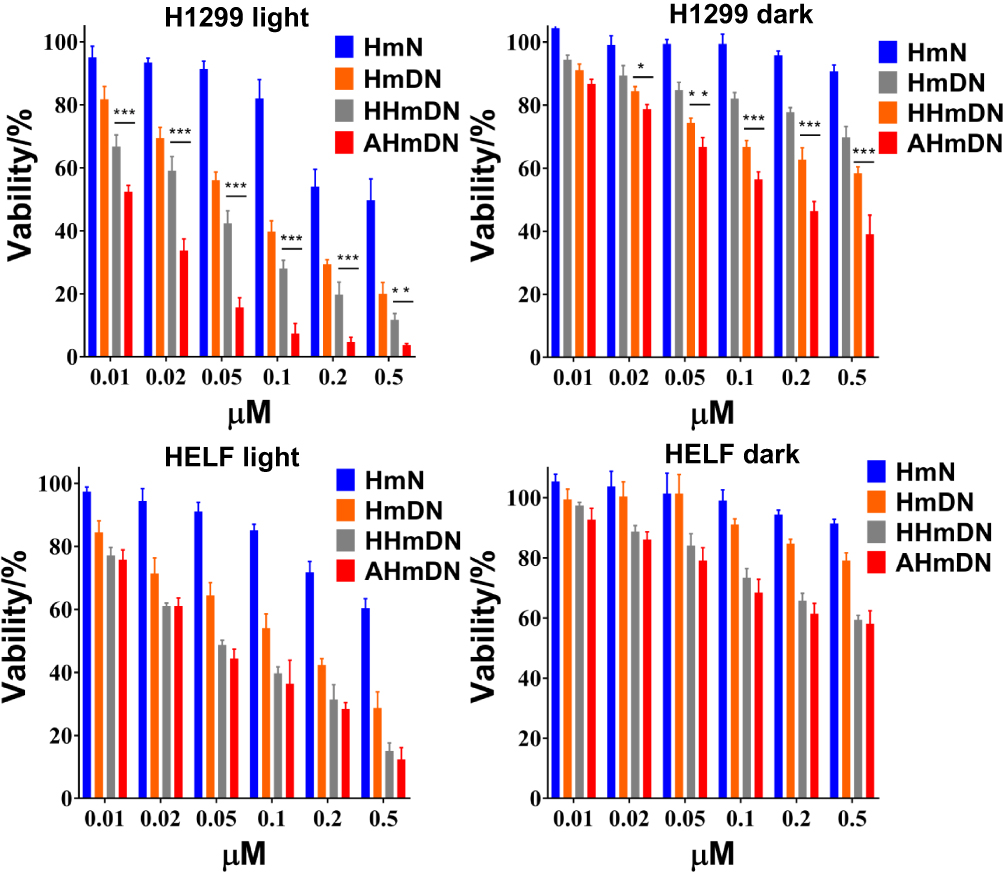 |
Figure 2 The cytotoxicity of HmN, HmDN, HHmDN, AHmDN in H1299 and HELF cells. Notes: H1299 and HELF cells were incubated with HmN, HmDN, HHmDN or AHmDN for 24hrs and cytotoxicity was detected by MTT method. Their dark toxicity illustrated the chemotherapy effect and the enhanced cytotoxicity with illumination (1.5 J/cm2) showed the PDT effect. No matter dark toxicity or phototoxicity, AHmDN had almost similar cytotoxicity with HHmDN in HELF cells while AHmDN had about twofold higher cytotoxicity than HHmDN in H1299 cells, demonstrating the tumor-targeting capability. ***P<0.001, **P<0.01, *P<0.05. |
Flow Cytometry
In order to determine the targeting ability of ATF, the fluorescence intensity of mPPZ was evaluated to determine the amount of nanoparticles ingested by H1299 or HELF cells. After the incubation with HmN, HmDN, AHmDN or HHmDN for 12hrs, H1299 or HELF cells were washed to remove unabsorbed nanoparticles and detected using flow cytometry. Figure 3A shows that there was little variation in fluorescence intensity of HmDN, HHmDN and AHmDN groups in HELF cells. However, the fluorescence intensity of AHmDN group in H1299 cells was higher than that of HmDN and HHmDN groups. The overexpression of uPAR receptor on H1299 cell surface than HELF cells may attribute to the higher uptake.
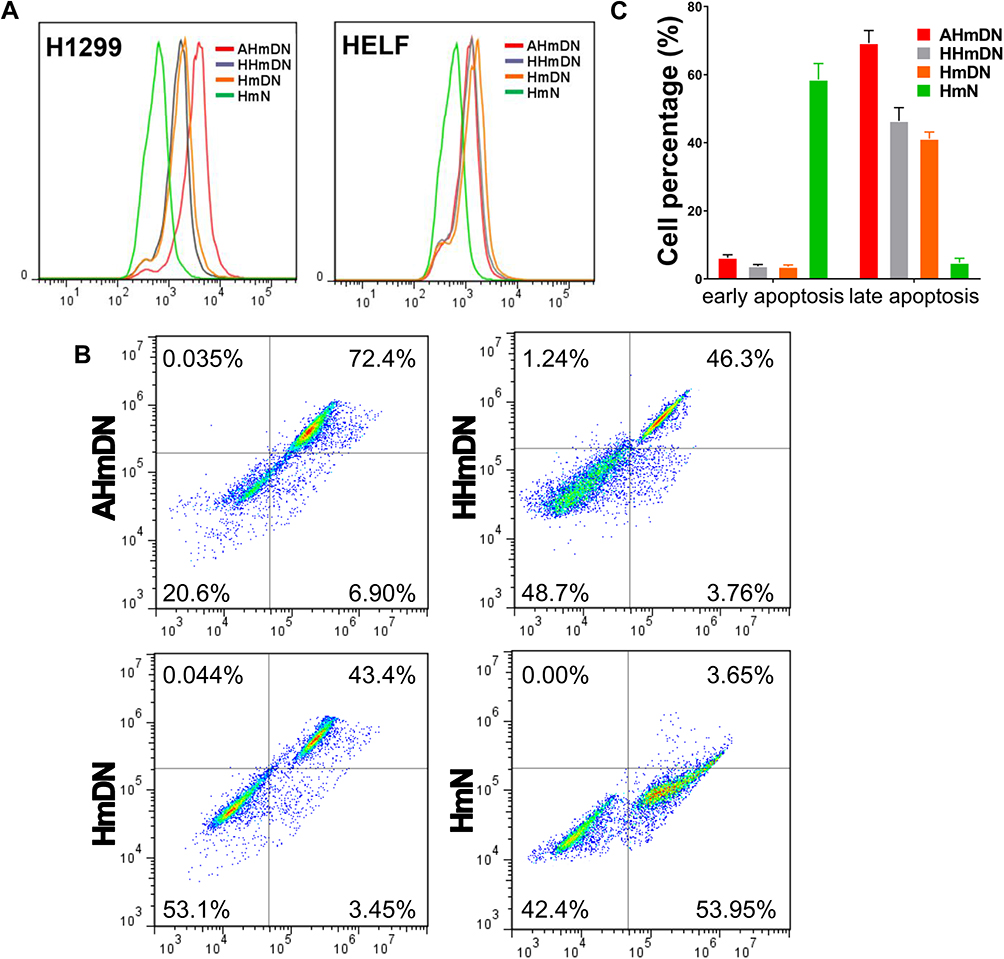 |
Figure 3 The cellular uptake and apoptosis analysis by flow cytometry. Notes: (A) The cellular uptake analysis by flow cytometry in H1299 and HELF cells after the incubation with HmN, HmDN, HHmDN, AHmDN (the final concentration of mPPZ 0.5μM) for 12hrs. In H1299 cells, stronger fluorescence was detected in AHmDN group which showed enhanced cellular uptake of AHmDN demonstrating the tumor-targeting effect. (B) Flow cytometric distribution of H1299 cells stained by FITC-labeled Annexin V and PI. H1299 cells were illuminated at a light fluence of 1.5 J/cm2 after the incubation with HmN, HmDN, HHmDN or AHmDN for 12hrs. After 12hrs, the H1299 cells were collected and analyzed by flow cytometry. (C) Quantifications of the cell population showed that HmDN, HHmDN and AHmDN groups had more necrotic or late apoptotic cells than early apoptotic cells while HmN group had more early apoptotic cells, which was likely due to a different cytotoxicity mechanism. |
After the incubation with HmN, HmDN, AHmDN or HHmDN for 12hrs, H1299 cells were illuminated by a LED light source at 680nm. Followed by apoptosis for another 12hrs, H1299 cells were stained with FITC-label Annexin V and PI for a flow cytometry analysis. High Annexin V and low PI staining were an indication of early apoptosis of cells, whereas strong staining of both Annexin V and PI indicated the cells were in the stage of late apoptosis or necrosis. Figure 3B shows that more H1299 cells in HmN group were in the state of early apoptosis, which also was demonstrated through the quantifications of the cell population (Figure 3C). However, AHmDN, HHmDN and HmDN groups had very little cells in early apoptosis accompanied by more cells in late apoptotic or necrosis. AHmDN, HHmDN and HmDN probably had different cell death mechanism compared with HmN due to the incorporation of chemotherapy drugs. Moreover, although there was almost the same early apoptosis cell proportion in HHmDN and HmDN groups, HHmDN group had a slightly higher distribution of cells in late apoptosis or necrosis than HmDN group. AHmDN group had more cells in early apoptosis and almost 1.5-fold more cells in late apoptosis or necrosis than HHmDN or HmDN group, which further validated the enhanced cytotoxicity of AHmDN.
Subcellular Localization
Could the DOX in HmDN, AHmDN and HHmDN enter into cell nucleus? The diffusion range of ROS generated by photosensitizers was limited to less than 0.02µm29 and the intracellular distribution of photosensitizers is key to their photodynamic activity. Thus, we imaged the H1299 cells to monitor the distribution of mPPZ and DOX in cells after the cells were incubated with HmN, HmDN, AHmDN or HHmDN for 12hrs at the concentration of mPPZ 0.5µM. The fluorescence of mPPZ (red) showed that HmDN, AHmDN and HHmDN were ingested into H1299 cells and mPPZ mainly distributed in the cytoplasm with almost no overlap at cell nucleus (blue fluorescence) (Figure 4). mPPZ in HmN group distributed in cytoplasm similarly (Figure S5). It was noteworthy that DOX molecules almost completely localized to the nucleus based on the analysis of intracellular distribution of fluorescence intensity (Figure 4). This DOX localization at nucleus is consistent with its widely accepted mechanism of intercalating with DNA, disrupting the replication and transcription processes, finally leading to cell death.30 The differential distribution of mPPZ and DOX suggested DOX may be released from nanoparticles.
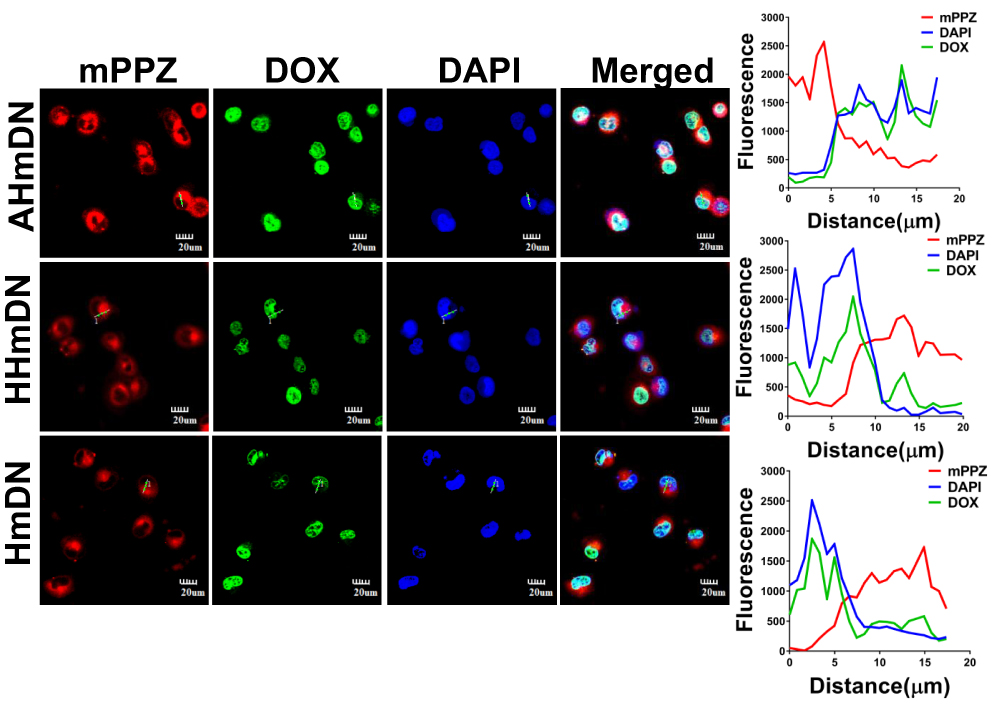 |
Figure 4 Cellular localization of HmDN, HHmDN and AHmDN in H1299 cells and the fluorescence intensity profile. Notes: After the incubation for 12hrs at the concentration of mPPZ 0.5μM, HmDN, HHmDN and AHmDN could be absorbed into H1299 cells. DOX was mainly distributed in nucleus with nearly identical fluorescence intensity profile suggesting DOX was separated from nanoparticles. While mPPZ was mainly distributed in cytoplasm, not in nucleus. |
Intracellular ROS Detection
The PDT effect for H1299 cells killing by AHmDN, HHmDN, HmDN and HmN was attributed to ROS. Therefore, intracellular ROS was evaluated through the DCF fluorescence converted by the oxidation of DCFH-DA. After absorbing AHmDN, HHmDN, HmDN or HmN, cells were incubated with DCFH-DA solution and then illuminated at a light fluence of 1.5 J/cm2. Cell images were collected by laser scanning confocal microscope. In Figure S6, cell nucleus localization was determined by the fluorescence of Hoechst 33342 (blue), and ROS generated from AHmDN, HHmDN, HmDN, HmN or mPPZ was determined by the fluorescence of DCF (green). All the H1299 cells absorbing AHmDN, HHmDN, HmDN or HmN showed obvious DCF fluorescence, while the cells treated with mPPZ had very weak fluorescence of DCF. These results demonstrated that HSA nanoparticles loading mPPZ by DIP method had higher ROS production efficiency than mPPZ molecules in the cells. This was because that mPPZ in HSA was disaggregated by DIP method and mPPZ in monomer form had a more efficient ROS production rate than that in aggregation form.
Tumor Targeting
An ideal drug delivery system should transport drugs to target organs. After injecting HmN, HmDN, AHmDN or HHmDN into H22 tumor-bearing mice as the dose of mPPZ at 0.2μmol/kg, the tumor targeting was determined by a 3D animal imaging system. All the nanoparticles were detected to accumulate gradually at the tumor site using normal tissues as control (Figure 5A). Quantitation results (Figure 5B) indicated that there was almost the same amount of mPPZ in HmDN and HmN groups after the injection for 7 days. However, HmDN group had more mPPZ at tumor site than HmN group after 7 days, which was consistent with the result of cell uptake. It was worth noting that HHmDN group had higher content of mPPZ than both HmDN and HmN groups at any point of time and this distinction was continued for 14 days. What is more, the mice images indicated that AHmDN group had stronger fluorescence intensity at tumor site than HHmDN group throughout the detection process and the amount of mPPZ in AHmDN group was 1.5 times more than that in HHmDN group at the 14th day (Figure 5B). Supplementary video of mice after the treatment with AhmDN (Video 1) and HHmDN (Video 2) for 14 days further demonstrated the higher content of mPPZ of AHmDN group than that of HHmDN group from multiple angles. This further validated the tumor targeting of AHmDN by modifying ATF-HSA on the surface. The percentage of the mPPZ at the tumor site in the whole body was kept increasing which was consistent with the results from Figure 5B (Figure 5C). Particularly on the 14th day, the percentage of the mPPZ at the tumor site in AHmDN group was risen to approximately 30%, and the high content was very beneficial for antitumor treatment.
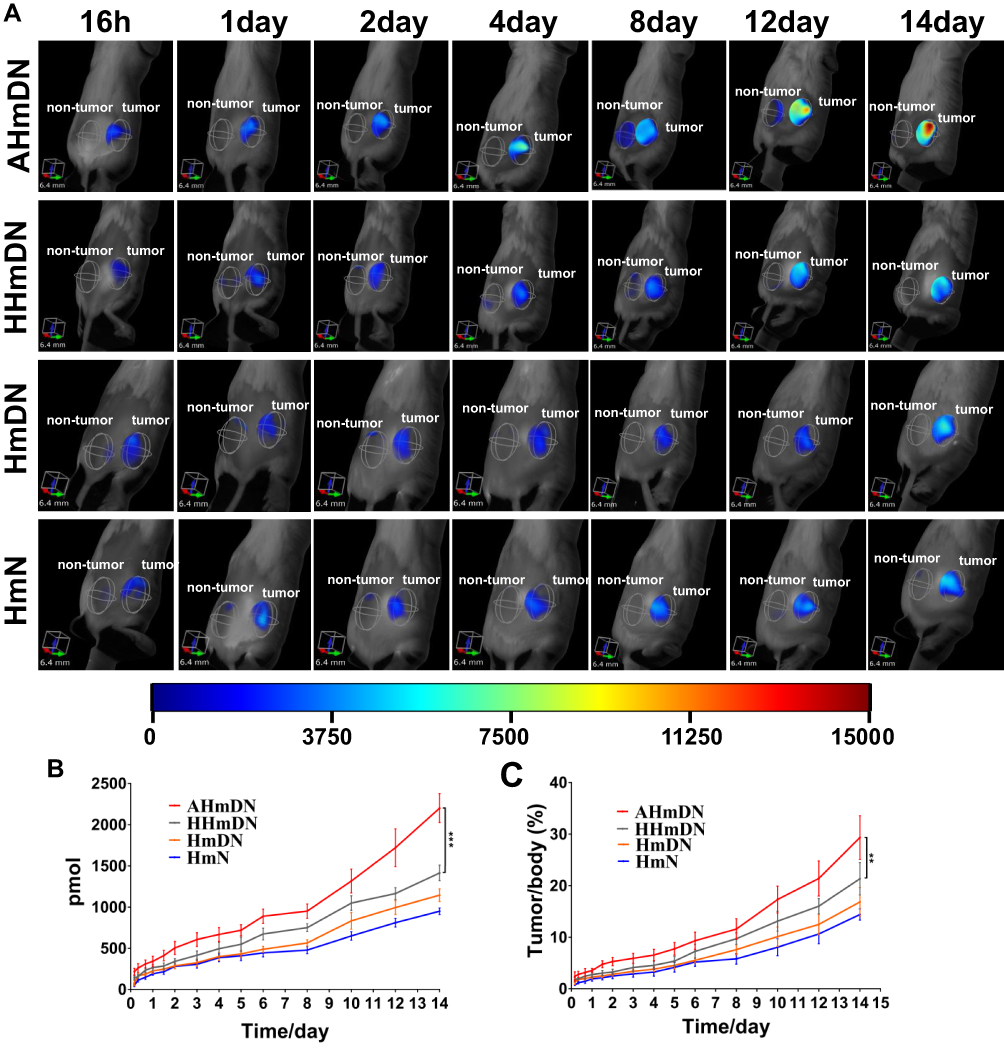 |
Figure 5 In vivo 3D fluorescent imaging and quantitative analysis of tumor-bearing mice injected with HmN, HmDN, HHmDN or AHmDN. Notes: (A) Upon the injection of mPPZ at the dose of 0.2 μmol/kg, all nanoparticles started to accumulate at the tumor site at 12hrs and the fluorescence at tumor site (the left ROI was normal tissues, the right ROI was tumor site) in every group was increased constantly until 14 days. (B) The mPPZ content at tumor site was gradually elevated during the whole detection period in every group. The mPPZ content in AHmDN group was 1.5 fold higher than HHmDN group at 14 days, which demonstrated an active targeting effect of AHmDN. HmN group had less mPPZ at tumor site than other groups which results were consistent with cell uptake. (C) The mPPZ content ratio of tumor site and the whole body. The proportion of mPPZ at tumor site was continuously increased. AHmDN group had the highest ratio and approximately 30% of all mPPZ in the body accumulated in tumor site at 14 days. ***P<0.001, **P<0.01. |
Antitumor Effect
HmN, HmDN, AHmDN or HHmDN was, respectively, injected into H22 tumor-bearing mice with equivalent tumor volume (50mm3) and weight (23g) at the dose of mPPZ 0.2μmol/kg to evaluate the antitumor effect. The tumor volume of mice given normal saline as control was grown continuously (Figure 6A). Through daily illumination, the trend of tumor growth with HmN group declined significantly, which further verified the PDT effect of mPPZ. HmDN group had much smaller tumor volume than HmN, which could be attributed to the combined effect of mPPZ and DOX. The slightly shrinked tumor volume in HHmDN group than HmDN group was probably caused by the enhanced targeting capability of HHmDN. Above all, AHmDN group had the lowest tumor growth rate (Figure 6A) and smallest tumor size (Figure 6C). The gap of tumor volume between AHmDN and HHmDN group was gradually enlarged after 2 days and there was 1.7 times difference at 7 days. The decreased tumor growth trend was as a result of the enhanced tumor targeting effect of AHmDN. After the treatment and measurement for 7 days, all the mice were killed and dissected to isolate the tumor tissue which was weighed to further verify the antitumor effect. The minimum tumor weight of AHmDN group was consistent with the result of tumor growth inhibition, reflecting strong antitumor activity (Figure 6B). The body weights of mice with treatment group were similar to the control group, demonstrating no apparent side effect to the mice (Figure S7). Furthermore, the survival rate of mice treated with AHmDN over 40 days was significantly enhanced than HmN, HmDN and HHmDN groups (Figure S8).
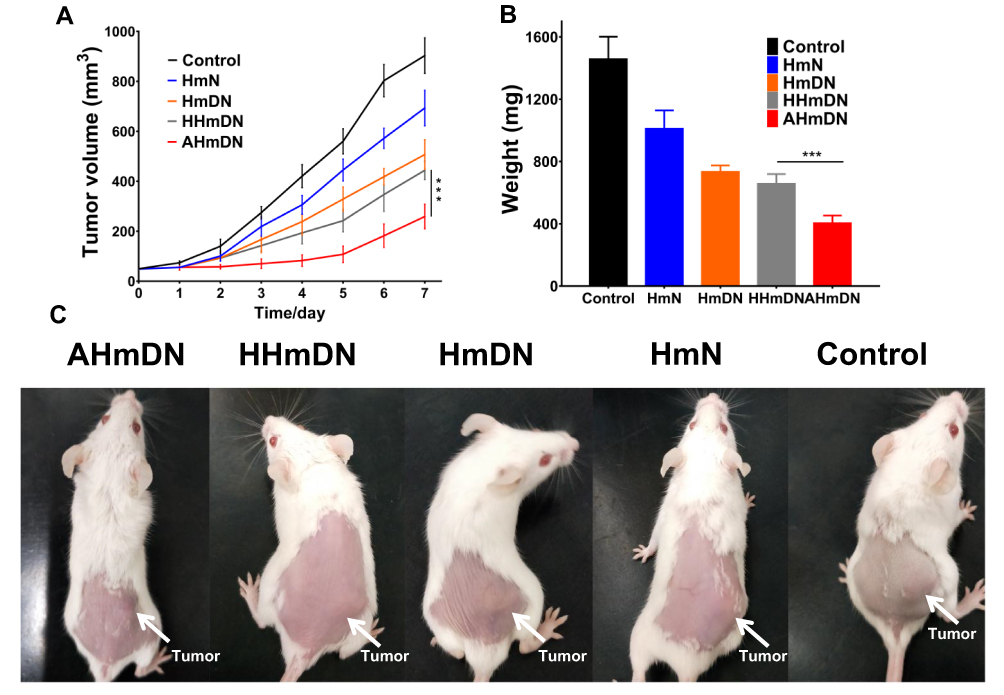 |
Figure 6 In vivo antitumor effect of HmN, HmDN, HHmDN and AHmDN. H22 tumor-bearing mice were injected with HmN, HmDN, HHmDN or AHmDN in PBS solution at the dose of mPPZ 0.2 μmol/kg. Notes: (A) The tumor size was recorded accompanied by daily illumination (50 J/cm2). Compared with control, all of them had antitumor effect to some extent and AHmDN group had the lowest tumor growth rate. (B) After the treatment for 7days, all the mice were executed and the weight of dissected tumors was recorded. AHmDN group had the lightest tumor than other groups which further indicated the enhanced antitumor effect. (C) Photographs of mice on the 7th day after the treatment with AhmDN, HHmDN, HmDN or HmN. ***P<0.001. |
Discussion
Over the last four decades, photodynamic therapy (PDT) has been proved to be effective in the treatment of cancers, including superficial bladder cancer, early and obstructive lung cancer, skin cancer, Barrett’s esophagus, head and neck cancers.31 In PDT, photosensitizers are accumulated at the tumor site and are illuminated with a light of specific wavelength to generate cytotoxic reactive oxygen species (ROS) to kill tumor cells. Compared with chemotherapy and radiation therapy, PDT has little systemic toxic effects on the biological systems and has minimal invasiveness.32 Photosensitizers are the key factor for PDT and high-efficiency photosensitizers can improve the effect of PDT. Phthalocyanines, as second-generation photosensitizers, are characterized with strong absorption at far-red wavelengths and high quantum yields of singlet oxygen generation.33 Closed shell metal ions Zn2+ make phthalocyanines longer lifetimes of triplet state and higher triplet yields.34 Therefore, zinc phthalocyanine (ZnPc) has great application potential and is widely studied for PDT.
Hydrophobic ZnPc can permeate cell membranes easier than hydrophilic ZnPc, and have enhanced therapeutic efficiency. However, the degree of aggregation between ZnPc in aqueous media is increased with their hydrophobicity.35 The ZnPc molecules’ tendency to aggregate greatly influences their spectroscopic, photophysical and electrochemical properties in terms of fluorescence quenching36 and lower singlet oxygen generation37 which most probably due to enhanced state dissipation without radiation and reduced lifetime of the excited state. Some surfactants, such as cremophor EL or tween 20, can make ZnPc disaggregated. But the use of surfactant is limited by its immunological side effects such as acute hypersensitivity and systemic immune reactions.38 Some solvents, such as dimethyl formamide, dimethyl sulfoxide, pyridine, coordinate to the central Zn2+ which inhibits the aggregation between ZnPc molecules.39 However, the aggregation is formed again once these solvents are diluted by aqueous solution. Therefore, limiting the aggregation of ZnPc is the key to develop high-efficiency photosensitizers.
HSA molecules had some hydrophobic pockets especially subdomains IIA and IIIA from X-ray structure analysis.40 These pockets could package hydrophobic photosensitizer mPPZ through hydrophobic interaction which could overcome the aggregation between mPPZ molecules. Compared with some surfactants leading phthalocyanine to non-aggregation by the interaction with micelle surface,41 HSA molecules, as a natural depolymerizing agent, had obvious advantages for its nontoxic and nonimmunogenic properties. Therefore, HSA was an ideal drug carrier for loading hydrophobic ZnPc molecules. However, after HSA was incubated with mPPZ (100μM) at different molar ratios (HSA:mPPZ was, respectively, 1:2, 1:1, 2:1, 4:1, 8:1, 20:1) for 12 hrs, there was still no significant improvement of monomer absorption peak of mPPZ (Figure S1B). Dilution-incubation-purification (DIP) was an excellent method for loading hydrophobic ZnPc molecules.26 Hydrophobic ZnPc molecules, just like mPPZ, had a stronger tendency of aggregation with high concentration and the resulting aggregation had a larger particle size even leading to precipitate which hindered the interaction of HSA and mPPZ. Therefore, maintaining low concentration (10μM) was very essential during the preparation process. After the incubation adequately for 12 hrs, purification was another crucial step to remove unloaded mPPZ. DEAE anion exchange resin was used to purify HSA:mPPZ. Both HSA:mPPZ and unloaded mPPZ in Tris-HCl buffer solution (50mM NaCl, pH 8.5) could be adsorbed to DEAE column. HSA:mPPZ was eluted with high-concentration salt solution (Tris-HCl buffer solution, 300mM NaCl, pH 8.5), while unloaded mPPZ was still attached to DEAE column. Thus, HSA:mPPZ was purified by this way.
Ethanol, as dehydrant, was used to agglomerate HSA molecules and their amino was crosslinked by glutaraldehyde to form stable nanoparticles. Except glutaraldehyde, mercaptoethanol was often used to crosslink HSA molecules by disrupting and recombining disulfide bonds of HSA. However, the transformation of disulfide bonds led to a great change of HSA structure. Because the loading capacity of HSA depended on its spatial structure, so mercaptoethanol was replaced by glutaraldehyde to crosslink HSA in order to prevent the release of mPPZ from HSA.
HSA was regarded as a chemical sponge which could bind many drugs. It had been reported that DOX could bind to HSA to form complex for improving the therapeutic effect of DOX.42 However, after HmN (containing HSA 30mg) and DOX were incubated for 4 hrs in 5mL PBS at the concentration of DOX 30μM, there was little DOX loading in HmN. Hence, an improved method was used to load DOX into HmN by increasing the density of HmN and DOX (500μL PBS, HSA 30mg, DOX 3mM). On the one hand, this increased the probability of interaction between DOX and HSA. On the other hand, DOX molecules in high concentration could generate aggregation42 which elevated hydrophobicity may increase the affinity for HSA. By this way, DOX was loaded into HmN and the stoichiometric ratio of HSA, mPPZ and DOX was about 1:0.8:5 (Figure S3).
Compared with healthy vessels in normal organs, tumors possessed leaky blood vessels and impaired lymphatic drainage, which allowed the selective access of nanoparticles to tumors, so-called enhanced permeability and retention (EPR) effect.43 HmDN could target tumor tissue by EPR effect as a passive targeting strategy. For improving tumor targeting effect of HmDN, ATF peptide (amino-terminal fragment of urokinase), strong targeting ability to urokinase-type plasminogen activator receptor (uPAR) overexpressed in many types of cancer cells and tumor tissues,23 was used to modify HmDN. However, traditional way of conjugating biomacromolecules through covalent linkage, such as ester bond and amido bond, may disrupt the spatial structure of ATF which greatly reduced the targeting efficiency. In this study, ATF-HSA, HSA molecule fused with ATF, was coupled to the surface of HmDN by the hydrophobic interaction between the HSA segment in ATF-HSA and HSA nanoparticles mediated by strong hydrophobic drug PTX. ATF still maintained its original target activity and may not be adhered to HSA nanoparticles by reason of the lack of hydrophobic domain for ATF.44 Therefore, AHmDN was successfully prepared using the simple and very effective method for coupling ATF to nanoparticles.
Flow cytometry analysis indicated that HmDN group had higher fluorescence intensity than HmN group (Figure 3A), which suggests more uptake in HmDN group. When the apoptosis occurred, apoptotic cells had some morphological variation including pyknosis, nuclear fragmentation and formation of apoptotic bodies. Whereas, cells presented necrotic features including the loss of cell membrane integrity in the late stages of apoptosis.45 Quantifications of the cell population showed cells of HmDN group in late apoptosis or necrosis were significantly more than HmN group (Figure 3C). The increased cell membrane permeability by reason of the loss of membrane integrity in HmDN group probably led to the enhanced uptake for nanoparticles.
Compared with healthy tissues, the abnormally wide fenestrations in the blood vessels allowed for the extravasation of materials with sizes up to several hundreds of nanometers in tumors. Together with the absence of lymphatic drainage, this brought to a relatively effective and selective accumulation of nanomedicines in tumors. The tumor accumulation of nanomedicines was mainly based on the EPR effect. Besides, the enhanced uptake of albumin-based nanoparticles in solid could be mediated by transcytosis initiated by binding of 60-kDa glycoprotein (gp60) receptor on the surface of endothelial cells in tumor vasculature as well as binding of SPARC (secreted protein, acidic and rich in cysteine), an extracellular matrix glycoprotein overexpressed in a variety of cancers.46 These may be the reasons for the tumor targeting of HmN, HmDN, HHmDN and AHmDN. Whereas uPAR receptor-mediated tumor active targeting was reported to contribute more than HSA-mediated EPR effect, which was probably the reason why AHmDN had the enhanced tumor targeting than others.22
All the prepared nanoparticles had a certain degree of anticancer effect. However, the content of mPPZ in mice with photodynamic therapy was significantly reduced than that without illumination (Figure S9). Especially in AHmDN group, there was about threefold difference for mPPZ content at tumor site of the mice between treatment group and non-treatment group (raised in dark room). Besides the reduced tumor size, this could also be due to the photodegradation of phthalocyanine photosensitizers under strong light exposure.47 This suggested a method for further improving the therapeutic effect by increasing the injection frequency of the nanoparticles.
Since the occurrence and evolution of tumors was a complicated process, the combined administration with synergistic effects of multiple functional species usually exerted improved the antitumor effect in clinical cancer therapy.48–51 DOX was a first-line chemotherapeutic agent for the treatment of a broad range of cancers through binding to topoisomerase enzyme II or directly intercalating with DNA to suppress the proliferation of tumor cells.52 Many studies reported that the combination of DOX and photosensitizers caused a synergistic cytotoxicity.53,54 Hence, many nanocarriers were used to deliver DOX and photosensitizers to tumor sites for improving antitumor effect, such as nanoparticles assembled by inorganic materials,55 polymeric micelles56 and liposomes.57 The covalent coupling of DOX or photosensitizers to the nanocarriers might affect their original mechanism of action. While simple mixing DOX and photosensitizers in nanocarriers might influence each other’s activities by intermolecular interactions such as electrostatic force, Van der Waals interaction, hydrogen bonds and especially Π-Π stacking. In this study, disaggregated ZnPc was first loaded in hydrophobic pockets of HSA and then DOX was encapsulated in HSA nanoparticles. This ordered and separated loading in nanocarriers was positively beneficial for the therapeutic effect.
Conclusions
In summary, hydrophobic phthalocyanine zinc (mPPZ) was disaggregated by the interaction with HSA to generate complex HSA:mPPZ which fluorescence intensity was increased 10 fold than mPPZ in PBS. HSA:mPPZ was further crosslinked to nanoparticles (HmN) simultaneously loading DOX (HmDN). HSA or ATF-HSA was assembled to the surface of HmDN using PTX as coupling agent to form two nanoparticles HHmDN or AHmDN. All the four nanoparticles had well stability and AHmDN had higher cytotoxicity than others. Flow cytometry analysis showed tumor cell targeting property of AHmDN and more cells in late apoptotic or necrosis induced by AHmDN. In vitro cell imaging detection indicated that DOX could enter into cell nucleus after the uptake of these nanoparticles while mPPZ in the cytoplasm. These nanoparticles had higher ROS production efficiency than mPPZ in the cells. In tumor-bearing mice, all the nanoparticles could be accumulated at tumor site continuously over 14 days. Most of all, AHmDN was demonstrated to have enhanced tumor targeting ability and antitumor effect than others. This drug delivery system could be used for carrying other hydrophobic ZnPc and chemotherapy drugs to improve the therapeutic effect of tumors.
Acknowledgments
Our research work is financially supported by grants from National Key R&D Program of China (2017YFE0103200), Natural Science Foundation of China (31370737, 31400637, 31570745, 31670739) and Natural Science Foundation of Shandong Province (ZR201808120006).
Disclosure
The authors report no conflicts of interest in this work.
References
1. Bray F, Ferlay J, Soerjomataram I, Siegel RL, Torre LA, Jemal A. Global cancer statistics 2018: GLOBOCAN estimates of incidence and mortality worldwide for 36 cancers in 185 countries. CA Cancer J Clin. 2018;68(6):394–424. doi:10.3322/caac.21492
2. Pérez-Herrero E, Fernández-Medarde A. Advanced targeted therapies in cancer: drug nanocarriers, the future of chemotherapy. Eur J Pharm Biopharm. 2015;93:52–79. doi:10.1016/j.ejpb.2015.03.018
3. Yang K, Feng L, Liu Z. Stimuli responsive drug delivery systems based on nano-graphene for cancer therapy. Adv Drug Deliv Rev. 2016;105:228–241. doi:10.1016/j.addr.2016.05.015
4. Di Corato R, Béalle G, Kolosnjaj-Tabi J, et al. Combining magnetic hyperthermia and photodynamic therapy for tumor ablation with photoresponsive magnetic liposomes. ACS Nano. 2015;9(3):2904–2916. doi:10.1021/nn506949t
5. Chen H, Zhang X, Dai S, et al. Multifunctional gold nanostar conjugates for tumor imaging and combined photothermal and chemo-therapy. Theranostics. 2013;3(9):633–649. doi:10.7150/thno.6630
6. Liu T, Wang C, Cui W, et al. Combined photothermal and photodynamic therapy delivered by PEGylated MoS2 nanosheets. Nanoscale. 2014;6(19):11219–11225. doi:10.1039/C4NR03753G
7. Zha Z, Zhang S, Deng Z, Li Y, Li C, Dai Z. Enzyme-responsive copper sulphide nanoparticles for combined photoacoustic imaging, tumor-selective chemotherapy and photothermal therapy. Chem Commun. 2013;49(33):3455–3457. doi:10.1039/c3cc40608c
8. Devita VT
9. Wang B-K, Yu X-F, Wang J-H, et al. Gold-nanorods-siRNA nanoplex for improved photothermal therapy by gene silencing. Biomaterials. 2016;78:27–39. doi:10.1016/j.biomaterials.2015.11.025
10. Wan X, Min Y, Bludau H, et al. Drug combination synergy in worm-like polymeric micelles improves treatment outcome for small cell and non-small cell lung cancer. ACS Nano. 2018;12(3):2426–2439. doi:10.1021/acsnano.7b07878
11. Shih Y-H, Peng C-L, Chiang P-F, Lin W-J, Luo T-Y, Shieh M-J. Therapeutic and scintigraphic applications of polymeric micelles: combination of chemotherapy and radiotherapy in hepatocellular carcinoma. Int J Nanomedicine. 2015;10:7443–7454. doi:10.2147/IJN
12. Zhang W, Shen J, Su H, et al. Co-delivery of cisplatin prodrug and chlorin e6 by mesoporous silica nanoparticles for chemo-photodynamic combination therapy to combat drug resistance. ACS Appl Mater Interfaces. 2016;8(21):13332–13340. doi:10.1021/acsami.6b03881
13. Meng H, Mai WX, Zhang H, et al. Codelivery of an optimal drug/siRNA combination using mesoporous silica nanoparticles to overcome drug resistance in breast cancer in vitro and in vivo. ACS Nano. 2013;7(2):994–1005. doi:10.1021/nn3044066
14. Zhao X, Chen Z, Zhao H, Zhang D, Tao L, Lan M. Multifunctional magnetic nanoparticles for simultaneous cancer near-infrared imaging and targeting photodynamic therapy. RSC Adv. 2014;4(107):62153–62159. doi:10.1039/C4RA10801A
15. Gobbo OL, Sjaastad K, Radomski MW, Volkov Y, Prina-Mello A. Magnetic nanoparticles in cancer theranostics. Theranostics. 2015;5(11):1249–1263. doi:10.7150/thno.11544
16. Bern M, Sand KMK, Nilsen J, Sandlie I, Andersen JT. The role of albumin receptors in regulation of albumin homeostasis: implications for drug delivery. J Controlled Release. 2015;211:144–162. doi:10.1016/j.jconrel.2015.06.006
17. Tan YL, Ho HK. Navigating albumin-based nanoparticles through various drug delivery routes. Drug Discov Today. 2018;23(5):1108–1114. doi:10.1016/j.drudis.2018.01.051
18. Ghuman J, Zunszain PA, Petitpas I, Bhattacharya AA, Otagiri M, Curry S. Structural basis of the drug-binding specificity of human serum albumin. J Mol Biol. 2005;353(1):38–52. doi:10.1016/j.jmb.2005.07.075
19. Hu Y-J, Ou-Yang Y, Dai C-M, Liu Y, Xiao X-H. Site-selective binding of human serum albumin by palmatine: spectroscopic approach. Biomacromolecules. 2009;11(1):106–112. doi:10.1021/bm900961e
20. Elsadek B, Kratz F. Impact of albumin on drug delivery – new applications on the horizon. J Controlled Release. 2012;157(1):4–28. doi:10.1016/j.jconrel.2011.09.069
21. Kinoshita R, Ishima Y, Chuang VTG, et al. Improved anticancer effects of albumin-bound paclitaxel nanoparticle via augmentation of EPR effect and albumin-protein interactions using S-nitrosated human serum albumin dimer. Biomaterials. 2017;140:162–169. doi:10.1016/j.biomaterials.2017.06.021
22. Li R, Zheng K, Yuan C, Chen Z, Huang M. Be active or not: the relative contribution of active and passive tumor targeting of nanomaterials. Nanotheranostics. 2017;1(4):346. doi:10.7150/ntno.19380
23. Yang L, Sajja HK, Cao Z, et al. uPAR-targeted optical imaging contrasts as theranostic agents for tumor margin detection. Theranostics. 2014;4(1):106. doi:10.7150/thno.7409
24. Huang J, Zhong X, Wang L, Yang L, Mao H. Improving the magnetic resonance imaging contrast and detection methods with engineered magnetic nanoparticles. Theranostics. 2012;2(1):86–102. doi:10.7150/thno.4006
25. Roncucci G, Fantetti L, De Filippis MP, Dei D, Jori G Substituted metal-phthalocyanines, their preparation and the use thereof. In: Google Patents; 2006.
26. Li R, Zheng K, Hu P, et al. A novel tumor targeting drug carrier for optical imaging and therapy. Theranostics. 2014;4(6):642. doi:10.7150/thno.8527
27. Marupudi NI, Han JE, Li KW, Renard VM, Tyler BM, Brem H. Paclitaxel: a review of adverse toxicities and novel delivery strategies. Expert Opin Drug Saf. 2007;6(5):609–621. doi:10.1517/14740338.6.5.609
28. Abi-Habib RJ, Singh R, Liu S, Bugge TH, Leppla SH, Frankel AE. A urokinase-activated recombinant anthrax toxin is selectively cytotoxic to many human tumor cell types. Mol Cancer Ther. 2006;5(10):2556–2562. doi:10.1158/1535-7163.MCT-06-0315
29. Thorn CF, Oshiro C, Marsh S, et al. Doxorubicin pathways: pharmacodynamics and adverse effects. Pharmacogenet Genomics. 2011;21(7):440. doi:10.1097/FPC.0b013e32833ffb56
30. Banfi S, Caruso E, Buccafurni L, Ravizza R, Gariboldi M, Monti E. Zinc phthalocyanines-mediated photodynamic therapy induces cell death in adenocarcinoma cells. J Organomet Chem. 2007;692(6):1269–1276. doi:10.1016/j.jorganchem.2006.11.028
31. Lucky SS, Soo KC, Zhang Y. Nanoparticles in photodynamic therapy. Chem Rev. 2015;115(4):1990–2042. doi:10.1021/cr5004198
32. Dolmans DE, Fukumura D, Jain RK. Photodynamic therapy for cancer. Nature Rev Cancer. 2003;3(5):380. doi:10.1038/nrc1071
33. Mantareva V, Kussovski V, Angelov I, et al. Photodynamic activity of water-soluble phthalocyanine zinc (II) complexes against pathogenic microorganisms. Bioorg Med Chem. 2007;15(14):4829–4835. doi:10.1016/j.bmc.2007.04.069
34. Alberto ME, De Simone BC, Mazzone G, Sicilia E, Russo N. The heavy atom effect on Zn (II) phthalocyanine derivatives: a theoretical exploration of the photophysical properties. Phys Chem Chem Phys. 2015;17(36):23595–23601. doi:10.1039/C5CP03833B
35. Galstyan A, Riehemann K, Schäfers M, Faust A. A combined experimental and computational study of the substituent effect on the photodynamic efficacy of amphiphilic Zn (II) phthalocyanines. J Mater Chem B. 2016;4(34):5683–5691. doi:10.1039/C6TB01341D
36. Li X, Sinks LE, Rybtchinski B, Wasielewski MR. Ultrafast aggregate-to-aggregate energy transfer within self-assembled light-harvesting columns of zinc phthalocyanine tetrakis (perylenediimide). J Am Chem Soc. 2004;126(35):10810–10811. doi:10.1021/ja047176b
37. Kuznetsova NA, Gretsova NS, Derkacheva VM, Kaliya OL, Lukyanets EA. Sulfonated phthalocyanines: aggregation and singlet oxygen quantum yield in aqueous solutions. J Porphyr Phthalocyanines. 2003;7(03):147–154. doi:10.1142/S1088424603000203
38. Weiszhár Z, Czúcz J, Révész C, Rosivall L, Szebeni J, Rozsnyay Z. Complement activation by polyethoxylated pharmaceutical surfactants: cremophor-EL, tween-80 and tween-20. Eur J Pharm Sci. 2012;45(4):492–498. doi:10.1016/j.ejps.2011.09.016
39. Ogunsipe A, Maree D, Nyokong T. Solvent effects on the photochemical and fluorescence properties of zinc phthalocyanine derivatives. J Mol Struct. 2003;650(1–3):131–140. doi:10.1016/S0022-2860(03)00155-8
40. Bijelic A, Theiner S, Keppler BK, Rompel A. X-ray structure analysis of indazolium trans-[tetrachlorobis (1 H-indazole) ruthenate (III)](KP1019) bound to human serum albumin reveals two ruthenium binding sites and provides insights into the drug binding mechanism. J Med Chem. 2016;59(12):5894–5903. doi:10.1021/acs.jmedchem.6b00600
41. X-y L, He X, Ng AC, Wu C, Ng DK. Influence of surfactants on the aggregation behavior of water-soluble dendritic phthalocyanines. Macromolecules. 2000;33(6):2119–2123. doi:10.1021/ma9919110
42. Zheng K, Li R, Zhou X, et al. Dual actions of albumin packaging and tumor targeting enhance the antitumor efficacy and reduce the cardiotoxicity of doxorubicin in vivo. Int J Nanomed. 2015;10:5327.
43. Hickey JW, Santos JL, Williford J-M, Mao H-Q. Control of polymeric nanoparticle size to improve therapeutic delivery. J Controlled Release. 2015;219:536–547. doi:10.1016/j.jconrel.2015.10.006
44. Huai Q, Mazar AP, Kuo A, et al. Structure of human urokinase plasminogen activator in complex with its receptor. Science. 2006;311(5761):656–659. doi:10.1126/science.1121143
45. Eom Y-W, Kim MA, Park SS, et al. Two distinct modes of cell death induced by doxorubicin: apoptosis and cell death through mitotic catastrophe accompanied by senescence-like phenotype. Oncogene. 2005;24(30):4765. doi:10.1038/sj.onc.1208627
46. Kratz F. Albumin as a drug carrier: design of prodrugs, drug conjugates and nanoparticles. J Controlled Release. 2008;132(3):171–183. doi:10.1016/j.jconrel.2008.05.010
47. Nyokong T, Antunes E. Photochemical and photophysical properties of metallophthalocyanines. In: Karl M Kadish, Kevin M Smith, Roger Guilard, editors. Handbook of Porphyrin Science (Volume 7) with Applications to Chemistry, Physics, Materials Science, Engineering, Biology and Medicine. World Scientific; 2010:247–357.
48. Lopez JS, Banerji U. Combine and conquer: challenges for targeted therapy combinations in early phase trials. Nature Rev Clin Oncol. 2017;14(1):57. doi:10.1038/nrclinonc.2016.96
49. Fan W, Yung B, Huang P, et al. Nanotechnology for multimodal synergistic cancer therapy. Chem Rev. 2017;117(22):13566–13638. doi:10.1021/acs.chemrev.7b00258
50. Chen Q, Wang X, Wang C, et al. Drug-induced self-assembly of modified albumins as nano-theranostics for tumor-targeted combination therapy. ACS Nano. 2015;9(5):5223–5233. doi:10.1021/acsnano.5b00640
51. Chen Q, Feng L, Liu J, et al. Intelligent albumin–mnO2 nanoparticles as pH-/H2O2-responsive dissociable nanocarriers to modulate tumor hypoxia for effective combination therapy. Adv Mater. 2016;28(33):7129–7136. doi:10.1002/adma.201601902
52. Zhang P, Li J, Ghazwani M, et al. Effective co-delivery of doxorubicin and dasatinib using a PEG-Fmoc nanocarrier for combination cancer chemotherapy. Biomaterials. 2015;67:104–114. doi:10.1016/j.biomaterials.2015.07.027
53. Hu DR, Chen LJ, Qu Y, et al. Oxygen-generating hybrid polymeric nanoparticles with encapsulated doxorubicin and chlorin e6 for trimodal imaging-guided combined chemo-photodynamic therapy. Theranostics. 2018;8(6):1558. doi:10.7150/thno.22989
54. Liao JF, Li WT, Peng JR, et al. Combined cancer photothermal-chemotherapy based on doxorubicin/gold nanorod-loaded polymersomes. Theranostics. 2015;5(4):345. doi:10.7150/thno.10731
55. Zeng L, Pan Y, Tian Y, et al. Doxorubicin-loaded NaYF4: yb/Tm–tiO2 inorganic photosensitizers for NIR-triggered photodynamic therapy and enhanced chemotherapy in drug-resistant breast cancers. Biomaterials. 2015;57:93–106. doi:10.1016/j.biomaterials.2015.04.006
56. Gao D, Lo PC. Polymeric micelles encapsulating pH-responsive doxorubicin prodrug and glutathione-activated zinc (II) phthalocyanine for combined chemotherapy and photodynamic therapy. J Controlled Release. 2018;282:46–61. doi:10.1016/j.jconrel.2018.04.030
57. Hashemi M, Omidi M, Muralidharan B, et al. Layer-by-layer assembly of graphene oxide on thermosensitive liposomes for photo-chemotherapy. Acta Biomater. 2018;65:376–392. doi:10.1016/j.actbio.2017.10.040
 © 2020 The Author(s). This work is published and licensed by Dove Medical Press Limited. The full terms of this license are available at https://www.dovepress.com/terms.php and incorporate the Creative Commons Attribution - Non Commercial (unported, v3.0) License.
By accessing the work you hereby accept the Terms. Non-commercial uses of the work are permitted without any further permission from Dove Medical Press Limited, provided the work is properly attributed. For permission for commercial use of this work, please see paragraphs 4.2 and 5 of our Terms.
© 2020 The Author(s). This work is published and licensed by Dove Medical Press Limited. The full terms of this license are available at https://www.dovepress.com/terms.php and incorporate the Creative Commons Attribution - Non Commercial (unported, v3.0) License.
By accessing the work you hereby accept the Terms. Non-commercial uses of the work are permitted without any further permission from Dove Medical Press Limited, provided the work is properly attributed. For permission for commercial use of this work, please see paragraphs 4.2 and 5 of our Terms.