")
Back to Journals » International Journal of Nanomedicine » Volume 15
TiO2 Nanotubes Alleviate Diabetes-Induced Osteogenetic Inhibition
Authors Yang J, Zhang H, Chan SM, Li R, Wu Y, Cai M, Wang A, Wang Y
Received 1 November 2019
Accepted for publication 8 April 2020
Published 18 May 2020 Volume 2020:15 Pages 3523—3537
DOI https://doi.org/10.2147/IJN.S237008
Checked for plagiarism Yes
Review by Single anonymous peer review
Peer reviewer comments 3
Editor who approved publication: Dr Mian Wang
Jinghong Yang,1 Hui Zhang,1 Sin Man Chan,1 Ruoqi Li,1 Yu Wu,2 Min Cai,1 Anxun Wang,2 Yan Wang1
1Department of Prosthodontics, Hospital of Stomatology, Guanghua School of Stomatology, Guangdong Key Laboratory of Stomatology, Sun Yat-sen University, Guangzhou, People’s Republic of China; 2Department of Oral and Maxillofacial Surgery, The First Affiliated Hospital of Sun Yat-sen University, Guangzhou, People’s Republic of China
Correspondence: Yan Wang
Hospital of Stomatology, Guanghua School of Stomatology, Guangdong Key Laboratory of Stomatology, Sun Yat-sen University, Guangzhou, People’s Republic of China
Tel +86-20-83802805
Email [email protected]
Anxun Wang
Department of Oral and Maxillofacial Surgery, The First Affiliated Hospital, Sun Yat-sen University, Guangzhou, People’s Republic of China
Tel +86-20-87608414
Email [email protected]
Background: Patients with diabetes mellitus (DM) have a higher failure rate of dental implant treatments. However, whether titanium (Ti) implants with TiO2 nanotubes (TNT) surface can retain their biocompatibility and osteogenetic ability under DM conditions has not been investigated; in addition, their behavior in DM conditions is not well characterized.
Materials and Methods: Pure Ti discs were surface treated into the polishing (mechanically polished, MP), sandblasted and acid-etched (SLA), and TNT groups. Scanning electron microscopy was used to examine the surface morphology. The cell adhesion and proliferation ability on different modified Ti surfaces at various glucose concentrations (5.5, 11, 16.5, and 22 mM) was detected by the CCK-8 assay. The osteogenetic ability on different modified Ti surfaces under high-glucose conditions was evaluated by alkaline phosphatase (ALP), osteopontin (OPN) immunofluorescence, Western blot, and Alizarin Red staining in vitro. Detection of cell apoptosis and intracellular reactive oxygen species (ROS) was undertaken both before and after N-acetylcysteine (NAC) treatment to assess the oxidative stress associated with different modified Ti surfaces under high-glucose conditions. An in vivo study was conducted in DM rats with different modified Ti femoral implants. The osteogenetic ability of different modified Ti implants in DM rats was assessed using a micro-CT scan.
Results: High-glucose conditions inhibited cell adhesion, proliferation, and osteogenetic ability of different modified Ti surfaces. High-glucose conditions induced higher apoptosis rate and intracellular ROS level on different modified Ti surfaces; these effects were alleviated by NAC. Compared with the SLA surface, the TNT surface alleviated the osteogenetic inhibition induced by high-glucose states by reversing the overproduction of ROS in vitro. In the in vivo experiment, micro-CT scan analysis further confirmed the best osteogenetic ability of TNT surface in rats with DM.
Conclusion: TNT surface modification alleviates osteogenetic inhibition induced by DM. It may provide a more favorable Ti implant surface for patients with DM.
Keywords: TiO2 nanotubes, diabetes mellitus, reactive oxygen species, titanium implant, surface modification
Introduction
In the past two decades, dental implants have become the treatment of choice for the restoration of missing teeth. The favorable characteristics of titanium (Ti) implants, such as outstanding mechanical properties, high corrosion resistance, and favorable osseointegration characteristics, have contributed to the successful application of these implants.1,2 However, treatment outcomes of Ti implants are affected by certain pathological conditions, including diabetes mellitus (DM), aging, cardiovascular disorders, rheumatological diseases, and hepatitis.3–5 DM is a highly prevalent chronic disorder and a major threat to human health. According to the International Diabetes Federation, an estimated 415 million people in the age range of 20 to 79 years were living with DM in 2015; the number is projected to increase to approximately 642 million by 2040.6 The overproduction of reactive oxygen species (ROS) in diabetic patients increases the incidence of peri-implantitis and delayed bone healing, leading to a higher implant failure rate.7–9 Patients with DM demonstrated a significantly lower Ti-implantation survival rate, compared with the non-DM population (89.8% [p < 0.05] and 94.6% [p < 0.05], respectively).10,11 However, the mechanism underlying this poorer Ti implant survival in patients with DM has not been identified. Therefore, modifications of the Ti implant surface to improve osseointegration and implant success rate in patients with DM is a key imperative.
Sandblasting and acid etching are the most popular surface-modification techniques used for commercial Ti implants. The micro-roughened topography formed by these techniques increases the surface area and promotes cell adhesion; however, this also affects the mechanical properties by creating cracks nucleation and compromises the proliferation of osteoblasts.12,13 In recent years, TiO2 nanotubes (TNT) prepared by the anodic oxidation technique have attracted much attention because these mimic the fundamental nanoscale structure of the bone and demonstrate superior biocompatibility and osseointegration abilities.1,14 Several studies have shown that TNT-modified surfaces show improved cell adhesion and proliferation abilities, alkaline phosphatase (ALP) activity, and bone mineralization.1,13,15,16 In our previous in vitro and in vivo experiments conducted under normal physical conditions, we found that the TNT-modified surface had better hydrophilicity and protein adsorption ability; in addition, these were found superior to sandblasted and acid-etched (SLA)-modified surfaces with respect to the adhesion and proliferation of osteoblasts as well as osteogenesis.13,17 However, whether this nano-surface has the same positive effect or how it behaves in pathological conditions has not been investigated.
In the present study, we evaluated the osteogenetic effect of TNT in the diabetic states and explored its underlying mechanism. We assessed the cell adhesion, proliferation, osteogenetic ability, and oxidative stress level on the nanoscale TNT surface against that on the microscale SLA surface under different glucose levels in vitro; in addition, we studied the osteogenetic ability in a rat model of DM in vivo.
Materials and Methods
Fabrication and Surface Characterization of Different Modified Ti Surfaces
We fabricated Ti discs (dimensions: 10.0 × 10.0 × 0.3 mm3 or 20.0 × 20.0 × 0.3 mm3 for 48- or 12-well plates) from commercially pure Ti foil (Baoji Titanium Industry, China). These discs were randomly divided into 3 groups – mechanically polished (MP group), sandblasted and acid-etched (SLA group), and anodic oxidized TiO2 nanotubes (TNT group) – by their treatment methods, as described previously.13 In brief, MP surfaces were successively polished with #400 to #1500 SiC sandpaper. SLA surfaces were prepared by blasting silicon dioxide particles onto MP surfaces, and then acid-etching using 10% HCl:10% H2SO4 (1:1, v/v) at 60 °C for 30 min. TNT surfaces were fabricated by anodic oxidation method which was performed in anodizing solution containing 0.15 M NH4F and 0.5 M (NH4)2SO4 at 20 V for 30 min. The surface topography of the Ti specimen was examined under a scanning electron microscope (LEO 1530VP FESEM, Zeiss, Germany).
The pure cylinder-shaped pure Ti implants (Foshan Anchi Biotechnology industry, Foshan, China) with a diameter and length of 2 and 4 mm, respectively, were subjected to the same modification method as in our previous study.13
Cell Culture
A mouse calvarial pre-osteoblastic cell line, MC3T3-E1 (Shanghai Chinese Academy of Science, Shanghai, China), was cultured in complete medium (DMEM containing 10% fetal bovine serum [FBS; Gibco] and 1% penicillin and streptomycin) in a humidified atmosphere of 5% CO2 at 37°C. The medium was changed every 2 or 3 days. Once the cells reached 85% confluence, these were digested using 0.25% trypsin-EDTA solution (Gibco).
Cell Adhesion and Proliferation Abilities Detected by CCK-8 Assay
To simulate DM conditions in vitro, we used incremental glucose concentrations to carry out cell adhesion and proliferation experiments on different modified Ti surfaces. We used the Cell Counting Kit-8 (CCK-8) assay (Dojindo, Kumamoto, Japan) to determine the cellular adhesion and proliferation abilities on different modified Ti surfaces. Briefly, cells were cultured in complete medium with the normal human blood glucose concentration (5.5 mM) or increasing glucose concentrations (11, 16.5, and 22 mM) on the 3 types of Ti surfaces. Cells cultured at 1 and 3 hours (adhesion ability) or for days 1, 3, and 5 (proliferation ability) were subjected to the CCK-8 assay according to the manufacturer’s instructions.
Evaluation of Osteogenetic Ability on Different Modified Ti Surfaces in vitro
To evaluate the osteogenetic ability of MC3T3-E1 on different modified Ti surfaces under high-glucose states, we conducted immunofluorescent staining assays of ALP and osteopontin (OPN), as previously described.18 Briefly, cells were seeded on the substrates and cultured in mineralizing medium (complete medium supplemented with 0.1 μM dexamethasone, 50 μg/mL ascorbic acid, and 10 mM β-glycerophosphate) at glucose concentrations of 5.5 or 22 mM on the different modified Ti surfaces. After culture for 7 (ALP) or 14 (OPN) days, cells were fixed with 4% paraformaldehyde, treated with 0.1% Triton for 20 min, and sealed with 5% bovine serum albumin (BSA) for 1 h. Thereafter, the cells were incubated with anti-ALP (1:100, Abcam, UK) or anti-OPN (1:200, Abcam, UK) at 4°C for 16 h. Then, the cells were incubated with the green fluorescent second antibody (1:200, Abcam, UK) in the darkroom for 1 h, and cell nuclei was stained with DAPI in the darkroom for 15 min. Fluorescence intensity was observed by confocal scanning laser microscopy (LSM700, Zeiss, Germany) and analyzed by Image J (V2.1.4.7, National Institutes of Health, USA).
In addition, Western blot analyses of ALP and OPN were carried out after osteogenic induction for 7 days. MC3T3-E1 cells were collected through digestion and centrifugation. After washing with PBS at 4°C, each group was added 50 μg RIPA lysis buffer (CWBIO, China) containing 50 mM Tris, 150 mM NaCl, 1% Triton X-100, 1% sodium deoxycholate and 0.1% SDS, reacting on ice for 30 min. The lysate was centrifugated and the supernatant was collected. Protein extracts were separated by SDS-PAGE, transferred to PVDF membrane, and then probed with 1:1000 rabbit anti-ALP and 1:1000 rabbit anti-OPN antibodies (Abcam, UK). After overnight incubation at 4°C with shaking, 1:10,000 goat anti-rabbit HRP-conjugated IgG (Emarbio Science &Technology Company, China) was added for another 1 h incubation. Finally, proteins were displayed with ECL Plus Detection Kits (Boster, China).
Moreover, we evaluated the osteogenetic ability of MC3T3-E1 by Alizarin Red staining. Briefly, after incubation for 14 and 21 days, cells were fixed with 4% paraformaldehyde, stained with the Alizarin Red solution (Cyagens), and images obtained using a digital microscope (M205A, Leica, Germany). Then, we dissolved the Alizarin Red stain on the specimens with 10% cetyl pyridinium chloride (Sigma) and measured absorbance at 562 nm for semiquantitative analysis.
Mitochondrial Membrane Potential and Cell Apoptosis Detection
To evaluate the early apoptosis of MC3T3-E1, we measured the mitochondrial membrane potential by the JC-1 probe. Briefly, cells cultured for 72 h on different modified Ti surfaces in vitro in high-glucose environment were incubated with the JC-1 staining solution (Beyotime, Shanghai, China) at 37°C for 20 min, and then rinsed twice with phosphate-buffered saline (PBS). The mitochondrial membrane potential was determined according to the manufacturer’s instructions. The fluorescence intensity was evaluated by flow cytometry (Cytoflex, Beckman, USA), and CellQuest™ software (CytExpert, USA) was used to analyze the red/green fluorescence intensity ratio.
To further detect cellular apoptosis on different modified Ti surfaces subjected to high-glucose conditions, we used an Annexin V/PI apoptosis kit (Beyotime, Shanghai, China). After 72-h culture in high-glucose concentration, MC3T3-E1 cells were harvested and washed with PBS, and then re-suspended in 195 µL binding buffer. Thereafter, the cells were incubated with 10 µL PI and 5 µL mixture of Annexin V and fluorescein isothiocyanate (FITC) for 20 min in the darkroom at 37°C, and then evaluated by flow cytometry (Cytoflex, Beckman, USA). Data analysis was conducted using the CellQuest™ software (CytExpert, USA).
Intracellular ROS Level and Detection of Total SOD Activity
To detect intracellular ROS production, we applied the 2ʹ,7ʹ-dichlorodihydrofluorescein diacetate (DCFH-DA) probe kit (Solarbio, Beijing, China). After 72-h culture, cells were harvested and incubated with DCFH-DA (1:1000) for 30 min. Subsequently, the cells were rinsed twice with PBS, and fluorescence intensity was evaluated by flow cytometry (Cytoflex, Beckman, USA). CellQuest™ software (CytExpert, USA) was used to analyze the level of intracellular ROS.
The activity of superoxide dismutase (SOD) was measured using the Superoxide Dismutase Assay Kit (Beyotime, Shanghai, China) according to the manufacturer’s instructions. Briefly, we harvested the cells and re-suspended them in the specimen preparation solution. Then, we added the specimens, enzyme stock solution, and reactant working solution at low temperature as indicated by the manufacturer’s instructions for the kit. Subsequently, the working solution was incubated at 37°C for 30 min and the absorbance was recorded at 450 nm. The activities of SOD were defined as the ratio of the total enzyme activity unit divided by the total protein and were expressed as U/g protein.
Furthermore, to detect the impact of the antioxidant N-acetylcysteine (NAC; Sigma-Aldrich, USA) on different modified Ti surfaces under high-glucose conditions, the pre-osteoblasts were exposed to 1 mM NAC. Post exposure, the cells were evaluated for the mitochondrial membrane potential and intracellular ROS level, and subjected to cellular apoptosis assay.
Experimental Animals
This study was approved by the Institutional Animal Care and Use Committee of Sun Yat-sen University (Approval No. SYSU-IACUC-2019-000261) and was conducted according to International Guiding Principles for Biomedical Research Involving Animals of International Council for Laboratory Animal Science (ICLAS).19 Twenty-four male Sprague–Dawley (SD) rats (200–250 g) were purchased from the Guangdong Medical Laboratory Animal Center (Foshan, China). Four rats each were housed in a cage with controlled temperature, humidity, and light exposure and ad libitum access to water and food.
At the end of the 1-week quarantine period, rats were randomly divided into 2 groups (n=12 per group): healthy rats and DM rats. The DM rats received intraperitoneal (i.p.) injections of streptozotocin (52 mg/kg; MP Biomedicals, USA), whereas healthy rats received an equal volume of citrate buffer (pH=4.2–4.4; Zhongnan Chemical Reagent, Guangzhou, China) via i.p. injections. Random blood glucose (RBS) levels were measured in blood samples obtained from the animal’s tail vein using a glucometer (Johnson & Johnson, USA) on the 5th day after the injection. During this period, the animals were closely monitored daily. Eventually, 12 animals with RBS higher than 300 mg/dL were selected for the DM model.
Surgical Procedures
Rats were anesthetized with intraperitoneal injection of sodium pentothal. Subsequently, the distal end of the femur was surgically exposed and an implant was placed in each femur. Different modified surfaces of Ti implant were implanted until their complete embedment in the cortical bone. Post implantation, the muscles and skin were sewn carefully in layers. Intramuscular injections of penicillin (80,000 U/day) were administered postoperatively for 3 days. After healing for 4 and 8 weeks, 12 rats were euthanized by CO2 overdose and the femurs with different modified surfaces of the Ti implants were harvested and stored in 4% paraformaldehyde for further evaluation.
Micro-CT Scan
To evaluate osteogenesis on different modified surfaces of Ti implant in the DM conditions, we undertook a micro-CT scan of the femur with the implant. Samples were detected by a micro-CT scanner (X-TEK XTV 160H, Nikon, Japan) under the conditions of 120 kV and 83 μA integration time. The bone volume over total volume (BV/TV) was evaluated in VG studio Max 3.0.2 (Volume Graphics Company, Germany).
Statistical Analysis
Statistical analysis was conducted using SPSS 23.0 (IBM, USA). Continuous variables were expressed as mean ± standard deviation. After the normal distribution test, between-group differences were assessed using One-way ANOVA followed by LSD test. P values < 0.05 were considered indicative of statistical significance.
Results
Cell Adhesion and Proliferation Abilities on Different Modified Ti Surfaces
In Figure 1A–C, at a lower magnification of 2000×, the MP and TNT groups appeared to have relatively smooth surfaces, whereas the SLA group showed a rough surface. At a high magnification of 50,000×, parallel shallow scratches were observed in the MP group, and the SLA group presented a pit-like structure of different sizes. The TNT group was composed of well-ordered nanotubes with a uniform diameter of approximately 80 nm.
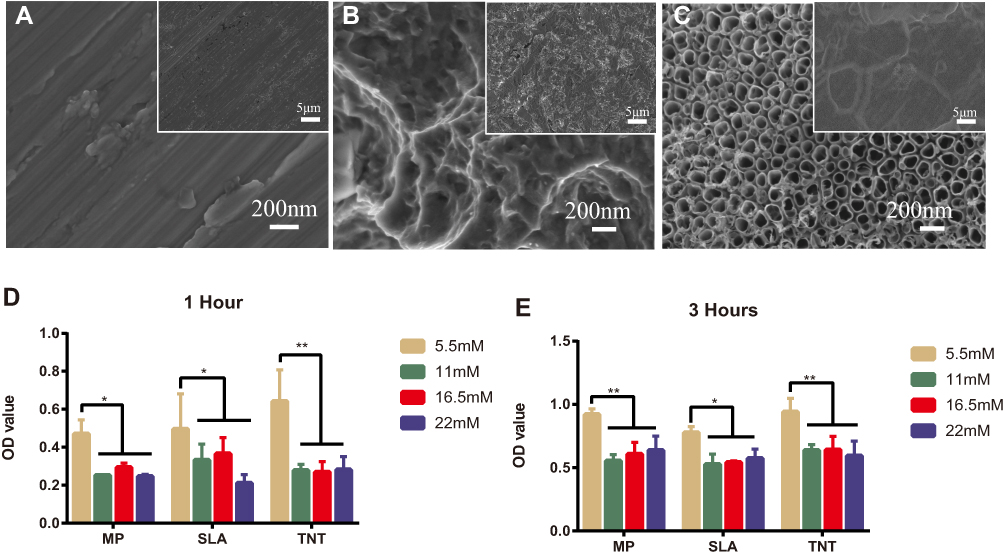 |
Figure 1 High-glucose conditions inhibited cell adhesion on different modified Ti surfaces. (A–C) The surface topography of different modified titanium (Ti) surfaces by scanning electron microscope: (A) mechanical polishing surface (MP), (B) sandblasted and acid-etched surface (SLA), and (C) TiO2 nanotubes surface (TNT). (D, E) Cell adhesion assay on different modified Ti surfaces under different glucose concentrations after 1 and 3 h of incubation. High glucose inhibited cell adhesion on the SLA or TNT surfaces. *p < 0.05, **p < 0.01. |
The adhesion ability of MC3T3-E1 on the different modified Ti surfaces under normal and high-glucose conditions is shown in Figure 1D and E. Compared with the normal glucose (5.5 mM group) conditions, there was significant impairment of the adhesion ability of pre-osteoblasts on all 3 Ti surfaces under high-glucose levels on 1-h and 3-h culture. We detected no differences among the high-glucose groups with respect to adhesion on different modified Ti surfaces, with the exception of the SLA group. After culture for 1 h, we found that the 22-mM glucose medium significantly inhibited the adhesion ability of the SLA group. Compared with the SLA group, the TNT group showed significantly higher cell adhesion ability on culture in 5.5 mM (p < 0.05) glucose medium, but without any differences in the high-glucose culture. There was a time-dependent adhesion pattern on different modified Ti surfaces under all glucose conditions.
As shown in Figure 2A–C, the cell proliferation ability on different modified Ti surfaces was significantly inhibited in a concentration-dependent pattern. The SLA group showed higher inhibition of proliferation than the other groups under different glucose concentrations and time periods. Compared with the SLA group, cell proliferation in the TNT group was significantly higher under all glucose concentrations after 3 and 5 days of culture. Moreover, as shown in Figure 2D–G, there was a time-dependent proliferation pattern on different modified Ti surfaces under all glucose conditions. The proliferation ability of pre-osteoblasts in the SLA group was significantly lower than that of the TNT group under all glucose concentrations on days 3 and 5. These results indicate that high glucose concentrations inhibited cell adhesion and proliferation on different modified Ti surfaces.
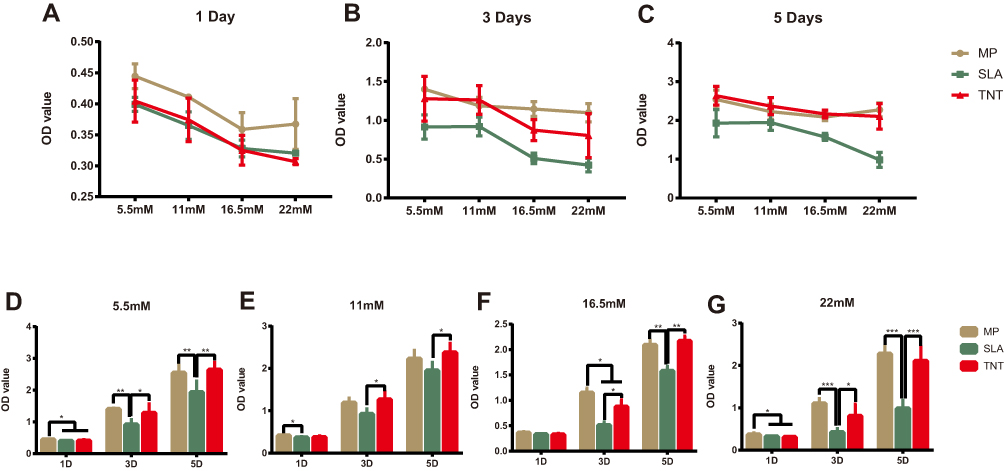 |
Figure 2 High-glucose conditions inhibited cell proliferation on different modified Ti surfaces. (A–G) The cell proliferation on different modified Ti surfaces under different glucose concentrations after 1, 3, and 5 days’ culture. High-glucose levels inhibited cell proliferation on different modified Ti surfaces. There was a concentration- and time-dependent proliferation pattern on different modified Ti surfaces. *p < 0.05, **p < 0.01, ***p < 0.001. |
Osteogenetic Ability on Different Modified Ti Surfaces in vitro
ALP – an early marker of osteoblasts differentiation – was measured by immunofluorescence staining and Western blot analysis. As shown in Figures 3 and 5, compared with the results under normal glucose level (5.5 mM), the expression of ALP on all 3 different modified Ti surfaces appeared to be lower under the high-glucose level (22 mM); this finding indicated that high glucose levels inhibited ALP expression on different modified Ti surfaces. Furthermore, compared with the SLA group, the expression of ALP in TNT group was significantly higher under both normal and high-glucose conditions. This suggested that the TNT surface, compared with the SLA surface, could alleviate the inhibition of ALP expression under high-glucose conditions.
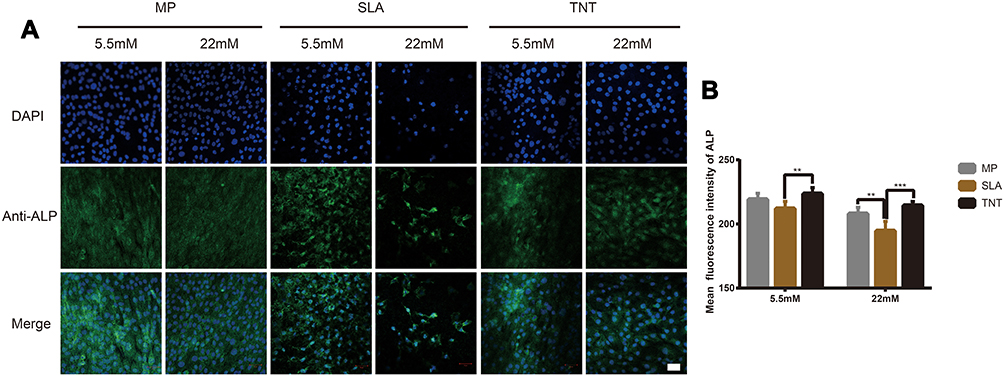 |
Figure 3 High-glucose conditions inhibited ALP expression on different modified Ti surfaces. (A) The immunofluorescence staining of ALP observed by confocal scanning laser microscopy after osteogenic induction for 7 days. (B) Semi-quantitative analysis of the ALP immunofluorescence staining by Image J. High glucose levels inhibited ALP expression on different modified Ti surfaces, and TNT surface could alleviate the inhibition of ALP expression under high-glucose conditions. **p < 0.01, ***p < 0.001. Scale bar = 50 µm. |
The expression of OPN, a mid-term marker of osteoblasts differentiation, is shown in Figures 4 and 5. The expression of OPN on different modified Ti surfaces was significantly decreased under high-glucose conditions. Furthermore, compared with the SLA group, the expression of OPN in TNT group was higher under both normal-glucose and high-glucose conditions. Thus, under high-glucose conditions, the TNT surface attenuated the inhibition of OPN expression compared with the SLA surface.
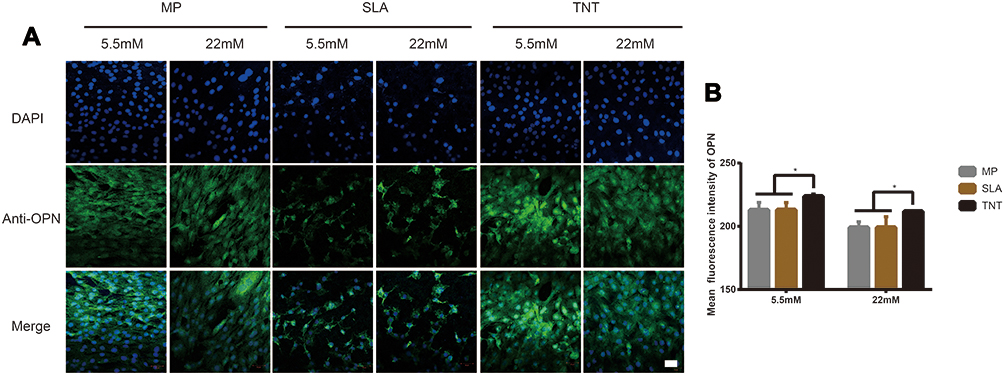 |
Figure 4 High-glucose levels inhibited OPN expression on different modified Ti surfaces. (A) The immunofluorescence staining of OPN observed under confocal scanning laser microscopy after osteogenic induction for 14 days. (B) Semi-quantitative analysis of the OPN immunofluorescence staining by Image J. High-glucose conditions inhibited OPN expression on different modified Ti surfaces, and TNT surface could attenuate the inhibition of OPN expression under high-glucose conditions. *p < 0.05. Scale bar = 50 µm. |
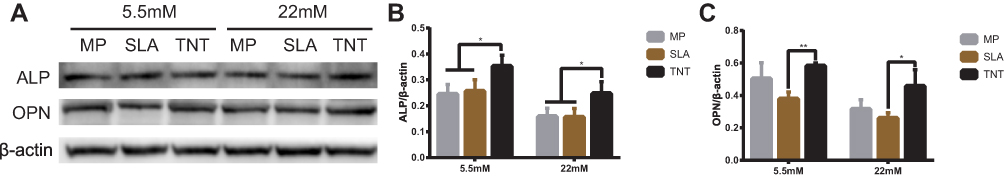 |
Figure 5 Western blot analysis of the expressions of ALP and OPN on different modified Ti surfaces. (A) Results of Western blot analysis showing the expressions of ALP and OPN after osteogenic induction for 7 days. (B) Quantitative analysis of ALP/β-actin. (C) Quantitative analysis of OPN/β-actin. *p < 0.05, **p < 0.01. There was no significant difference between the two groups under normal or high-glucose conditions without *. |
On Alizarin Red staining, compared with normal-glucose conditions, we found less calcific nodules on different Ti-modified surfaces under high-glucose conditions on both 14 days and 21 days (Figure S1A, Figure 6A). Semi-quantitative analysis showed that the absorbance value of high-glucose samples was lower than that of normal-glucose samples; this indicated that high glucose inhibited the mineralization level on different modified Ti surfaces. Furthermore, compared with the SLA group, more calcific nodules were found on the TNT surface under both normal- and high-glucose conditions; in addition, the absorbance value of the TNT group was significantly higher than that of the SLA group on both 14 days and 21 days (Figure S1B, Figure 6B); this indicated the TNT surface weakened the inhibition of mineralization when compared with the SLA surface under high-glucose conditions. Moreover, there was a time-dependent mineralization pattern in the MP and TNT group under normal glucose conditions (p < 0.05).
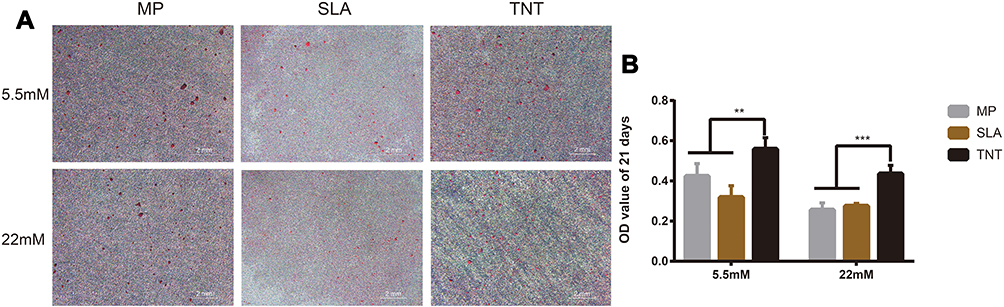 |
Figure 6 High-glucose conditions inhibited osteogenesis on different modified Ti surfaces. (A) The Alizarin Red staining on different modified Ti surfaces after osteogenic induction for 21 days under high-glucose conditions. (B) Semi-quantitative analysis of the Alizarin Red staining for 21 days. High-glucose conditions inhibited the mineralization level on different modified Ti surfaces. The TNT surface could alleviate the inhibition of mineralization when compared with the SLA surface under high-glucose conditions. The Alizarin Red staining for 14 days on different modified Ti surfaces is shown in Figure S1. **p < 0.01, ***p < 0.001. |
Mitochondrial Membrane Potential and Cell Apoptosis on Different Modified Ti Surfaces
The mitochondrial membrane potential on different modified Ti surfaces was detected using the JC-1 probe. As shown in Figure 7A, high-glucose states significantly reduced the mitochondrial membrane potential of MC3T3-E1 on different modified Ti surfaces. This indicated that high glucose promoted early apoptosis of pre-osteoblasts. Furthermore, compared with the SLA group, the mitochondrial membrane potential of the TNT group was higher under both normal- and high-glucose conditions; this indicated that the TNT surface can alleviate early apoptosis of pre-osteoblasts when compared with the SLA surface under high-glucose conditions.
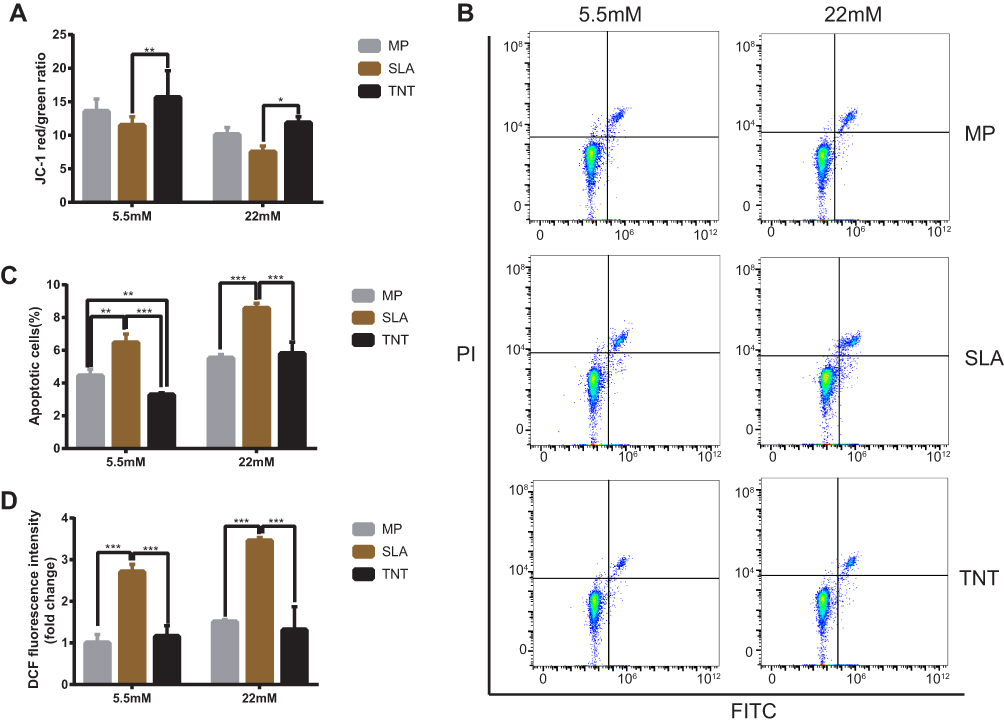 |
Figure 7 High-glucose conditions decreased mitochondrial membrane potential, led to cell apoptosis, and induced excess intracellular ROS on different modified Ti surfaces. (A) The mitochondrial membrane potential determined by the red/green fluorescence intensity ratio in JC-1 staining. (B) Cell apoptosis detected with Annexin V–FITC/PI double-staining using flow cytometry. (C) Statistical analysis of the apoptosis rate on different modified Ti surfaces. Results showed that high-glucose conditions promoted cell apoptosis on different modified Ti surfaces. (D) Detection of intracellular ROS level on different modified Ti surfaces with the relative DCF fluorescence intensity as measured by flow cytometry. The average value of ROS in the MP-5.5-mM group is 1. Results showed that high-glucose conditions induced excess intracellular ROS level on different modified Ti surfaces, and the TNT surface could produce less oxidative stress than the SLA surface. *p < 0.05, **p < 0.01, ***p < 0.001. There was no significant difference between the two groups under normal or high-glucose conditions without *. |
The proportion of apoptotic cells detected by the Annexin V/PI apoptosis kit is shown in Figure 7B and C. Compared with the normal-glucose samples, the apoptosis rate was significantly increased (p < 0.05) on different modified Ti surfaces in the high-glucose group, indicating that high glucose levels increased the apoptosis of MC3T3-E1 on different modified Ti surfaces. Moreover, the apoptosis rate of the TNT group was significantly lower than that of the SLA group under both normal- and high-glucose conditions (Figure 7C); this indicated that the TNT surface reduced the apoptosis rate of pre-osteoblasts when compared with the SLA surface under high-glucose conditions.
Intracellular ROS Level and Activity of Total SOD on Different Modified Ti Surfaces
The intracellular ROS expression of MC3T3-E1 is shown in Figure 7D. Compared with the normal-glucose conditions, the mean fluorescence intensity of ROS on different modified Ti surfaces was higher under high-glucose conditions. Furthermore, compared with the TNT group, a two-fold increase of fluorescence intensity was observed in pre-osteoblasts of the SLA group under both normal-glucose and high-glucose conditions (p < 0.001); this implies that the TNT surface induced lesser oxidative stress on the surface as compared to the SLA surface.
The total SOD activity was analyzed to determine the intracellular antioxidant capacity in each group. As shown in Figure S2, compared with the normal-glucose samples, the total SOD activity of the high-glucose samples increased in the TNT group (p < 0.001) whereas it decreased in the SLA group (p < 0.01). Moreover, compared with the SLA group, the total SOD activity in the TNT group was lower under normal-glucose and higher under high-glucose conditions; this indicated the TNT surface has potential antioxidant capacity.
Antioxidant NAC Alleviated Cell Apoptosis Rate and Intracellular ROS Level Induced by High Glucose on Different Modified Ti Surfaces
The mitochondrial membrane potential on different modified Ti surfaces following NAC treatment is shown in Figure 8A. Compared with the high-glucose conditions, after NAC treatment, the mitochondrial membrane potential on different modified Ti surfaces was significantly increased; this indicated that NAC treatment attenuated the early apoptosis on different modified Ti surfaces under high-glucose conditions. In addition, the mitochondrial membrane potential of the TNT surface was higher than that of the SLA surface under both high-glucose conditions and after NAC treatment.
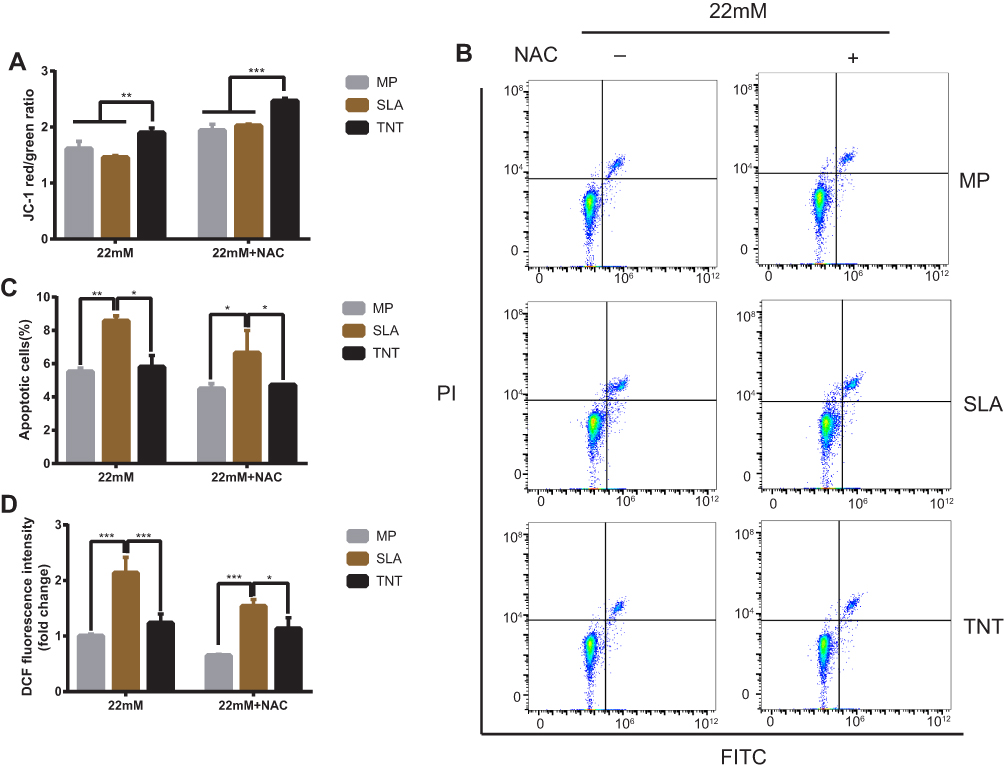 |
Figure 8 NAC treatment alleviated the inhibition of high-glucose conditions on different modified Ti surfaces. (A) The mitochondrial membrane potential after NAC treatment determined by the red/green fluorescence intensity ratio in JC-1 staining. (B) Cell apoptosis after NAC treatment detected with Annexin V-FITC/PI double-staining using flow cytometric analysis. (C) Statistical analysis of the apoptosis rate after NAC treatment of different modified Ti surfaces. (D) Detection of intracellular ROS level after NAC treatment of different modified Ti surfaces, with the relative DCF fluorescence intensity measured by flow cytometry. The average value of ROS in the MP-22 mM group is 1. The results showed that the higher apoptosis rate and intracellular ROS level induced by high glucose on different modified Ti surfaces reduced after NAC treatment. *p < 0.05, **p < 0.01, ***p < 0.001. |
Post NAC treatment, the proportion of apoptotic cells was detected by the Annexin V/PI apoptosis kit. Compared with the high-glucose groups, the apoptosis rate of the NAC treatment groups on different modified Ti surfaces was significantly decreased (Figure 8B and C); this indicated that NAC treatment reduced the apoptosis rate on different modified Ti surfaces under high-glucose conditions. Moreover, compared with the SLA surface, the apoptosis rate of the TNT surface was lower after NAC treatment (p < 0.05; Figure 8C).
The intracellular ROS production of pre-osteoblasts after NAC treatment, as measured by DCFH-DA fluorescence, is shown in Figure 8D. Compared with the high-glucose groups, the mean fluorescence intensity of ROS on different modified Ti surfaces was lower after NAC treatment; this indicated that NAC treatment reversed ROS production on different modified Ti surfaces under high-glucose conditions. Compared with the SLA surface, the ROS production on the TNT surface was significantly lower under both high-glucose conditions and after NAC treatment (p < 0.001).
In vivo Osteogenetic Ability of Ti Implants with Different Modified Surfaces
To evaluate the osteogenetic ability of Ti implants with the different modified surfaces in rats with DM, we undertook micro-CT scanning and analysis of the harvested femurs. As shown in Figure 9A, the cortical bone thickness around the implants in the DM group was thinner than that in the control group after 4 and 8 weeks of implantation. Areas with low bone mineral density were found around the implants with the MP and SLA surfaces. Uniform and dense new bone was observed surrounding the implants that had a TNT surface. Figure 9B represents the peri-implant bone volume ratio; the DM group had a lower BV/TV% than the control group in the same period. The group of implants with the TNT surface presented the highest BV/TV% when compared with the groups of implants with the SLA and MP surfaces. Moreover, the BV/TV% of all groups at 8 weeks was higher than that at 4 weeks, indicating a time-dependent variation.
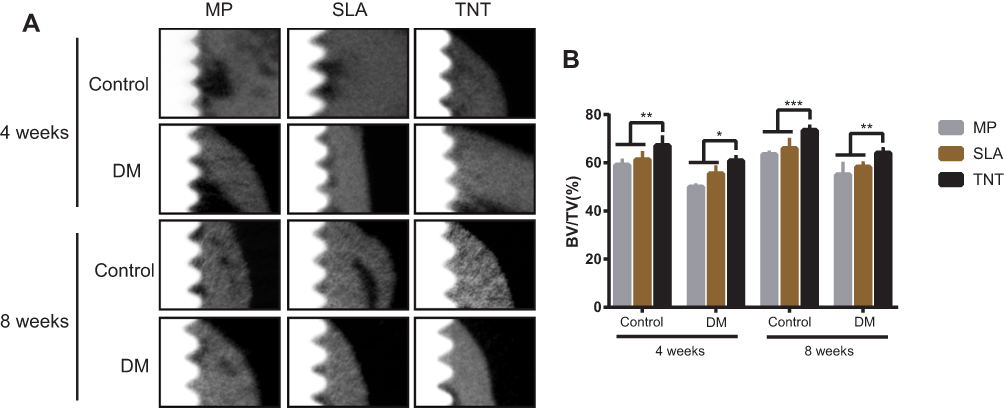 |
Figure 9 Osteogenetic ability of Ti implants with different modified surfaces in-vivo. (A) Scanning images of micro-CT after implantation in the DM rat model for 4 and 8 weeks. The white part on the left is the Ti implant, the gray part on the right is the bone tissue, and the black part between the two is the low-density shadow. (B) The BV/TV% of micro-CT after implantation in the DM rat model for 4 and 8 weeks. Results showed that the thickness of the cortical bone around the implants of the DM group was thinner than that in the control group after 4 and 8 weeks of implantation. More dense new bone was observed surrounding the implants with the TNT surface. *p < 0.05, **p < 0.01, ***p < 0.001. |
Discussion
DM is a metabolic disease characterized by hyperglycemia due to insulin insensitivity or deficiency. Because of the much slower osseointegration and lower survival rate of dental implants in patients with DM, Ti implants are contraindicated in patients with DM. The reported implant survival rate for patients with type 1 and 2 DM was 80% and 90.5%, respectively.11 Chambrone and Palma indicated that patients with poorly controlled type 2 DM were more likely to suffer from peri-implantitis and marginal bone loss.20 Furthermore, marginal bone loss, probing-induced bleeding, and peri-implant pocket depth increased in relation with higher levels of glycated hemoglobin (HbA1c).21
Ti, with its favorable biocompatibility, mechanical properties, and corrosion resistance, has been widely used in the field of biomedicine implants such as dental implants. As the binding strength is closely related with the surface properties of the implant, several surface modification techniques have been developed to improve the biocompatibility of dental implants; these include, discrete crystalline deposition, SLA, micro-arc oxidation, and anodization.22–25 Some studies have investigated the osteogenesis induced by the use of these different modified Ti surfaces under the DM conditions. Zhou et al reported that, compared with mechanically polished Ti implants, implants with hydroxyapatite coating and SLA surface modification may increase bone integration in rats with type 2 DM;26 however, other researchers have found that implants with an SLA surface had a lower bone-implant contact rate than those with SLA active surfaces under DM conditions.27 Feng et al fabricated a honeycomb-like Ti6AL4V implant designed by CAD software; they demonstrated that the osteoblasts on porous Ti surface were suppressed under DM conditions.28 Chen et al and Li et al evaluated the osseointegration of the chitosan-coated porous Ti alloy implant; they found that the chitosan coating markedly improved the diabetes-induced impaired bioperformance of Ti.29,30 There are other methods for modification of the dental implant surface to improve osseointegration under high-glucose conditions, including ultraviolet light pretreatment31 and NAC loading.32 However, many of the studies have yielded contradictory findings or involved comparisons only on micro-scale surface. Besides, these modification methods were reported to be time- and labor-consuming; moreover, these showed weak coating-substrate binding strength.
Recently, considerable attention has been devoted to the generation of TNT through electrochemical anodization.14 In one of our previous studies, we found that the roughness and water contact angle of the SLA surface were significantly higher than that of the TNT surface. Compared with the SLA surface, the TNT surface had a larger surface area as well as better hydrophilicity and protein adsorption capacity; this enhanced the cell adhesion, proliferation, and osseointegration abilities.13 The reported zeta potential of three Ti surfaces (MP, acid-etched, TNT) at PH 7.4 was −10–-15mV,33,34 −20–-24 mV,35 and −30–-35mV,36 respectively. In addition, there was no difference in the zeta potential of nanotubes with different diameters.36 Amani et al showed that surface charge played an important role in cell survival.37 Li et al reported enhanced bioactivity on the TiO2 surface with more negative zeta potential.38 Referring to the zeta potential of the different modified Ti surfaces reported in the above articles in conjunction with the results of the present study, we found that the lower the zeta potential of the surface, the stronger the osseointegration ability. Moreover, the inner diameter of nanotubes in our study was 80 nm, which is the same as that in a previous study.13 Several studies have demonstrated the critical impact of the diameter of the nanotubes on cell proliferation and differentiation.14,39 Nanotubes with small diameter were found beneficial for adhesion and proliferation of osteoblasts, while nanotubes with large diameter were found to greatly increase osteogenic differentiation.40 Ajami et al demonstrated that the osteogenetic ability under hyperglycemic conditions could be abrogated by the addition of nano-topographical features to an underlying micro-topographically complex implant surface.9 Yu et al demonstrated that, compared with the small-diameter TNT specimen, the cellular behavior of large-diameter TNT specimens was better under high oxidative stress.40,41 Similarly, in this study, under high-glucose conditions, the TNT surface with a diameter of approximately 80 nm provided good biocompatibility and osteogenetic ability compared with the SLA surface.
Subsequent studies on the mechanism of osteogenetic inhibition in DM have reported a direct association between the duration of diabetes and poor bone healing.42–46 Ajami et al provided evidence of delayed bone healing – both formation and remodeling of reparative trabecular bone – under hyperglycemic conditions.9 Moreover, the mineralization process of osteoblasts was altered under high-glucose conditions. García-Hernández et al showed that the mineralization level in high-glucose conditions was lower than that in the normal glucose conditions, and was in an immature state.47 The pathogenetic mechanism for this may be that DM increases the rate of apoptosis of osteoblasts, reduces osteoblast differentiation, and enhances bone resorption by ROS overproduction.48–50 ROS plays an important role as an inflammatory mediator by inducing oxidative stress, thus leading to the development of many pathological conditions. The excessive production of ROS can disrupt the balance between intracellular oxidative stress and antioxidant stress, leading to cell dysfunction and apoptosis.51 Several studies have shown that the overproduction of ROS accounts for the inhibition of bone healing on the different modified surfaces under high-glucose conditions.44,52,53 Moreover, it has been reported that the degradation byproducts of implanted materials produced oxidative stress by stimulating inflammatory reactions, which could lead to excessive, persistent oxidative stress and, ultimately, chronic inflammation. Therefore, successful biomaterials require a precise balancing of both oxidative stress and antioxidant defense.54
A previous study found that the roughness of the TNT surface was significantly less than that of the SLA surface and slightly higher than that of the MP surface.13 Studies have demonstrated that a rough surface is more likely to produce degradation byproducts when it comes in contact with the surrounding tissue, thereby attracting inflammatory cells and producing ROS.55 Boyan et al demonstrated that the number of living cells on the surface of the material is inversely proportional to the surface roughness.56 In this study, the cell proliferation of the TNT surface was higher than that of the SLA surface but similar to that of the MP surface. The latter may be attributable to the lack of any significant difference in the mitochondrial membrane potential and intracellular ROS level between MP surface and TNT surface, resulting in a similar apoptosis rate between the two groups, as shown in Figure 7. In the later cell differentiation process, in addition to surface roughness and intracellular ROS level, other surface properties (such as surface hydrophilicity and surface morphology) may have a synchronous effect on the cell biological behavior. Although the amount of living cells on MP surface and TNT surface were similar, the results of osteogenesis test showed that the osteogenesis ability of the TNT group was significantly higher than that of the MP group. The reason may be that the nano-morphology and the nano-scale roughness of the TNT surface are similar to the size of the signal particles of the extracellular matrix, to provide a morphological signal for cell recognition of the surrounding biological microenvironment and biomaterials.15
The results of the present work showed that high-glucose states led to excess production of ROS, which inhibited cell adhesion and proliferation, decreased mitochondrial membrane potential, and induced cell apoptosis. Compared with the SLA surface, the TNT surface demonstrated favorable biocompatibility and osteogenesis in vitro and in vivo by producing less ROS under DM conditions. Furthermore, the TNT surface conferred a better antioxidant ability through production of a higher total SOD level to balance the expression of ROS, and ultimately alleviated the inhibition of osteogenesis in high-glucose states. Therefore, the TNT surface can potentially be applied in patients with DM for favorable osseointegration.
Conclusion
High glucose levels inhibited cell adhesion and proliferation, decreased mitochondrial membrane potential, and led to cell apoptosis on different modified Ti surfaces. Compared with the SLA surface, the TNT surface alleviated the inhibition of osteogenesis under DM conditions through lesser production of ROS and potential antioxidant effect. The TNT surface provides a more suitable therapeutic strategy for improving osteogenesis and reducing implant failure in patients with DM.
Abbreviations
Ti, titanium; DM, diabetes mellitus; ROS, reactive oxygen species; TiO2, titanium dioxide; TNT, TiO2 nanotubes; ALP, alkaline phosphatase; SLA, sandblasted and acid-etched; MP, mechanically polished; CCK-8, Cell Counting Kit-8; OPN, osteopontin; BSA, bovine serum albumin; PBS, phosphate-buffered saline; FITC, fluorescein isothiocyanate; DCFH-DA, 2ʹ,7ʹ-dichlorodihydrofluorescein diacetate; SOD, superoxide dismutase; NAC, N-acetylcysteine; SD, Sprague–Dawley; i.p., intraperitoneal; RBS, random blood glucose; BV/TV, bone volume over total volume; HbA1c, glycated hemoglobin.
Consent for Publication
All authors agree to publish this manuscript.
Ethics and Consent Statements
All animal experiments were approved by the Institutional Animal Care and Use Committee of Sun Yat-sen University (approval no. SYSU-IACUC-2019-000261).
Data Sharing Statement
All data generated or analysed during this study are included in this published article [and its Supplementary Information Files].
Author Contributions
All authors made substantial contributions to the conception and design, acquisition of data, or analysis and interpretation of data; took part in drafting the article or revising it critically for important intellectual content; gave final approval of the version to be published; and agree to be accountable for all aspects of the work.
Funding
This work was financially supported by Guangdong Financial Fund for High-Caliber Hospital Construnction (grant no. 174-2018-XMZC-0001-03-0125/D-09); Guangdong Natural Science Foundation (grant no. 2019A1515011842); Guangdong Basic and Applied Basic Research Foundation (grant no. 2020A1515010291); the National Natural Science Foundation of China (grant no. NSFC81672659); Guangdong Medical Science and Technology Research Foundation (grant no. C2017059); and Guangzhou Science and Technology Program Project Collaborative Innovation Major Projects (grant no. 201704020112).
Disclosure
The authors declare that they have no competing interests.
References
1. Kulkarni M, Mazare A, Gongadze E, et al. Titanium nanostructures for biomedical applications. Nanotechnology. 2015;26(6):1–18. doi:10.1088/0957-4484/26/6/062002
2. Annunziata M, Guida L. The effect of titanium surface modifications on dental implant osseointegration. In: Biomaterials for Oral and Craniomaxillofacial Applications. Vol. 17. Karger Publishers; 2015:62–77.
3. Monje A, Catena A, Borgnakke WS. Association between diabetes mellitus/hyperglycemia and peri-implant diseases: systematic review and meta-analysis. J Clin Periodontol. 2017;44(6):636–648. doi:10.1111/jcpe.12724
4. Gomez-Moreno G, Aguilar-Salvatierra A, Rubio RJ, Guardia J, Gargallo J, Calvo-Guirado JL. Peri-implant evaluation in type 2 diabetes mellitus patients: a 3-year study. Clin Oral Implants Res. 2015;26(9):1031–1035. doi:10.1111/clr.12391
5. Neves J, de Araújo Nobre M, Oliveira P, Martins Dos Santos J, Malo P. Risk factors for implant failure and peri‐implant pathology in systemic compromised patients. J Prosthodont. 2018;27(5):409–415. doi:10.1111/jopr.12508
6. Ogurtsova K, Da Rocha Fernandes JD, Huang Y, et al. IDF diabetes atlas: global estimates for the prevalence of diabetes for 2015 and 2040. Diabetes Res Clin Pr. 2017;128:40–50. doi:10.1016/j.diabres.2017.03.024
7. Oztel M, Bilski WM, Bilski A. Risk factors associated with dental implant failure: a study of 302 implants placed in a regional center. J Contemp Dent Pract. 2017;18(8):705–709. doi:10.5005/jp-journals-10024-2111
8. Naujokat H, Kunzendorf B, Wiltfang J. Dental implants and diabetes mellitus-a systematic review. Int J Implant Dent. 2016;2(1):5–15. doi:10.1186/s40729-016-0038-2
9. Ajami E, Mahno E, Mendes VC, Bell S, Moineddin R, Davies JE. Bone healing and the effect of implant surface topography on osteoconduction in hyperglycemia. Acta Biomater. 2014;10(1):394–405. doi:10.1016/j.actbio.2013.09.020
10. Moraschini V, Poubel LADC, Ferreira VF, Barboza EDSP. Evaluation of survival and success rates of dental implants reported in longitudinal studies with a follow-up period of at least 10 years: a systematic review. Int J Oral Max Surg. 2015;44(3):377–388. doi:10.1016/j.ijom.2014.10.023
11. de Araujo NM, Malo P, Goncalves Y, Sabas A, Salvado F. Dental implants in diabetic patients: retrospective cohort study reporting on implant survival and risk indicators for excessive marginal bone loss at 5 years. J Oral Rehabil. 2016;43(11):863–870. doi:10.1111/joor.12435
12. Medvedev AE, Ng HP, Lapovok R, Estrin Y, Lowe TC, Anumalasetty VN. Effect of bulk microstructure of commercially pure titanium on surface characteristics and fatigue properties after surface modification by sand blasting and acid-etching. J Mech Behav Biomed. 2016;57:55–68. doi:10.1016/j.jmbbm.2015.11.035
13. Huang J, Zhang X, Yan W, Chen Z, Shuai X, Wang A. Nanotubular topography enhances the bioactivity of titanium implants. Nanomedicine. 2017;13(6):1913–1923. doi:10.1016/j.nano.2017.03.017
14. Awad NK, Edwards SL, Morsi YS. A review of TiO2 NTs on Ti metal: electrochemical synthesis, functionalization and potential use as bone implants. Mater Sci Eng C Mater Biol Appl. 2017;76(7):1401–1412. doi:10.1016/j.msec.2017.02.150
15. Minagar S, Wang J, Berndt CC, Ivanova EP, Wen C. Cell response of anodized nanotubes on titanium and titanium alloys. J Biomed Mater Res A. 2013;101A(9):2726–2739. doi:10.1002/jbm.a.34575
16. Mazare A, Dilea M, Ionita D, Titorencu I, Trusca V, Vasile E. Changing bioperformance of TiO2 amorphous nanotubes as an effect of inducing crystallinity. Bioelectrochemistry. 2012;87:124–131. doi:10.1016/j.bioelechem.2012.01.002
17. Zhang L, Liao X, Fok A, Ning C, Ng P, Wang Y. Effect of crystalline phase changes in titania (TiO2) nanotube coatings on platelet adhesion and activation. Mater Sci Eng C. 2018;82:91–101. doi:10.1016/j.msec.2017.08.024
18. Wu J, Huang J, Yun J, et al. Enzyme-directed biomineralization coating on TiO2 nanotubes and its positive effect on osteogenesis. ACS Biomater Sci Eng. 2019;5(6):2769–2777. doi:10.1021/acsbiomaterials.9b00418
19. Demers G, Griffin G, Vroey GD, Haywood JR, Zurlo J, Bédard M. Harmonization of Animal care and use guidance. Science. 2006;312(5774):700–701. doi:10.1126/science.1124036
20. Chambrone L, Palma LF. Current status of dental implants survival and peri-implant bone loss in patients with uncontrolled type-2 diabetes mellitus. Curr Opin Endocrinol Diabetes Obes. 2019;26(00):1–4. doi:10.1097/MED.0000000000000482
21. Aguilar-Salvatierra A, Calvo-Guirado JL, Gonzalez-Jaranay M, Moreu G, Delgado-Ruiz RA, Gomez-Moreno G. Peri-implant evaluation of immediately loaded implants placed in esthetic zone in patients with diabetes mellitus type 2: a two-year study. Clin Oral Implants Res. 2016;27(2):156–161. doi:10.1111/clr.12552
22. Jemat A, Ghazali MJ, Razali M, Otsuka Y. Surface modifications and their effects on titanium dental implants. Biomed Res Int. 2015;2015:1–11. doi:10.1155/2015/791725
23. Saghiri MA, Asatourian A, Garcia-Godoy F, Sheibani N. The role of angiogenesis in implant dentistry part I: review of titanium alloys, surface characteristics and treatments. Med Oral Patol Oral Cir Bucal. 2016;21(4):514–525.
24. Chiang HJ, Hsu HJ, Peng PW, et al. Early bone response to machined, sandblasting acid etching (SLA) and novel surface‐functionalization (SLAffinity) titanium implants: characterization, biomechanical analysis and histological evaluation in pigs. J Biomed Mater Res A. 2016;104(2):397–405. doi:10.1002/jbm.a.35577
25. Amani H, Arzaghi H, Bayandori M, et al. Controlling cell behavior through the design of biomaterial surfaces: a focus on surface modification techniques. Adv Mater Interfaces. 2019;6(13):1–30. doi:10.1002/admi.201900572
26. Zhou W, Tang S, Reich KM, et al. The influence of type 2 diabetes mellitus on the osseointegration of titanium implants with different surface modifications-A histomorphometric study in high-fat diet/low-dose streptozotocin – treated rats. Implant Dent. 2019;28(1):11–19. doi:10.1097/ID.0000000000000836
27. NemŢoi A, Trandafir V, Paşca AS, et al. Osseointegration of chemically modified sandblasted and acid-etched titanium implant surface in diabetic rats: a histological and scanning electron microscopy study. Rom J Morphol Embryol. 2017;58(3):881–886.
28. Feng Y, Wang L, Zhang Y, et al. Effect of reactive oxygen species overproduction on osteogenesis of porous titanium implant in the present of diabetes mellitus. Biomaterials. 2013;34(9):2234–2243. doi:10.1016/j.biomaterials.2012.12.023
29. Chen W, Shen X, Hu Y, et al. Surface functionalization of titanium implants with chitosan-catechol conjugate for suppression of ROS-induced cells damage and improvement of osteogenesis. Biomaterials. 2017;114:82–96. doi:10.1016/j.biomaterials.2016.10.055
30. Li X, Ma X, Feng Y, et al. Osseointegration of chitosan coated porous titanium alloy implant by reactive oxygen species-mediated activation of the PI3K/AKT pathway under diabetic conditions. Biomaterials. 2015;36:44–54. doi:10.1016/j.biomaterials.2014.09.012
31. Ueno T, Ikeda T, Tsukimura N, et al. Novel antioxidant capability of titanium induced by UV light treatment. Biomaterials. 2016;108(33):177–186. doi:10.1016/j.biomaterials.2016.08.050
32. Lee Y, Bhattarai G, Park I, et al. Bone regeneration around N-acetyl cysteine-loaded nanotube titanium dental implant in rat mandible. Biomaterials. 2013;34(38):10199–10208. doi:10.1016/j.biomaterials.2013.08.080
33. Cai K, Frant M, Bossert J, Hildebrand G, Liefeith K, Jandt KD. Surface functionalized titanium thin films: zeta-potential, protein adsorption and cell proliferation. Colloids Surf B Biointerfaces. 2006;50(1):1–8. doi:10.1016/j.colsurfb.2006.03.016
34. Zeng Y, Yang Y, Chen L, et al. Optimized surface characteristics and enhanced in vivo osseointegration of alkali-treated titanium with nanonetwork structures. Int J Mol Sci. 2019;20:1127. doi:10.3390/ijms20051127
35. Jia F, Zhou L, Wu W. Interrelationships among hydrogen permeation, physiochemical properties and early adsorption abilities of titanium. J Mater Sci Mater Med. 2017;28:194.
36. Iglič A, Kulkarni M, Flasker A, et al. Binding of plasma proteins to titanium dioxide nanotubes with different diameters. Int J Nanomed. 2015;10:1359–1373. doi:10.2147/IJN.S77492
37. Amani H, Mostafavi E, Alebouyeh MR, et al. Would colloidal gold nanocarriers present an effective diagnosis or treatment for ischemic stroke? Int J Nanomed. 2019;14:8013–8031. doi:10.2147/IJN.S210035
38. Li J, Liu X, Qiao Y, Zhu H, Ding C. Antimicrobial activity and cytocompatibility of Ag plasma-modified hierarchical TiO2 film on titanium surface. Colloids Surf B Biointerfaces. 2014;113:134–145.
39. Chen Z, Ni S, Han S, et al. Nanoporous microstructures mediate osteogenesis by modulating the osteo-immune response of macrophages. Nanoscale. 2017;9(2):706–718. doi:10.1039/C6NR06421C
40. Yu Y, Shen X, Luo Z, et al. Osteogenesis potential of different titania nanotubes in oxidative stress microenvironment. Biomaterials. 2018;167(8):44–57. doi:10.1016/j.biomaterials.2018.03.024
41. Cimpean A, Neacsu P, Mazare A, Schmuki P. Attenuation of the macrophage inflammatory activity by TiO2 nanotubes via inhibition of MAPK and NF-κB pathways. Int J Nanomed. 2015;6455. doi:10.2147/IJN.S92019
42. Poiana C, Capatina C. Fracture risk assessment in patients with diabetes mellitus. J Clin Densitom. 2017;20(3):432–443. doi:10.1016/j.jocd.2017.06.011
43. Losada E, Soldevila B, Ali MS, et al. Real-world antidiabetic drug use and fracture risk in 12,277 patients with type 2 diabetes mellitus: a nested case–control study. Osteoporosis Int. 2018;29(9):2079–2086. doi:10.1007/s00198-018-4581-y
44. Sanches CP, Vianna AGD, Barreto FDC. The impact of type 2 diabetes on bone metabolism. Diabetol Metab Syndr. 2017;9(1):1–7. doi:10.1186/s13098-017-0278-1
45. Shu A, Yin MT, Stein E, et al. Bone structure and turnover in type 2 diabetes mellitus. Osteoporosis Int. 2012;23(2):635–641. doi:10.1007/s00198-011-1595-0
46. Rubin MR. Bone cells and bone turnover in diabetes mellitus. Curr Osteoporos Rep. 2015;13(3):186–191. doi:10.1007/s11914-015-0265-0
47. García-Hernández A, Arzate H, Gil-Chavarría I, Rojo R, Moreno-Fierros L. High glucose concentrations alter the biomineralization process in human osteoblastic cells. Bone. 2012;50(1):276–288. doi:10.1016/j.bone.2011.10.032
48. Chen H, Liu W, Wu X, Gou M, Shen J, Wang H. Advanced glycation end products induced IL-6 and VEGF-A production and apoptosis in osteocyte-like MLO-Y4 cells by activating RAGE and ERK1/2, P38 and STAT3 signalling pathways. Int Immunopharmacol. 2017;52(11):143–149. doi:10.1016/j.intimp.2017.09.004
49. Michaele B, Manigrasso J, Ramasamy R, Schmidt AM. Unlocking the biology of RAGE in diabetic microvascular complications. Trends Endocrin Met. 2014;25(1):15–22. doi:10.1016/j.tem.2013.08.002
50. Bacevic M, Brkovic B, Albert A, Rompen E, Radermecker RP, Lambert F. Does oxidative stress play a role in altered characteristics of diabetic bone? A systematic review. Calcified Tissue Int. 2017;101(6):553–563. doi:10.1007/s00223-017-0327-7
51. Li YR, Trush M. Defining ROS in biology and medicine. React Oxygen Species. 2016;1(1):9–21. doi:10.20455/ros.2016.803
52. Napoli N, Strollo R, Paladini A, Briganti SI, Pozzilli P, Epstein S. The alliance of mesenchymal stem cells, bone, and diabetes. Int J Endocrinol. 2014;1–26.
53. Strollo R, Rizzo P, Spoletini M, et al. HLA-dependent autoantibodies against post-translationally modified collagen type II in type 1 diabetes mellitus. Diabetologia. 2013;56(3):563–572. doi:10.1007/s00125-012-2780-1
54. Mouthuy P, Snelling SJB, Dakin SG, et al. Biocompatibility of implantable materials: an oxidative stress viewpoint. Biomaterials. 2016;109:55–68. doi:10.1016/j.biomaterials.2016.09.010
55. Kapanen A, Kinnunen A, Ryhanen J, Tuukkanen J. TGF-beta1 secretion of ROS-17/2.8 cultures on NiTi implant material. Biomaterials. 2002;23(16):3341–3346. doi:10.1016/S0142-9612(02)00023-6
56. Boyan BD, Olivares-Navarrete R, Berger MB, Hyzy SL, Schwartz Z. Role of Wnt11 during Osteogenic Differentiation of Human Mesenchymal Stem Cells on Microstructured Titanium Surfaces. Sci Rep-Uk. 2018;8(1):1–11.
 © 2020 The Author(s). This work is published and licensed by Dove Medical Press Limited. The full terms of this license are available at https://www.dovepress.com/terms.php and incorporate the Creative Commons Attribution - Non Commercial (unported, v3.0) License.
By accessing the work you hereby accept the Terms. Non-commercial uses of the work are permitted without any further permission from Dove Medical Press Limited, provided the work is properly attributed. For permission for commercial use of this work, please see paragraphs 4.2 and 5 of our Terms.
© 2020 The Author(s). This work is published and licensed by Dove Medical Press Limited. The full terms of this license are available at https://www.dovepress.com/terms.php and incorporate the Creative Commons Attribution - Non Commercial (unported, v3.0) License.
By accessing the work you hereby accept the Terms. Non-commercial uses of the work are permitted without any further permission from Dove Medical Press Limited, provided the work is properly attributed. For permission for commercial use of this work, please see paragraphs 4.2 and 5 of our Terms.