")
Back to Journals » Diabetes, Metabolic Syndrome and Obesity » Volume 14
The Involvement of Selenium in Type 2 Diabetes Development Related to Obesity and Low Grade Inflammation
Authors Wongdokmai R, Shantavasinkul PC , Chanprasertyothin S, Panpunuan P, Matchariyakul D, Sritara P, Sirivarasai J
Received 21 January 2021
Accepted for publication 24 March 2021
Published 14 April 2021 Volume 2021:14 Pages 1669—1680
DOI https://doi.org/10.2147/DMSO.S303146
Checked for plagiarism Yes
Review by Single anonymous peer review
Peer reviewer comments 2
Editor who approved publication: Prof. Dr. Juei-Tang Cheng
Rossukon Wongdokmai,1 Prapimporn Chattranukulchai Shantavasinkul,2 Suwannee Chanprasertyothin,3 Pachara Panpunuan,2 Dujrudee Matchariyakul,4 Piyamitr Sritara,2 Jintana Sirivarasai5
1Doctoral Program in Nutrition, Faculty of Medicine Ramathibodi Hospital and Institute of Nutrition, Mahidol University, Bangkok, Thailand; 2Department of Medicine, Faculty of Medicine Ramathibodi Hospital, Mahidol University, Bangkok, Thailand; 3Research & Innovation, Faculty of Medicine Ramathibodi Hospital, Mahidol University, Bangkok, Thailand; 4Health Office, Electricity Generating Authority of Thailand, Bangkok, Thailand; 5Graduate Program in Nutrition, Faculty of Medicine, Ramathibodi Hospital, Mahidol University, Bangkok, Thailand
Correspondence: Jintana Sirivarasai
Graduate Program in Nutrition, Faculty of Medicine, Ramathibodi Hospital, Mahidol University, 270 Rama 6 Road, Ratchatavee District, Bangkok, 10400, Thailand
Tel +662-201-1483
Fax +662-201-2625
Email [email protected]
Background: Effects of the micronutrient selenium have been proposed in obesity and type 2 diabetes mellitus (T2DM) that involve impairments in glucose metabolic pathways and the insulin signaling cascade, mediated through oxidative stress and inflammation. However, the evidence collected to date through animal and epidemiologic studies has been inconclusive. Therefore, in the present study, we aimed to evaluate the relationships of selenium status and inflammation with T2DM and obesity.
Methods: Participants in the re-survey of the Electricity Generating Authority of Thailand (EGAT)2 study conducted in 2013 (N=655, age 45– 60 years) were allocated to three groups based on their body mass index (World Health Organization Asia-Pacific Classification), and their serum selenium and high-sensitivity C-reactive protein (hs-CRP) concentrations and other clinical parameters were compared.
Results: Significant differences in serum selenium and hs-CRP among the groups were associated with differences in fasting blood glucose and glycated hemoglobin, as well as differences in the prevalence of prediabetes or T2DM. The adjusted odds ratios (ORs) (95% confidence intervals) for prediabetes or diabetes were 1.991 (1.318– 3.009) and 3.786 (2.087– 6.896) for the lowest and highest tertiles of serum selenium concentration in the entire sample and obese participants, respectively. Furthermore, the rising extent of hs-CRP increased the significantly associated with prediabetes or diabetes (adjusted ORs; 2.268 for the entire sample, 4.043 for the overweight and 1.910 for the obesity).
Conclusion: Selenium status may be linked to both obesity and T2DM through its effects on signaling pathways. Further nutrigenomic studies are required to clarify the relationship between selenium and metabolic diseases.
Keywords: serum selenium, obesity, type 2 diabetes mellitus, chronic inflammation, high sensitivity C-reactive protein
Introduction
The National Diabetes Statistics Report, published by the Centers for Disease Control and Prevention (CDC) in 2020, describes the principal features of diabetes and provides crude estimates for 2018. These data indicate that 1.5 million new cases of diabetes were diagnosed in US adults aged ≥18 years.1 Compared with adults aged 18–44 years, the incidence of newly diagnosed diabetes was higher among adults aged 45–64 years and those aged ≥65 years. Furthermore, the most important risk factors for diabetes were overweight and obesity (defined as a body mass index [BMI] of 25 kg/m2 or 30 kg/m2): 89.0% of US adults with type 2 diabetes mellitus (T2DM) were overweight or obese.1
The pathophysiology of T2DM includes both pancreatic β-cell dysfunction, with low insulin secretion, and peripheral insulin resistance.2 The links between obesity and T2DM are complex, involving a number of factors, such as genetic predisposition, the degree of obesity and adipocyte dysfunction, insulin resistance, pro-inflammatory cytokines, abnormal free fatty acid metabolism, changes in cellular redox status associated with mitochondrial dysfunction, and endoplasmic reticulum stress.3 In obesity, adipose tissue dysfunction, which involves hypertrophy and/or hyperplasia, can also lead to the accumulation of fat in other insulin-target tissues. For example, a previous cross-sectional study of gastric bypass surgery patients, which aimed to study the differences in adipocyte size and number in the visceral and abdominal subcutaneous adipose depots and relate these to biochemical parameters, found significant associations in both visceral and subcutaneous adipose tissue of adipocyte volume with insulin sensitivity and the plasma concentrations of insulin, triglycerides (TG), and high-density lipoprotein (HDL)-cholesterol.4
Adipose tissue expandability has a defined limit, and therefore its storage capacity can be exceeded in obese individuals, leading to ectopic lipid accumulation in non-adipose tissues, such as skeletal muscle, liver, and pancreas. This causes lipotoxicity, which involves hypoxia, apoptosis, inflammation, dysregulated fatty acid fluxes, and insulin resistance.5 Moreover, obesity is associated with an induction of pro-inflammatory signaling, through greater secretion of pro-inflammatory mediators, including tumor necrosis factor α (TNF-α) and interleukin 6 (IL-6), and less release of adiponectin, which are also associated with oxidative stress. IL-6 increases the synthesis and secretion of acute phase proteins such as C-reactive protein by the liver.6 High-sensitivity C-reactive protein (hs-CRP) is a sensitive marker of subclinical inflammation and strongly predicts obesity-associated T2DM. For example, a cohort study of 7683 non-diabetic participants that investigated the relationships of the circulating concentrations of hs-CRP, IL-6, IL-1 receptor antagonist, and adiponectin with glycemia, insulin concentration, insulin resistance, and beta-cell function showed that high concentrations of hs-CRP and IL-6 are associated with high fasting insulin concentration and insulin resistance after adjustment for confounders.7
Imbalances in nutrient intake are modifiable risk factors for components of the metabolic syndrome. Selenium (Se) is an essential micronutrient that plays crucial roles in cellular redox reactions, which are involved in inflammation and immunity.8 Its biological effects are exerted after incorporation into selenoproteins. Previous studies have provided inconclusive evidence relating Se status to the development of metabolic diseases. For example, an in vitro study by Kim et al, which was designed to determine the effects of selenate on adipogenesis and cell morphology change.9 The results showed a dose-dependent inhibition of intracellular lipid droplet accumulation in preadipocytes that were exposed to selenate for 6 days and that treatment with 50 μM selenate inhibited adipogenesis by ~95%. Furthermore, this selenate treatment induced the expression of transforming growth factor-β protein in the adipocytes.9 Additionally, differences in blood Se concentration have been identified in individuals with obesity and T2DM: those in the middle (80.91–98.20 μg/L) and highest (98.21–158.20 μg/L) plasma selenium tertiles had higher waist circumference (WC), BMI, visceral fat volume, and total fat volume, and more oxidative DNA damage than those with in the lowest plasma selenium tertile (38.65–80.90 μg/L).10 Moreover, in a cross-sectional study of middle-aged and elderly Chinese adults (N=5423), the multivariate-adjusted odds ratio (OR) was 1.52 (95% confidence interval [CI]: 1.01–2.28, P = 0.04) for the highest quartile of dietary selenium intake versus the lowest quartile, and a significant positive association was found between dietary selenium intake and diabetes (P for trend = 0.03).11
At the present time, therefore, inconsistencies are found in the literature regarding the roles of Se, dietary Se intake, and its antioxidant and anti-inflammatory properties in the pathophysiology of obesity and T2DM. Therefore, in the present study, we aimed to evaluate the relationships between Se status, assessed using the serum Se concentration, inflammation, the prevalence of prediabetes or T2DM, and obesity.
Materials and Methods
Study Sample
A health survey of the employees of the Electricity Generating Authority of Thailand (EGAT) began in 1985 with the first cohort, EGAT 1, which was followed by the second cohort, EGAT 2, recruited in 1998. The participants in EGAT 2 (N=655, aged 45–60 years) also participated in a re-survey in 2013. An overview of the study methods has been published previously.12
“The Asia-Pacific Perspective: Redefining Obesity and its Treatment” (2000) proposed cut-off values of BMI to define overweight and obesity for use in this region. In the present study, we allocated the participants to three groups according to the Asia-Pacific cut-off values of BMI: normal weight (18.5–22.9 kg/m2), overweight (23–24.9 kg/m2), and obese (≥25 kg/m2).13 Diabetes mellitus is a group of metabolic diseases characterized by hyperglycemia that results from defects in insulin secretion, insulin action, or both. We used the American Diabetes Association (ADA) recommendations for the diagnosis of T2DM and prediabetes, which is associated with a high risk of developing frank diabetes. Prediabetes was defined using a fasting plasma glucose concentration between 100 and 125 mg/dL or impaired glucose tolerance (IGT), identified as a 2-h plasma glucose concentration during a 75-g oral glucose tolerance test (OGTT) of between 140 and 199 mg/dL or a glycated hemoglobin (HbA1c) of between 5.7% and 6.4%. For T2DM, the acceptable criteria were a fasting plasma glucose ≥ 126 mg per dL, a 2-h plasma glucose ≥ 200 mg/dL during an OGTT, or an HbA1 ≥ 6.5%.14
The exclusion criteria were a diagnosis of, or medical treatment for, diabetes mellitus, hypertension, dyslipidemia, liver or kidney dysfunction, cardiovascular or endocrine disease, and the use of nutritional supplements (vitamin and mineral).
The general characteristics of the participants and details of lifestyle factors related to metabolic and cardiovascular disease and cancer were collected; including age; sex; educational level; occupation; tobacco smoking habits; alcohol consumption habits; and any family history of chronic metabolic disease, dementia, or cancer. All the participants underwent a physical examination, during which anthropometric and blood pressure measurements were performed by personnel who had been trained in the standardization of these procedures.
The study was performed in accordance with the principles of the Declaration of Helsinki and was approved by the ethics committee of the Faculty of Medicine Ramathibodi Hospital, Mahidol University (MU-RA2019/75). Written informed consent was obtained from all the participants.
Anthropometric Measurements
Anthropocentric measurements were made by well-trained personnel while the participants were minimally clothed and not wearing footwear. Body mass was measured using scales and height was measured using a wall-fixed tape measure, with the participants in a normal standing position. Waist circumference (WC) and hip circumference were measured using a metal tape measure, without placing any pressure on the body surface. The data were analyzed using the cut-off values for obesity in Asian people: a WC of 90 cm in men and 80 cm in women, and waist-to-hip ratio (WHR) cutoffs were defined as 0.95 in men and-0.80 in women.15
Biochemical Measurements
Venous blood samples were collected in the morning after an overnight fast (12 hours) and serum samples were separated and stored at −80°C for subsequent analysis. The HbA1c; the FBG, total cholesterol, TG, HDL-cholesterol, low-density lipoprotein (LDL)-cholesterol, urea nitrogen, creatinine, and uric acid concentrations, and the alanine aminotransferase (ALT), aspartate aminotransferase activities were measured using automated methods (Cobas-Mira, Roche, Milan, Italy). The serum hs-CRP and insulin concentrations were measured using immunoassays (Immulite 1000 System; Siemens Health Diagnostics, Deerfield, IL, USA). Insulin resistance and β-cell function were estimated using the homeostasis model assessments HOMA-IR and HOMA-β, respectively.16 HOMA-IR = (fasting insulin [mU/L] × fasting glucose [mmol/L])/22.5. HOMA-β = (20 × fasting insulin [mU/L])/(fasting glucose [mmol/L]). In the analysis of Se, 100 μL of serum or blood reference control were added to a polypropylene tube and further added 200 μL of approximately 65% nitric acid (HNO3) and 100 μL of hydrogen peroxide (H2O2). The mixture tubes were incubated in a water bath for 90 minutes at 60°C occasionally stirring in a heating system. After incubation, samples were cooled down by adding 2100 μL ultrapure water. The Se measurement was carried out in collision cell mode using H2 gas (3.5 mL/min) by using an Agilent 7700x ICP-MS (Agilent Technologies, Santa Clara, CA, USA) equipped with an ASX 250 autosampler. For each sample, data were acquired in triplicate and averaged.17
Statistical Analysis
Statistical analyses were performed using SPSS for Windows version 23.0 (IBM, Inc., Armonk, NY, USA). Data are presented as mean ± SD for continuous variables and frequency (%) for categorical variables. Continuous variables were evaluated using the Kolmogorov-Smirnov test for normality, and skewed data were log-transformed. Continuous data were compared between groups using one-way ANOVA. Non-standardized and standardized regression coefficients were calculated, with adjustment for parameters in model 1 (age) and model 2 (age, hypertension status, dyslipidemia, metabolic syndrome [MetS] status, and lifestyle factors, such as cigarette smoking and alcohol consumption). Binary logistic regression analysis was performed to identify potential risk factors for prediabetes and T2DM, and their ORs were calculated. Associations of parameters with the lowest and highest tertiles of serum Se and with hs-CRP ≤ or > 3.0 mg/L were identified using logistic regression. The findings were considered to be statistically significant when P was <0.05. Moreover, association between significant data and proposed mechanisms involving signaling cascades has been analyzed by STITCH which is a database of protein–chemical interactions.18
Results
The study sample consisted of 655 Thai men, of whom 200 were of normal weight, 165 were overweight, and 290 were obese. The mean age for the three groups did not differ. The general characteristics, anthropometric parameters, and risk factors for T2DM of the participants are presented in Table 1. Statistically significant differences in BMI, WC, and waist/hip ratio were observed between each group. Furthermore, the systolic and diastolic BPs of the obese group were significantly higher than those of the normal-weight and overweight groups (all P <0.05). The percentages of the participants who were cigarette smokers and consumers of alcohol did not differ between the groups.
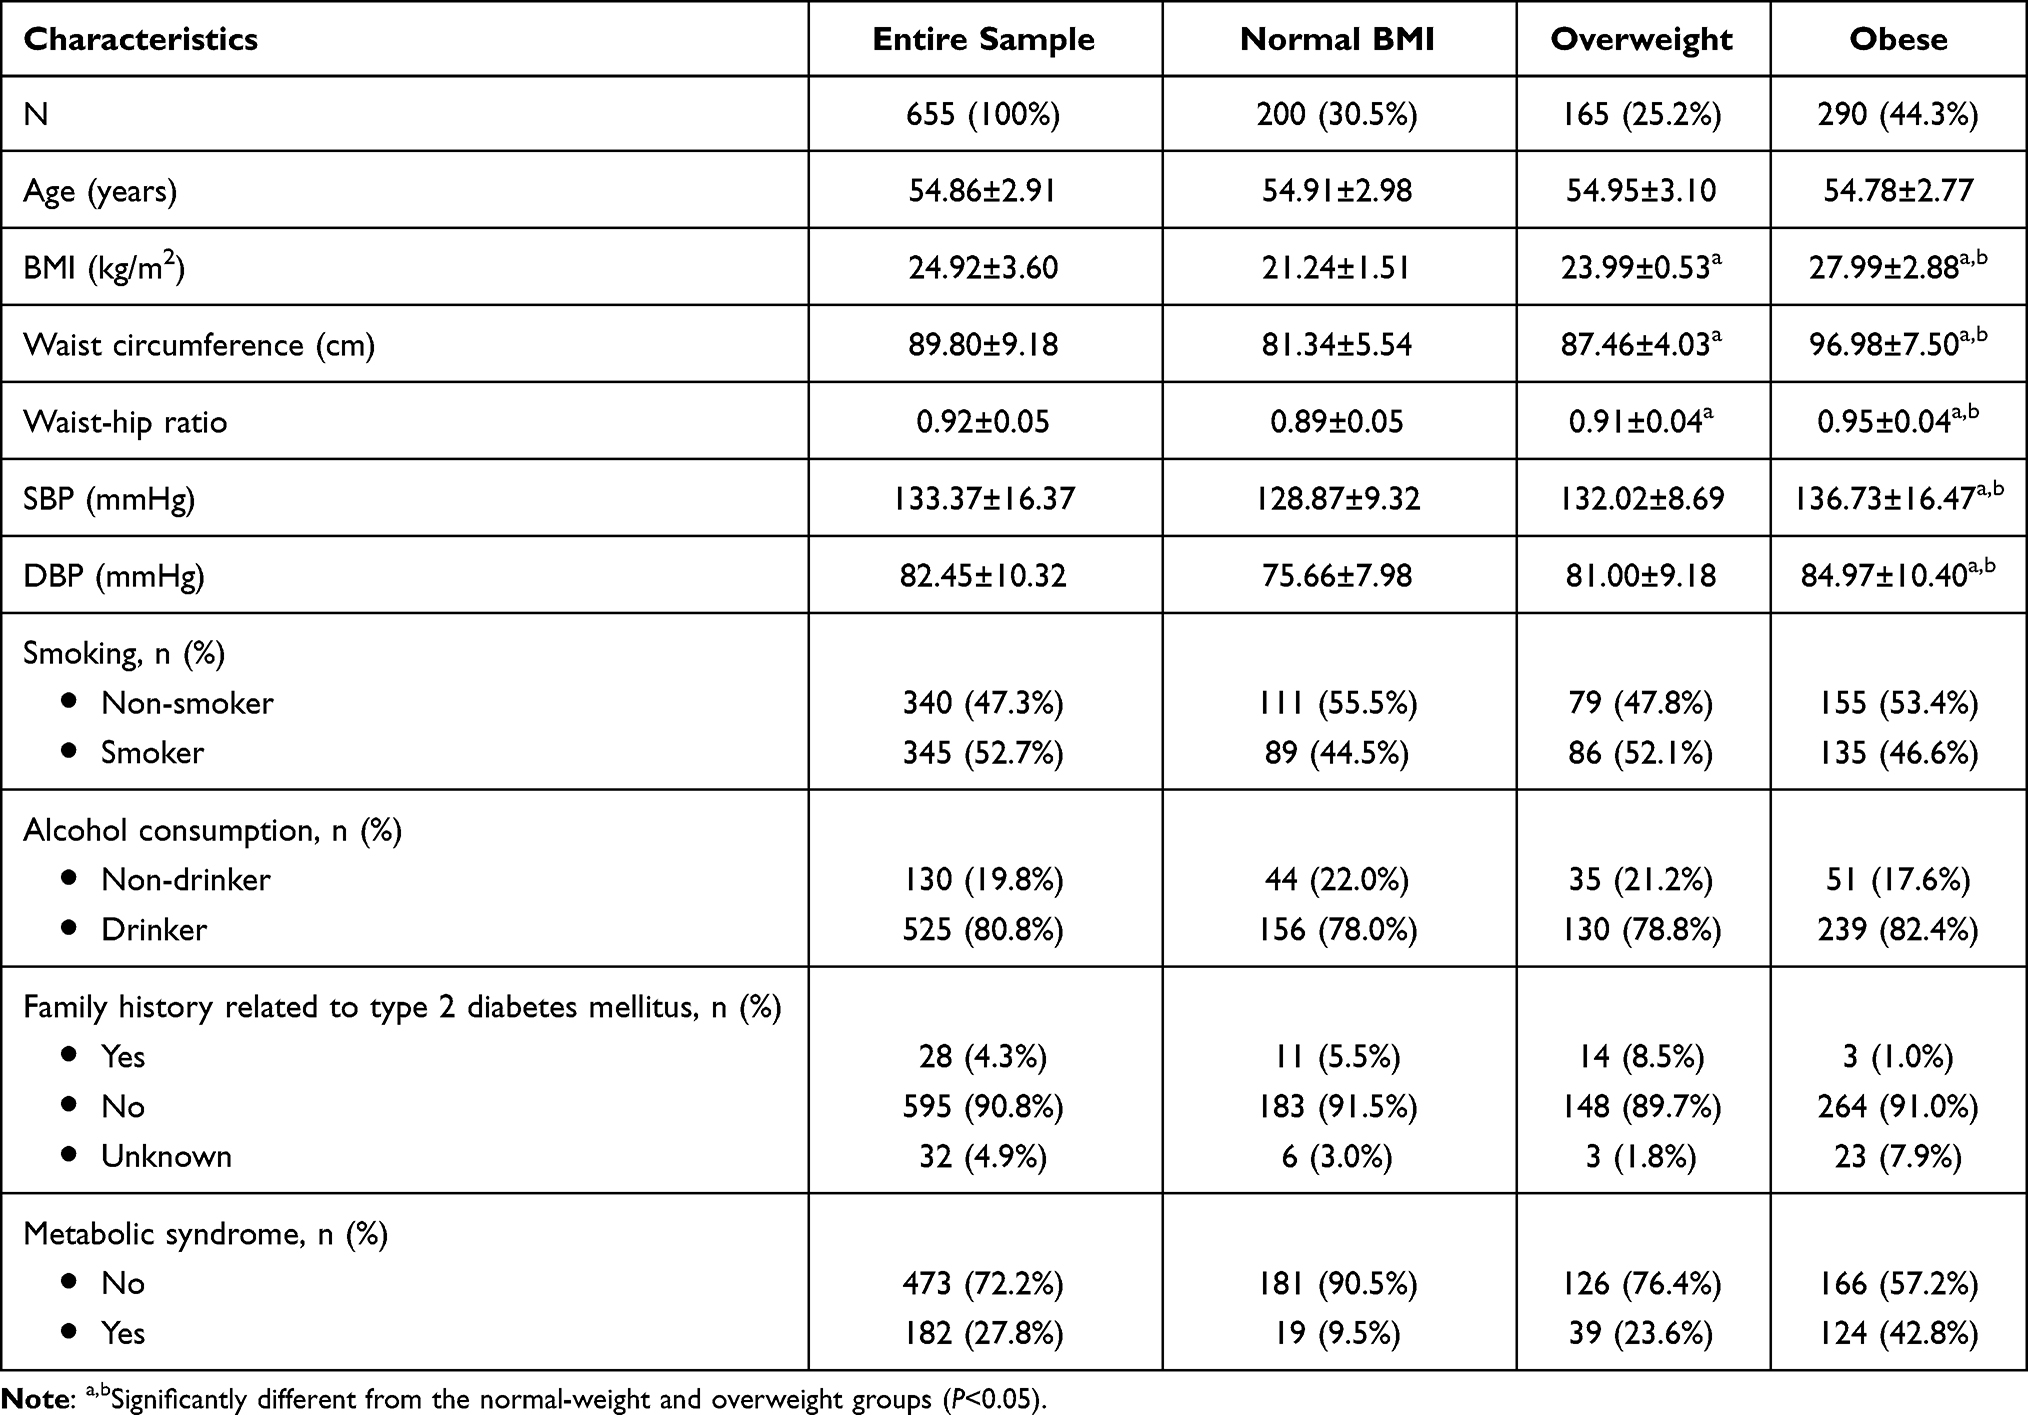 |
Table 1 General Characteristics of the Study Sample (n=655) |
We next determined the extent to which the association of T2DM with a family history of the disease was mediated by obesity status, and found no difference in the association between the prevalence of T2DM and a family history among the three groups. However, MetS was found to be strongly associated with prediabetes and T2DM: the highest prevalence of MetS was found in the obese group (42.8%), followed by the overweight group (23.6%) and the normal-weight group (9.5%).
Multiple factors are involved in the development and progression of T2DM, and we also determined the association of these metabolic factors with obesity status (Table 2). There were significant differences (P<0.05) between the FBG of the obese group and those of the normal-weight and overweight groups. HbA1c was significantly higher (P<0.05) in the obese group (6.02±0.67 mg/dL) than in the normal-weight (5.45±0.75 mg/dL) and overweight (5.46±0.38 mg/dL) groups. Additionally, the highest insulin concentration and HOMA-IR values were found in individuals with obesity, followed by those who were overweight, and these significantly differed from those of the normal-weight group. Another component of the metabolic syndrome is dyslipidemia, which is closely related to obesity and T2DM. The concentrations of TG and LDL-C were higher in obese participants than in normal-weight participants (all P<0.05). In contrast, the HDL-C concentration was significantly lower in the obese group than in the normal-weight group (50.76±11.54 vs 59.86±15.73 mg/dL, P<0.05).
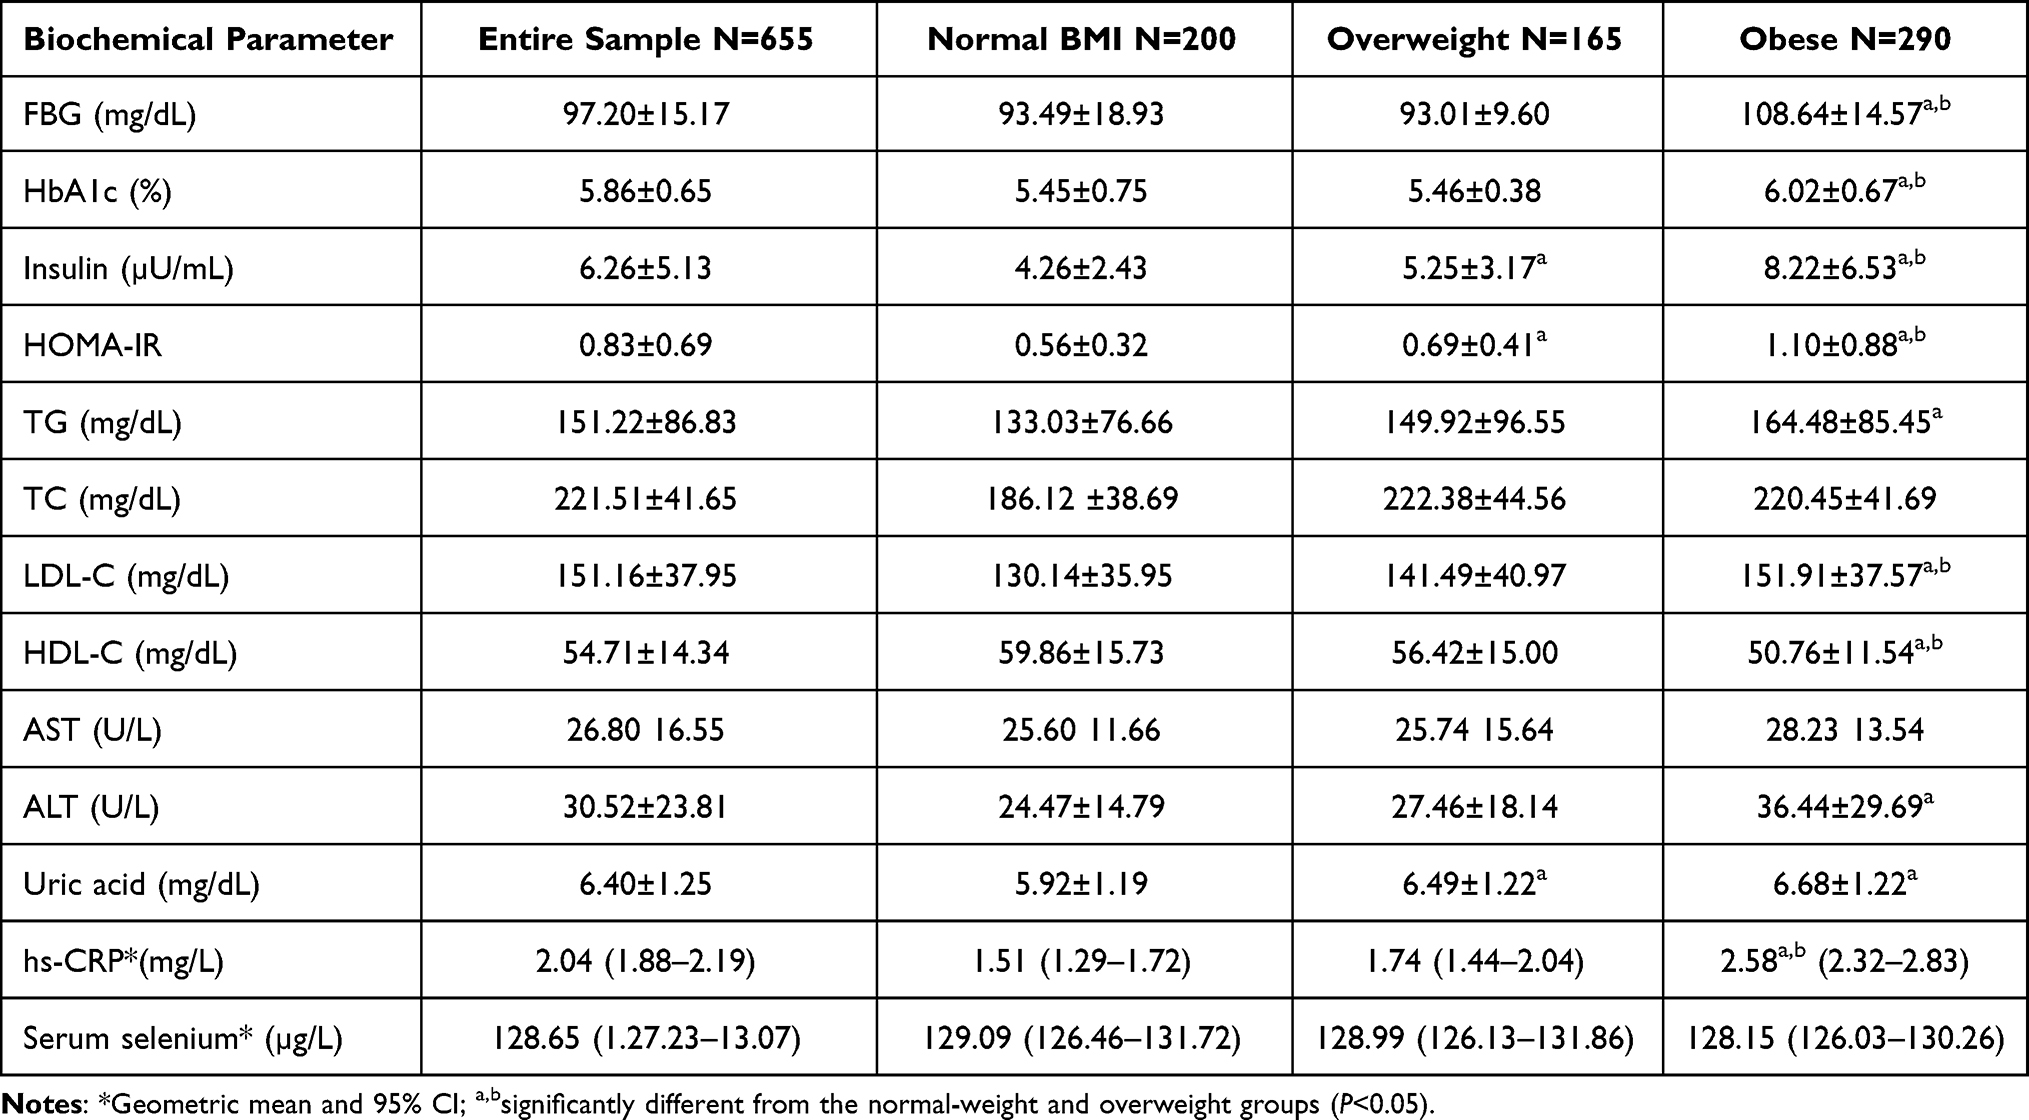 |
Table 2 Biochemical Parameters That are Related to the Risk of Prediabetes/T2DM in the Study Sample |
We also found associations of high serum aminotransferase activities with T2DM and metabolic syndrome. The serum ALT activity of obese participants was significantly higher than those of normal-weight participants and overweight participants (P<0.05). Furthermore, the serum uric acid concentration was higher in the obese and overweight groups than in the normal-weight group (P<0.05). The link between inflammation and obesity/T2D is well documented. Therefore, we also determined whether there were relationships between T2DM and the serum hs-CRP or selenium concentrations, and whether these would be independent of obesity. The obese participants had a statistically higher geometric mean hs-CRP (2.58 mg/L) than either normal-weight (1.51 mg/L) or overweight (1.74 mg/L) participants (P<0.05). However, there were no significant differences in serum Se among the normal-weight, overweight, and obese groups.
The prevalence of prediabetes or T2DM in participants in the three tertiles of serum Se (T1 = 83.79–120.70 µg/L, T2 =120.71–133.83 µg/L, and T3=133.84–228.09 µg/L) was shown in Figure 1. The prevalence of prediabetes and T2DM increased from the lowest tertile to the highest tertile (20.7%, 37.7%, and 41.6%, respectively). Furthermore, the prevalence of prediabetes or T2DM in participants with a high circulating concentration of hs-CRP (≥3 mg/L) was higher than in those with a lower hs-CRP (50.6% vs 39.1%).
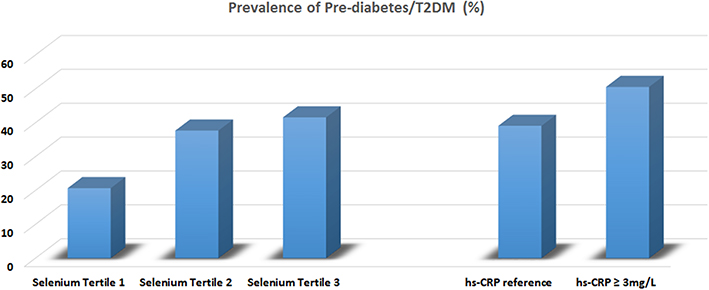 |
Figure 1 Prevalence of pre-diabetes/T2DM classified by tertiles of serum selenium and clinical cut-off level of hs-CRP. |
Further analysis of the relationships between serum Se and hs-CRP and T2DM in the three groups are presented in Table 3. Non-standardized and standardized regression coefficients are presented for the relationships between FBG or HbA1C per 1 SD increment in serum Se. Increasing serum Se was associated with significant differences in FBG, after adjustment for age (Model 1) in all the groups (β=0.157, P=0.000 for the entire sample; β=0.149, P=0.035 for the normal-weight group; β=0.112, P=0.037 for the overweight group; and β=0.179, P=0.002 for the obesity group). For HbA1c, significant differences in serum Se were identified in the entire sample (β=0.102, P=0.009) and in the obesity group (β=0.173, P=0.003).
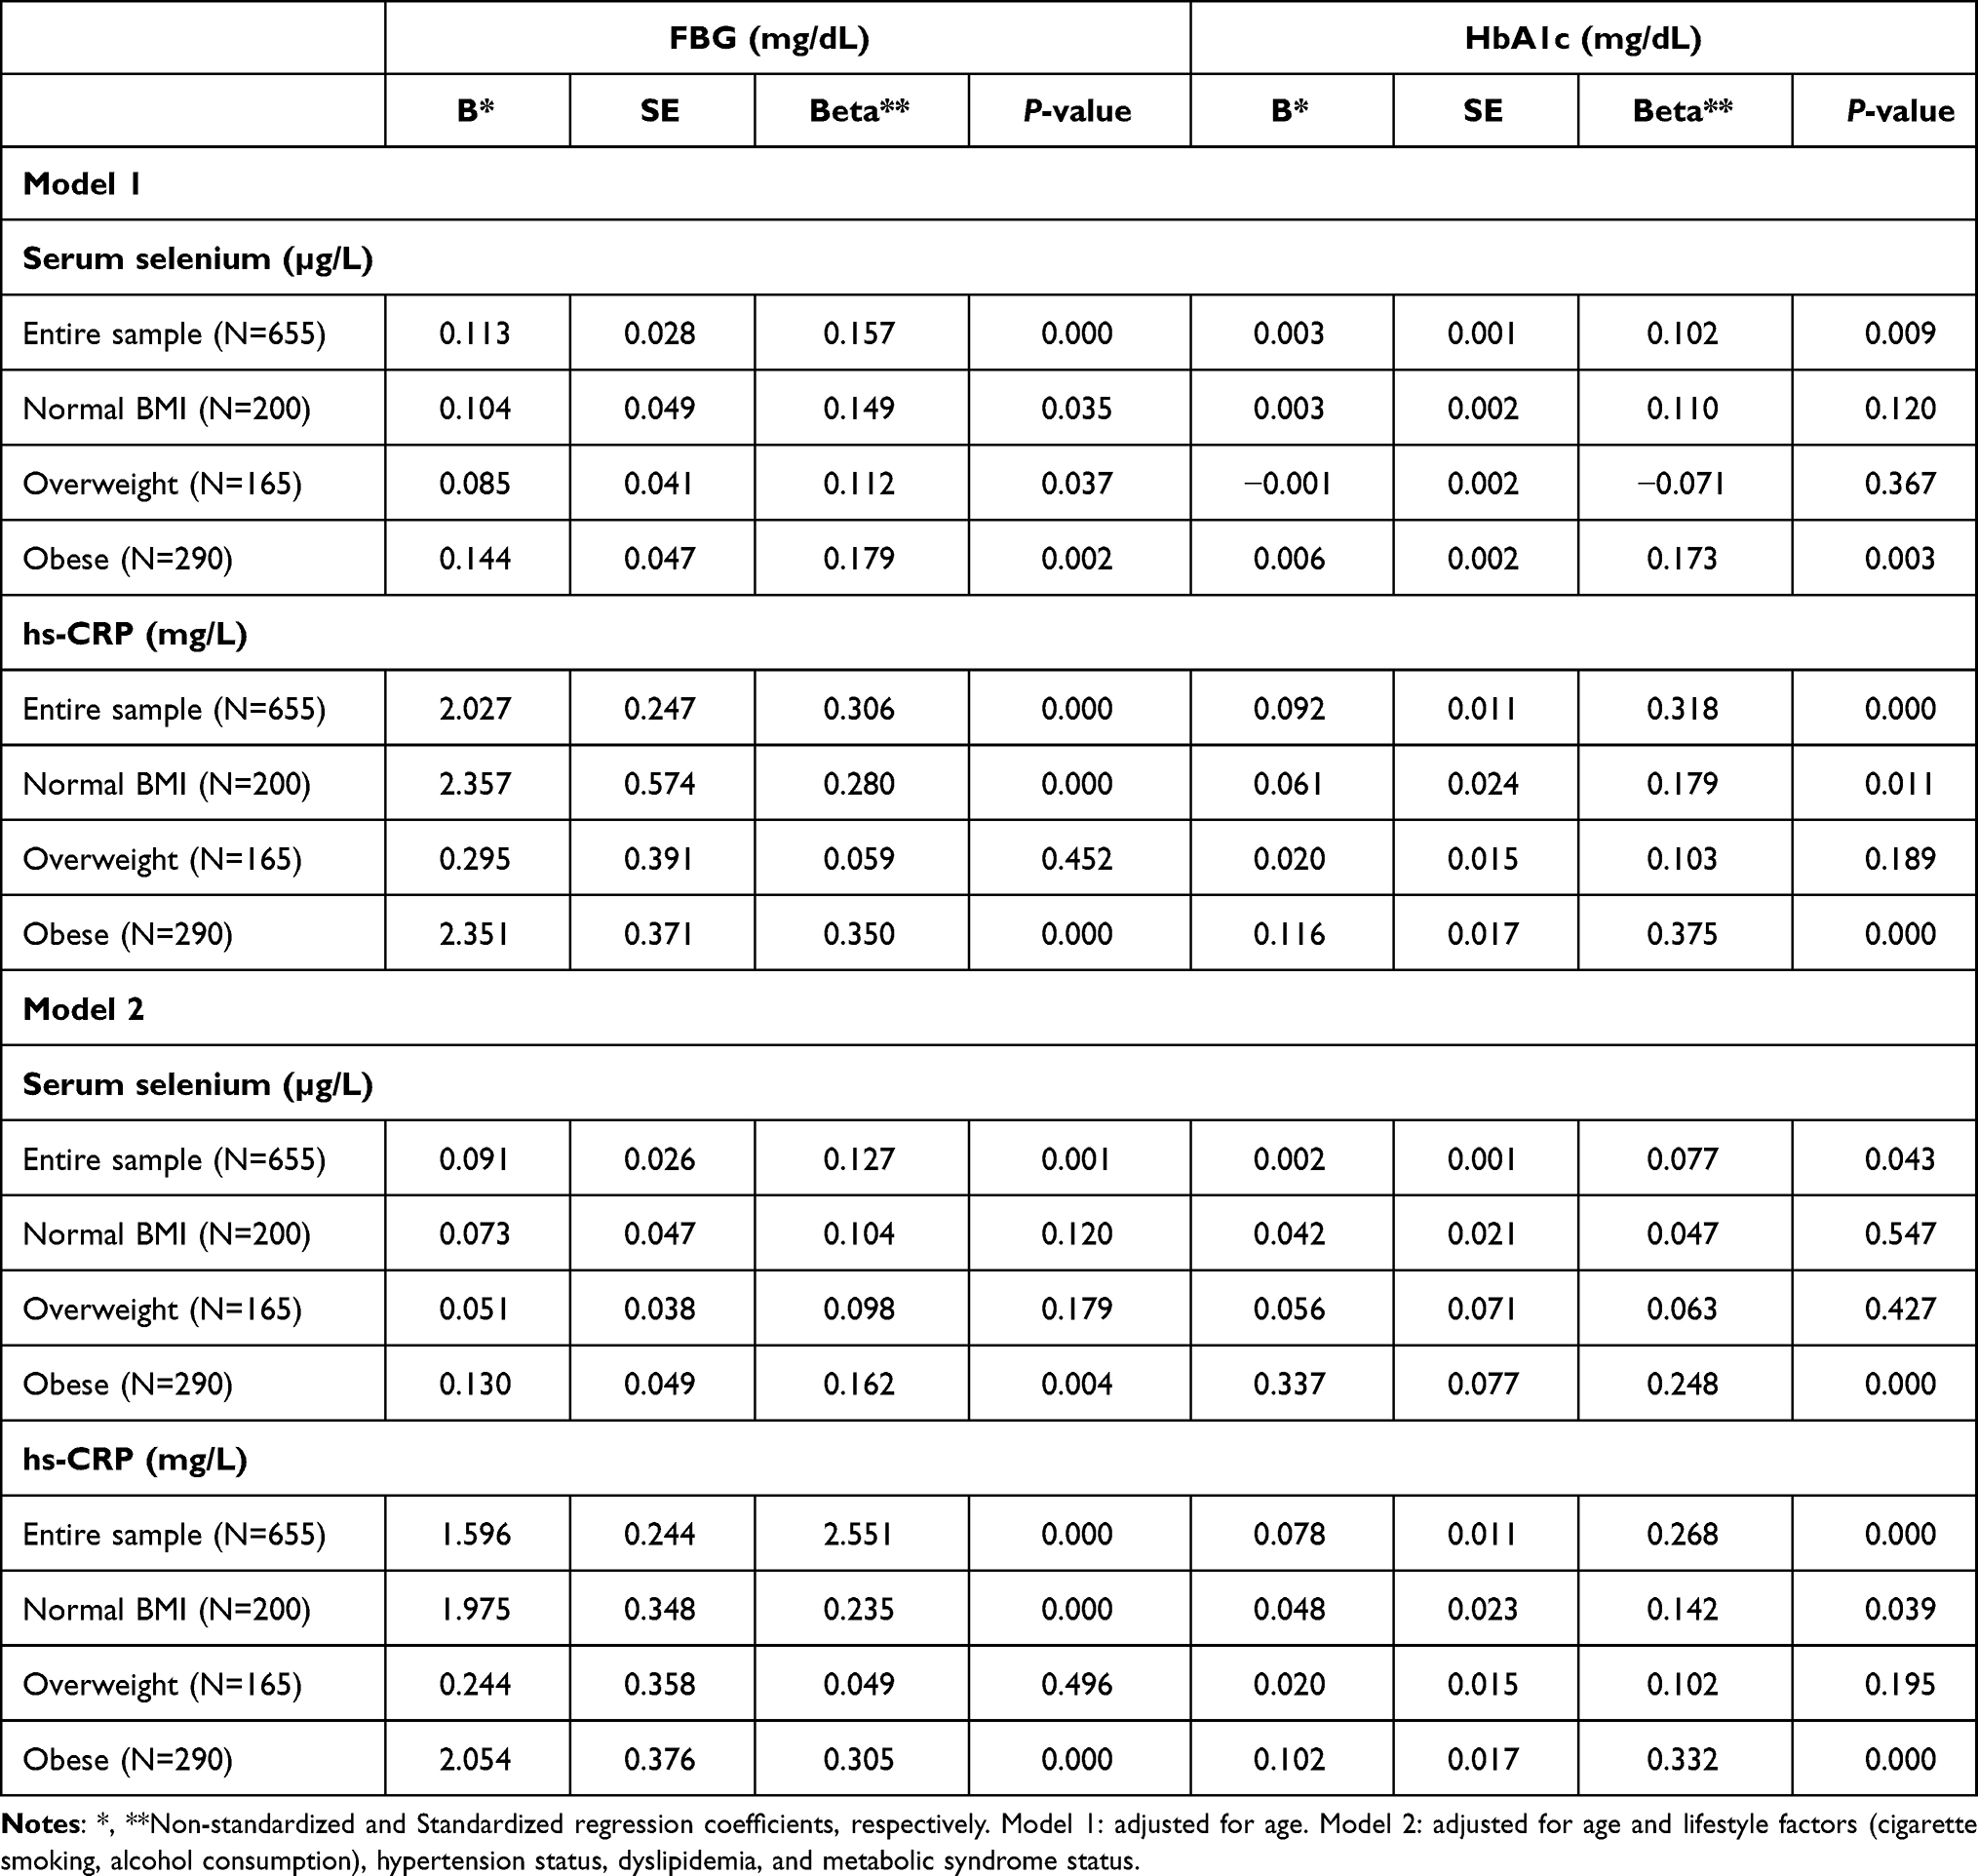 |
Table 3 Relationships Between the Circulating Selenium and hs-CRP Concentrations and FBG and HbA1c in the Three BMI Groups |
We also determined the relationship between chronic subclinical low-grade inflammation and the presence of T2DM. High hs-CRP was associated with high HbA1c in the entire sample (β=0.306, P=0.000) and in the overweight (β=0.280, P=0.000) and obese (β=0.350, P=0.000) groups after the data were adjusted for age. In model 2, additional adjustment was performed for lifestyle factors (cigarette smoking and alcohol consumption), hypertension status, dyslipidemia, and metabolic syndrome status, and the results showed that the relationships of serum Se with FBG and HbA1c remained in the entire sample (β=0.127, P=0.001 for FBG and β=0.077, P=0.043 for HbA1c) and in the obesity group (β=0.162, P=0.004 for FBG and β=0.248, P=0.000 for HbA1c). There were also linear relationships of hs-CRP with FBG and HbA1c in the entire sample, and in the normal-weight and obese groups (FBG: β=2.551, P=0.000; β=0.235, P=0.000; and β=0.305, P=0.000, respectively); and HbA1c (β=0.268, P=0.000; β=0.142, P=0.039; and β=332, P=0.000, respectively) after adjustment for confounding factors.
The ORs (95% CIs) for prediabetes/diabetes, categorized using FBG, according to the tertile of serum Se in the entire sample and in the three BMI groups are shown in Figure 2. After adjustment for age, lifestyle factors (cigarette smoking and alcohol consumption), hypertension status, dyslipidemia, and metabolic syndrome status, these associations remained with the adjusted OR 1.703, 95% CI 1.094–2.657 (P=0.018) for the entire sample and adjusted OR 2.711, 95% CI 1.482–4.958 (P=0.001) for the obesity group. However, with respect to low-grade inflammation (hs-CRP > 3 mg/L), there were no significant associations with abnormal glucose status (all P-values > 0.05).
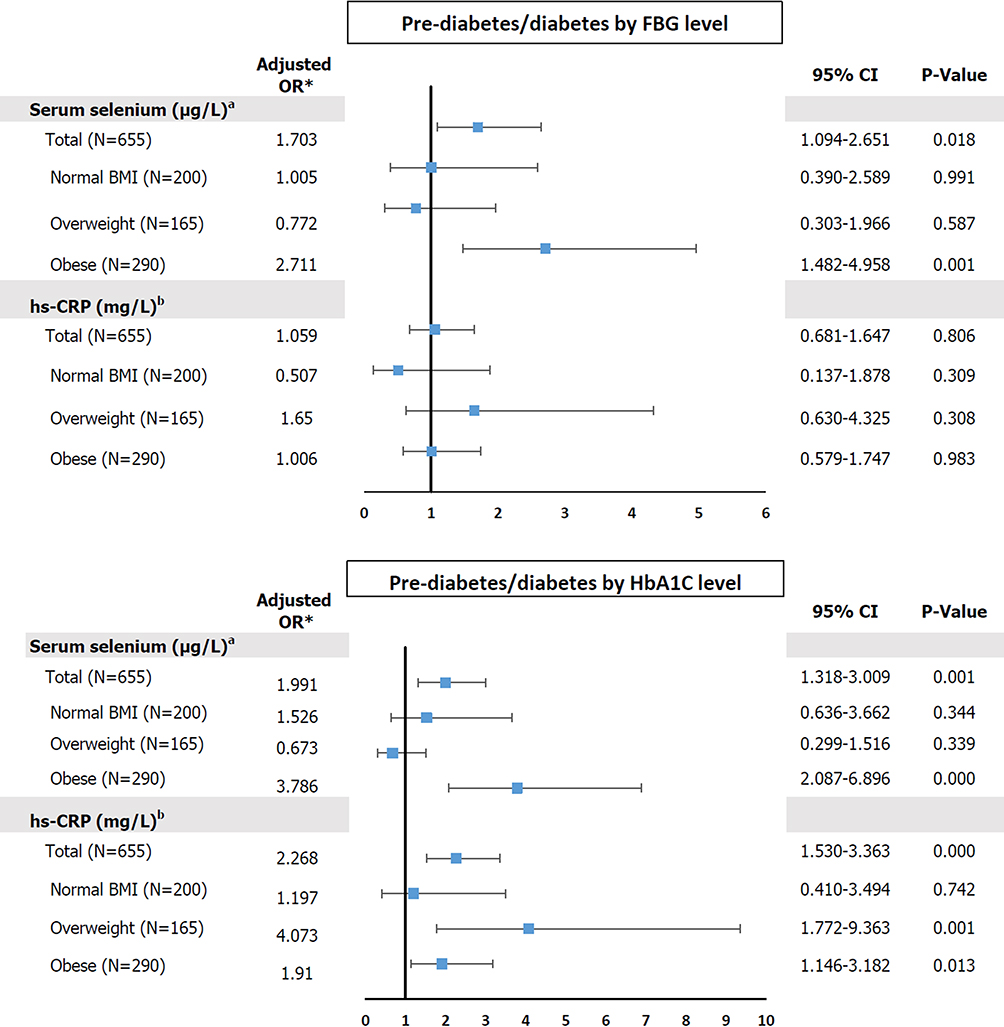 |
Figure 2 Odds ratios for prediabetes/diabetes and serum selenium and hs-CRP levels among entire sample and subgroups of study population. Notes: *Adjusted for age, lifestyle factors (cigarette smoking and alcohol consumption, hypertension status, dyslipidemia, and metabolic syndrome status. aThe highest and lowest tertiles of serum selenium = 133.84–228.09 µg/L and 83.79–120.70 µg/L, respectively. bThe reference value of hs-CRP; ≤ 3 mg/L). |
When the prevalence of prediabetes/diabetes was determined using HbA1c cut-off values, high serum Se in both the entire sample and the obesity group was found to be associated with abnormal glucose status (adjusted OR 1.991, 95% CI 1.318–3.009 and adjusted OR 3.786, 95% CI 2.087–6.896, respectively). Furthermore, hs-CRP > 3 mg/L was associated with a higher prevalence of prediabetes/T2DM in the entire sample (adjusted OR 2.268, 95% CI 1.530–3.363), and in the overweight (adjusted OR 4.073, 95% CI 1.772–9.363) and obese (adjusted OR 1.910, 95% CI 1.146–3.182) groups. These associations remained significant in the binary-adjusted model in each of the three groups.
Discussion
In the present study, the identified associations of obesity with hypertension, dyslipidemia, and T2DM replicated those identified previously. Both BMI and WC/waist‐to‐hip ratio were associated with hypertension, as shown in Table 1. A positive linear association between BP and BMI has also been shown in a large Chinese study of participants aged 35–80 years, across a BMI range of 18.5–30.0 kg/m2. Furthermore, each 1-kg/m2 increase in BMI was associated with a 1.3-mm Hg increase in BP in men and a 1.4-mm Hg increase in women.19 These relationships may be explained by lipotoxicity-induced endothelial cell dysfunction, inflammation, oxidative stress, and mitochondrial dysfunction.20
Excess adipocyte hypertrophy and hyperplasia may contribute to the pathogenesis of metabolic diseases through cellular damage (endoplasmic reticulum stress and mitochondrial dysfunction), abnormal fatty acid metabolism (high circulating free fatty acid concentrations), abnormal endocrine responses in adipose tissue (high leptin, high TNF-α, and low adiponectin), and abnormal interactions with non-adipose tissues, such as liver, muscle, and possibly pancreas. Furthermore, the lipotoxicity that is associated with adipose tissue dysfunction may underlie metabolic syndrome, fatty liver, hyperglycemia, hypertension, hypertriglyceridemia, and low HDL-C levels.21 In the present study, we found significantly higher TG and LDL-C, and lower HDL-C concentrations in the obesity group than in the normal BMI group (Table 2). Additionally, obese participants who had T2DM and dyslipidemia also had higher serum hs-CRP than those who did not. These findings are consistent with the activation of pro-inflammatory pathways, with greater secretion of pro-inflammatory cytokines, such as TNF-α and IL-6, in obese individuals. High circulating cytokine concentrations are closely linked to high hs-CRP, and disrupt glucose and lipid metabolism, reduce glucose tolerance, impair insulin signaling, increase insulin resistance, impair beta-cell function, increase lipolysis, increase TG synthesis, and increase de novo lipogenesis.22
To our knowledge, this is the first study to be specifically designed to evaluate the relationship between serum Se concentration and a range of metabolic syndrome components in a large number of adult Thais. Se status is usually determined through the measurement of serum Se level or of the activity of the important selenoprotein glutathione peroxidase (GPx), including in the present study. We found no significant differences in serum Se between the normal BMI, overweight, and obese groups (Table 2), but in contrast, the US Third National Health and Nutrition Examination Survey identified differences in serum Se between the highest and lowest quartiles of BMI of −4.0 ng/mL (−5.5 to −1.6 ng/mL) in both men and women.23 The mechanisms underlying the link between Se and the level of adiposity remain to be fully determined, but previous experimental studies have shown that Se inhibits adipogenesis by reducing the expression of peroxisome proliferator-activated receptor-γ and fatty acid synthase,9 and that this reduces abdominal fat accumulation and adipocyte size.24
The link between selenium and obesity and T2DM may involve abnormal metabolism in adipose tissue, with the excess release of free fatty acids and/or hormones including leptin, adiponectin, cytokines, and pro-inflammatory proteins. In the present study, high Se and hs-CRP concentrations were found to be associated with T2DM (Figure 1). Moreover, multiple linear regression analysis (Table 3) showed relationships between high FBG or HbA1c and high concentrations of Se and hs-CRP in various BMI groups after adjustment for potential confounders. Furthermore, the adjusted ORs for the relationship of prediabetes and T2DM with Se were also significant. Serum Se was positively correlated with FBG in both the entire sample (T3 vs T1, adjusted OR 1.703, 95% CI 1.094–2.651) and in the obesity group (T3 vs T1, adjusted OR 2.711, 95% CI 1.482–4.958). Similar associations were also identified using HbA1c.
We also studied the relationships of hs-CRP with FBG and HbA1C. A higher prevalence of prediabetes/T2DM was identified in participants with a high hs-CRP concentration (≥ 3 mg/L) in the overweight and obese groups (Figure 2). These findings are comparable to those of a nested case-control study of middle-aged and older Chinese adults, which generated ORs for metabolic syndrome in the highest tertile of serum Se of 2.72 (95% CI 1.43–5.20, P for trend 0.002) for men and 5.30 (95% CI 3.31–8.74, P for trend <0.001) for women, compared with the lowest tertile.25 Furthermore, a study conducted by Labunskyy et al showed that Se-supplementation of the diet of C57BL/6J mice caused hyperinsulinemia and reduced insulin sensitivity because of high expression of certain selenoproteins.26
The relationship between Se and T2DM in both animals and humans remains ambiguous because positive associations, negative associations, and a lack of association have been identified in previous studies. This may be because the relationship is U-shaped; because of differing epidemiological research methods, sample sizes, Se biomarker use; or because of single nucleotide polymorphisms in selenoprotein genes. With respect to the molecular pathways that might underlie the associations between Se, hs-CRP, and abnormal glucose metabolism, we propose the involvement of obesity-induced adipose tissue expansion and chronic inflammation, which lead to insulin resistance and T2DM.27 The link between obesity and T2DM involves oxidative stress28 and the effect of Se, through selenoproteins (such as selenoprotein P, selenoprotein S, VCP-interacting membrane protein, and GPx), on the insulin signaling pathway in liver and muscle.29,30 High plasma Se and selenoprotein P concentrations are associated with biomarkers of diabetes. Se has been shown to antagonize the effects of insulin mainly through GPx1 and selenoprotein P, via an inhibition of the insulin-induced phosphorylation of protein kinase B.29 A gene expression profiling study of human liver samples from patients with T2DM and non-diabetic surgical patients showed that the metabolic effects of selenoprotein P were mediated, at least in part, through inactivation of AMP-activated protein kinase.30 The links between Se, hs-CRP, and other molecules linked to obesity and T2DM were predicted using STITCH 4 (an interaction network database for small molecules and proteins) and are shown in Figure 3.18
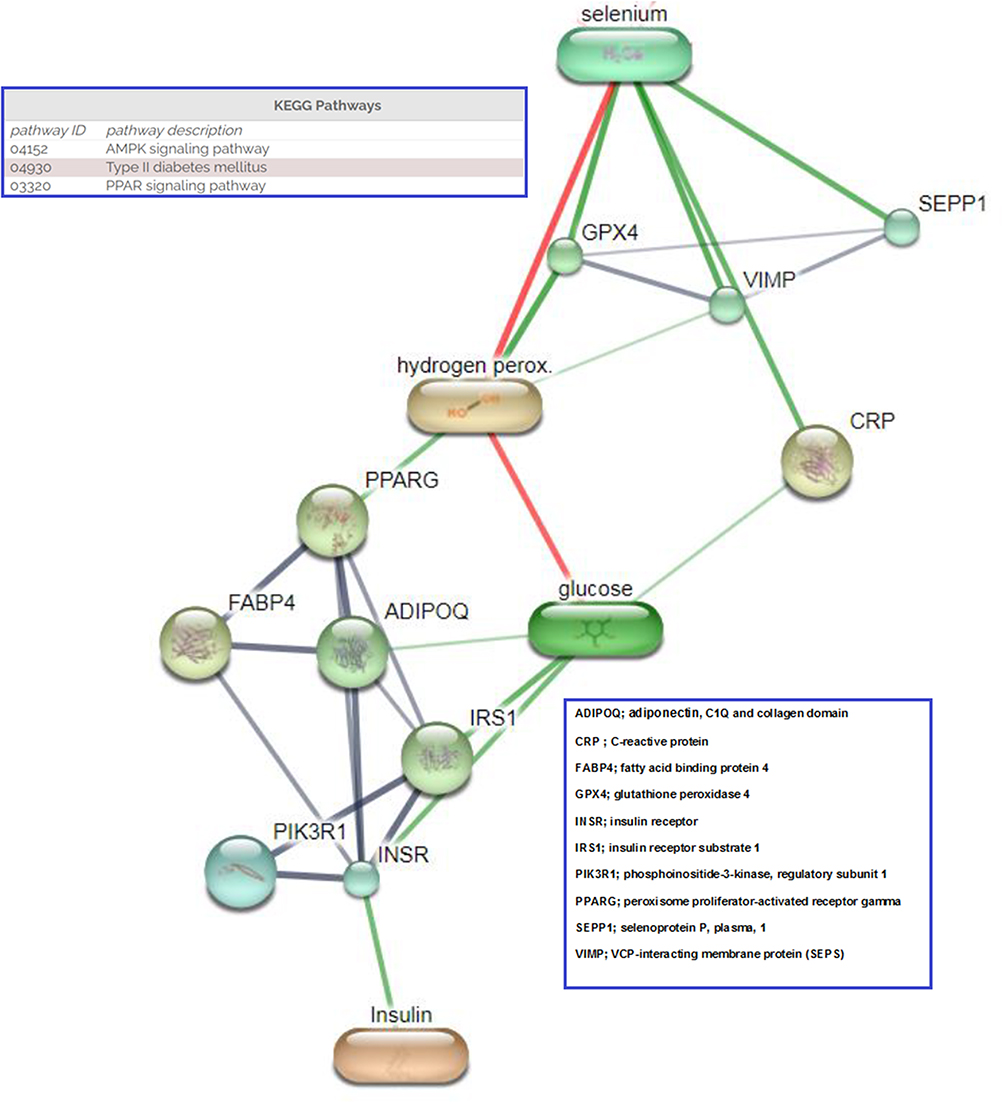 |
Figure 3 Proposed interaction between selenium, CRP and network proteins related to pre-diabetes and diabetes. (Stronger associations are represented by thicker lines. Protein–protein interactions are shown in grey, chemical–protein interactions in green and interactions between chemicals in red). |
The present study had several strengths. These included the rigorous methodology, the detailed quality control procedures that were performed during the EGAT Study, and the large sample size. This is the first study conducted in Thailand to demonstrate the relationships between Se, metabolic disease, and the associated risk factors. Most previous studies that have shown such associations have been performed in Western countries, and therefore differ in the geographic location, and ethnicity and dietary habits of the participants, all of which may influence the outcomes.
This study also had several limitations. First, the cross-sectional design does not permit us to extrapolate causal relationships between Se status, obesity, and T2DM. Therefore, prospective cohort studies are needed to further explore these relationships. Second, the participants, who underwent a health examination in the EGAT Study, may not be representative of the general population. Because of this, multivariable linear and logistic regression analysis, with adjustment for potential confounders, and a large sample size were used. Third, details of the dietary intake of Se, daily micronutrient supplementation, and general dietary pattern were not recorded, and all of these factors might have influenced serum Se concentration. Finally, selenoproteins, which reflect Se function in the human body, were not measured. Therefore, in the future, the concentrations or activities of a number of selenoproteins should be measured, in an attempt to corroborate the identified link between selenium and T2DM.
Conclusion
The present findings suggest that selenium status is linked to obesity, and therefore that this micronutrient may influence adipocyte physiology and modify the risk of developing T2DM. However, the underlying mechanisms require further investigation.
Abbreviations
ADIPOQ, adiponectin, C1Q and collagen domain; ALT, alanine aminotransferase; AST, aspartate aminotransferase; BMI, Body mass index; 95% CI, 95% confidence interval; CVD, cardiovascular diseases; FABP4, fatty acid binding protein 4; FBG, fasting blood glucose; GPx, glutathione peroxidase; HbA1C, glycated haemoglobin; HOMA, homeostatic model assessment; hs-CRP, high sensitive-C-reactive protein; ICP-MS, inductively coupled plasma mass spectrometry; IGT, impaired glucose tolerance; IL-1, interleukin 1 receptor antagonist; IL-6, interleukin 6; INSR, insulin receptor; IR, insulin resistance; IRS1, insulin receptor substrate 1; MetS, metabolic syndrome MetS; OGTT, oral glucose tolerance test; ORs, odd ratios; PIK3R1, phosphoinositide-3-kinase, regulatory subunit 1; PPARG, peroxisome proliferator-activated receptor gamma; Se, selenium; SEPP1, selenoprotein P, plasma, 1; SEPS, Selenoprotein S; T2DM, Type 2 diabetes; TNF-α, tumor necrosis factor α; VIMP, VCP-interacting membrane protein; WC, waist circumference; WHR, waist-to-hip ratio.
Acknowledgments
We thank all the EGAT Study participants and staff, Faculty of Medicine, Ramathibodi Hospital, Mahidol University.
Funding
This work was funded by the project of Higher Education Research Promotion and National Research University Development, Office of the Higher Education Commission.
Disclosure
The authors report no conflicts of interest associated with this work.
References
1. Centers for Disease Control and Prevention. National Diabetes Statistics Report, 2020. Atlanta: Centers for Disease Control and Prevention, US Department of Health and Human Services; 2020.
2. Kasuga M. Insulin resistance and pancreatic β cell failure. J Clin Invest. 2006;116(7):1756–1760. doi:10.1172/JCI29189
3. Eckel RH, Kahn SE, Ferrannini E, et al. Obesity and type 2 diabetes: what can be unified and what needs to be individualized? J Clin Endocrinol Metab. 2011;96(6):1654–1663. doi:10.1210/jc.2011-0585
4. Rydén M, Andersson DP, Bergström IB, Arner P. Adipose tissue and metabolic alterations: regional differences in fat cell size and number matter, but differently: a cross-sectional study. J Clin Endocrinol Metab. 2014;99(10):E1870–E1876. doi:10.1210/jc.2014-1526
5. Virtue S, Vidal-Puig A. Adipose tissue expandability, lipotoxicity and the metabolic syndrome—an allostatic perspective. Biochim Biophys Acta Mol Cell Biol Lipids. 2010;1801(3):338–349. doi:10.1016/j.bbalip.2009.12.006
6. Ellulu MS, Patimah I, Khaza’ai H, et al. Obesity and inflammation: the linking mechanism and the complications. Arch Med Sci. 2017;4(4):851. doi:10.5114/aoms.2016.58928
7. Herder C, Faech K, Carstensen-Kirberg M, et al. Biomarkers of subclinical inflammation and increases in glycaemia, insulin resistance and beta-cell function in non-diabetic individuals: the Whitehall II study. Eur J Endocrinol. 2016;175(5):367–377. doi:10.1530/EJE-16-0528
8. Huang Z, Rose AH, Hoffmann PR. The role of selenium in inflammation and immunity: from molecular mechanisms to therapeutic opportunities. Antioxid Redox Signal. 2012;16(7):705–743. doi:10.1089/ars.2011.4145
9. Kim CY, Kim GN, Wiacek JL, et al. Selenate inhibits adipogenesis through induction of transforming growth factor-β1 (TGF-β1) signaling. Biochem Biophys Res Commun. 2012;426(4):551–557. doi:10.1016/j.bbrc.2012.08.125
10. Othman FB, Mohamed HJBJ, Sirajudeen KNS, et al. The influence of selenium status on body composition, oxidative DNA damage and total antioxidant capacity in newly diagnosed type 2 diabetes mellitus: a case-control study. J Trace Elem Med Biol. 2017;43:106–112. doi:10.1016/j.jtemb.2016.12.009
11. Wei J, Zeng C, Gong QY, et al. The association between dietary selenium intake and diabetes: a cross-sectional study among middle-aged and older adults. Nutr J. 2015;14:18. doi:10.1186/s12937-015-0007-2
12. Vathesatogkit P, Woodward M, Tanomsup S, et al. Cohort profile: the electricity generating authority of Thailand study. Int J Epidemiol. 2012;41(2):359–365. doi:10.1093/ije/dyq218
13. Weisell RC. Body mass index as an indicator of obesity. Asia Pac J Clin Nutr. 2002;11:S681–S684. doi:10.1046/j.1440-6047.11.s8.5.x
14. Pippitt K, Li M, Gurgle HE. Diabetes mellitus: screening and diagnosis. Am Fam Physician. 2016;93(2):103–109.
15. Zimmet PZ, Alberti KG. Introduction: globalization and the non-communicable disease epidemic. Obesity. 2006;14(1):1. doi:10.1038/oby.2006.1
16. Matthews D, Hosker J, Rudenski A, et al. Homeostasis model assessment: insulin resistance and β-cell function from fasting plasma glucose and insulin concentrations in man. Diabetologia. 1985;28(7):412–419. doi:10.1007/BF00280883
17. Bumoko GM, Sadiki NH, Rwatambuga A, et al. Lower serum levels of selenium, copper, and zinc are related to neuromotor impairments in children with Konzo. J Neurol Sci. 2015;349(1–2):149–153. doi:10.1016/j.jns.2015.01.007
18. Kuhn M, Szklarczyk D, Pletscher-Frankild S, et al. STITCH 4: integration of protein–chemical interactions with user data. Nucleic Acids Res. 2014;42(D1):D401–D407. doi:10.1093/nar/gkt1207
19. Linderman GC, Lu J, Lu Y, et al. Association of body mass index with blood pressure among 1.7 million Chinese adults. JAMA Netw Open. 2018;1(4):e181271. doi:10.1001/jamanetworkopen.2018.1271
20. Wende AR, Symons JD, Abel ED. Mechanisms of lipotoxicity in the cardiovascular system. Curr Hypertens Rep. 2012;14(6):517–531. doi:10.1007/s11906-012-0307-2
21. Bays HE, Toth PP, Kris-Etherton PM, et al. Obesity, adiposity, and dyslipidemia: a consensus statement from the National Lipid Association. J Clin Lipidol. 2013;7(4):304–383.
22. Shi J, Fan J, Su Q, et al. Cytokines and abnormal glucose and lipid metabolism in type 2 diabetes. Front Endocrinol (Lausanne). 2019;10:703.
23. Zhong Q, Lin R, Nong Q. Adiposity and serum selenium in US adults. Nutrients. 2018;10(6):727. doi:10.3390/nu10060727
24. Kim JE, Choi SI, Lee HR, et al. Selenium significantly inhibits adipocyte hypertrophy and abdominal fat accumulation in OLETF rats via induction of fatty acid β-oxidation. Biol Trace Elem Res. 2012;150(1–3):360–370. doi:10.1007/s12011-012-9519-1
25. Fang C, Wu W, Gu X, et al. Association of serum copper, zinc and selenium levels with risk of metabolic syndrome: a nested case-control study of middle-aged and older Chinese adults. J Trace Elem Med Biol. 2019;52:209–215. doi:10.1016/j.jtemb.2018.12.017
26. Labunskyy VM, Lee BC, Handy DE, et al. Both maximal expression of selenoproteins and selenoprotein deficiency can promote development of type 2 diabetes-like phenotype in mice. Antioxid Redox Signal. 2011;14(12):2327–2336. doi:10.1089/ars.2010.3526
27. Zatterale F, Longo M, Naderi J, et al. Chronic adipose tissue inflammation linking obesity to insulin resistance and type 2 diabetes. Front Physiol. 2020;10:1607. doi:10.3389/fphys.2019.01607
28. Das P, Biswas S, Mukherjee S, et al. Association of oxidative stress and obesity with insulin resistance in type 2 diabetes mellitus. Mymensingh Med J. 2016;25(1):148–152.
29. Steinbrenner H. Interference of selenium and selenoproteins with the insulin-regulated carbohydrate and lipid metabolism. Free Radic Biol Med. 2013;65:1538–1547. doi:10.1016/j.freeradbiomed.2013.07.016
30. Misu H, Takamura T, Takayama H, et al. A liver-derived secretory protein, selenoprotein P, causes insulin resistance. Cell Metab. 2010;12(5):483–495. doi:10.1016/j.cmet.2010.09.015
 © 2021 The Author(s). This work is published and licensed by Dove Medical Press Limited. The full terms of this license are available at https://www.dovepress.com/terms.php and incorporate the Creative Commons Attribution - Non Commercial (unported, v3.0) License.
By accessing the work you hereby accept the Terms. Non-commercial uses of the work are permitted without any further permission from Dove Medical Press Limited, provided the work is properly attributed. For permission for commercial use of this work, please see paragraphs 4.2 and 5 of our Terms.
© 2021 The Author(s). This work is published and licensed by Dove Medical Press Limited. The full terms of this license are available at https://www.dovepress.com/terms.php and incorporate the Creative Commons Attribution - Non Commercial (unported, v3.0) License.
By accessing the work you hereby accept the Terms. Non-commercial uses of the work are permitted without any further permission from Dove Medical Press Limited, provided the work is properly attributed. For permission for commercial use of this work, please see paragraphs 4.2 and 5 of our Terms.