")
Back to Journals » Drug Design, Development and Therapy » Volume 10
The effects of ferulic acid on the pharmacokinetics of warfarin in rats after biliary drainage
Authors Li H, Wang Y, Fan R, Lv H, Sun H, Xie H, Tang T, Luo J, Xia Z
Received 6 March 2016
Accepted for publication 13 April 2016
Published 6 July 2016 Volume 2016:10 Pages 2173—2180
DOI https://doi.org/10.2147/DDDT.S107917
Checked for plagiarism Yes
Review by Single anonymous peer review
Peer reviewer comments 3
Editor who approved publication: Prof. Dr. Wei Duan
Haigang Li,1,2 Yang Wang,1 Rong Fan,1 Huiying Lv,3 Hua Sun,4 Haitang Xie,4 Tao Tang,1 Jiekun Luo,1 Zian Xia1
1Department of Integrated Traditional Chinese and Western Medicine, Laboratory of Ethnopharmacology, Xiangya Hospital, Central South University, 2Department of Pharmacy, Changsha Medical University, 3Hunan Agricultural Product Processing Institute, Hunan Academy of Agricultural Sciences, Changsha, 4Anhui Provincial Centre for Drug Clinical Evaluation, Yijishan Hospital of Wannan Medical College, Wuhu, People’s Republic of China
Abstract: According to previous research studies, warfarin can be detected in human bile after oral administration. Ferulic acid (FA) is the main bioactive component of many Chinese herbs for the treatment of cardiovascular disease. To elucidate the effects of FA on the pharmacokinetics of warfarin in rats after biliary drainage is necessary. Twenty rats were randomly divided into four groups: Group 1 (WN): healthy rats after the administration of warfarin sodium, Group 2 (WO): a rat model of biliary drainage after the administration of warfarin sodium, Group 3 (WFN): healthy rats after the administration of warfarin sodium and FA, and Group 4 (WFO): a rat model of biliary drainage after the administration of warfarin sodium and FA. Blood samples were collected at different time points after administration. The concentrations of blood samples were determined by ultraperformance liquid chromatography–tandem mass spectrometry. Comparisons between groups were performed according to the main pharmacokinetic parameters calculated by the DAS 2.1.1 software. The pharmacokinetic parameters showed a significant difference between the WN and WO groups, the WO group showed a decrease of 51% and 41.6% in area under the curve from 0 to time (AUC0–t) and peak plasma concentration (Cmax), respectively, whereas time to Cmax (Tmax) was delayed 3.27 folds. There were significant differences between the WFO and WFN groups, the WFO group showed a decrease of 63.8% and 70% in AUC0–t and Cmax, respectively; the delay in Tmax between the WN and WFN groups (mean, from 132–432 minutes) was significantly different; the mean retention time from 0 to time (MRT0–t) between the WO and WFO groups (mean, from 718.31–606.13 minutes) also showed a significant difference. Enterohepatic circulation markedly influences the disposition of warfarin in rats, and FA significantly affected the warfarin disposition in rat plasma.
Keywords: warfarin, ferulic acid, pharmacokinetics, enterohepatic circulation, UPLC-MS/MS, biliary drainage
Introduction
Warfarin is the most widely prescribed oral anticoagulant and is used by patients with chronic atrial fibrillation, mechanical valves, deep vein thrombosis, and recurrent stroke.1 The annual prescriptions of warfarin typically occur in 0.5%–1.5% of the population.2 Although novel oral anticoagulants, such as dabigatran, rivaroxaban, apixaban, and edoxaban, do not require special laboratory monitoring or dose adjustment like warfarin, warfarin is still the most common oral anticoagulant drug and has remained in use for >60 years.3 This is mainly because warfarin can exhibit anticoagulant effects for several days even after the subject stops taking it, whereas the novel oral anticoagulants do not have this advantage.
Several studies have focused on its dose and safety. As a consequence of under-or overanticoagulation, the incidence of hemorrhage or thromboembolism due to the use of warfarin ranges from 16% to 25%.4 The above mentioned risks are most common during the initial period of treatment.5 The narrow therapeutic range of warfarin is associated with side effects. However, different patients have different therapeutic ranges for warfarin. The reason for these issues is that multiple environmental and genetic factors can influence the metabolism and effects of warfarin in each patient, and it has been reported that there is an at least 20-fold interindividual variability in warfarin sensitivity.6 Therefore, it is necessary to carefully monitor the warfarin concentration to keep patients safe and avoid serious side effects.
After oral administration, warfarin can be detected in human bile.7 Some of the warfarin in the blood is absorbed from the intestine and secreted into the bile after entering liver cells, is then stored in the gallbladder through the bile duct, and finally is taken into the duodenum by gallbladder contraction.8 This nonrenal elimination route is termed the enterohepatic circulation (EHC). During EHC, the warfarin concentration increases on two different occasions. The timing of the second peak is related to gallbladder emptying and eating. Because of the irregularity of gallbladder emptying, the concentration–time curve may show double peaks or multiple peaks. Scientists often use biliary drainage models to investigate the effects of EHC.9,10 Unfortunately, the effects of biliary drainage on the pharmacokinetics of warfarin have been unclear.
Ferulic acid (FA), a hydroxycinnamic acid (Figure 1), is ubiquitous and abundant in many plants11 and even some vegetables.12 FA is the main active constituent of Angelicae Sinensis Radix (the root of Angelica sinensis [Oliv] Diels)13 and Chuanxiong Rhizoma (rhizomes of Ligusticum chuanxiong Hort). According to the traditional Chinese medicine (TCM) theory, the pharmacological action of FA is “to activate the blood circulation and to dissipate blood stasis”, which is similar to the antiplatelet aggregation,14 anticoagulation, inhibiting erythrocyte agglutination,15 and vasodilation16 effects of FA. Previous studies showed that some active components of Chinese herbal medicine, including tanshinone IIA17 and ginsenosides,18 could influence the pharmacokinetics of warfarin. However, the effects of FA on the pharmacokinetics of warfarin remain unknown.
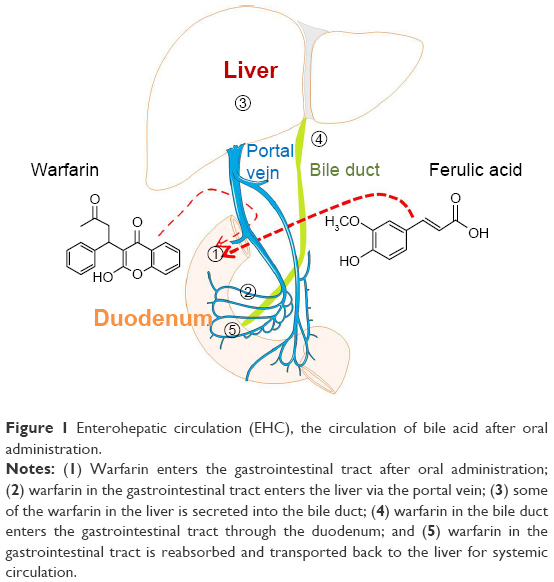 | Figure 1 Enterohepatic circulation (EHC), the circulation of bile acid after oral administration. |
This study aimed to compare the pharmacokinetics of warfarin in a biliary drainage model with healthy rats and to investigate the potential effects of EHC and FA on the pharmacokinetics of warfarin in rats.
Materials and methods
Chemicals and reagents
FA (C10H10O4, molecular weight [MW], 191.48; lot, F1205050; purity, 99%; CAS, 1135-24-6) was obtained from Sigma-Aldrich Co. (St Louis, MO, USA). Warfarin sodium (C19H15NaO4, MW, 330.31; lot, 101163-201001; purity, 92.3%; CAS, 129-06-6) and methyclothiazide (C9H11Cl2N3O4S2, MW, 360.24; lot, 101163-201101; purity, 99.6%; CAS, 135-07-9; internal standard [IS]) were purchased from the National Institutes for Food and Drug Control (Beijing, People’s Republic of China). Formic acid was purchased from Tianjin Guangfu Fine Chemical Reagent Factory (Tianjin, People’s Republic of China). High performance liquid chromatography grade methanol and acetonitrile were purchased from Merck Millipore (Billerica, MA, USA). Deionized water was purified with a TKA Smart2pure water purification system (Thermo Fisher Scientific, Waltham, MA, USA) with a sensitivity of 18.2 MO.
Surgical procedures
Surgical procedures were performed under sterile conditions in rats anesthetized with an intraperitoneal injection of 10% chloral hydrate (0.4 mL/100 g body weight). A midline incision was made on the abdomen, the liver was opened up, and the common bile duct was noted over the margin of the duodenal bulb. The distal end of the bile duct was ligated, and a polyethylene catheter (inner diameter, 0.8 mm; outer diameter, 1.2 mm) was inserted into the common bile duct for external biliary drainage. Yellow bile could be seen in the tube either immediately or a few minutes after insertion, and the free end of the external biliary drainage tube was fixed to the peritoneum and brought out of the body through a small hole made on the back of the rat’s neck.
Instrumentation and analytical conditions
The sample analysis was performed on an ultraperformance liquid chromatography–tandem mass spectrometry (UPLC-MS/MS) system. The Acquity™ UPLC system (Waters Corporation, Milford, MA, USA) was composed of a binary solvent delivery manager, an autosampler (set at 10°C), and a column oven (set at 35°C). Chromatographic separation was achieved on a Waters Acquity BEH C18 column (2.1×100 mm inner diameter, 1.7 μm; Waters Corporation, Wexford, Ireland). A mobile phase consisting of A (aqueous buffer containing 0.1% formic acid) and B (acetonitrile) was pumped at 0.3 mL/min. The gradient elution was 0 minute, 10% B; 0–0.25 minutes, 10% B; 0.25–5.0 minutes, linear from 10% to 95% B; 5.0–8.0 minutes, holding at 95% B; then, between 8.0 minutes and 8.2 minutes, an immediate decrease to the initial conditions (ie, 10% B) for equilibration of the column. The typical injection volume was 2 μL. The detection system, a tandem quadrupole mass spectrometer (Waters Corporation, Manchester, UK), was operated using an electrospray ionization with the capillary voltage set at 2.5 kV in negative ion mode, the source temperature was set at 110°C, and the desolvation temperature was fixed at 365°C. Nitrogen was used for the desolvation gas flow (650 L/h) and cone gas flow (50 L/h). For collision-induced dissociation, argon was used as the collision gas at a flow rate of 0.2 mL/min. The Masslynx 4.1 software program (Waters Corporation) was used for data acquisition and processing. The multiple-reaction monitoring (MRM) mode was selected for quantitation of warfarin and IS, the precursors of warfarin and IS were transited into their production ions as follows: warfarin, 307.03→250.02; IS, 357.81→321.89. The data were collected and processed using the DAS 2.1.1 software.
Sample collection
The study was approved by the Animal Ethics Committee of Central South University. Animal welfare and experimental procedures were strictly in accordance with the guide for the Care and Use of Laboratory Animals of the National Institutes of Health and the related ethics regulations of Central South University. Twenty specific pathogen free grade male Sprague Dawley rats weighing 250–300 g were provided by Shanghai Laboratory Animal Center. They were housed in an specific pathogen free environment on a 12-hour light/12-hour dark cycle at ambient temperature (~20°C–26°C) and 40%–70% relative humidity. All rats were fed standard rodent chow and provided tap water ad libitum, except for the 12-hour fasting before the pharmacokinetic experiment. The experimental Sprague Dawley rats were randomly divided into four groups: Group 1 (WN): healthy rats after a single oral administration of 0.5 mg/kg warfarin sodium; Group 2 (WO): rats subjected to biliary drainage after the oral administration of 0.5 mg/kg warfarin sodium; Group 3 (WFN): healthy rats after the oral administration of warfarin sodium and FA at doses of 0.5 mg/kg and 1.5 mg/kg, respectively; and Group 4 (WFO): rats subjected to biliary drainage after the oral administration of warfarin sodium and FA at doses of 0.5 mg/kg and 1.5 mg/kg, respectively. The doses were calculated from human dose based on body surface area.
On the second day after biliary drainage surgery, 500 μL of tail venous blood was drawn into heparinized tubes prior to treatment and at 0.083 hour, 0.167 hour, 0.5 hour, 1 hour, 2 hours, 4 hours, 8 hours, 12 hours, and 24 hours postdose. The samples were centrifuged at 3,000 rpm for 15 minutes to obtain the supernatant and were stored at -80°C until analysis. To a total of 200 μL of rat plasma, 20 μL of IS solution, 100 μL of 20% formic acid, and 2 mL of methanol were added, which was followed by vortex mixing for 1 minute and hyperacoustic mixing for 5 minutes. The samples were then centrifuged at 3,000 rpm for 10 minutes, and the residue was extracted by 2 mL of methanol. The two supernatants were combined and evaporated to dryness at room temperature under a gentle stream of nitrogen, followed by reconstitution with 200 μL of a mixture of acetonitrile and water (50:50). This was followed by vortex mixing for 1 minute and hyperacoustic mixing for 5 minutes. The samples were then centrifuged at 15,000 rpm for 10 minutes, the supernatant was filtered through the 0.22 μm membrane, and 2.0 μL of the processed sample was injected for the analysis.
Method validation
The method was validated in terms of selectivity, linearity, accuracy, precision, extraction recovery, matrix effects, and stability according to the US Food and Drug Administration guidelines for bioanalytical method validation.
Statistical methods
Statistical evaluation was performed by SAS software (SAS Institute Inc., Cary, NC, USA). Data are expressed as mean ± standard deviation. The analyses of area under the curve from 0 to time (AUC0–t), mean retention time from 0 to time (MRT0–t), and peak plasma concentration (Cmax) were done with analysis of variance. The analyses of time to Cmax (Tmax) and terminal halftime (t1/2Z) were done using nonparametric methods (Wilcoxon-signed rank test). For all analyses, P<0.05 were considered to be statistically significant.
Results
Specificity
MRM has high selectivity and accuracy of analysis of chemicals. No interference was observed at the retention times of either warfarin or IS (Figure 2) in plasma samples, which were used for the analysis, and the method exhibited good specificity. Typical MRM chromatograms are shown in Figure 2, and the UPLC-MS/MS spectra of warfarin and methyclothiazide are shown in Figure 3.
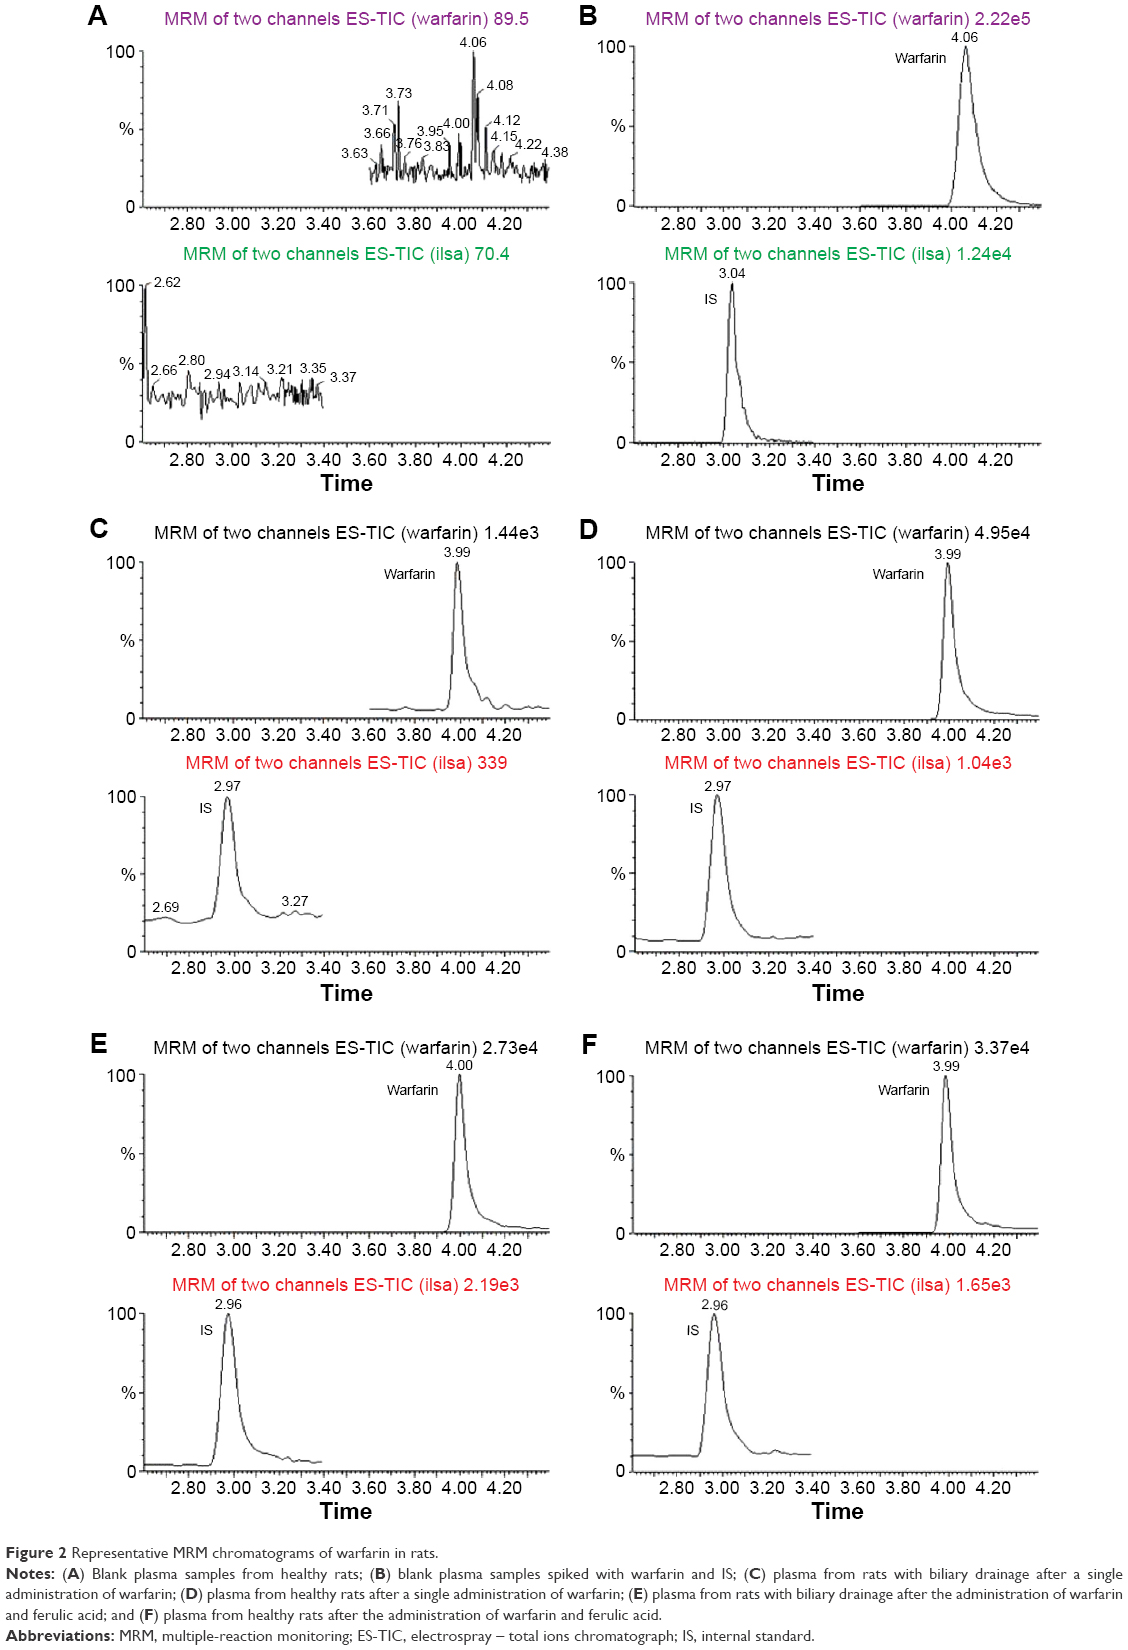 | Figure 2 Representative MRM chromatograms of warfarin in rats. |
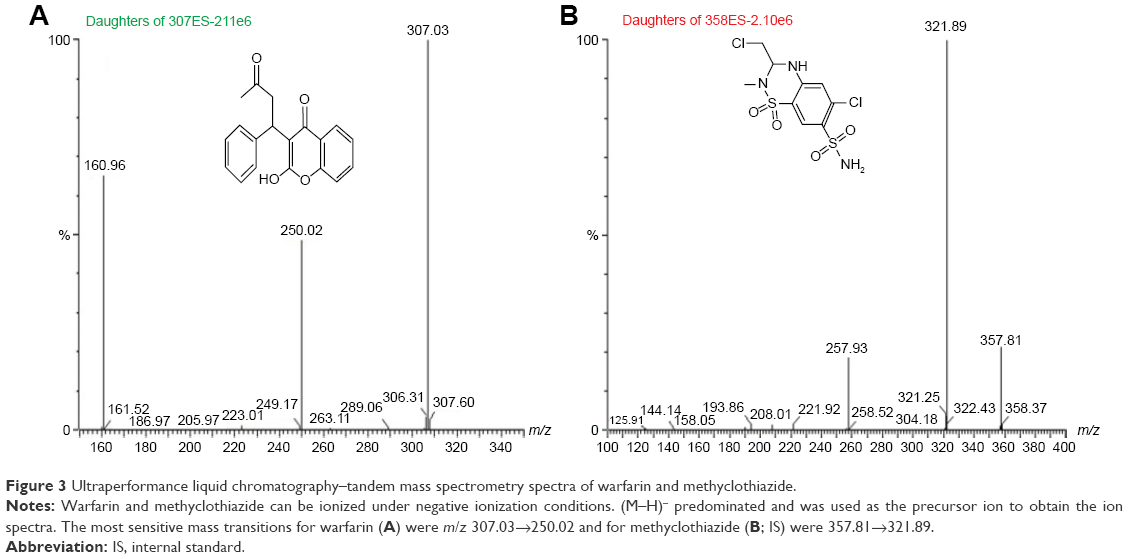 | Figure 3 Ultraperformance liquid chromatography–tandem mass spectrometry spectra of warfarin and methyclothiazide. |
Linearity and LLOQ of warfarin
The linear regression equation was y=0.0189x-0.0042 (r=0.999993), the linearity range was 10–5,000 ng/mL, and the lower limit of quantitation was 5 ng/mL, where x refers to the warfarin concentration (ng/mL), y indicates the ratio of warfarin peak area to internal standard peak area, and r is the correlation coefficient of the equation.
Precision and accuracy
The method showed good precision and accuracy with good intraday and interday precision. All the results were found to be within the accepted variable limits, as shown in Table 1.
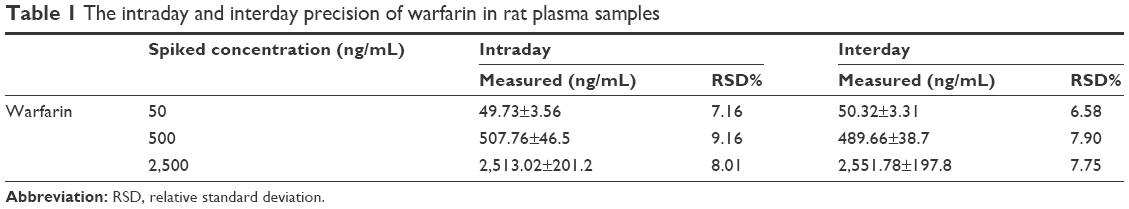 | Table 1 The intraday and interday precision of warfarin in rat plasma samples |
Pharmacokinetic study
Figure 4 shows the concentration–time curves for plasma warfarin in the four groups (n=5). The pharmacokinetic parameters (Table 2) of warfarin were calculated using noncompartmental modeling with the DAS2.1.1 software.
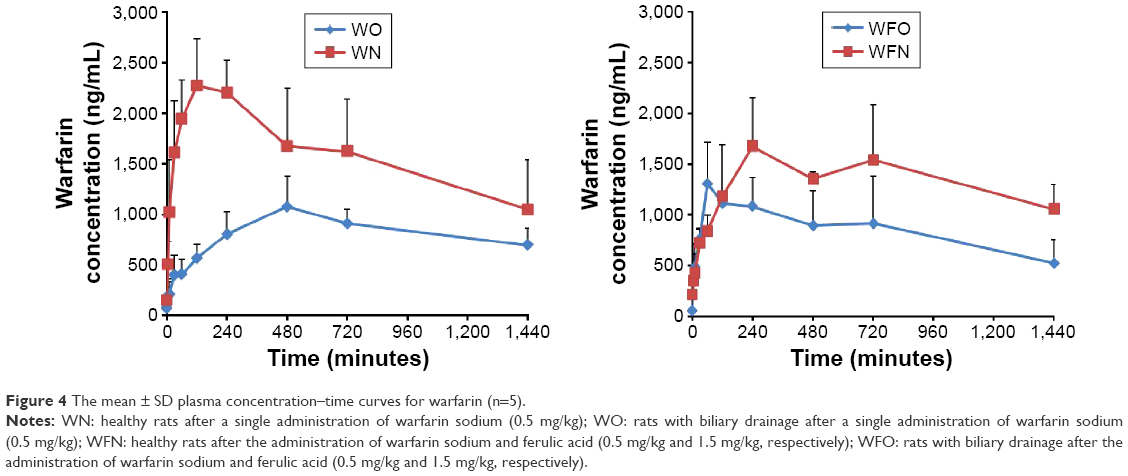 | Figure 4 The mean ± SD plasma concentration–time curves for warfarin (n=5). |
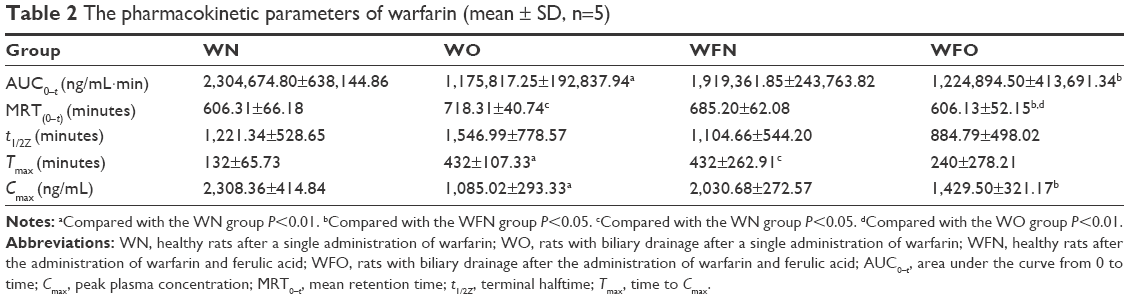 | Table 2 The pharmacokinetic parameters of warfarin (mean ± SD, n=5) |
Table 2 shows that there were significant differences in the pharmacokinetic parameters of warfarin between the WO and WN groups. The WO group showed a decrease in AUC0–t to 51.0% compared with the WN group (P<0.01). The Cmax of the WO group was significantly decreased by 53.0% compared with the WN group (P<0.01), and the Tmax in the WO group was 3.27 times slower than that in the WN group (P<0.01). The MRT0–t was also delayed by 18.5% (P<0.05). t1/2Z had a tendency to be extended from 1,221.34 minutes to 1,546.99 minutes, but this difference was not statistically significant.
As shown in Table 2, there were also significant differences in the pharmacokinetic parameters of warfarin between the WFO and WFN groups. The WFO group showed a decrease of 63.8% in the AUC0–t compared with the WFN group (P<0.05). Compared with the WFN group, the Cmax of the WFO group was significantly decreased by 29.6% (P<0.05) and the MRT0–t also decreased by 11.5% (P<0.05).
Furthermore, Table 2 revealed that the Tmax of warfarin in the WFN group was 3.27 times slower than that of the WN group, which showed that FA affected the pharmacokinetics of warfarin in rat plasma. At the same time, there was a tendency for a decrease in the AUC0–t and Cmax of warfarin caused by the coadministration of FA. FA obviously affected the disposition of warfarin after biliary drainage, because the MRT0–t was significantly different between the WO and WFO groups (mean, 718.31 minutes and 606.13 minutes, respectively, P<0.01).
Discussion
The notable decreases in the AUC0–t and Cmax of the WO group compared with the WN group caused by biliary drainage indicated that the operation decreased the bioavailability of warfarin (Table 2), possibly due to the change in EHC. EHC refers to the circulation of bile acid, drugs, or other substances from the liver to the bile, followed by reabsorption into the small intestine and transport back to the liver for systemic circulation (Figure 1). The EHC process extends the drug residence time in the body. Drug interactions can occur during any part of EHC and can result from changes in absorption, distribution, transporters, metabolism, or other mechanisms. A drug undergoing EHC usually shows a multiple-peak phenomenon in terms of its plasma concentration–time profile and a prolonged elimination half-life.19 EHC induced a second peak in the concentration–time profile of the WFN group (Figure 4). However, the concentration–time profile of the WFO group did not show such double peaks due to blockade of EHC.
The dose–response variations of warfarin are markedly influenced by pharmacokinetic aspects that are determined by genetic, environmental, and other as yet unknown factors. Polymorphisms in cytochrome P450 (CYP) 2C9 and VKORC1 are the major determinants of the warfarin dosage requirement.20 Genetic polymorphisms in CYP2C9 and VKORC1 account for ~50% of the variability in the pharmacological response of warfarin.21 Other genetic factors involved in vitamin K intake and recycling and warfarin transportation may also influence the stable maintenance dosage of warfarin. The present study showed that EHC could significantly affect the warfarin pharmacokinetics in rat plasma. In addition, it is clear that herbal medicines also affect the pharmacokinetics of warfarin.
There is a widespread undisclosed use of herbal medicine among Western doctors. Previous studies reported that the rate of herbal use was 75.4% to >90.0% in Singapore and Italy.22,23 The use of TCM is also significant in various countries and regions, with an estimated 26.0% and 23.5% of patients in Hong Kong and Italy, respectively, coingesting warfarin and Chinese herbs.23,24
In the clinical setting, FA has been used to treat age-related diseases, such as ischemic heart disease,11 atherosclerosis, and thrombosis, and its safety and efficacy have been demonstrated in clinical practice.25 Zhang and Shen26 confirmed that FA could prolong the plasma recalcification time, prothrombin time, and clotting time and could reduce the platelet adhesion and activation. It was also reported that the promotion of blood vessel regeneration by FA was observed in vitro and in vivo.27
The differences in the pharmacokinetic parameters of warfarin between the WFO and WFN groups indicated that biliary drainage can affect the disposition of warfarin when it was coadministered with FA in rats (Table 2). Bile acid circulation therefore played an important role in the pharmacokinetics of warfarin combined with FA, and we speculated that FA influences the pharmacokinetics of warfarin by affecting its EHC. It is unclear how it exerts its effects. Furthermore, the WFN group delayed Tmax of warfarin compared to the WN group, which showed that FA can slow down the absorption rate of warfarin. At the same time, the tendency of decrease in the AUC0–t and Cmax of warfarin of the WFN group caused by the coadministration of FA indicated that FA decreased the bioavailability of warfarin, possibly due to metabolic inhibition, or local interactions of warfarin with FA in the intestine. In addition, the shortened MRT of the WFO group compared to the WO group indicated that FA obviously affected the disposition of warfarin after biliary drainage. In TCM theory, FA shows the function of activating the blood circulation and dissipating blood stasis. Suzuki et al16 verified that FA presents a function of vessel dilating. Moreover, EHC blockage led to more FA entering the circulation. Thus, increasing level of FA accelerated the warfarin clearance in biliary drainage rats.
In fact, the FA metabolism in conjugation with glucuronic acid and/or sulfate, which takes place mainly in the liver, is the principal pathway in vivo. FA is also metabolized into m-hydroxyphenylpropionic acid by the intestinal microflora through reduction, dehydroxylation, and demethylation.28 The identification and detailed quantitative assessment of the importance of various enzyme/transporter pathways in the elimination of FA are still lacking, although previous studies on its pharmacokinetics showed that these processes may involve CYPs, uridine diphosphate-glucuronosyltransferases, sulfotransferases, and the monocarboxylic acid transporter.29 However, the bioavailability of free FA is very low due to its rapid conjugation process in the liver and t1/2Z of FA is within an hour,28,30 FA seems to have limited effects on the pharmacokinetics of warfarin. It is believed that pharmacokinetic interaction between warfarin and FA in vivo refers to several factors rather than those mentioned above. Further study on this problem should be performed. Because of absent evidence about different enzymes and metabolism rates between rats and humans in metabolism of warfarin, the results of the present study partly contribute to beneficial guidance to clinical practice.
Conclusion
EHC significantly influenced the disposition of warfarin in rats. FA coadministration significantly affected the disposition of warfarin in rats subjected to biliary drainage. The present study can provide clinical guidance for the administration of warfarin, especially when it is combined with the herbal medicines that contain FA.
Acknowledgments
This work was supported by the Science Project of the Department of Education of Hunan Province (grant no 13C1126) and the National Natural Science Foundation for Young Scientists of China (grant nos 81303074 and 81403259).
Disclosure
The authors report no conflicts of interest in this work.
References
Piatkov I, Rochester C, Jones T, Boyages S. Warfarin toxicity and individual variability-clinical case. Toxins. 2010;2(11):2584–2592. | ||
Johnson JA, Gong L, Whirl-Carrillo M, et al; Clinical Pharmacogenetics Implementation Consortium. Clinical pharmacogenetics implementation consortium guidelines for CYP2C9 and VKORC1 genotypes and warfarin dosing. Clin Pharmacol Ther. 2011;90(4):625–629. | ||
Pirmohamed M, Kamali F, Daly AK, Wadelius M. Oral anticoagulation a critique of recent advances and controversies. Trends Pharmacol Sci. 2015;36(3):153–163. | ||
Fang MC, Go AS, Chang Y, et al. Death and disability from warfarin-associated intracranial hemorrhages. Am J Med. 2007;120(8):700–705. | ||
Penning-van Beest FJA, van Meegen E, Rosendaal FR, Stricker BH. Characteristics of anticoagulation therapy and comorbidity related to overanticoagulation. Thromb Haemost. 2001;86(2):569–574. | ||
Wittkowsky AK. Factors associated with INR elevation and bleeding complications during warfarin therapy. Arch Intern Med. 2005;165(6):703. | ||
Zhou L, Wang S, Zhang Z, et al. Pharmacokinetic and pharmacodynamic interaction of Danshen-Gegen extract with warfarin and aspirin. J Ethnopharmacol. 2012;143(2):648–655. | ||
Gao LC, Huang X, Tan ZR, Fan L, Zhou HH. The effects of sodium ferulate on the pharmacokinetics of bupropion and its active metabolite in healthy men. Eur Rev Med Pharmacol Sci. 2012;16(9):1192–1196. | ||
Melnik G, Schwesinger WH, Teng R, Dogolo LC, Vincent J. Hepatobiliary elimination of trovafloxacin and metabolites following single oral doses in healthy volunteers. Eur J Clin Microbiol Infect Dis. 1998;17(6):424–426. | ||
Lenzen R, Bahr A, Eichstadt H, Marschall U, Bechstein WO, Neuhaus P. In liver transplantation T tube bile represents total bile flow physiological and scintigraphic studies on biliary secretion of organic anions. Liver Transpl Surg. 1999;5(1):8–15. | ||
Barone E, Calabrese V, Mancuso C. Ferulic acid and its therapeutic potential as a hormetin for age-related diseases. Biogerontology. 2009;10(2):97–108. | ||
D’Archivio M, Filesi C, Di Benedetto R, Gargiulo R, Giovannini C, Masella R. Polyphenols dietary sources and bioavailability. Ann Ist Super Sanita. 2007;43(4):348–361. | ||
Shi X, Tang Y, Zhu H, et al. Pharmacokinetic comparison of seven major bio-active components in normal and blood deficiency rats after oral administration of Danggui Buxue decoction by UPLC-TQ/MS. J Ethnopharmacol. 2014;153(1):169–177. | ||
Li JM, Zhao YH, Zhong GC, Long ZJ, Zhou P, Yuan M. Synthesis of ferulic acid derivatives and their inhibitory effect on platelet aggregation. Yao Xue Xue Bao. 2011;46(3):305–310. | ||
Wang S, Gao Z, Chen X, et al. The anticoagulant ability of ferulic acid and its applications for improving the blood compatibility of silk fibroin. Biomed Mater. 2008;3(4):044106. | ||
Suzuki A, Yamamoto M, Jokura H, et al. Ferulic acid restores endothelium-dependent vasodilation in aortas of spontaneously hypertensive rats. Am J Hypertens. 2007;20(5):508–513. | ||
Wu WW, Yeung JH. Inhibition of warfarin hydroxylation by major tanshinones of Danshen (Salvia miltiorrhiza) in the rat in vitro and in vivo. Phytomedicine. 2010;17(3–4):219–226. | ||
Shao J, Jia L. Potential serious interactions between nutraceutical ginseng and warfarin in patients with ischemic stroke. Trends Pharmacol Sci. 2013;34(2):85–86. | ||
Roberts MS, Magnusson BM, Burczynski FJ, Weiss M. Enterohepatic circulation physiological pharmacokinetic and clinical implications. Clin Pharmacokinet. 2002;41(10):751–790. | ||
Wadelius M, Chen LY, Lindh JD, et al. The largest prospective warfarin-treated cohort supports genetic forecasting. Blood. 2009;113(4):784–792. | ||
Bodin L, Verstuyft C, Tregouet DA, et al. Cytochrome P450 2C9 (CYP2C9) and vitamin K epoxide reductase (VKORC1) genotypes as determinants of acenocoumarol sensitivity. Blood. 2005;106(1):135–140. | ||
Lim MK, Sadarangani P, Chan HL, Heng JY. Complementary and alternative medicine use in multiracial Singapore. Complement Ther Med. 2005;13(1):16–24. | ||
Cuzzolin L, Francini-Pesenti F, Zaffani S, et al. Knowledges about herbal products among subjects on warfarin therapy and patient-physician relationship a pilot study. Pharmacoepidemiol Drug Saf. 2007;16(9):1014–1017. | ||
Wong RS, Cheng G, Chan TY. Use of herbal medicines by patients receiving warfarin. Drug Saf. 2003;26(8):585–588. | ||
Wang BH, Ou-Yang JP. Pharmacological actions of sodium ferulate in cardiovascular system. Cardiovasc Drug Rev. 2005;23(2):161–172. | ||
Zhang E, Shen F. Blood compatibility of a ferulic acid (FA)-eluting PHBHHx system for biodegradable magnesium stent application. Mater Sci Eng C Mater Biol Appl. 2015;52:37–45. | ||
Wang H, Zhang Y, Xia T, et al. Synergistic promotion of blood vessel regeneration by Astragaloside IV and ferulic acid from electrospun fibrous mats. Mol Pharm. 2013;10(6):2394–2403. | ||
Zhao Z, Moghadasian MH. Chemistry natural sources dietary intake and pharmacokinetic properties of ferulic acid: a review. Food Chem. 2008;109(4):691–702. | ||
Poquet L, Clifford MN, Williamson G. Transport and metabolism of ferulic acid through the colonic epithelium. Drug Metab Dispos. 2008;36(1):190–197. | ||
Zhao Z, Egashira Y, Sanada H. Ferulic acid is quickly absorbed from rat stomach as the free form and then conjugated mainly in liver. J Nutr. 2004;134(11):3083–3088. |
 © 2016 The Author(s). This work is published and licensed by Dove Medical Press Limited. The full terms of this license are available at https://www.dovepress.com/terms.php and incorporate the Creative Commons Attribution - Non Commercial (unported, v3.0) License.
By accessing the work you hereby accept the Terms. Non-commercial uses of the work are permitted without any further permission from Dove Medical Press Limited, provided the work is properly attributed. For permission for commercial use of this work, please see paragraphs 4.2 and 5 of our Terms.
© 2016 The Author(s). This work is published and licensed by Dove Medical Press Limited. The full terms of this license are available at https://www.dovepress.com/terms.php and incorporate the Creative Commons Attribution - Non Commercial (unported, v3.0) License.
By accessing the work you hereby accept the Terms. Non-commercial uses of the work are permitted without any further permission from Dove Medical Press Limited, provided the work is properly attributed. For permission for commercial use of this work, please see paragraphs 4.2 and 5 of our Terms.