")
Back to Journals » Drug Design, Development and Therapy » Volume 13
Synthesis of a vanadyl (IV) folate complex for the treatment of diabetes: spectroscopic, structural, and biological characterization
Authors Naglah AM , Refat MS , Al-Omar MA , Bhat MA , AlKahtani HM , Al-Wasidi AS
Received 9 October 2018
Accepted for publication 25 February 2019
Published 30 April 2019 Volume 2019:13 Pages 1409—1420
DOI https://doi.org/10.2147/DDDT.S190310
Checked for plagiarism Yes
Review by Single anonymous peer review
Peer reviewer comments 2
Editor who approved publication: Dr Jianbo Sun
Ahmed M Naglah,1,2 Moamen S Refat,3,4 Mohamed A Al-Omar,1 Mashooq A Bhat,5 Hamad M AlKahtani,5 Asma S Al-Wasidi6
1Department of Pharmaceutical Chemistry, Drug Exploration & Development Chair (DEDC), College of Pharmacy, King Saud University, Riyadh 11451, Saudi Arabia; 2Peptide Chemistry Department, Chemical Industries Research Division, National Research Centre, Cairo 12622, Egypt; 3Chemistry Department, Faculty of Science, Taif University, Taif 21974, Saudi Arabia; 4Department of Chemistry, Faculty of Science, Port Said University, Port Said, Egypt; 5Department of Pharmaceutical Chemistry, College of Pharmacy, King Saud University, Riyadh 11451, Saudi Arabia; 6Department of Chemistry, College of Science, Princess Nourah Bint Abdulrahman University, Riyadh 11671, Saudi Arabia
Background: This study aimed to design a compound with folic acid (FAH2) and vanadyl (IV) for use in the treatment of diabetes.
Materials and methods: A novel vanadyl (IV) FAH2 complex was synthesized and characterized [(FA2-)(VO2+)]·3H2O. The speculated structure of this folate complex was determined using physicochemical techniques including microanalytical analysis, conductivity studies, spectroscopic examination, magnetic measurements, thermogravimetric analyses, and morphological X-ray powder diffraction, and scanning and transmission electron microscopies. The anti-diabetic therapeutic potential of the complexes was tested in a 30-day streptozotocin-induced diabetes rat model.
Results: The conductivity test of the complex implied electrolyte behavior. The spectroscopic assessments of the isolated dark yellow solid complex revealed that FAH2 acts as a bidentate ligand. The coordination process with two vanadyl (IV) ions occurred through the deprotonation of both carboxyl groups of FAH2 in a regular square pyramid arrangement at a 2(FA)2-: 2(VO)2+ molar ratio. XRD, SEM, and TEM analyses revealed the complex crystalline nature of the complex. Treating diabetic rats with vanadyl (IV) FAH2 complex significantly improved many biological parameters relevant to diabetes pathology with minimal toxicity.
Conclusion: The data generated in this study indicate that the synthesized vanadyl (IV) folate complex acts as a model of anti-diabetic agent.
Keywords: diabetes, vanadyl, folic acid, spectroscopic, streptozotocin, vitamin B9
Introduction
Vanadyl (IV) sulfate is a promising factor in the treatment of diabetes.1 Vanadium is an oral insulin injector that improves the storage of insulin in beta cells and can reverse the sugary state.2 Many studies in vitro and in vivo have shown that vanadium exerts insulin-like effects on the liver, skeletal muscle, and fatty tissues.3 It also improves the sensitivity of hepatic and muscular insulin in type-2 diabetes.4 The insulin-like abilities of various coordination modes of oxovanadium complexes VO(L) (where L=O4, N2O2, N2S2, S4, S2O2, and N4) have been evaluated both in vivo and in vitro.5,6
Diabetes is one of the diseases that cause renal failure and heart disease and lead to an amputation in parts of the body because of uncontrolled blood sugar levels.7 Diabetes is considered to be one of the most serious metabolic diseases with a high risk of death. It has been found that the total health care expenditure spent on the treatment of diabetics is 10% of the total health expenditure in the world.8,9 Lack of β-cells in the pancreas is the essential cause of the pathophysiological symptom that leads to the progression of diabetes.10 Therefore, the therapeutic goal is to stimulate or mimic the production of insulin, which would ameliorate the disease or at least lessen its many complications.11 Metal-complexes, used in agriculture and pharmaceutical industry, are considered essential elements with promising potential applications for the treatment of diabetes.12
Folic acid (FAH2), also known as vitamin B9 or folacin, belongs to the B vitamin family and is chemically referred to as pteroyl-L-glutamic acid.13 It consists of 2-amino-4-hydroxy-6-methyl pterin, para-aminobenzoic acid, and L-glutamic acid (Figure 1). FAH2 was initially isolated from the leaves of spinach plants and used to treat megaloblastic anemia.14
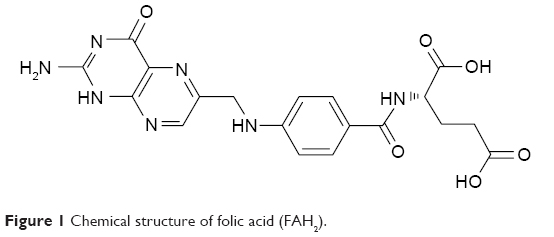 | Figure 1 Chemical structure of folic acid (FAH2). |
FAH2 is a main micronutrient that cannot be synthesized by humans and, therefore, must be ingested through the diet.15 FAH2 is the general form of folate.16 It plays a crucial role in DNA synthesis and cell division.17 It has been reported that FAH2 has a potent therapeutic effect on malignant anemia.18 Biochemical and clinical studies have confirmed that FAH2 serves as a critical coenzyme in the biosynthesis of purines, pyrimidines, nucleic acids, and proteins.19 It is now widely accepted that FAH2 deficiency contributes to higher plasma concentrations of homocysteine, which is an independent risk factor for birth defects and complications during pregnancy.20 FAH2 plays an important role in preventing neural tube defects in infants and may reduce the risk of vascular disease and some cancers.21 Accumulating evidence suggests that low dietary intake and blood concentration of vitamin B12 and FAH2 may be associated with decreased bone mineral density (BMD), increased bone loss, and a higher risk of osteoporotic fracture.22 The mechanism linking FAH2 and BMD remains unclear: FAH2 may exert a direct effect on the bone or an indirect effect mediated through homocysteine levels.23
In this report, we describe the synthesis and characterization of a novel vanadyl (IV) folate complex with potential therapeutic application in the treatment of diabetes using a streptozotocin (STZ)-induced diabetes rat model.
Materials and methods
Chemicals and reagents
Chemicals and reagents of highest grade (VOSO4·H2O, FAH2, BaCl2 2H2O, CH3OH, NH3 solution, dimethylsulfoxide, and STZ) were procured from Sigma-Aldrich (St Louis, MO, USA) and employed without further analysis.
Synthesis of vanadyl (IV) folate complex
Double distilled water was employed as a solvent for vanadyl (IV) folate complex. The [(FA2−)(VO2+)]·3H2O complex was synthesized using VOSO4:FAH2 in a 1:1 ratio. VOSO4·H2O (0.09 g, 1.0 mmol) salt was dissolved in aqueous media and then directly added to 40 mL of CH3OH/H2OFAH2 (0.22 g, 1.0 mmol) solution. The CH3OH/H2O FAH2 solution was pre-titrated with a 5% NH3 solution to adjust to pH 9.5, then heated at ~60°C for 30 minutes until the precipitate settled, and left to evaporate at room temperature overnight. The precipitate was filtered, washed several times with minimal amounts of hot methanol, dried in an oven at 60°C, and then stored in a vacuum desiccator filled with anhydrous CaCl2.
Instruments
The analyses of C, H, and N content (%) were performed using the Perkin Elmer CHN 2400 Elemental Analyzer (Waltham, MA, USA). The vanadium metal content was determined gravimetrically by the direct ignition of the respected complex at 800°C for 3 hours until constant weight was reached. The residue was then weighed in the form of vanadium oxide. The molar conductivity of freshly prepared 1.0×10⁻³ mol/cm3 vanadyl (IV) folate complex dimethylsulfoxide (DMSO) solution was measured using a JENWAY 4010 conductivity meter (Staffordshire, UK). The solid reflectance spectrum was measured by a Shimadzu UV-3101 PCUV–Vis Spectrophotometer (Kyoto, Kyoto Prefecture, Japan). The infrared spectra were recorded with KBr discs on a Bruker FT-IR Spectrophotometer (Billerica, MA, USA) (4,000–400 cm−1). Magnetic data were calculated at 25°C using a Magnetic Susceptibility Balance (Sherwood Scientific, Cambridge, England). The electron spin resonance (ESR) spectrum was determined at 9.44 GHz using the JES-FE2XG ESR spectrometer and microwave unit, JEOL (Akishima, Tokyo, Japan). A thermal study (TG/DTG–50H) was carried out on the Shimadzu Thermogravimetric Analyzer (Kyoto) in atmospheric nitrogen up to 800°C. Scanning electron microscopy (SEM) images were acquired using the Quanta FEG 250 microscope (Waltham, MA, USA). The transmission electron microscopy (TEM) images were acquired using the JEOL 100s microscope (Akishima). The X-ray diffraction patterns were recorded on the X’Pert PRO PANalytical X-ray powder diffraction (USA) unit using target copper with a secondary monochromate.
Preparation of stock solutions
Ten grams of BaCl2·2H2O was weighed and dissolved in the small amount of distilled water possible. The volume was brought to 100 mL to achieve a final 10% solution. The stock solution of NH4OH was prepared by diluting 15.15 mL of concentrated NH3 (33% v/v) in 35 mL of distilled water. The volume was brought to 100 mL with methanol to approximate a 5% v/v solution. Each of the solid complexes (0.2 g) was dissolved in the least amount of 2 M nitric acid. The solution was then allowed to evaporate to near dryness. This process was repeated twice and the residue was dissolved in 50 mL of hot distilled water, which resulted in a clear solution. The volume was then brought to 100 mL.
Experimental animal design
Male albino rats (100–120 g) were purchased from the National Research Centre (Cairo, Egypt). The animals were maintained in solid-bottom polycarbonate cages with stainless steel wire-bar lids and wooden dust-free litter as bedding material. The animals were allowed free access to food and housed in an air-conditioned room for 2 weeks prior to starting any experiments. All animal procedures were performed in accordance with the European Community Directive (86/609/EEC) and the National Rules on Animal Care. Study protocol was approved by National Research Centre (Cairo, Egypt).
The animals were divided into four groups with ten animals per group:
- Group I: Untreated negative control.
- Group II: Untreated diabetic positive control with intraperitoneal (ip) injection of a single dose of STZ (50 mg/kg).24
- Group III: Vanadyl (IV) sulfate alone, one-time ip injection of STZ (50 mg/kg) followed by ip injections of vanadyl (IV) sulfate alone (40 mg/kg) every other day for 30 days (15 total treatments).
- Group IV: Vanadyl (IV) folate complexes, one-time ip injection of STZ (50 mg/kg) followed by ip injections of vanadyl (IV) AMP AA complexes (I–VI) (40 mg/kg) every other day for 30 days (15 total treatments).
Chemical induction of diabetes
Animals were fasted for 18 hours prior to a single ip injection of STZ (50 mg/kg)25 that was freshly prepared in cold 0.1 M citrate buffer (pH 4.5). STZ-injected animals were given a 5% glucose solution to drink ad libitum for the first 24 hours post-injection to ensure survival.26 Animals were considered to be diabetic when their blood glucose levels exceeded 220 mg/dL,27 approximately 72 hours after STZ injection.
Collection of blood and tissue
Blood samples from the 18 hour-fasted animals were immediately drawn from the medial retro-orbital venous plexus in capillary tubes (Micro Haematocrit Capillaries, Mucaps) under ether-induced anesthesia.28 Approximately 3 mL of blood was collected from each animal in two tubes – one tube contained EDTA and this sample was used for future hematological assays, whereas the sample in the other tube was allowed to clot for 30 minutes prior to centrifugation at 3,000 rpm for 15 minutes to separate the serum for future biochemical analyses. The animals were then dissected under ether-induced anesthesia and tissue samples (liver and pancreas) were collected, washed with 1.15% KCl and 0.5 mM EDTA, and stored at −20°C for future biochemical analyses.
Hb concentration
The Hb content (g/dL) of the blood was measured using a cell counter (Sysmex, Model KX21N).
Insulin and blood glucose levels
Insulin levels were determined as described by Woodhead et al (1974) using the Insulin-I125 Kit (Sigma-Aldrich) and Radioimmunoassay Kit (Sigma-Aldrich).29 Blood sugar levels were measured using the Udind Spain React Kit (Spain). Briefly, 10 μL of serum was incubated with 1 mL of the provided working reagent at 37°C for 10 minutes after which the developed colors were measured photometrically at 450 nm using a Biosystem 320 spectrophotometer relative to a tube filled only with the working solution. Glucose concentration was calculated according to the following equation:
|

Lipid profile
Triglycerides, cholesterol, high- (HDL-c) and low-density lipoprotein (LDL-c) cholesterol levels were determined using fully automated chemistry analyzer Integra 400 Plus Analyzer.
Liver and kidney function
The levels of lactate dehydrogenase (LDH), alanine transaminase, creatinine, and uric acid were determined using auto-chemistry Integra 400 Plus Analyzer. Glucose-6-phosphate dehydrogenase (G6PD) activity was measured using a commercially available kit.
Blood superoxide dismutase (SOD) activity
SOD was determined by using biodiagnostic kit (Sigma-Aldrich). First, 0.5 mL of EDTA blood was washed four times with normal saline to obtain washed erythrocytes. The washed erythrocytes were made up to 2.0 mL with cold redistilled water, mixed, and then allowed to stand at 4°C for 15 minutes. A total of 100 mL of this lysate was mixed with working reagent and the absorbance was measured at 560 nm for 5 minutes for both control (control ΔA) and for sample (ΔA sample). The percent of inhibition was calculated according to the following equation:
|

Histopathological investigation
Small pieces of liver and pancreas tissues were freshly collected directly after dissection and immediately transferred to a 10% formalin solution for fixation. After 24 hours, the tissue samples were washed, dehydrated in ascending grades of alcohol, cleared in xylol, and embedded in paraffin. The paraffin blocks were cut into 5 μm sections using a microtome. Prior to staining with Harris’ H&E, the paraffin sections were deparaffinized in xylene and hydrated. After staining, the sections were dehydrated in alcohol, cleared in xylene, and mounted with Canada balsam.30
Statistical analysis
Data were collected, arranged, and reported as mean ± standard error of the mean for all groups (each group was considered as one experimental unit). Differences between groups were determined using the one-way analysis of variance test (F-test), and if significant differences between the means were found, Duncan’s multiple range test was used. Statistical analyses were performed using the SPSS v15.0 software and P-values <0.05 were considered reflective of statistical significance.31
Results and discussion
Chemical structure
The vanadyl (IV) folate complex was a dark yellow, air stable, non-hygroscopic complex that is soluble in DMSO and DMF and insoluble in water and most organic solvents. The physical and analytical data revealed a 2:2 stoichiometry between vanadyl (IV): FAH2.
Microanalytical and physical data
The melting point of the binuclear vanadyl (IV) folate complex was above 260°C and an 85% yield was obtained. The microanalytical data of its chemical formula (C38H40N14O17V2) indicated a molecular weight of 1,066.69 g/mol: C=42.79%, H=3.78%, N=18.38%, V=9.55% (calculated value); C=42.56%, H=3.72%, N=18.11%, V=9.43% (observed value). Therefore, the general formula of the complex is [(FA2−)(VO2+)]·3H2O. The absence of SO4− ions was confirmed using a 10% stock solution of BaCl2 2H2O.
The molar conductivity value of the vanadyl (IV) folate complex in DMSO was 22 Ω−1 cm2 mol−1 at room temperature, which suggests that it is not an electrolyte.32 These values confirmed that no ions were present outside of the coordination sphere, so it was concluded the SO4− ions were absent.
Electronic and magnetic measurements
The electronic spectra and magnetic analyses provided an overview of the structural aspects of the chemical compounds. The diffuse reflectance spectrum of vanadyl (IV) folate complex revealed that vanadyl (IV) has a square pyramidal configuration. The absorption bands at 12,500 and 15,625 cm−1 were assigned to the 2B2→2E and 2B2→2B1 transitions, respectively.33 The weak bands at about 17,857 and 21,739 cm−1 were assigned to the ligand-to-metal charge transfer (L–MCT). The magnetic moment of the vanadyl (IV) folate complex was measured by Gauy method at room temperature and the μeff value was1.76 BM, which assigned to the square-pyramidal configuration.33
ESR spectrum
The ESR spectrum of the vanadyl (IV) folate complex was determined in DMSO at room temperature (Figure 2). The values of g|| and g⊥ factors aligned with the square pyramidal vanadyl complexes.34 The (g||, g⊥, A||, and A⊥) values were calculated from the ESR spectrum (Table 1), as was the trend of g values (g||<g⊥<2); all these values were in good agreement with its square pyramidal structure. Figure 2 shows the evidence of splitting, due to the chelation between two differentially located electrons from the vanadium metal and FAH2.
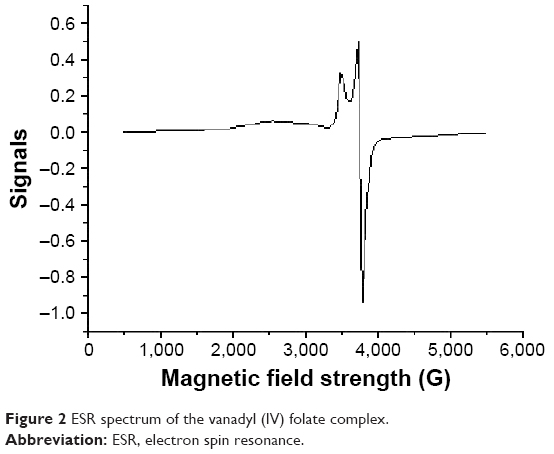 | Figure 2 ESR spectrum of the vanadyl (IV) folate complex. |
 | Table 1 ESR spectral data of vanadyl (IV) folate complex |
Infrared spectra
The essential infrared spectra of FAH2 and its vanadyl (IV) complex are summarized in Table 2. The spectra were similar but there are some differences related to the place of coordination. The FAH2 exhibited a very strong absorption band at 1,694 cm−1 due to the stretching vibration of ν(C=O) of the free ketone of the carboxyl group.35 This band was slightly shifted to lower frequencies in the spectrum of the complex (1,689 cm−1) due to the overlap between the amide (C=O) and carboxyl (C=O) groups of free FAH2.35 This decreased markedly in intensity and was accompanied by the appearance of two bands at 1,510 and 1,406 cm−1 corresponding to νas(COO−) and νs(COO−) vibration motions. Accordingly, the asymmetric and symmetric stretching vibration modes [νas(COO−) and νs(COO−)] of the COO− group helped to elucidate the complex’s structure.35 Deacon and Phillips (1980) studied the criteria that can be used to distinguish between the three binding states of the carboxylate complexes.36 These criteria are as follows: (a) Δν>200 cm−1 (where Δν = [νas(COO−)–νs(COO−)]) found in the case of monodentate carboxylate complexes; (b) bidentate or chelating carboxylate complexes exhibit Δν significantly smaller than ionic values (Δν<100 cm−1); and (c) bridging complexes show Δν comparable to ionic values (Δν ~150 cm−1). Therefore, the difference value Δν is a useful characteristic for determining the coordination mode of the carboxylate group of the ligands. The observed Δν of the vanadyl (IV) folate complex was 104 cm−1, indicative of a bidentate coordination mode.35 The spectrum of FAH2 showed a sharp absorption band at 1,607 cm−1 that was assigned to δ(NH2). This peak was also found in the spectrum of the vanadyl (IV) complex without any change, suggesting that the NH2 group is not involved in the coordination. The presence of H2O molecules in this complex was evidenced by the presence of a broad band with strong intensity at the 3,360 cm−1, which was attributed to the ν(O–H) stretching vibration of H2O molecules.35 The oxovanadium (IV) folate complex had a new band at 1,115 cm−1 due to the ν(V=O) stretching vibration motion, which agreed with the known values of other vanadyl complexes.35 The analytical and spectroscopic data obtained for the vanadyl (IV) folate complex conformed to its proposed stoichiometric formulations (Figure 3).
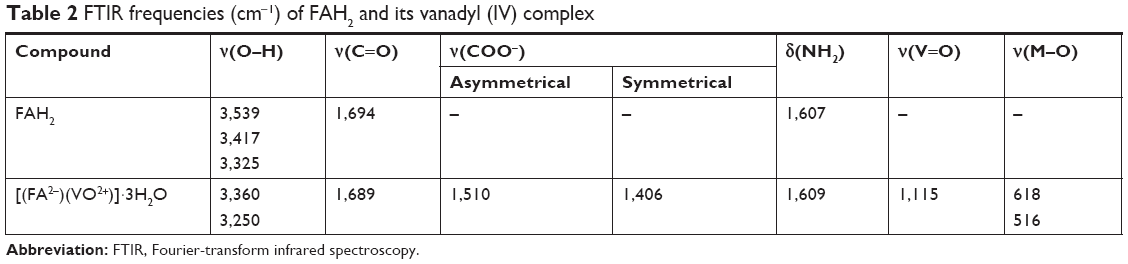 | Table 2 FTIR frequencies (cm−1) of FAH2 and its vanadyl (IV) complex |
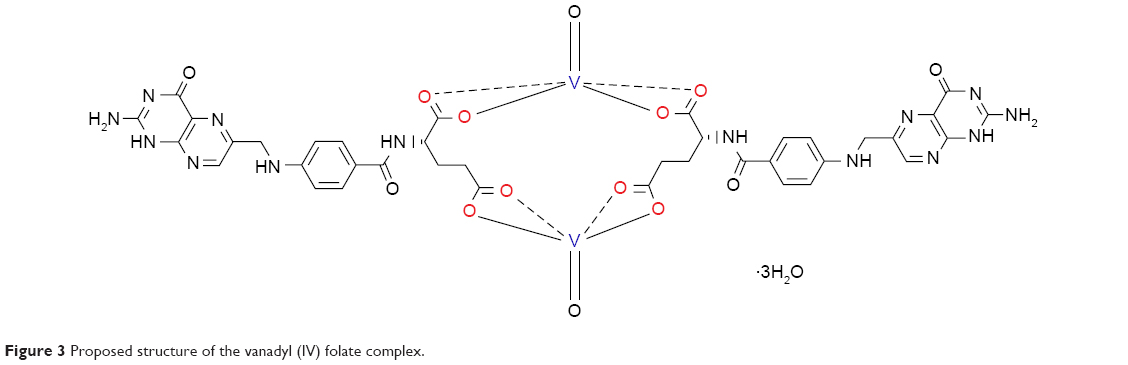 | Figure 3 Proposed structure of the vanadyl (IV) folate complex. |
Thermal analysis and kinetic thermodynamic studies
The thermal stability of the solid [(FA2−)(VO2+)]·3H2O complex was studied using thermogravimetric (TG), differential thermogravimetric, and DTA analyses from room temperature to 800°C under atmospheric nitrogen. The TG curve was redrawn as the mg mass loss against temperature and the DTA curve was redrawn as the rate of mass loss against temperature. The thermoanalytical results are summarized in Table 3. The thermal decomposition of [(FA2−)(VO2+)]·3H2O complex occurred in three steps. First, degradation took place at 42°C–177°C at DTGmax =105°C and DTA =175°C (endo), with loss of three H2O molecules; its observed weight was 5.39% and calculated weight 5.06%. The second step was at 178°C–384°C at DTGmax =294°C and DTA =203°C–224°C (endo) and 247°C (exo), with loss of C12H6N6O2 (organic moiety); its observed weight was 24.70% and calculated weight 24.95%. The third step occurred at 385°C–718°C at DTGmax =551°C and DTA =557°C (endo), with loss of C26H28N8O12 (organic moiety); its observed weight was 60.46% and calculated weight 60.41%. The vanadium metal was the final residue and remained stable until 800°C.
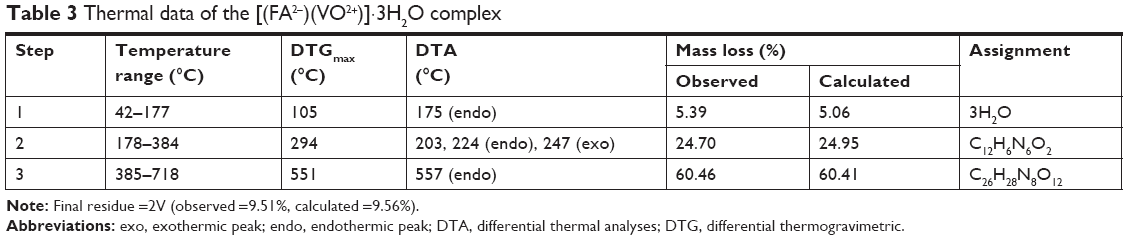 | Table 3 Thermal data of the [(FA2−)(VO2+)]·3H2O complex |
The kinetic parameters, such as activation (ΔE*), (ΔH*), (ΔS*), and (ΔG*), were evaluated graphically by employing the Coats–Redfern and Horowitz–Metzger relations.37,38 The calculated values of ΔE*, ΔA*, ΔS*, ΔH*, and ΔG* for the decomposition steps of the [(FA2−)(VO2+)]·3H2O complex are given in Table 4. The most interesting result was the considerable thermal stability of the complex, reflected in the high ΔE* values of the decomposition. The second essential result was that the ΔS* values for the formation of the activated complex were, in most cases, negative, suggesting that the thermodynamic behavior of the vanadyl (IV) complex is non-spontaneous (more ordered). Also, the thermodynamic behavior of this complex was endothermic (ΔH*>0) and endergonic (ΔG*>0) during the reaction. The thermodynamic data obtained from the two methods were in harmony with each other and the correlation coefficient from the Arrhenius plots of the thermal decomposition was ~0.99 and thus described a good linear fit.
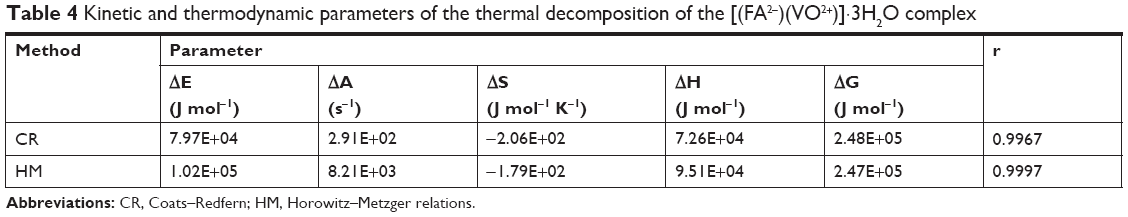 | Table 4 Kinetic and thermodynamic parameters of the thermal decomposition of the [(FA2−)(VO2+)]·3H2O complex |
Morphological studies (XRD, SEM, and TEM)
Nanoparticles of the [(FA2−)(VO2+)]·3H2O complex were generated and characterized by XRD at 2θ =4°–80°, SEM, and TEM. The XRD analysis showed that the vanadyl (IV) folate complex was pure with good crystalline nature as no characteristic impurity peaks were present. The XRD pattern of the [(FA2−)(VO2+)]·3H2O complex (Figure 4) revealed the presence of peaks characteristic of vanadium (41.61, 60.72, and 69.53) in accordance with JCPDS File 22–1,058,39 and FAH2 (14.99, 16.68, 17.99, 20.43, 21.35, 22.67, 26.80, 28.09, 36.54, 38.61, 52.85, and 56.41),40 in the range 2θ =4–80. The crystallite size of the vanadyl (IV) folate complex was calculated using Sherrer formula.41 The particle size of the complex was calculated from the highest diffraction peak at 20.43°. The XRD pattern of the vanadyl (IV) folate complex was indicative of nanocrystalline (6.0 nm) behavior.
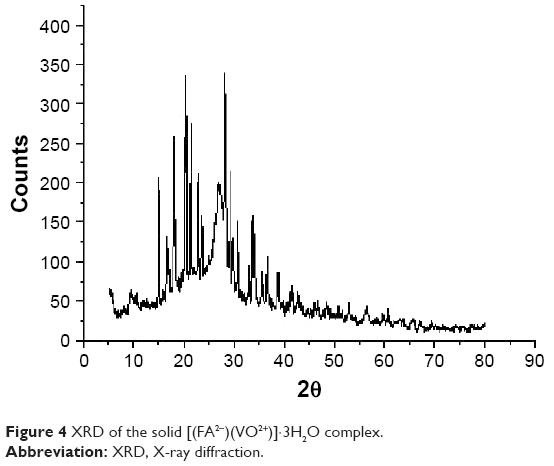 | Figure 4 XRD of the solid [(FA2−)(VO2+)]·3H2O complex. |
In order to collect more information about the particle size and surface morphology of the isolated solid [(FA2−)(VO2+)]·3H2O complex, SEM and TEM analyses were performed. The SEM and TEM images revealed that the solid dark yellow complex was aggregated into slices with a flower-like shape ranging in size between 5 and 100 nm and no well-defined particles (Figure 5). Increasing the magnification did not provide better differentiation of the particles (Figure 5A). The TEM images confirmed that the [(FA2−)(VO2+)]·3H2O particles were irregular in shape and 5–100 nm in size (Figure 5B).
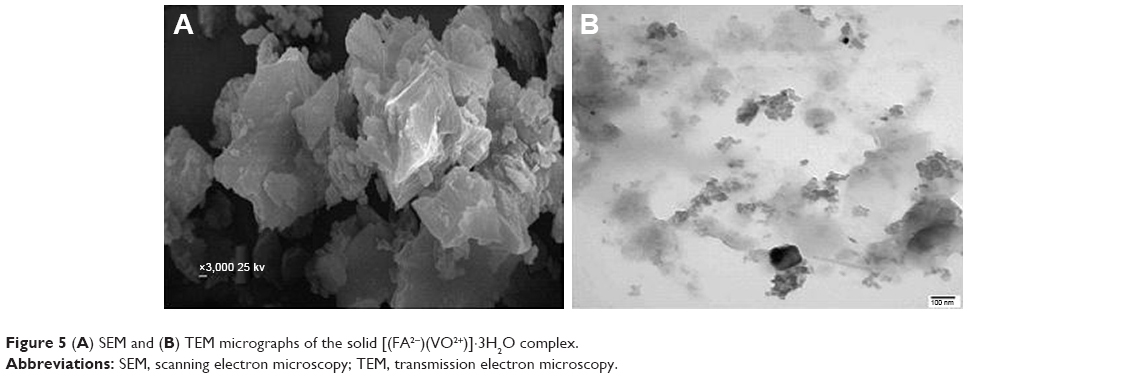 | Figure 5 (A) SEM and (B) TEM micrographs of the solid [(FA2−)(VO2+)]·3H2O complex. |
Biological effects of vanadyl (IV) folate complex in vivo
Insulin and blood glucose levels
The insulin and blood glucose levels of the different experimental groups are presented in Table 5. As expected, induction of diabetes using STZ significantly decreased the amount of insulin present in the blood from 57.64±1.76 IU/mL (Group I) to 23.78±2.50 IU/mL (Group II) (P≤0.05). Administration of vanadyl (IV) sulfate (Group III) and FAH2 vanadyl (IV) complex (Group IV) to the diabetic animals elicited significant changes to their insulin levels. Compared to Group II, the insulin levels in Group III increased to 41.44±1.23 IU/mL (P≤0.05) and Group IV to 44.87±1.61 IU/mL (P≤0.05).
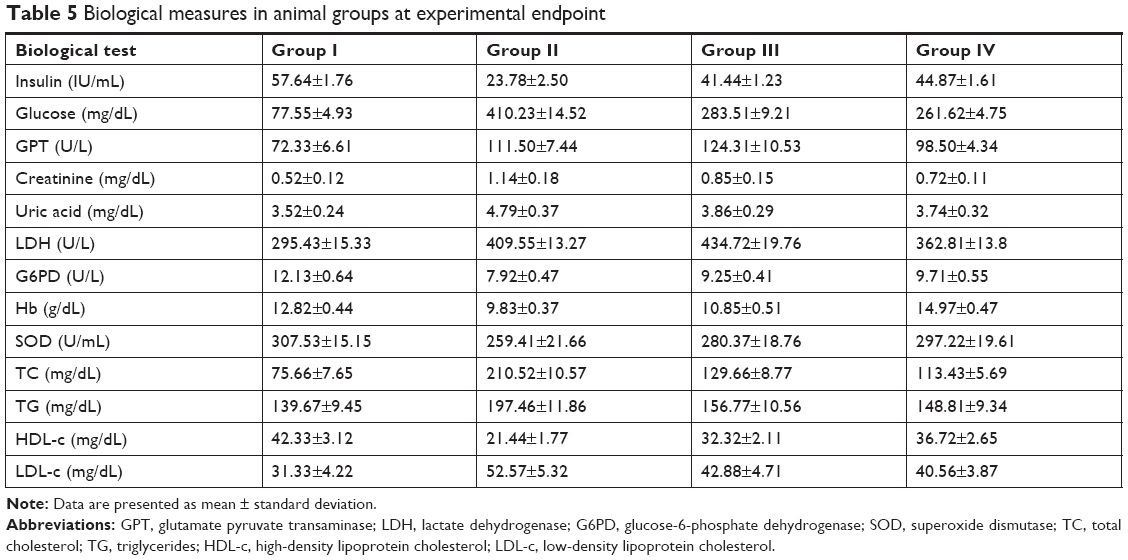 | Table 5 Biological measures in animal groups at experimental endpoint |
The glucose concentration in the blood of the diabetic animals (Group II: 410.23±14.52 mg/dL) was significantly higher (P≤0.05) than the healthy controls (Group I: 77.55±4.93 mg/dL), thus confirming the efficacy of this disease model. Compared to Group II, the blood glucose levels decreased significantly in the animals treated with vanadyl (IV) sulfate alone (Group III: P≤0.05) and the FAH2 vanadyl (IV) complex (Group IV: P≤0.05). This decrease was slightly more pronounced in Group IV (261.62±4.75 mg/dL) and Group III (283.51±9.21 mg/dL). These data indicate that treatment with vanadyl (IV) sulfate alone and in complex with FAH2 effectively reduces blood glucose in vivo. These data align with previous reports that vanadyl salts mimic many of the metabolic actions of insulin both in vitro and in vivo and improve glycemic control in diabetes.42 This effect may be attributed to the insulin-like effect of vanadyl (IV) sulfate on various tissues including increasing glucose transport and metabolism in skeletal muscle, liver, and adipose tissue.42
Glutamate pyruvate transaminase (GPT) enzyme activity
Serum GPT is the major enzyme used in the determination of liver function since it is released upon liver cell damage.43 The activity of the GPT enzyme in the different experimental groups is presented in Table 5. The results indicated that the injection of vanadyl (IV) sulfate alone slightly increased the activity of the GPT enzyme from 111.50±7.44 U/L in Group II to 124.31±10.53 U/L in Group III, while the injection of the vanadyl (IV) complex decreased the serum GPT activity in Group IV to 98.50±4.34 U/L. These results indicate that treatment with vanadyl (IV) complex had little effect on liver cells compared to Group II, which had much higher levels than Group I, 72.33±6.61 U/L. Taken together, these data suggest that the vanadyl (IV) complex is less toxic than vanadyl (IV) sulfate alone.
Creatinine and uric acid levels
Serum creatinine is an important measure of the viability and health of the kidney: increasing creatinine levels are highly indicative of kidney failure,44 and this parameter is highly elevated in diabetics.44 According to the results shown in Table 5, the treatment of diabetic rats with vanadyl (IV) sulfate alone and vanadyl (IV) complex decreased creatinine levels compared to untreated diabetic rats. This was particularly pronounced in Group IV where the serum creatinine decreased to 0.72±0.11 mg/dL from 1.14±0.18 mg/dL in Group II. These data indicate that the vanadyl (IV) complex had no major effect on kidney tissues in vivo and greatly improved kidney function, which confirms the ameliorating effect of vanadyl (IV) complex on kidney functions.
The increased value of uric acid (hyperuricemia) that was observed in diabetic rats in this study compared to the healthy control coincides with a previous report.45 Uric acid levels decreased with the treatment of the vanadyl (IV) complex, particularly in Group IV where the uric acid decreased by 22% relative to Group II. This reduction can be explained by the inhibition of oxidative phosphorylation, which leads to a decrease in protein synthesis.44
LDH and G6PD activities
LDH is used as a marker of tissue breakdown as this enzyme is abundant in red blood cells and is released upon hemolysis.46 The activity of the LDH enzyme in the different experimental groups is presented in Table 5. In general, the activity of serum LDH in the diabetic animals (Group II) was significantly increased compared to the healthy control group (Group I). The administration of vanadyl (IV) complex (Group IV) elicited a significant 11.50% decrease in LDH activity compared to Group II. The increased LDH activity in this animal model of diabetes is mainly due to the leakage of LDH into the blood caused by STZ toxicity in the liver. Our findings are similar to Ashakiran et al (2010), who reported the same response in alloxan-induced diabetic mice.46
G6PD is the principal source of the intracellular reductant NADPH, which is required by many enzymes including those of the antioxidant pathway.46 The level of G6PD decreased in all of the diabetic animals as compared to the healthy control (Table 5), as has been previously reported.46 Treatment with vanadyl (IV) complex (Group IV) significantly increased G6PD activity relative to the diabetic group (Group II).
Hb levels
The levels of Hb in the different experimental groups are presented in Table 5. Results indicated that the level of Hb decreased in diabetic rats (Group II) compared to the healthy animals (Group I). The reduction of Hb and the ensuing anemia associated with diabetes is mainly due to the increased non-enzymatic glycosylation of red blood cell membrane proteins.47 The administration of vanadyl (IV) complex countered the increase in Hb at the study’s 30-day endpoint (Group IV) compared to the untreated diabetic group. Furthermore, Group IV showed a significant 14.36% increase compared to Group I. These data confirm previous determinations of minimal toxicity induced by vanadyl (IV) complex in vivo.
Superoxide dismutase enzyme (SOD) activity
SOD is a major component of the antioxidant system that neutralizes superoxide radicals by converting them into H2O2 and molecular oxygen. SOD activity is low in diabetes,48 and this reduced activity could be due to its degradation or inhibition as a result of the increased free radical production. Our results indicated that SOD is significantly decreased in the diabetic animals (Group II) compared to the healthy ones (Group I) while there was a slight decrease in the diabetic group treated with the vanadyl (IV) complex (Table 5). The increased SOD activity induced by vanadyl (IV) complex treatment would help manage the effects of the elevated free radicals associated with diabetes.
Lipid profile
The levels of total cholesterol (TC), triglycerides (TG), HDL-c, and LDL-c are presented in Table 5. The results indicate that the levels of TC, TG, and LDL-c were significantly increased in the STZ-induced diabetic animals (Group II) compared to Group I. This is in contrast to data published by Bolkent et al,1 which showed a reduction in serum HDL-c levels in STZ-induced diabetic animals.49 High levels of serum lipids in diabetes are mainly caused by the increased mobilization of free fatty acids from their peripheral stores because insulin inhibits hormone-sensitive lipases. The present study showed that the administration of the vanadyl (IV) complex led to significant improvements in the lipid metabolism parameters: TC, TG, and LDL-c were significantly decreased while HDL-c levels were significantly increased. This mechanism can be discussed as vanadyl (IV) sulfate exerts its cholesterol-lowering effect seems to be a decrease in choabsorption from the intestine, by binding to bile in the intestine and increasing its excretion.49 However, vanadyl (IV) sulfate also decreases cholesterol biosynthesis, specifically by reducing3-hydroxy-3-methylglutaryl-CoA reductase activity, a key enzyme in cholesterol biosynthesis, and/or by reducing the NADPH required for fatty acid and cholesterol biosynthesis. In addition, vanadyl may improve hypercholesterolemia by modulating lipoprotein metabolism: enhancing LDL uptake by increasing LDL receptor expression49 and/or by increasing lecithin cholesterol acyltransferase activity.50 Overall, these results indicate that treatment with the complex developed in this study could help combat the diverse metabolic issues associated with diabetes beyond glucose metabolism.
Histopathology of pancreas
Photomicrograph of pancreatic tissue (Figure 6) from a diabetic rat treated with the [(FA2−)(VO2+)]·3H2O complex showed a moderate increase in the size of the islets of Langerhans (↕) surrounded by healthy pancreatic acini (H&E stain 400×).
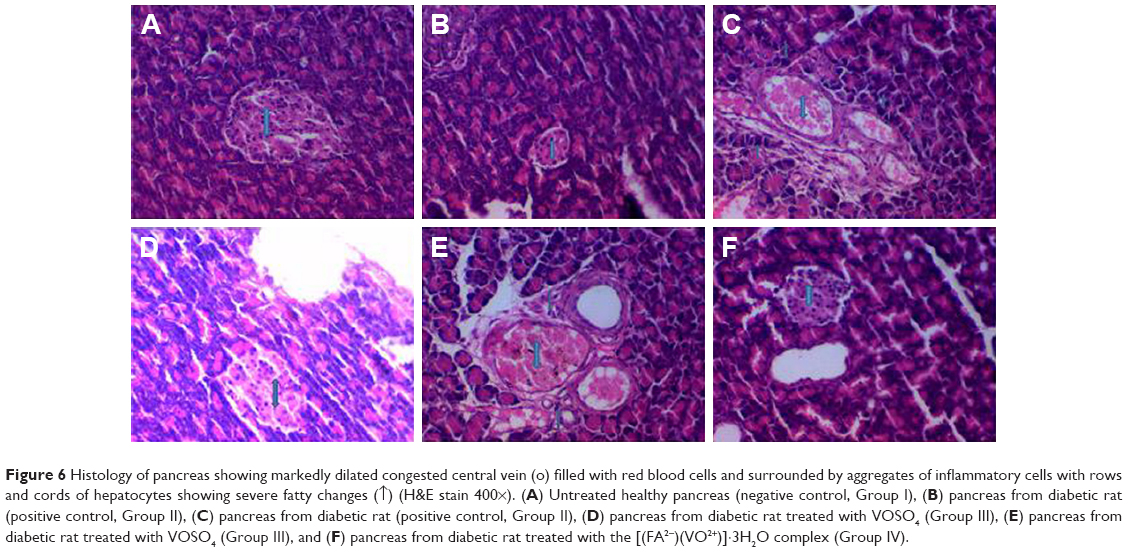 | Figure 6 Histology of pancreas showing markedly dilated congested central vein (o) filled with red blood cells and surrounded by aggregates of inflammatory cells with rows and cords of hepatocytes showing severe fatty changes (↑) (H&E stain 400×). (A) Untreated healthy pancreas (negative control, Group I), (B) pancreas from diabetic rat (positive control, Group II), (C) pancreas from diabetic rat (positive control, Group II), (D) pancreas from diabetic rat treated with VOSO4 (Group III), (E) pancreas from diabetic rat treated with VOSO4 (Group III), and (F) pancreas from diabetic rat treated with the [(FA2−)(VO2+)]·3H2O complex (Group IV). |
Histopathology of liver
Photomicrograph of liver tissue (Figure 7) from a diabetic rat showing markedly dilated congested central vein (↕) filled with red blood cells and surrounded by aggregates of inflammatory cells with rows and cords of hepatocytes showing severe fatty changes (↑) (H&E stain 400×).
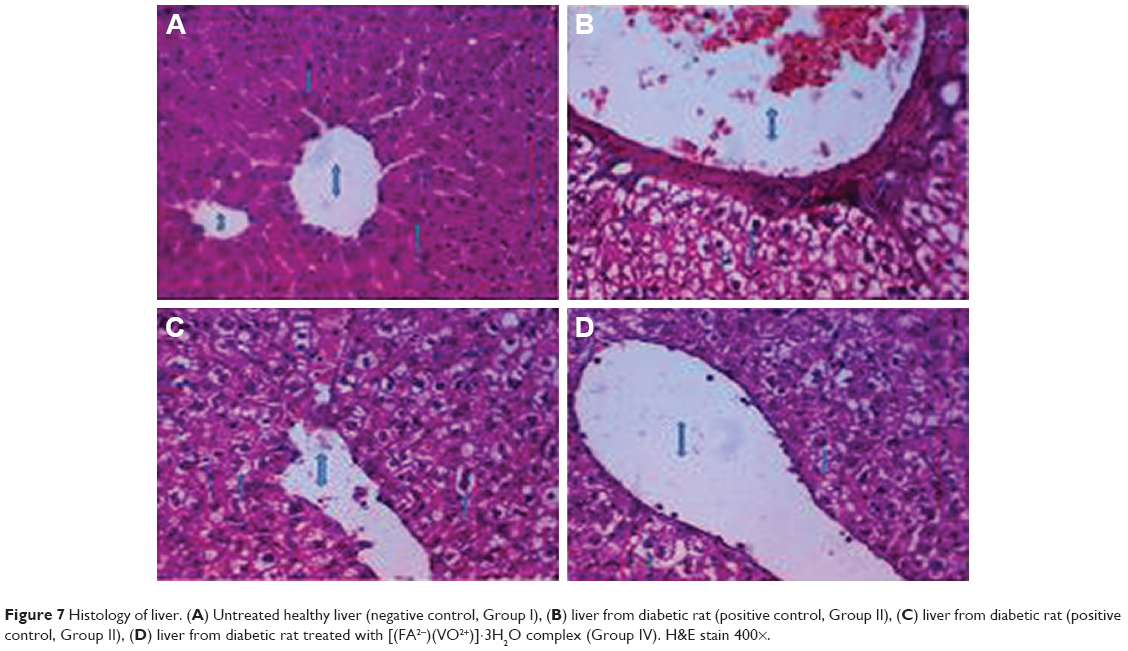 | Figure 7 Histology of liver. (A) Untreated healthy liver (negative control, Group I), (B) liver from diabetic rat (positive control, Group II), (C) liver from diabetic rat (positive control, Group II), (D) liver from diabetic rat treated with [(FA2−)(VO2+)]·3H2O complex (Group IV). H&E stain 400×. |
Conclusion
In conclusion, the study demonstrated the synthesis of a new antidiabetic compound that consists of vanadyl (IV) sulfate and folic acid in a 1:1 molar ratio and molecular formula [(FA2−)(VO2+)]·3H2O. These characteristics of this compound were discussed based on spectroscopic techniques like FTIR, UV–Vis, and ESR. The results confirmed that high dose of vanadyl (IV) folate compound is more effective and safer for the treatment of hyperglycemia and oxidative stress that resulted from the induction of diabetes mellitus by STZ; a high synergistic effect was observed between folate and vanadyl. Therefore, this compound has been proved be a highly effective antidiabetic drug model. Therefore, this study is aimed to designed a novel vanadyl (IV) complexity and determine the effectiveness of this complex on pancreas structural alterations which induced by STZ.
Acknowledgments
The authors would like to extend their sincere appreciation to the Deanship of Scientific Research at King Saud University for funding this research through the Research Group (No: RG-1436-015).
Disclosure
The authors report no conflicts of interest in this work.
References
Bolkent S, Bolkent S, Yanardag R, et al. Protective effect of vanadyl sulfate on the pancreas of streptozotocin-induced diabetic rats. Diabetes Res Clin Pract. 2005;70:103–109. doi:10.1016/j.diabres.2005.02.003 | ||
Cam MC, Rodrigues B, McNeill JH. Distinct glucose lowering and beta cell protective effects of vanadium and food restriction in streptozotocin-diabetes. Eur J Endocrinol. 1999;141:546–554. doi:10.1530/eje.0.1410546 | ||
Zhang H, Yi Y, Feng D, Wang Y, Qin S. Hypoglycemic properties of oxovanadium (IV) coordination compounds with carboxymethyl-carrageenan and carboxymethyl-chitosan in alloxan-induced diabetic mice. Evid Based Complement Altern Med. 2011;2011:Article ID 691067, 1–7. doi:10.1155/2011/691067 | ||
Cusi K, Cukier S, DeFronzo RA, et al. Vanadyl sulfate improves hepatic and muscle insulin sensitivity in type 2 diabetes. J Clin Endocrinol Metab. 2001;86(3):1410–1417. doi:10.1210/jcem.86.3.7337 | ||
Thompson KH, McNeill JH, Orvig C. Vanadium compounds as insulin mimics. Chem Rev. 1999;99:2561–2572. | ||
Thompson KH, Orvig C. Coordination chemistry of vanadium in metallopharmaceutical candidate compounds. Coord Chem Rev. 2001;219–221:1033. doi:10.1016/S0010-8545(01)00395-2 | ||
Chan SY, Ou SM, Chen YT, et al. Effects of DPP-4 inhibitors on cardiovascular outcomes in patients with type 2 diabetes and end-stage renal disease. Int J Cardiol. 2016;218:170–175. doi:10.1016/j.ijcard.2016.05.062 | ||
King H, Aubert RE, Herman WH. Global burden of diabetes, 1995–2025: prevalence, numerical estimates, and projections. Diabetes Care. 1998;21:1414–1431. | ||
de la Monte SM. Relationships between diabetes and cognitive impairment. Endocrinol Metab Clin N Am. 2014;43(1):245–267. doi:10.1016/j.ecl.2013.09.006 | ||
Harper E, Forde H, Davenport C, Rochfort KD, Smith D, Cummins PM. Vascular calcification in type-2 diabetes and cardiovascular disease: integrative roles for OPG, RANKL and TRAIL. Vascul Pharmacol. 2016;82:30–40. doi:10.1016/j.vph.2016.02.003 | ||
Ibrahim MA, Habila JD, Koorbanally NA, Islam MS. Butanol fraction of Parkia biglobosa (Jacq.) G. Don leaves enhance pancreatic β-cell functions, stimulates insulin secretion and ameliorates other type 2 diabetes-associated complications in rats. J Ethnopharmacol. 2016;183:103–111. doi:10.1016/j.jep.2016.02.018 | ||
Bhowmik D, Chiranjib B, Yadav J, et al. Role of community pharmacist in management and prevention diabetic foot ulcer and infections. J Chem Pharm Res. 2009;1(1):38–53. | ||
Fang S. Folic acid and its analysis method. J Wuhan Polytechnic Univ. 2001;1:8–11. | ||
Mitchell HK, Snell EE, Williams RJ. The concentration of “folic acid”. J Am Chem Soc. 1941;63:2284. doi:10.1021/ja01853a512 | ||
Lopera SMC, Guzmán CO, Cataño CR, et al. Development and characterization of folic acid microparticles formed by spray-drying with gum arabic and maltodextrin. Vitae. 2009;16(1):55–65. | ||
Bakhshi PK, Nangrejo MR, Stride E, Edirisinghe M. Application of electrohydrodynamic technology for folic acid encapsulation. Food and Bioproc Tech. 2013;6(7):1837–1846. doi:10.1007/s11947-012-0843-4 | ||
Fox JT, Stover PJ. Folate-mediated one-carbon metabolism. Vitam Horm. 2008;79:1–44. doi:10.1016/S0083-6729(08)00401-9 | ||
He Z. Human Nutritional Science. Beijing: People Medical Publishing House; 1988:200–207. | ||
Liu Z, Yu S. Nutrition and Food Hygiene. Beijing: People Medical Publishing House; 1993:75–76. | ||
Mastroiacovo P, Leoncini E. More folic acid, the five questions: why, who, when, how much, and how. Biofactors. 2011;37:272–279. doi:10.1002/biof.172 | ||
Liang L, Zhang J, Zhou P, Subirade M. Protective effect of ligand-binding proteins against folic acid loss due to photodecomposition. Food Chem. 2013;141(2):754–761. doi:10.1016/j.foodchem.2013.03.044 | ||
Cagnacci A, Bagni B, Zini A. Relation of folates, vitamin B12 and homocysteine to vertebral bone mineral density change in postmenopausal women. A five-year longitudinal evaluation. Bone. 2008;42:314–320. doi:10.1016/j.bone.2007.10.022 | ||
Morris MS, Jacques PF, Selhub J. Relation between homocysteine and B-vitamin status indicators and bone mineral density in older Americans. Bone. 2005;37:234–242. doi:10.1016/j.bone.2005.04.017 | ||
Hounsom L, Horrobin D, Tritschler H. A lipoic acid-gamma linolenic acid conjugate is effective against multiple indices of experimental diabetic neuropathy. Diabetologia. 1998;41(7):839–843. doi:10.1007/s001250050996 | ||
Hussain AM. The relationship between diabetes mellitus and periodontitis. Am En J Med Sci. 2011;4(1):84–86. | ||
Hajduch E, Darakhshan F, Hundal H. Fructose uptake in rat adipocytes: GLUT5 expression and the effects of streptozotocin-induced diabetes. Diabetologia. 1998;41(7):821–828. doi:10.1007/s001250050993 | ||
Siddiqui MR, Taha A, Moorthy K. Amelioration of altered antioxidants status and membrane linked functions by vanadium and Trigonella in alloxan diabetic rat brains. J Biosci. 2005;30(4):101–108. doi:10.1007/BF02703722 | ||
Sanford HS. Method for obtaining venous blood from orbital sinus of the rat or mouse. Science. 1954;119:100. doi:10.1126/science.119.3102.849 | ||
Woodhead O, Otton P, Spake L. Radioimmunoassay of insulin. Clin Pharmacol. 1974;21:11–15. | ||
Carleton HM. Carleton’s Histological Technique. 4th ed. London, New York, Toronto: Oxford University Press; 1967. | ||
Snedecor GW, Cochran WG. Statistical Methods. 8th ed. Ames Iowa State University; 1982. | ||
Geary WJ. The use of conductivity measurements in organic solvents for the characterisation of coordination compounds. Coord Chem Rev. 1971;7:81–122. doi:10.1016/S0010-8545(00)80009-0 | ||
Lever ABP. Inorganic Electronic Spectroscopy. Amsterdam, The Netherlands: Elsevier; 1986. | ||
Uivarosi V, Barbuceanu SF, Aldea V, et al. Synthesis, spectral and thermal studies of new rutin vanadyl complexes. Molecules. 2010;15:1578–1589. doi:10.3390/molecules15031578 | ||
El-Wahed MGA, Refat MS, El-Megharbel SM. Synthesis, spectroscopic and thermal characterization of some transition metal complexes of folic acid. SpectrochimicaActa A. 2008;70(4):916–922. doi:10.1016/j.saa.2007.10.008 | ||
Deacon GB, Phillips RJ. Relationships between the carbon-oxygen stretching frequencies of carboxylato complexes and the type of carboxylate coordination. Coord Chem Rev. 1980;33:227–250. doi:10.1016/S0010-8545(00)80455-5 | ||
Horowitz HW, Metzger G. A new analysis of thermogravimetric traces. Anal Chem. 1963;35:1464–1468. doi:10.1021/ac60203a013 | ||
Coats AW, Redfern JP. Kinetic parameters from thermogravimetric data. Nature. 1964;201:68–69. doi:10.1038/201068a0 | ||
Miyauchi A, Okabe TH. Production of metallic vanadium by preform reduction process. Mate Trans. 2010;51(6):1102–1108. doi:10.2320/matertrans.M2010027 | ||
Motkar G, Lonare M, Patil O, et al. Self-assembly of folic acid in aqueous media. AIChE J. 2013;59(4):1360–1368. doi:10.1002/aic.14066 | ||
Cullity BD. Elements of X-Ray Diffraction. Massachusetts: Addison-Wesley Publication Company; 1978. | ||
Bolkent S, Yanardag R, Tunali S. Protective effect of vanadyl sulfate on the pancreas of streptozotocin-induced diabetic rats. Diabetes Res ClinPract. 2005;70:103–109. doi:10.1016/j.diabres.2005.02.003 | ||
Braunwald. Evaluation of liver function. In: Braunwald E, et al., editor. Harrison’s Principles of Internal Medicine. New York: McGraw-Hill; 2001:1711–1715. | ||
Ganong W. Review of Medical Physiology, Lange Medical Books. Vol. 13. New York: McGraw-Hill; 2003:912–978. | ||
Edwards NL. Crystal deposition diseases. In: Goldman L, Schafer AI, editors. Cecil Medicine. 24th ed. Philadelphia (PA): Saunders Elsevier; 2011:281–284. | ||
Ashakiran S, Krishnamurthy N, Navin S, et al. Behaviour of serum uric acid and lipid profile in relation to glycemic status in proliferative and non-proliferative diabetic retinopathy. Curr Neurobiol. 2010;2(1):57–61. | ||
Gad ZM, Ehssan AN, Ghiet HM, et al. Effects of pioglitazone and metformin on carbohydrate metabolism in experimental models of glucose intolerance. Int J Diabetes Metab. 2010;18:132–138. | ||
Szkudelski T. The mechanism of alloxan and streptozotocin action in B cells of the rat pancreas. Physiol Res. 2001;50:536–546. | ||
Rajasekaran S, Sivagnanam K, Subramanian S. Mineral contents of Aloe vera leaf gel and their role on streptozotocin-induced diabetic rats. Pharmacology. 2005;57:185–195. | ||
Tunali S, Yanardag R. Effect of vanadyl sulfate on the status of lipid parameters and on stomach and spleen tissues of streptozotocin-induced diabetic rats. Pharm Res. 2006;53:271–277. doi:10.1016/j.phrs.2005.12.004 |
 © 2019 The Author(s). This work is published and licensed by Dove Medical Press Limited. The full terms of this license are available at https://www.dovepress.com/terms.php and incorporate the Creative Commons Attribution - Non Commercial (unported, v3.0) License.
By accessing the work you hereby accept the Terms. Non-commercial uses of the work are permitted without any further permission from Dove Medical Press Limited, provided the work is properly attributed. For permission for commercial use of this work, please see paragraphs 4.2 and 5 of our Terms.
© 2019 The Author(s). This work is published and licensed by Dove Medical Press Limited. The full terms of this license are available at https://www.dovepress.com/terms.php and incorporate the Creative Commons Attribution - Non Commercial (unported, v3.0) License.
By accessing the work you hereby accept the Terms. Non-commercial uses of the work are permitted without any further permission from Dove Medical Press Limited, provided the work is properly attributed. For permission for commercial use of this work, please see paragraphs 4.2 and 5 of our Terms.